Anderson et al. v. Raffensperger et al., Case No. 1:20-cv-03263-MLB
←
→
Page content transcription
If your browser does not render page correctly, please read the page content below
Case 1:20-cv-03263-MLB Document 93-61 Filed 09/01/20 Page 2 of 77

                         August 31, 2020

Anderson et al. v. Raffensperger et al., Case No. 1:20-cv-03263-MLB

               United States District Court for the
                 Northern District of Georgia

             Expert Report of Jonathan Rodden, PhD

                      737 Mayfield Avenue
                       Stanford, CA 94305

                  __________________________
                      Jonathan Rodden, PhD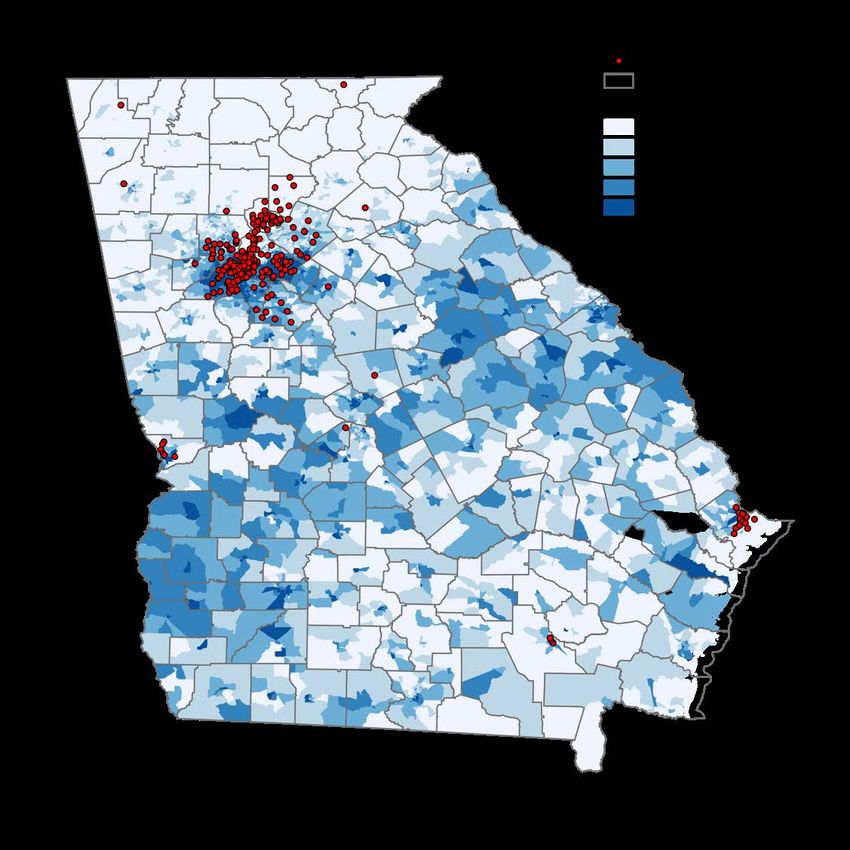
Case 1:20-cv-03263-MLB Document 93-61 Filed 09/01/20 Page 3 of 77

                     I.     INTRODUCTION AND SUMMARY

      I have been asked by Plaintiffs in this case to assess the costs associated with

long lines at polling places in Georgia elections. Specifically, I have been asked to

first convey the most important insights from the academic literature on the costs

and benefits of voting, with special attention to the problem of long lines for in-

person voting, and then, to examine the extent to which these insights apply to the

experience of Georgia voters in recent years. My analysis of the long lines addresses

three questions inspired by the broader literature: First, to what extent has the burden

of long lines fallen disproportionately on minority communities? Second, to what

extend does the structure of polling places and precincts appear to have been

responsible for the problem? Third, is there evidence that long lines have a

discernable impact on turnout and confidence in elections? My key conclusions are

as follows:

   1. Long lines were concentrated in the Atlanta-area counties of Cobb, Clayton,

      Douglas, DeKalb, Forsyth, Fulton, Gwinnett, and Henry. Outside of Atlanta,

      the problems were concentrated in Chatham County, and to a lesser extent in

      Muscogee and Ware counties.

   2. Consistent with other studies of Georgia and beyond, and consistent with prior

      experience in Georgia, long lines on June 9, 2020 were disproportionately

      experienced by minority voters.
                                           2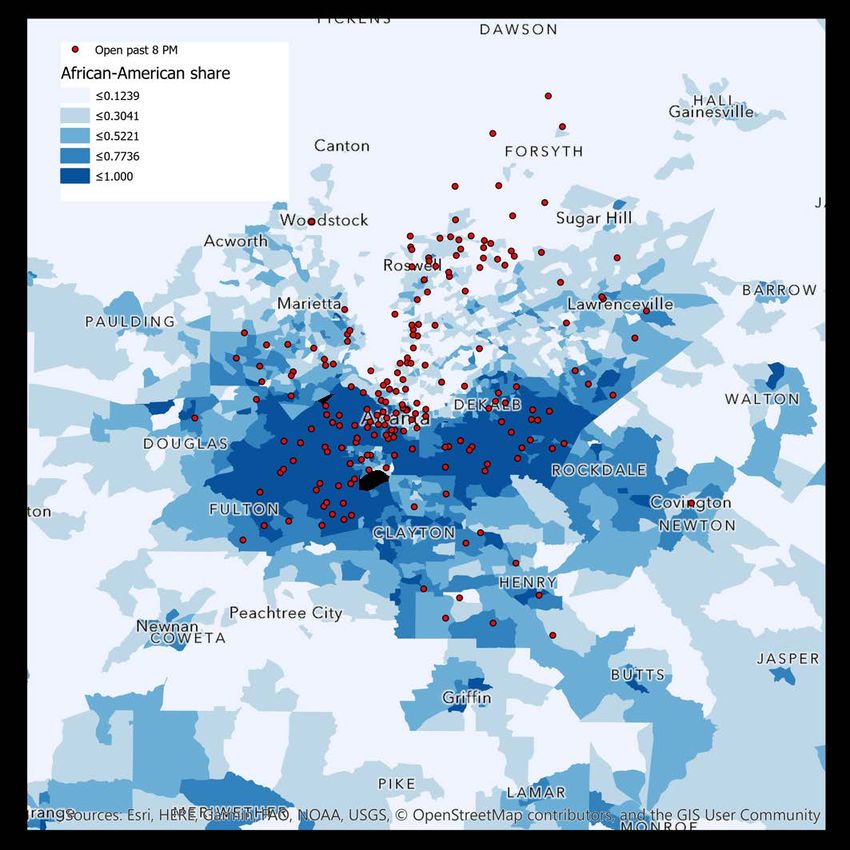
Case 1:20-cv-03263-MLB Document 93-61 Filed 09/01/20 Page 4 of 77

     o Among polling places where minorities made up over 90 percent of

        registered voters, 36 percent were forced to stay open over one hour

        past the specified closing time in order to accommodate long lines. In

        the Atlanta metro area, 45 percent of such polling places were forced to

        do so. Among polling places where whites made up over 90 percent of

        registered voters, less than 3 percent of polling places were required to

        stay open late in order to accommodate long lines.

     o In polling places where minorities constituted more than 90 percent of

        active registered voters, the average minimum wait time in the evening

        was 51 minutes. When whites constituted more than 90 percent of

        registered voters, the average was around six minutes.

     o Several metrics indicate that the prevalence of relatively serious polling

        place difficulties was more than three times greater in majority-

        minority polling places than in majority-white polling places.

3. Over the last decade, Georgia’s population has grown substantially—

  especially in the Atlanta metro area—while the number of polling places has

  not expanded. As a result, Georgia’s polling places serve unusually large

  numbers of voters, especially in minority communities. Problems with long

  lines were experienced disproportionately at polling places with large

  numbers of voters, especially those that serve multiple precincts.

                                     3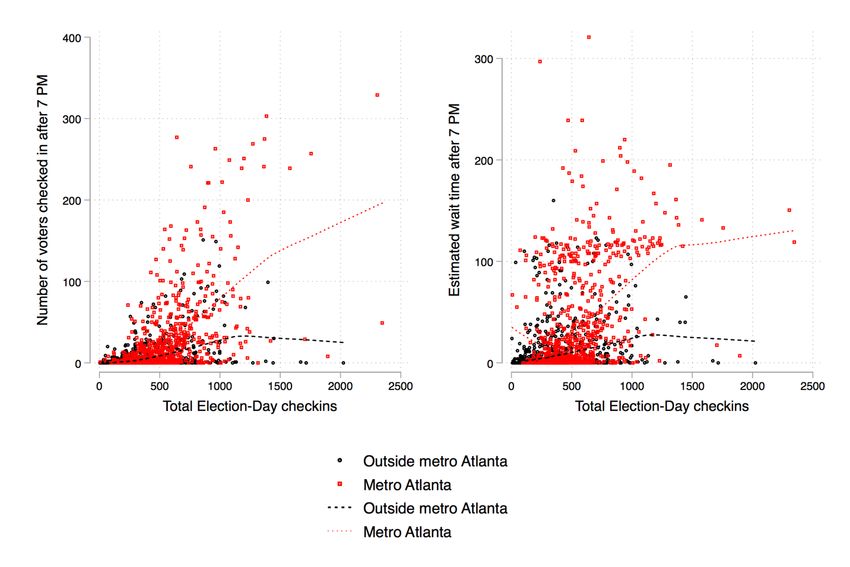
Case 1:20-cv-03263-MLB Document 93-61 Filed 09/01/20 Page 5 of 77

   o Of the 242 polling places that were still checking in voters at 8 PM,

      227 (94 percent) served numbers of active registered voters above the

      national average of 1,547, and 203 (84 percent) were above the Georgia

      median of 2,646 active registered voters. The vast majority of these

      troubled polling places were in the Atlanta metro area (83 percent).

   o Across all polling places in the State, the average minimum evening

      wait time was around four minutes for all of the precincts at or below

      the national average size of 1,547. For those above the statewide

      median, it was around 27 minutes. For those with more than 5,000

      active voters, it was around 50 minutes.

   o Polling locations that served multiple precincts rather than a single

      precinct clearly accounted for a large part of the problem in the June

      2020 Primary. Only 7 percent of the polling places that served a single

      precinct checked in voters after 8 PM, whereas of those serving

      multiple precincts, 52 percent did so. The average minimum wait time

      after 7 PM was around 12 minutes in single-precinct polling places, but

      it was one hour and nine minutes in the polling places that served

      multiple precincts.

                                  4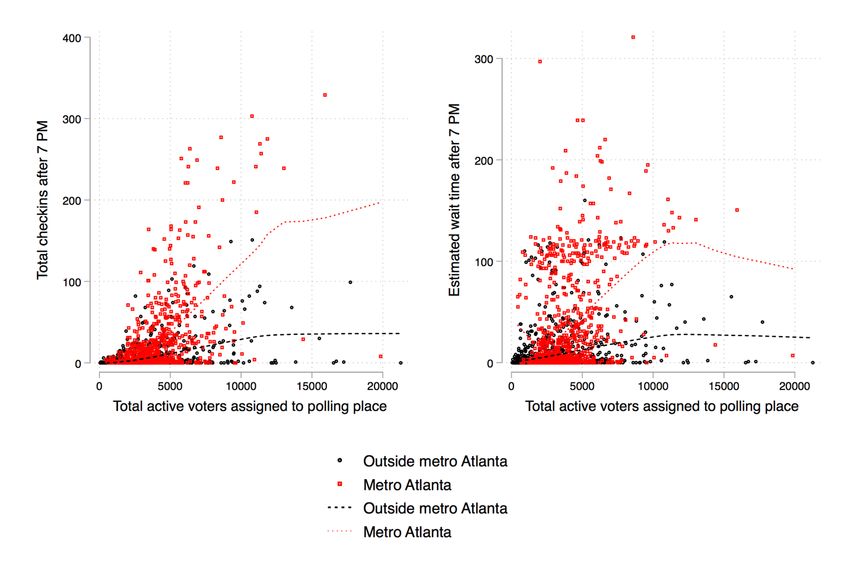
Case 1:20-cv-03263-MLB Document 93-61 Filed 09/01/20 Page 6 of 77

4. Minorities are more likely to live in polling places serving unusually large

   numbers of voters, especially in metro Atlanta, and more likely to live in

   polling places that serve multiple precincts.

5. Minority voters are far less likely than whites to make use of absentee voting,

   which places greater pressure on in-person voting locations in minority

   communities.

6. Minority voters are between three and four times more likely than whites to

   cast provisional ballots. Confusion surrounding provisional ballots can

   contribute to slowdowns at polling places.

7. Of all those who chose a Democratic ballot in the June 2020 Primary, 22

   percent lived in neighborhoods assigned to polling places that were open past

   8 PM, while 7.2 percent of those choosing a Republican ballot lived in such

   neighborhoods. Of those who lived in neighborhoods where the polling place

   was open past 8 PM, 75.4 percent voted in the Democratic Primary, while

   21.7 percent voted in the Republican Primary.

8. Academic studies have found evidence that long lines lead to lower turnout

   both in effected election and in future elections, as well as a loss of voter

   confidence in elections. Consistent with these studies, I find:

      o Turnout was lower by 2 percentage points in precincts that were open

         late relative to those that were not, and turnout was lower by five

                                       5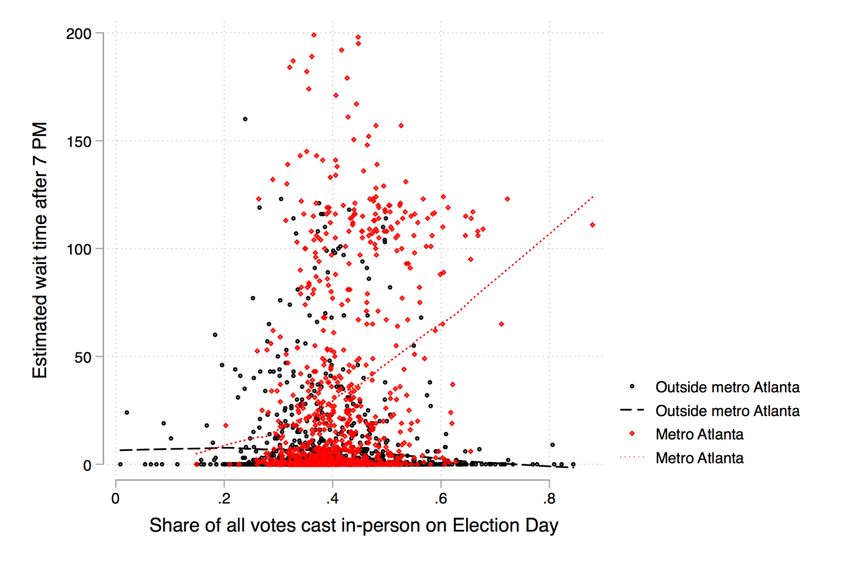
Case 1:20-cv-03263-MLB Document 93-61 Filed 09/01/20 Page 7 of 77

             percentage points in precincts that experienced wait times of over 50

             minutes than in precincts that experienced a wait time of less than five

             minutes.

         o In individual-level models that control for a host of demographic and

             geographic factors, the negative impact on turnout of living in a

             precinct with long lines was around 1.3 percentage points overall, and

             2 percentage points in the Atlanta metro area.

         o If we focus only on those with a past history of voting in primaries, the

             effect on turnout of living in a precinct with long lines is substantially

             larger: 2.9 percentage points in the state as a whole, 3.8 percentage

             points in metro Atlanta, and 1.9 percentage points outside of Atlanta.

                              II.   QUALIFICATIONS

      I am currently a tenured Professor of Political Science at Stanford University

and the founder and director of the Stanford Spatial Social Science Lab (“the

Lab”)—a center for research and teaching with a focus on the analysis of geo-spatial

data in the social sciences. In my affiliation with the Lab, I am engaged in a variety

of research projects involving large, fine-grained geo-spatial data sets including

ballots and election results at the level of polling places, individual records of

registered voters, census data, and survey responses. Prior to my employment at

Stanford, I was the Ford Professor of Political Science at the Massachusetts Institute

                                          6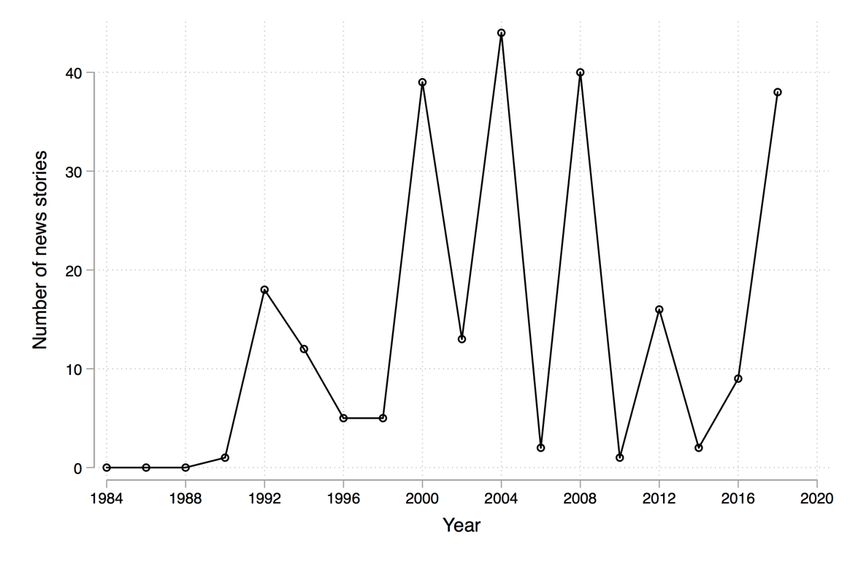
Case 1:20-cv-03263-MLB Document 93-61 Filed 09/01/20 Page 8 of 77

of Technology. I received my Ph.D. from Yale University and my B.A. from the

University of Michigan, Ann Arbor, both in political science. A copy of my current

C.V. is included as an Appendix to this report.

      In my current academic work, I conduct research on the relationship between

the patterns of political representation, geographic location of demographic and

partisan groups, and the drawing of electoral districts. I have published papers using

statistical methods to assess political geography, balloting, and representation in a

variety of academic journals including Proceedings of the National Academy of

Science, American Economic Review Papers and Proceedings, the Journal of

Economic Perspectives, the Virginia Law Review, the American Journal of Political

Science, the British Journal of Political Science, the Annual Review of Political

Science, and the Journal of Politics. One of these papers was recently selected by

the American Political Science Association as the winner of the Michael Wallerstein

Award for the best paper on political economy published in the last year, and another

received an award from the American Political Science Association section on social

networks.

      I have recently written a series of papers, along with my co-authors, using

automated redistricting algorithms to assess partisan gerrymandering. This work has

been published in the Quarterly Journal of Political Science, Election Law Journal,

and Political Analysis, and it has been featured in more popular publications like the

                                          7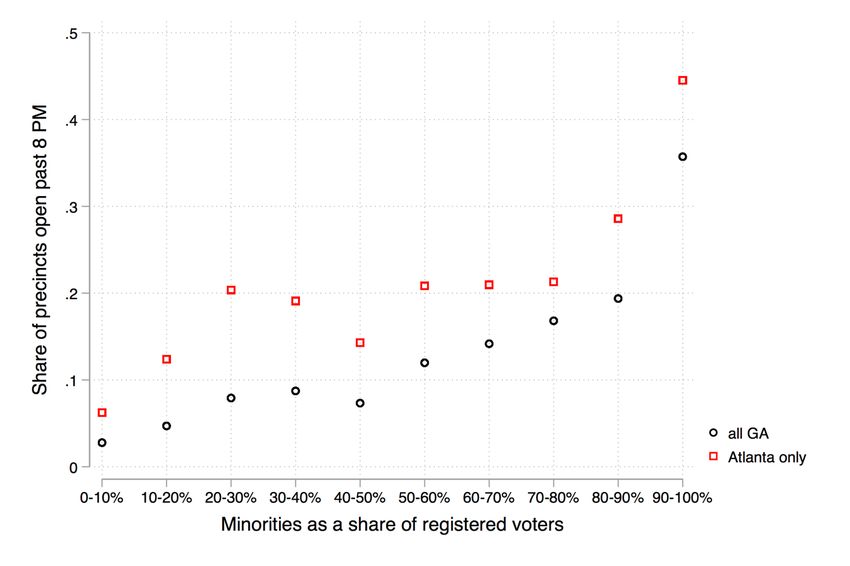
Case 1:20-cv-03263-MLB Document 93-61 Filed 09/01/20 Page 9 of 77

Wall Street Journal, the New York Times, and Boston Review. I have recently

completed a book, published by Basic Books in June of 2019, on the relationship

between political districts, the residential geography of social groups, and their

political representation in the United States and other countries that use winner-take-

all electoral districts. The book was reviewed in The New York Times, The New York

Review of Books, Wall Street Journal, The Economist, and The Atlantic, among

others.

          I have expertise in the use of large data sets and geographic information

systems (GIS), and conduct research and teaching in the area of applied statistics

related to elections. My PhD students frequently take academic and private sector

jobs as statisticians and data scientists. I frequently work with geo-coded voter files

and other large administrative data sets, including in recent paper published in the

Annals of Internal Medicine and The New England Journal of Medicine. I have

developed a national data set of geo-coded precinct-level election results that has

been used extensively in policy-oriented research related to redistricting and

representation. 1

       I have been accepted and testified as an expert witness in six recent election

law cases: Romo v. Detzner, No. 2012-CA-000412 (Fla. Cir. Ct. 2012); Mo. State

1
  The dataset can be downloaded at http://projects.iq.harvard.edu/eda/home. The data can be
visualized in an interactive web map, available at http://atlas.esri.com/Atlas/VoterAtlas.html.
                                              8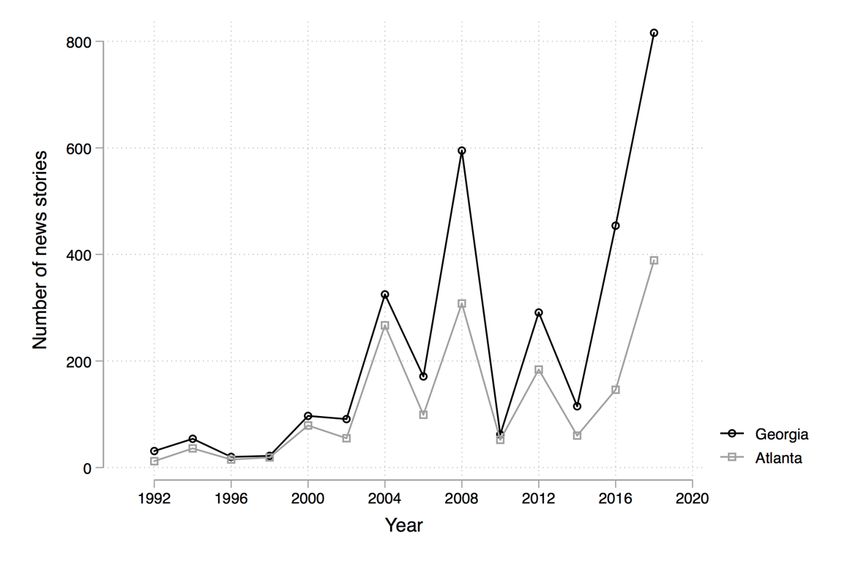
Case 1:20-cv-03263-MLB Document 93-61 Filed 09/01/20 Page 10 of 77

Conference of the NAACP v. Ferguson-Florissant Sch. Dist., No. 4:2014-CV-02077

(E.D. Mo. 2014); Lee v. Va. State Bd. of Elections, No. 3:15-CV-00357 (E.D. Va.

2015); Democratic Nat’l Committee et al. v. Hobbs et al., No. 16-1065-PHX-DLR

(D. Ariz. 2016); Bethune-Hill v. Virginia State Board of Elections, No. 3:14-cv-

00852-REP-AWA-BMK (E.D. Va. 2014); and Jacobson et al. v. Lee, No. 4:18-cv-

00262 (N.D. Fla. 2018). In addition, I recently submitted written testimony in

League of Women Voters of Florida v. Detzner, No. 4:18-cv-002510 (N.D. Fla.

2018) and College Democrats at the University of Michigan, et al. v. Johnson et al.,

No. 3:2018-cv-12722 (E.D. Mich. 2018). I also worked with a coalition of academics

to file Amicus Briefs in the Supreme Court in Gill v. Whitford, No. 16-1161, and

Rucho v. Common Cause, No. 18-422. Much of the testimony in these cases had to

do with geography, voting, ballots, and election administration. I am being

compensated at the rate of $500/hour for my work in this case. My compensation is

not dependent upon my conclusions in any way.

                             III.   DATA SOURCES

      This report draws on data from a number of sources. In addition to a review

of the academic and public policy literatures on long lines, I have drawn on a variety

of sources specific to Georgia. First, I created a large individual-level data set,

                                          9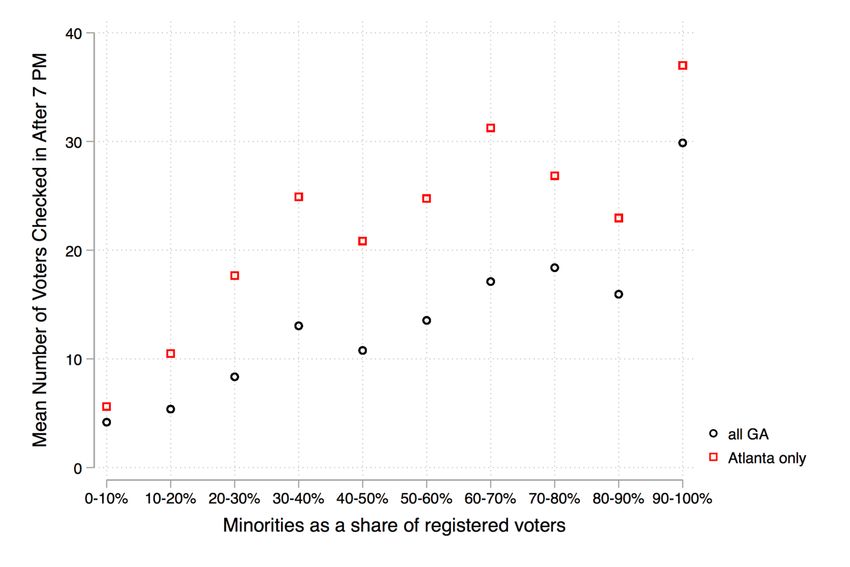
Case 1:20-cv-03263-MLB Document 93-61 Filed 09/01/20 Page 11 of 77

building on an extract of the Georgia voter file dated April 7, 2020.2 I merged this

file together with the vote history file 3 as well as the individual-level absentee voting

file from the June 2020 Primary Election. 4

       Additionally, I have collected data on the polling places used in the June 9,

2020 election. Stephen Fowler, a reporter for Georgia Public Broadcasting, has

assembled a complete list of polling places and associated precincts used in the June

2020 Primary. He has also obtained spreadsheets sent by the Georgia Secretary of

State to individual counties including information from e-pollbooks about check-ins

each hour in each precinct. All of this information at the level of individual polling

places has been merged with demographic information from the voter file. Mr.

Fowler has made the data publicly available. 5 I used Google Maps to geocode and

map these polling places.

       In order to gain an understanding of long lines in previous elections, I used

Lexis-Nexis to search for news reports in the Atlanta Journal-Constitution as well as

national media sources.

       Finally, in order to create visualizations, I collected data on race and

population from the American Community Survey for various years. These data,

2
   This file was provided to me by Counsel, and it is my understanding that it was purchased from
a data firm called L2.
3
   https://sos.ga.gov/index.php/elections/voter_history_files
4
   https://elections.sos.ga.gov/Elections/voterabsenteefile.do
5
  https://public.tableau.com/profile/stephen.fowler#!/vizhome/GeorgiaPollsOpenClose69/GA69P
ollsOpenClose
                                               10
Case 1:20-cv-03263-MLB Document 93-61 Filed 09/01/20 Page 12 of 77
along with accompanying geographic boundary files at the level of census block
groups, were downloaded from Simply Analytics (via the Stanford Library System)
and the National Historical Geographic Information System (NHGIS).
IV. LONG LINES, THE COST OF VOTING, AND TURNOUT
The academic literature on long lines is a subset of a larger literature on the
costs and benefits of voting.6 In this literature, there is broad agreement that turnout
behavior is driven by a mix of individual-level costs—like keeping one’s registration
up to date after a residential move, waiting in line, procuring a valid form of
identification, or gathering information about the location of the correct polling
place—as well as benefits, like contributing to the victory of a desired candidate, or
feeling a sense of pride or civic engagement. A key insight in this literature is that
anything that increases the cost of voting—like waiting for hours in the sun to vote—
decreases the likelihood of voting. And in study after study, it is clear that poor
minorities in the United States are often those most subjected to increased costs of
voting, but also those most sensitive to those increased costs. 7
6
William Riker and Peter C. Ordeshook. 1968. “A Theory of the Calculus of Voting.” American
Political Science Review 62:25-42; John Aldrich. 1993. “Rational Choice and Turnout.” American
Journal of Political Science 37:246-278; André Blais, Jean-François Daoust, Ruth Dassonneville,
and Gabrielle Péloquin-Skulski. 2019. “What is the Cost of Voting?” Electoral Studies 59:145-
157; David Darmofal. 2010. “Reexamining the Calculus of Voting.” Political Psychology 31:149-
174.
7
Jan E. Leighley and Jonathan Nagler. 2014. Who Votes Now? Demographics, Issues, Inequality,
and Turnout in the United States. Princeton: Princeton University Press; Christopher Ojeda,
Christopher. 2018. “The Two Income-Participation Gaps.” American Journal of Political Science
62:813-829; Steven Rosenstone. 1982. “Economic Adversity and Voter Turnout.” American
11Case 1:20-cv-03263-MLB Document 93-61 Filed 09/01/20 Page 13 of 77
In recent years, it has become clear that long lines on Election Day impose a
significant cost of voting in a number of jurisdictions around the United States, even
as increasing numbers of voters cast their votes early or via absentee ballots. From
the 2014 Mid-term to the 2018 Mid-term, for example, the percentage of voters
reporting that they waited more than 30 minutes to cast their ballot has doubled. 8 An
innovative, comprehensive study of the problem in the 2018 Mid-term by the
Bipartisan Policy Center and MIT revealed that the problem varies a great deal from
one jurisdiction to another. 9 This study identified Georgia as the state with the
longest wait times in the United States.
While it may be tempting to interpret long lines on Election Day as a sign of
voter enthusiasm, these lines can have substantial costs. Above all, voters who
encounter long lines on Election Day are less likely to vote, both in the current
election and in the future. In a recent study of the 2016 election, teams of researchers
fanned out across polling places around the country with timers, documenting wait
times, line length, and recording instances in which voters left without voting after
waiting in line for a period of time. 10 They discovered that around three percent of
Journal of Political Science 26:25-46; Steven Rosenstone, S.J. and Raymond Wolfinger. 1978.
“The Effect of Registration Laws on Voter Turnout,” American Political Science Review 72(45).
8
Matthew Weil, Charles Stewart, Tim Harper, and Christopher Thomas, The 2018 Voting
Experience: Polling Place Lines. Bipartisan Policy Center, November 2019.
9
Weil et al., op. cit.
10
Robert Stein et al., “Waiting to Vote in the 2016 Presidential Election: Evidence from a Multi-
12Case 1:20-cv-03263-MLB Document 93-61 Filed 09/01/20 Page 14 of 77
those who got in line at a polling place ended up not voting in 2016, and established
that as one would expect, the number of voters who left without voting was higher
in precincts with longer lines. A study of Franklin County, Ohio in the 2004 general
election documented a correlation between a lack of voting machines, longer lines,
and lower turnout. 11
Responses to the 2016 Voting and Registration Supplement of the Current
Population Survey indicate that over 560,000 eligible voters failed to cast a ballot in
the November 2016 General Election because of long lines and other polling place
management failures. The figure was around 500,000 eligible voters in the
November 2012 survey. According to research by Stephen Pettigrew, the impact of
long lines on turnout is not only felt in the election when the long lines are
experienced, but in subsequent elections as well. He demonstrates that for every
additional hour a voter waits in line to vote, their probability of voting in the
subsequent election drops by one percentage point. Substantively, he estimates that
200,000 people did not vote in 2014 because they were deterred by long lines
experienced in 2012. 12 In the long run, Pettigrew finds that asymmetries in wait
County Study.” Political Research Quarterly 73(2): 439-453, June 2020.
11
Benjamin Highton, “Long Lines, Voting Machine Availability, and Turnout: The Case of
Franklin County, Ohio in the 2004 Presidential Election,” PS: Political Science and Politics 39(1):
65-58, January 2006.
12
Stephen Pettigrew, The Downstream Consequences of Long Waits: How Lines at the Precinct
Depress Future Turnout, working paper, University of Pennsylvania, 2020.
13Case 1:20-cv-03263-MLB Document 93-61 Filed 09/01/20 Page 15 of 77
times across racial groups is part of the explanation for the persistent gap in turnout
between whites and minorities. 13
Even when resolute voters stay in line to cast their ballots, long lines impose
monetary costs on voters from missed work, extra child care costs, and lost
productivity. According to Charles Stewart and Stephen Ansolabehere, a back-of-
the envelope estimate of monetary costs can be achieved by multiplying the total
number or hours waiting in line by average hourly earnings, which came to $544
million in 2012—a figure that has only grown as lines have grown longer over
time. 14
Moreover, long lines undermine voters’ confidence in elections. Respondents
to the Survey of the Performance of American Elections (SPAE) indicate that among
Election Day voters in 2012, 68 percent of those who waited ten minutes or less to
vote stated that they were “very confident” that their vote was counted as intended,
compared with only 47 percent for those who waited over an hour. Those who waited
in long lines lost confidence in the counting not only of their own vote, but of the
legitimacy of the vote-counting in the United States more broadly. 15 This is part of
13
Pettigrew, 2020, op cit.
14
Charles Stewart and Stephen Ansolabehere, “Waiting to Vote,” Election Law Journal, 14(1):
47-53, 2015.
15
Charles Stewart and and Stephen Ansolabehere. 2013. Waiting in Line to Vote. Caltech/MIT
VTP Working Paper # 114.
14Case 1:20-cv-03263-MLB Document 93-61 Filed 09/01/20 Page 16 of 77
a broader literature establishing that failures of election administration have a
significant negative impact on voters’ confidence in American elections. 16
Research on long lines has also revealed clear disparities in the incidence of
long lines. In study after study, it is clear that long lines are more common at polling
places with large concentrations of minorities, in urban areas, and in poor
neighborhoods. 17 The most recent survey-based estimates come from respondents to
the 2018 Cooperative Congressional Election Study (CCES), where African
American and Hispanic voters reported waiting 32 percent longer, on average, than
white voters, and residents of the most densely populated neighborhoods reported
waiting 25 percent longer than residents of the least densely populated
neighborhoods. The massive study of actual precinct-level wait times in 2018 carried
out by the Bipartisan Policy Center and the Massachusetts Institute of Technology,
mentioned above, showed that average wait times in precincts with a minority
population between zero and 10 percent were around 5 minutes, while average wait
16
See, for instance, Lonna Rae Atkeson and Kyle Saunders, “The Effect of Election
Administration on Voter Confidence: A Local Matter?” PS: Political Science and Politics 40(4):
655-660; Michael Alvarez, Thad Hall, and Morgan Llewellyn, “Are Americans Confident their
Ballots are Counted?,” Journal of Politics, vol. 70, pp. 754–766, July 2008; Shaun Bowler,
Thomas Brunell, Todd Donovan, and Paul Gronke, “Election Administration and Perceptions of
Fair Elections,” Electoral Studies, vol. 38, pp. 1–9, June 2015.
17
Stewart and Ansolabehere 2013, op cit.; Stewart and Ansolabehere 2015, op cit.; Weil et al.
2019, op cit.; Stephen Pettigrew, “The Racial Gap in Wait Times: Why Minority Precincts are
Underserved by Local Election Officials,” Political Science Quarterly 132(2): 527-547.; Stephen
Pettigrew, “Long Lines and Voter Purges: The Logistics of Running Elections in America,” PhD
Dissertation, Harvard University, 2017; Robert Stein, Christopher Mann, and Charles Stewart,
“Waiting to Vote in the 2016 Presidential Election: Evidence from a Multi-County Study,”
Political Research Quarterly March 2019; Stein et al. 2020, op cit.
15Case 1:20-cv-03263-MLB Document 93-61 Filed 09/01/20 Page 17 of 77
times in precincts with minority populations between 90 and 100 percent were over
30 minutes. 18 Another innovative study used pings from millions of cell phones on
Election Day in November of 2016 and other surrounding days, which allowed a
group of researchers to estimate wait times at various polling locations around the
country. They found that relative to white neighborhoods, residents of African-
American neighborhoods waited 29 percent longer to vote and were 74 percent more
likely to spend more than 30 minutes at their polling place. 19
Moreover, confirming the results of survey research, the Bipartisan Policy
Center/MIT study indicated that average wait times in precincts with average annual
income greater than $100,000 were around 8.5 minutes, while wait times in precincts
with average income between $20,000 and $30,000 were 23.4 minutes.
Unfortunately, the populations most affected by wait times are those that can least
afford to wait in line. Poor voters in urban neighborhoods often work as shift laborers
with unpredictable and unforgiving work schedules and difficult child care
arrangements. 20 For workers with precarious and unpredictable sources of income
and strict policies regarding absences, waiting in line for hours to vote during the
workday can lead to a serious loss of income or future employment opportunities.
18
Weil et al. 2019, op cit., Figure 9 (page 21).
19
M. Keith Chen, Kareem Haggag, Devin Pope, and Ryne Rohla, “Racial Disparities in Voting
Wait Times: Evidence from Smartphone Data,” NBER Working Paper No. 26487, November
2019.
20
See Lonnie Gordon, “Irregular Work Scheduling and its Consequences,” Economic Policy
Institute Report, April 9, 2015.
16Case 1:20-cv-03263-MLB Document 93-61 Filed 09/01/20 Page 18 of 77
V. LONG LINES IN GEORGIA: A COMPARATIVE AND
HISTORICAL PERSPECTIVE
Georgia has featured heavily in media reporting on long lines at polling places
for several election cycles, as well as in reports by advocacy groups, and more
recently, in the burgeoning academic literature reviewed above. To get a sense for
media coverage of long lines associated with elections in Georgia over time, using
the Lexis-Nexis database, I have done a search for all stories in the Atlanta Journal-
Constitution that contain the terms “Georgia” and “long lines” and “election.” In
order to include the early voting period as well as election coverage after each
election, I have conducted this search for the period from August 1 of the year of
each November election to August 1 of the following year. I have done this for
general election years from 1984 to the present. The results are presented in Figure
1 below.
17Case 1:20-cv-03263-MLB Document 93-61 Filed 09/01/20 Page 19 of 77
Figure 1: Number of Stories in the Atlanta Journal Constitution about
Long Lines in Georgia Elections
Coverage of long lines at polling places for Georgia elections are nothing new.
There were no stories about long lines associated with elections in the Atlanta
Journal Constitution in the 1980s. Turnout was very high in Georgia in 1992, and
there were a handful of stories about parking problems and long lines on Election
Day. Then, after a drop in 1996, starting in 2000, every presidential election year
has seen a relatively large number of stories about long lines at polling places
associated with Georgia elections. As Figure 1 shows, these stories are typically
more frequent in presidential election years than in midterm years, although the
reporting was more limited in the presidential year of 2016, and took off in Georgia’s
troubled 2018 midterm election.
18Case 1:20-cv-03263-MLB Document 93-61 Filed 09/01/20 Page 20 of 77
The reports of Atlanta Journal-Constitution writers are surprisingly consistent
from 2000 to the present. They describe angry voters, long lines snaking outside
buildings, hours of waiting, and court orders to keep polling places open well past 7
PM—sometimes until after 10 PM. These stories focus almost exclusively on
predominantly African-American precincts in the Atlanta metro area. For instance,
a story published on November 8, 2000 interviewed Rep. John Lewis, who waited
two hours to vote at Venetian Hills Elementary School, where the polling place
opened 45 minutes late, and 7 of 13 voting machines were broken. Very long lines
were reported in several other African-American neighborhoods, including the
polling places of Dunwoody Springs Elementary School in Fulton County,
Stoneview Elementary School in DeKalb County, E.W. Oliver Elementary School
in Clayton County, and several precincts in Cobb County. The articles also
mentioned difficulties in Gwinnett and Clayton Counties, and described the anger of
voters who were still waiting in line when the television networks declared the
winner of Georgia’s electoral votes in the 2000 presidential race.
Such stories have become a regular feature of election reporting in presidential
years since 2000. In addition to interviews with angry voters in the same minority
neighborhoods in metro Atlanta, these stories typically feature interviews with
election officials who express surprise about unanticipated levels of voter
19Case 1:20-cv-03263-MLB Document 93-61 Filed 09/01/20 Page 21 of 77
enthusiasm and unexpected turnout. Starting in 2004, the national media also started
paying attention to the problem of long lines for in-person voting in Georgia.
Figure 2: Number of Stories in Lexis-Nexis about Long Lines in Georgia
Elections
To make Figure 2, I conduct the same search using all of the news sources in the
Lexis-Nexis database, searching separately for “Georgia” and “Atlanta.” Here as
well, we see large spikes in stories about long lines in presidential election years,
with an unusually large increase in 2018. These stories also focus primarily on
African-American precincts in the Atlanta areas.
Beginning in 2004, advocacy groups started to collect information from poll
observers and telephone hotlines. An October 2012 report sponsored by several
election protection advocacy groups documented long lines and voting machine
problems in the 2004 general election, and identified Clayton County as the
20Case 1:20-cv-03263-MLB Document 93-61 Filed 09/01/20 Page 22 of 77
“epicenter” of the problem in that year. 21 The same report identified problems of
overcrowding at polling places that were spread throughout the Atlanta region in the
2008 election, but with problems especially concentrated in Fulton County. In
addition to Fulton and Clayton, media reporting focused on long lines in 2008 in
Gwinnett, DeKalb, Cobb, and other Atlanta-area counties. 22
Long lines were also reported in November 2012, most notably in Fulton
County. Calls to an Election-Day Hotline revealed major failures with electronic poll
books that led to “long lines, frustration, and thousands of eligible voters having to
vote provisionally,” so that “several polling places ran out of provisional ballots, and
voters reported being turned away without being able to cast any type of ballot.” 23
Voters at the polling place on the campus of Morehouse College reported standing
in line for up to seven hours. 24
Once again, media reports focused on long lines in the Atlanta area in the
November 2016 general election, especially during the early voting period, with a
21
Georgia Election Protection Leadership Committee, Georgia Appleseed Center for Law and
Justice, and the Lawyers’ Committee for Civil Rights Under Law, “Resolving Recurring Election
Administration Problems in Georgia,” October 2012.
22
https://www.nbcdfw.com/news/politics/long_lines__glitches_greet_early_voters/1841895/;
https://www.wqxr.org/story/5415-adaora-visits-crowded-atlanta-polling-place/?tab=summary;
https://politicalticker.blogs.cnn.com/2008/10/31/unprecedented-wait-times-plague-georgia-
voters/; https://www.facingsouth.org/2008/10/voting-rights-watch-long-lines-a-voting-rights-
issue.html
23
Lawyer’s Committee for Civil Rights Under Law, “2012 Election Protection Report” (2013).
24
Lawyer’s Committee 2013, op cit.
21Case 1:20-cv-03263-MLB Document 93-61 Filed 09/01/20 Page 23 of 77
number of stories focusing on Cobb, Gwinnett, Fulton, and DeKalb counties. 25 In
2018, as demonstrated in the graphs above, the problem with long lines in metro
Atlanta received considerable national attention. Reports in 2018 focused especially
on very long lines in Fulton, Gwinnett, and Cobb counties. In Fulton County,
multiple precincts were assigned to Pittman Park Recreation Center, but it was
evidently not supplied with corresponding equipment, leading to extremely long
lines and another late night. Courts ordered polling places to stay open late not only
at Pittman Park, but also at Booker T. Washington High School and once again at
Morehouse College. 26 Some of the same communities featured consistently in
reporting from previous years were in the news once again in 2018, including
precincts in Snellville in Gwinnett County. Three precincts were forced to stay open
late in Gwinnett. In Cobb County, lines between 1.5 and 2 hours were reported by
voters at several locations.
Since one might worry about bias in reports of the news media or advocacy
groups, it is useful to also examine the burgeoning survey literature on long lines.
25
https://www.ajc.com/news/local/polls-open-cobb-county-long-lines-voters-with-many-
opinions/tt5YCJlKJLL4j5lKszaRzO/;
https://www.theguardian.com/commentisfree/2016/oct/19/early-voting-lines-georgia;
https://patch.com/georgia/atlanta/georgia-election-results-2016-voters-greeted-long-lines-
polling-locations; http://cp.wabe.org/post/some-gwinnett-county-voters-see-long-lines-polls;
https://www.ajc.com/news/local/you-plan-voting-today-cobb-pack-your-
patience/AHo7nPe9Ypq99YzMcFxqMI/
26
https://www.propublica.org/article/georgia-voters-face-hours-long-waits-as-state-scrambles-to-
accommodate-turnout
22Case 1:20-cv-03263-MLB Document 93-61 Filed 09/01/20 Page 24 of 77
The Survey of the Performance of American Elections is a post-election survey of
voters that was conducted for each general election by a group of researchers headed
by the Massachusetts Institute of Technology. Some of the data can be visualized on
a web page created by the Pew Charitable Trusts. 27 It includes a variety of questions
about voters’ experiences casting their ballots, including the time spent waiting in
line. In the 2008 survey, Georgia had the second longest wait times in the United
States. In 2012, Georgia was eighth in the country on this metric. In 2014, it was
ranked fourth. In 2016, it was tied for second. 28
In addition to the Survey of the Performance of American Elections, another
valuable resource is the Cooperative Congressional Election Study (CCES), which
has large samples within each U.S. state. Using CCES data, Georgia ranked sixth in
wait times in 2012, 29 and seventh in 2014. 30 Using survey data from the 2018 CCES,
a study by the Bipartisan Policy Center and MIT concluded that Georgia had the
longest estimated wait times in the country in 2018. 31 The study also found that not
only are Georgia’s wait times the longest in the country, but wait times have
27
https://www.pewtrusts.org/en/research-and-analysis/data-visualizations/2014/elections-
performance-index#indicatorProfile-WTV
28
https://medium.com/mit-election-lab/insights-into-voting-wait-time-from-the-2016-elections-
performance-index-6693576e9b99
29
Charles Stewart, III, “Managing Polling Place Resources,” Report of the Caltech/MIT Voting
Technology Project. December 2015, Appendix 1.
30
Weil et al. 2019, op cit. Figure 1.
31
Weil et al. 2019, op cit. Figure 1.
23Case 1:20-cv-03263-MLB Document 93-61 Filed 09/01/20 Page 25 of 77
increased more dramatically in Georgia than in other states between the midterms of
2014 and 2018.
Another potentially useful source of cross-state data is the study that estimated
wait times in the 2016 election using cell phone data. 32 Due to cross-state and cross-
county differences in the sample size, and cross-county differences in the ability of
researchers to accurately extract signal from noise in the pings from phones, one
must be careful about making comparisons across states, Congressional districts, and
especially counties. In this study, Georgia was one of a group of states with an
average estimated 2016 wait time of around 20 minutes, and it was ranked fifteenth
overall. The study also found a significant racial disparity in wait times not only in
their full U.S. sample, but also within Georgia (Table A.8). In the authors’ estimates
for the 100 largest U.S. counties, Cobb, DeKalb, and Fulton were clustered around
the Georgia average of around 20 minutes, but Gwinnett’s estimated average 30-
minute wait was ranked number four overall (behind Baltimore, St. Louis, and Salt
Lake City; see Table A.10). Of course, this is an average across cell phone pings at
polling places, some of which experienced no wait at all, and others of which waited
far longer than 30 minutes.
32
Chen et al. 2019, op cit.
24Case 1:20-cv-03263-MLB Document 93-61 Filed 09/01/20 Page 26 of 77
VI. WHO EXPERIENCES LONG LINES IN GEORGIA?
In sum, Georgia is one of the U.S. states with a clear and persistent problem
with long lines at polling places in recent decades. These problems have been
documented in media reports and academic studies, which have also indicated that
the problems are most prevalent in urban communities with large minority
populations. The remainder of this report dives much deeper into the data from June
of 2020, demonstrating that the findings of the broader literature about race and long
lines can also be clearly discerned in Georgia: minority communities are indeed
disproportionately impacted by long lines. Unfortunately, the type of data collected
by the collaborators on the Bipartisan Policy Center/MIT study were not available
for this primary. I know of no teams of researchers who systematically sampled
polling locations in Georgia and tracked wait times throughout the day. Nor do I
have access to systematic survey data in which voters from various polling locations
were asked how long they waited in line.
However, I do have access to valuable data on the number of voters who
checked in each hour in each polling place in Georgia on June 9, 2020. Alone,
average check-ins per hour are not especially useful for assessing wait times without
some information about how many voters may have been lining up to check in. One
polling place might have an average check-in time of one minute per voter and have
no lines at all, while another polling place could have a similar or even lower check-
25Case 1:20-cv-03263-MLB Document 93-61 Filed 09/01/20 Page 27 of 77
in time and end up with huge lines because of a larger surge of voters and inadequate
resources (pollbooks, machines, or workers) to keep up. For example, some of the
Fulton County precincts featured in media reporting on long lines were actually quite
efficient at checking in massive numbers of voters. 33 The Park Tavern polling place
in Atlanta, for example, was able to achieve a relatively efficient check-in time of
well under one minute per voter, but still experienced exceptionally long lines.
It is clear from media reports that at many polling places, long lines formed
before the polling place opened in the morning, and the numbers were simply too
great and the resources too few to catch up. Surely there are polling places that
eventually caught up, but some did not, and at many polling places, hundreds of
people were still in line when the polls were scheduled to close at 7 PM. These
polling places were allowed to stay open as long as was necessary to process those
already in line, but according to Georgia law, new individuals were not permitted to
enter the line. According to O.C.G.A §821-2-413(g):
“when the hour for closing the polls shall arrive, all electors who have already
qualified and are inside the enclosed space shall be permitted to vote; and in addition
thereto, all electors who are then in the polling place outside the enclosed space, or
then in line outside the polling place, waiting to vote, shall be permitted to do so if
found qualified, but no other persons shall be permitted to vote.”
33
https://www.gpb.org/news/2020/07/17/heres-what-the-data-shows-about-polling-places-lines-
in-georgias-primary
26Case 1:20-cv-03263-MLB Document 93-61 Filed 09/01/20 Page 28 of 77
This provides us with an opportunity to identify troubled precincts. First, a
simple binary way of identifying precincts experiencing long lines is to ask whether
they were still processing voters after 8 PM (one hour after the official closing time).
Figure 3 provides a map of all of the polling places that were still processing voters
after 8 PM. We can see from Figure 3 that these polling places were concentrated in
the Atlanta metro area, as well as in Savannah and Columbus.
Second, we can count up the total number of voters processed after the official
closing time of 7 PM. In some cases, only a handful of voters were checked in a few
minutes after 7 PM, while in other cases, hundreds of voters were processed over
several additional hours.
Third, if we assume that election officials implemented the law and no
additional voters were allowed to get in line after 7 PM, we can take the time that
elapsed between 7 PM and the time of the last check-in as an estimate of the
minimum wait time experienced by the last voter of the day. This is likely a severe
under-estimate of wait times throughout the day. Previous studies have shown that
wait times are typically longest in the morning, and gradually improve throughout
the day. 34 Moreover, this is most likely an underestimate even of the wait time
experienced by late voters, since it is entirely possible that the last voter in line was
already waiting for a substantial amount of time before 7 PM.
34
Weil et al. 2019, op cit.
27Case 1:20-cv-03263-MLB Document 93-61 Filed 09/01/20 Page 29 of 77
Figure 3: Polling Places Open After 8 PM
While we should view the estimates of wait times calculated in this way as an
underestimate of actual average wait times during the day, this approach should
allow us to draw solid inferences about variation across polling places. If polling
28Case 1:20-cv-03263-MLB Document 93-61 Filed 09/01/20 Page 30 of 77
place A processed its last voter at 6:55 PM and polling place B processed 200 voters
after 7 PM and finished its last voter at 10:30 PM, we can safely conclude that polling
place B experienced substantially longer lines, at least in the latter part of the day,
and in all likelihood, earlier in the day as well.
Figure 4: The Distribution of Late Check-ins and Wait Times after 7
PM, Georgia Polling Places, June 9,2020
As demonstrated in the map above, the class of polling-place bottlenecks that
led to late check-ins were not evenly distributed across Georgia. Of 2,258 polling
places in the data set, 238 (11 percent) checked voters in after 8 PM. Figure 4
provides histograms of the number of voters checked in after 7 PM (in the left panel)
and the time that elapsed between 7 PM and the last check-in (in the right panel)
29Case 1:20-cv-03263-MLB Document 93-61 Filed 09/01/20 Page 31 of 77
across Georgia polling places in June 9, 2020. These highly skewed distributions
indicate that the problem of late check-ins was quite concentrated in certain
precincts. The majority of polling places checked in zero voters after 7 PM.
However, in the right tail of the distribution are a substantial number of polling
places where voters at the end of the day clearly experienced very long wait times.
There were 236 precincts where more than 30 voters checked in after 7 PM, and 152
where more than 50 voters did so. There were 356 precincts where the estimated
evening wait time was over 30 minutes, 236 where it was over one hour, 57 where
it was over two hours, and 16 where it was over 3 hours.
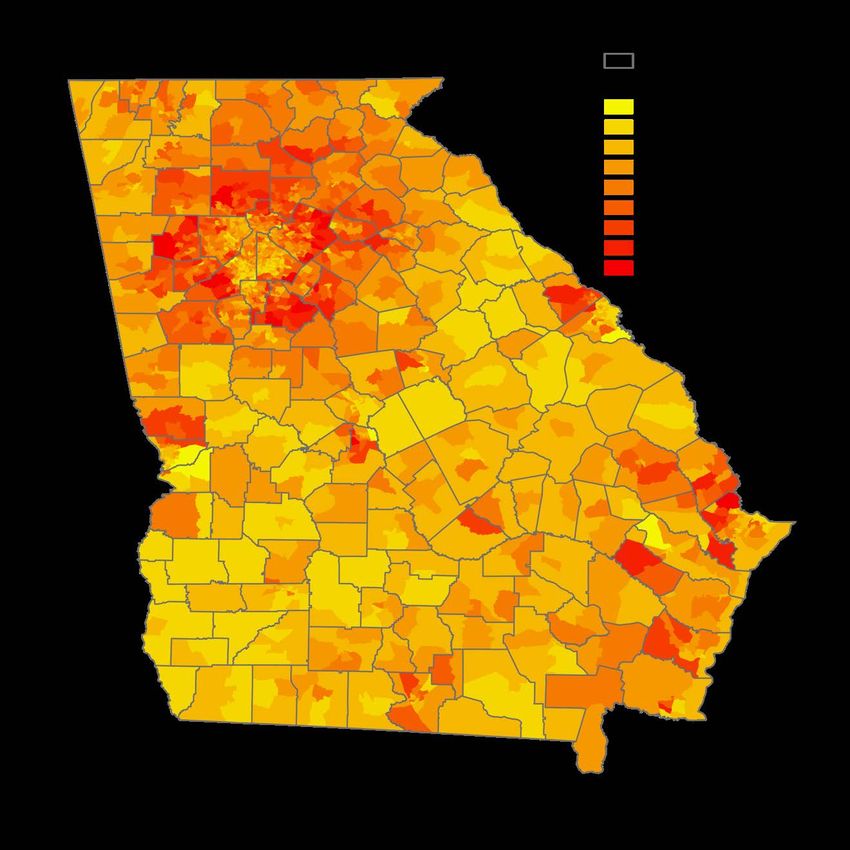
The precincts served by the polling places in the far-right tail of the
distribution in Figure 4 are disproportionately composed of minority voters. Figures
3 and 4 provide maps of polling places that were open past 8 PM, again with red
dots, along with data on African-Americans as a share of the population at the level
of census block groups from the most recent American Community Survey. Figure
5 includes the entire state, and Figure 6 zooms in on the Atlanta area. One can see
from the maps that many of the neighborhoods served by troubled polling places had
African-American majorities. It is also clear that these problems were not common
in rural African-American areas with declining populations, but rather, in urban and
suburban African-American neighborhoods in Atlanta, Savannah, and Columbus.
30Case 1:20-cv-03263-MLB Document 93-61 Filed 09/01/20 Page 32 of 77
Figure 5: Polling Places Open After 8 PM and African-American Share
of Population, Georgia
31Case 1:20-cv-03263-MLB Document 93-61 Filed 09/01/20 Page 33 of 77
Figure 6: Polling Places Open After 8 PM and African-American Share
of Population, Atlanta Area
For each polling place, using data on self-reported race in the voter file, I
calculate the share of voters that describe themselves as African-American,
Hispanic, Native American, or Asian. These minority groups constituted local
majorities in 32 percent of the polling places used in June 9, 2020 in Georgia.
However, these majority-minority polling places accounted for over 63 percent of
the polling places that were still processing voters after 8 PM.
32Case 1:20-cv-03263-MLB Document 93-61 Filed 09/01/20 Page 34 of 77
Another way to look at the data is to calculate the share of majority-white
polling places that were still processing voters after 8 PM versus the share of
majority-minority polling places where this was true. Only 6 percent of majority-
white precincts were forced to stay open past 8 PM, while 21 percent of majority-
minority polling places had to do so. In other words, the rate at which polling places
experienced problems requiring them to stay open late was well over three times
higher for minority precincts. Breaking the data down a bit further, we can see that
the rate at which polling places stayed open late is highly correlated with race and
ethnicity, but the problem is especially severe in polling places where the population
is overwhelmingly composed of minorities.
Figure 7 presents the share of polling places open past 8 PM for precincts
where minorities make up 0 to 10 percent of registered voters, 10 to 20, and so on,
up to the highest category—the polling places where minorities made up more than
90 percent of registered voters. Figure 7 demonstrates a linear increase in the share
of polling places open past 8 PM as the minority share of registered voters increases,
up to the group of precincts where minorities make up 80 to 90 percent of the
population. However, after that, there is a discontinuous jump in the share of polling
places open late. The share of polling places that were open past 8 PM in the 129
precincts where minorities made up 80 to 90 percent of registered voters was around
19 percent, but in the 196 precincts where minorities made up 90 to 100 percent of
33Case 1:20-cv-03263-MLB Document 93-61 Filed 09/01/20 Page 35 of 77
registered voters, it jumped all the way to almost 36 percent. Note that at the opposite
extreme—the 360 precincts where non-Hispanic whites made up over 90 percent of
registered voters—the rate at which polling places were open late was less than 3
percent.
Figure 7: The Share of Polling Places Open Past 8 PM, by Minorities as
a Share of Registered Voters, Georgia Polling Places, June 9,2020
The connection between race/ethnicity and problems with in-person voting on
election day is not merely a reflection of the fact that minority-dominated precincts
are concentrated in the Atlanta metro area. The red squares in Figure 7 limit the
analysis exclusively to the Atlanta metro area. 35 The fact that all of the red squares
35
I define the Atlanta metro area to contain the counties of Cherokee, Clayton, Cobb, Coweta,
Dekalb, Douglas, Fayette, Fulton, Gwinnett, Henry, Paulding, and Rockdale.
34Case 1:20-cv-03263-MLB Document 93-61 Filed 09/01/20 Page 36 of 77
are higher than the black circles indicates that the share of polling places that were
open late was higher in the Atlanta metro area across the board than in the rest of the
State regardless of precinct racial shares. However, we can also see that the
relationship between the racial composition of the polling place and the likelihood
of late check-ins holds up within the Atlanta metro area. Among the Atlanta-area
polling places that were over 90 percent non-Hispanic white, around 6 percent were
still checking in voters after 8 PM, while among the Atlanta-area precincts where
the minority population was over 90 percent, around 45 percent were doing so.
Another way to examine the data is to avoid using data that is aggregated to
the level of the polling place, and instead go directly into the voter file and examine
the proportion of each (self-described) racial/ethnic group that lives in a precinct
assigned to a polling place that was open past 8 PM. For non-Hispanic whites, 11
percent of registered voters were assigned to such polling places. For African
Americans, the figure was over twice as high: 24 percent. For Hispanics, it was 16
percent, and for Asian Americans/Pacific Islanders it was 22 percent.
It is also useful to examine the relationship between race/ethnicity and the
other two metrics discussed above: the total number of voters checked in after 7 PM,
and the time that elapsed between 7 PM and the last check-in. This information is
presented in Figures 8 and 9 below. Both figures demonstrate a strong relationship
between race/ethnicity and difficulties at polling places in the June 2020 Primary.
35Case 1:20-cv-03263-MLB Document 93-61 Filed 09/01/20 Page 37 of 77
Whether we look at Georgia as a whole or focus only on the Atlanta metro area,
there is a strong polling-place-level relationship between the relative size of the
minority population and the average number of voters who checked in after 7 PM,
as well as the average evening wait time. In polling places where non-Hispanic
whites made up over 90 percent of the population, on average, four voters were
checked in after 7 PM, and the average evening wait time was around four minutes.
In polling places where minorities made up over 90 percent of the population, around
30 voters checked in after 7 PM, and the average evening wait time was around 51
minutes.
Figure 8: Average Number of Voters Checked in After 7 PM, by
Minorities as a Share of Registered Voters, GA Polling Places, June 9, 2020
36Case 1:20-cv-03263-MLB Document 93-61 Filed 09/01/20 Page 38 of 77
Figure 9: Average Minimum Wait Time After 7 PM, by Minorities as a
Share of Registered Voters, GA Polling Places, June 9, 2020
It is also useful to look beyond the averages and take a closer look at the
smaller group of polling places in the right tail of the distribution in Figure 4 above—
where the number of voters checked in after 7 PM was much higher than average,
and where estimated evening wait times were much higher than average. Around 63
percent of the polling places where more than 50 voters checked in after 7 PM were
majority-minority precincts. Around 62 percent of the polling places with estimated
evening wait times greater than 90 minutes were majority-minority polling places.
As mentioned above, in only 32 percent of all polling places in Georgia did
minorities constitute majorities. Around four percent of majority-white precincts
checked in more than 50 voters after 7 PM, while around 13 percent of minority-
majority precincts did so. Around four percent of majority-white precincts
37Case 1:20-cv-03263-MLB Document 93-61 Filed 09/01/20 Page 39 of 77
experienced minimum evening wait times greater than 90 minutes, while 15 percent
of minority-majority precincts did so. When whites constitute more than 90 percent
of registered voters, the average minimum evening wait time is around six minutes.
When minorities constitute more than 90 percent of registered voters, the average is
51 minutes. No matter which of these metrics is used, then, the prevalence of
relatively serious polling place difficulties is more than 3 times greater in minority-
majority precincts than majority-white precincts.
Finally, since race, urbanization, and partisanship are so highly correlated in
Georgia, it is useful to examine the prevalence of polling place difficulties by party
in addition to race. Included in the vote history file from the June 2020 election is a
variable that indicates whether the individual voted in the Democratic or Republican
primary. I can then use this to assess the prevalence of polling place difficulties by
party. Among those who lived in neighborhoods assigned to polling places that were
open past 8 PM in June of 2020, 75.4 percent voted in the Democratic Primary, while
only 21.7 percent voted in the Republican Primary. Among those who lived in
neighborhoods where the polling place was closed by 8 PM, 50 percent voted in the
Republican Primary and 47.8 percent voted in the Democratic Primary. Or to look
at the data another way, 22 percent of those voting in the Democratic Primary lived
in a troubled precinct, while 7.2 percent of those voting in the Republican Primary
38Case 1:20-cv-03263-MLB Document 93-61 Filed 09/01/20 Page 40 of 77
lived in these precincts. In other words, the rate was three times higher for Democrats
than for Republicans.
VII. WHAT EXPLAINS THE LONG LINES?
Why do some polling places experience longer lines than others? And what
accounts for the racial disparities in long lines outlined above? This section considers
several potential explanations. First, I consider the raw numbers of active voters
assigned to each polling place, and find strong evidence that lines are longer when a
polling place must process a larger number of voters, and that this problem is more
severe in polling places that serve multiple precincts, especially in metro Atlanta. I
also consider differences between absentee and Election-Day voting, and establish
that the polling places with the largest problems in the June 2020 Primary appear to
have been those where relatively large shares of voters showed up for in-person
rather than early or absentee voting. Finally, I present evidence that there are racial
disparities in the size and structure of polling places, as well as in the use of Election-
day vis-à-vis early or absentee ballots, as well as in the use of provisional ballots.
The Number of Voters Assigned to Vote at Each Polling Place
Perhaps the most obvious explanation for long lines at polling places has to
do with the number of voters attempting to vote at each polling place. As mentioned
above, Georgia had among the longest average wait times in 2014, and had the
39Case 1:20-cv-03263-MLB Document 93-61 Filed 09/01/20 Page 41 of 77
longest wait times in the country in 2018. 36 It is probably not a coincidence that
relative to other states, Georgia also requires extremely large numbers of voters to
cast their ballots at a single polling place. This is the case in normal elections, but
the numbers of voters per polling place grew even larger in the June 2020 Primary—
especially in urban areas that experienced additional consolidations due to COVID.
Figure 10: The Distribution of Active Voters Across Polling Places, Georgia
June 9, 2020 Primary Election
According to the Election Assistance Commission, in 2016, 48 percent of
jurisdictions in the United States had less than 1,000 registered voters per polling
place, 27 percent had between 1,000 and 2,000, and only 25 percent of the
36
Weil et al., 2019, op cit., Figure 1, page 8.
40Case 1:20-cv-03263-MLB Document 93-61 Filed 09/01/20 Page 42 of 77
jurisdictions had more than 2,000 registered voters per polling place. 37 Figure 10
displays a histogram of the total number of active voters across all of the polling
places used in the June 2020 Primary, making clear just how far Georgia deviates
from practices elsewhere. In Georgia in June of 2020, only 15 percent of polling
places served less than 1,000 active registered voters; 20 percent served between
1,000 and 2000; and 65 percent of polling places had more than 2,000 active
registered voters. In fact, 42 percent of the polling places served over 3,000 people.
But the right tail of the distribution is especially striking: There were 316 polling
places serving over 5,000 people each, and 35 that served over 10,000. Polling places
serving such massive numbers of voters are extremely unusual. According to the
Election Assistance Commission, the overall average of registered voters per polling
station in the United States was 1,547 in 2016. In Georgia in June of 2020 it was
almost twice as large: 3,046. This issue was addressed in a recent study by the
Brennan Center, which concluded that the average polling place in Georgia had 530
in-person Election Day ballots cast in 2014, but that number grew to 770 in 2018—
an increase of almost 50 percent. 38
37
Election Assistance Commission: EAVS Deep Dive: Poll Workers and Polling Places, p. 4. Note
that the EAC sample excludes three states that automatically mail ballots to all voters: Colorado,
Washington, and Oregon.
38
Hannah Klain, Kevin Morris, Max Feldman, and Rebecca Ayala, “Waiting to Vote: Racial
Disparities in Election Day Experiences,” Report of the Brennan Center for Justice, New York
University School of Law, June 3, 2020, page 12.
41You can also read