BLACKIOT: IOT BOTNET OF HIGH WATTAGE DEVICES CAN DISRUPT THE POWER GRID - USENIX
←
→
Page content transcription
If your browser does not render page correctly, please read the page content below

BlackIoT: IoT Botnet of High Wattage Devices
 Can Disrupt the Power Grid
 Saleh Soltan, Prateek Mittal, and H. Vincent Poor, Princeton University
 https://www.usenix.org/conference/usenixsecurity18/presentation/soltan

 This paper is included in the Proceedings of the
 27th USENIX Security Symposium.
 August 15–17, 2018 • Baltimore, MD, USA
 ISBN 978-1-939133-04-5

 Open access to the Proceedings of the
 27th USENIX Security Symposium
 is sponsored by USENIX.
BlackIoT: IoT Botnet of High Wattage Devices Can Disrupt the Power Grid

 Saleh Soltan Prateek Mittal
 Department of Electrical Engineering Department of Electrical Engineering
 Princeton University Princeton University
 ssoltan@princeton.edu pmittal@princeton.edu
 H. Vincent Poor
 Department of Electrical Engineering
 Princeton University
 poor@princeton.edu
Abstract Compromised
 High Wattage
 We demonstrate that an Internet of Things (IoT) bot-
 IoT Devices
net of high wattage devices–such as air conditioners and
heaters–gives a unique ability to adversaries to launch
large-scale coordinated attacks on the power grid. In Target of
 the Attack
particular, we reveal a new class of potential attacks on Power
power grids called the Manipulation of demand via IoT Grid
(MadIoT) attacks that can leverage such a botnet in order Synchronous On/Off
to manipulate the power demand in the grid. We study
five variations of the MadIoT attacks and evaluate their
effectiveness via state-of-the-art simulators on real-world
power grid models. These simulation results demonstrate
that the MadIoT attacks can result in local power outages Compromised
and in the worst cases, large-scale blackouts. Moreover, High Wattage
we show that these attacks can rather be used to increase Adversary IoT Devices
the operating cost of the grid to benefit a few utilities in
 Figure 1: The MadIoT attack. An adversary can disrupt the
the electricity market. This work sheds light upon the in- power grid’s normal operation by synchronously switching
terdependency between the vulnerability of the IoT and on/off compromised high wattage IoT devices.
that of the other networks such as the power grid whose
security requires attention from both the systems security most essential modern infrastructure networks, the power
and power engineering communities. grid.
 Power grid security standards are all based on the as-
1 Introduction sumption that the power demand can be predicted reliably
 on an hourly and daily basis [62]. Power grid operators
 A number of recent studies have revealed the vul- typically assume that power consumers collectively be-
nerabilities of the Internet of Things (IoT) to intrud- have similarly to how they did in the past and under simi-
ers [21, 49, 50]. These studies demonstrated that IoT de- lar conditions (e.g., time of the day, season, and weather).
vices from cameras to locks can be compromised either However, with the ubiquity of IoT devices and their poor
directly or through their designated mobile applications security measures (as shown in [12]), we demonstrate that
by an adversary [12, 28, 43]. However, most previous this is no longer a safe assumption.
work has focused on the consequences of these vulnera- There has been a recent trend in producing Wi-Fi en-
bilities on personal privacy and security. It was not until abled high wattage appliances such as air conditioners,
recently and in the aftermath of the Distributed Denial water heaters, ovens, and space heaters that can now be
of Service (DDoS) attack by the Mirai botnet, compris- controlled remotely and via the Internet [3] (for the power
ing six hundred thousand compromised devices targeting consumption of these devices see Table 1). Even older
victim servers, that the collective effect of the IoT vul- appliances can be remotely controlled by adding Wi-Fi
nerabilities was demonstrated [12]. In this paper, we re- enabled peripherals such as Tado◦ [8] and Aquanta [2]. A
veal another substantial way that compromised IoT de- group of these devices can also be controlled remotely or
vices can be utilized by an adversary to disrupt one of the automatically using smart thermostats or home assistants

USENIX Association 27th USENIX Security Symposium 15

such as Amazon Echo [1] or Google Home [4]. Hence, Table 1: Home appliances’ approximate electric power usage
once compromised, any of these devices can be used to based on appliances manufactured by General Electric [3].
control high wattage appliances remotely by an adversary Appliance Power Usage ( )
to manipulate the power demand. Air Conditioner 1,000
 Space Heater 1,500
 In this paper, we reveal a new class of potential attacks Air Purifier 200
called the Manipulation of demand via IoT (MadIoT) at- Electric Water Heater 5,000
tacks that allow an adversary to disrupt the power grid’s Electric Oven 4,000
normal operation by manipulating the total power de-
 the system is stabilized by the primary controller of the
mand using compromised IoT devices (see Fig. 1). These
 generators. Since the way power is transmitted in the
attacks, in the extreme case, can cause large scale black-
 power grid (a.k.a. the power flows) follows Kirchhoff’s
outs. An important characteristic of MadIoT attacks is
 laws, the grid operator has almost no control over the
that unlike most of previous attacks on the power grid,
 power flows after the response of the primary controllers.
they do not target the power grid’s Supervisory Control
 Hence, even a small increase in the demands may result
And Data Acquisitions (SCADA) system but rather the
 in line overloads and failures. These initial line failures
loads that are much less protected as in load-altering at-
 may consequently result in further line failures or as it is
tacks studied in [11, 41].
 called, a cascading failure [54]. For example, we show
 It is a common belief that manipulating the power de-
 by simulations that an increase of only 1% in the de-
mands can potentially damage the power grid. However,
 mand in the Polish grid during the Summer 2008 peak,
these speculations have mostly remained unexamined un-
 results in a cascading failure with 263 line failures and
til our work. We are among the first to reveal realis-
 outage in 86% of the loads. Such an attack by the ad-
tic mechanisms to cause abrupt distributed power de-
 versary requires access to about 210 thousand air condi-
mand changes using IoT devices–along with Dvorkin and
 tioners which is 1.5% of the total number of households in
Sang [24], and Dabrowski et al. [19]. Our key contribu-
 Poland [58]. During the Summer peak hours when most
tion is to rigorously study the effects of such attacks on
 of the air conditioners are already on, decreasing their
the power grid from novel operational perspectives (for
 temperature set points [61] combined with the initiation
more details on the related work see Section 6).
 of other high wattage appliances like water heaters, can
 We study five variations of the MadIoT attacks and result in the same total amount of increase in the demand.
demonstrate their effectiveness on the operation of real-
world power grid models via state-of-the-art simulators. We also show that an adversary can cause line failures
These attacks can be categorized into three types: by redistributing the demand via increasing the demand
 in some places (e.g., turning on appliances within a cer-
(i) Attacks that result in frequency instability: tain IP range) and decreasing the demand in others (e.g.,
An abrupt increase (similarly decrease) in the power turning off appliances within another IP range). These at-
demands–potentially by synchronously switching on or tacks, in particular, can cause failures in important high
off many high wattage IoT devices–results in an imbal- capacity tie-lines that connect two neighboring indepen-
ance between the supply and demand. This imbalance in- dent power systems–e.g., of neighboring countries.
stantly results in a sudden drop in the system’s frequency. (iii) Attacks that increase operating costs: When the
If the imbalance is greater than the system’s threshold, the demand goes above the day-ahead predicted value, con-
frequency may reach a critical value that causes genera- servatively assuming that there would be no frequency
tors tripping and potentially a large-scale blackout. For disturbances or line failures, the grid operator needs to
example, using state-of-the-art simulators on the small- purchase additional electric power from ancillary ser-
scale power grid model of the Western System Coordi- vices (i.e., reserve generators). These reserve generators
nating Council (WSCC), we show that a 30% increase in usually have higher prices than the generators commit-
the demand results in tripping of all the generators. For ted as part of day ahead planning. Therefore, using the
such an attack, an adversary requires access to about 90 reserve generators can significantly increase the power
thousand air conditioners or 18 thousand electric water generation cost for the grid operator but at the same time
heaters within the targeted geographical area. We also be profitable for the utility that operates the reserve gen-
study the effect of such an attack during the system’s re- erators. For example, we show by simulations that a 5%
starting process after a blackout (a.k.a. the black start) increase in the power demand during peak hours by an
and show that it can disrupt this process by causing fre- adversary can result in a 20% increase in the power gen-
quency instability in the system. eration cost. Hence, an adversary’s attack may rather be
(ii) Attacks that cause line failures and result in cas- for the benefit of a particular utility in the electricity mar-
cading failures: If the imbalance in the supply and de- ket than for damaging the infrastructure.
mand after the attack is not significant, the frequency of

16 27th USENIX Security Symposium USENIX Association
The MadIoT attacks’ sources are hard to detect and dis- connect by the grid operator due to their distributed na- ture. These attacks can be easily repeated until being ef- fective and are black-box since the attacker does not need Electricity Transformers Transmission Transformers Distribution Electricity Generator step up voltage Network step down Network Consumers to know the operational details of the power grid. These voltage or Loads properties make countering the MadIoT attacks challeng- ing. Nevertheless, we provide sketches of countermea- Figure 2: Main components of a power system. sures against the MadIoT attacks from both the power bus which is a node in the equivalent graph.1 Some of grid and the IoT perspectives. the buses may be connected to the distribution network Overall, our work sheds light upon the interdepen- of a city or a town and therefore represent the aggregated dency between the vulnerability of the IoT and that of load within those places. other networks such as the power grid whose security re- The instantaneous electric power generation and con- quires attention from both the systems security and the sumption are measured in watts ( ) and are calcu- power engineering communities. We hope that our work lated based on electric voltages and currents. Al- serves to protect the grid against future threats from in- most all the power systems deploy Alternating Cur- secure IoT devices. rents (AC) and voltages for transmitting electric power. The rest of this paper is organized as follows. Sec- This means that the electric cur- tion 2 provides a brief introduction to power systems. In rent and voltage at each location ܫሺݐሻ Section 3, we introduce the MadIoT attack and its vari- and each√point in time are equal to ations, and in Section 4, we demonstrate these attacks ( ) = √2 rms cos(2 + ) and via simulations. In Section 5, we present countermeasure ܸ ݐ ( ) = 2 rms cos(2 + ), in sketches against the MadIoT attacks. Section 6 presents െ which is the nominal frequency of the a summary of the related work, and Section 7 discusses system, and rms , rms and , are the Figure 3 the limitations of our work. Finally Section 8 provides root mean square (rms) values and the concluding remarks and recommendations. The central phase angles of the currents and voltages, respectively. results of the paper are self-contained in the above sec- In the U.S., Canada, Brazil, and Japan the power system tions. We refer the interested reader to the appendix for frequency is 60 but almost everywhere else it is an overview of recent blackouts and their connection to 50 . MadIoT attacks, and additional experimental results. Given the voltages and the currents, the active, re- active, and apparent power amplitudes absorbed by a 2 Power Systems Background load can be computed as = rms rms cos( − ), = In this section, we provide a brief introduction to power rms rms sin( − ), and = rms rms , respectively. systems. For more details, refer to [26, 27, 31, 62]. cos( − ) is called the power factor of a load. 2.1 Basics 2.2 Power Grid Operation and Control Power systems consist of different components (see Stable operation of the power grid relies on the persis- Fig. 2). The electric power is generated at power gen- tent balance between the power supply and the demand. erators at different locations with different capacities and This is mainly due to the lack of practical large scale elec- then transmitted via a high voltage transmission network trical power storage. In order to keep the balance between to large industrial consumers or to the lower voltage dis- the power supply and the demand, power system oper- tribution network of a town or a city. The power is then ators use weather data as well as historical power con- transmitted to commercial and residential consumers. sumption data to predict the power demand on a daily The main challenges in the operation and control of the and hourly basis [27]. This allows the system operators power systems are in the transmission network. More- to plan in advance and only deploy enough generators to over, since a distributed increase in power demand does meet the demand in the hours ahead without overloading not significantly affect the operation of the distribution any power lines. The grid operation should also comply network, we ignore the operational details of the distribu- with the − 1 security standard. The − 1 standard re- tion network and only consider it as an aggregated load quires the grid to operate normally even after a failure in within the transmission network. The term power grid a single component of the grid (e.g., a generator, a line, mainly refers to the transmission network rather that the or a transformer). distribution network. In power systems, the rotating speed of generators cor- The transmission network can have a very complex 1 The terms “bus” and “node” can be used interchangeably in this topology. Each intersection point in the grid is called a paper without loss of any critical information. USENIX Association 27th USENIX Security Symposium 17
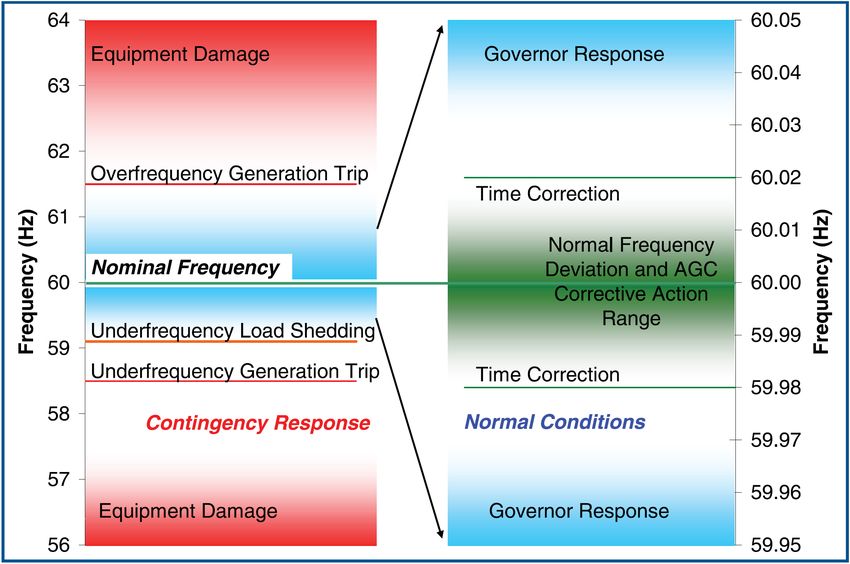
almost entirely determined and governed by Kirchhoff’s
 laws given the active and reactive power demand and sup-
 ply values. Besides the constraints on the power flows en-
 forced by Kirchhoff’s laws, there are other limiting con-
 straints that are dictated by the physical properties of the
 electrical equipment. In particular, each power line has a
 certain capacity of apparent power that it can carry safely.

 Unlike water or gas pipelines, the capacity constraint
 on a power line is not automatically enforced by its phys-
 ical properties. Once the power supply and demand val-
 ues are set, the power flows on the lines are determined
 based on Kirchhoff’s laws with no capacity constraints in
Figure 4: Normal and abnormal frequency ranges in North the equations. Thus, an unpredicted supply and demand
America. The figure is borrowed from [60]. setting may result in electric power overload on some of
respond to the frequency. When the demand gets greater the lines. Once a line is overloaded, it may be tripped by
than the supply, the rotating speeds of the turbine gen- the protective relay, or it may break due to overheating–
erators’ rotors decelerate, and the kinetic energy of the which should be avoided by the relay. Hence, the system
rotors are released into the system in response to the ex- operator needs to compute the power flows in advance–
tra demand. Correspondingly, this causes a drop in the using the predicted demand values and optimal set of gen-
system’s frequency. This behavior of turbine generators erators to supply the demand–to see if any of the lines will
corresponds to Newton’s first law of motion and is calcu- be overloaded. If so, the configuration of the generators
lated by the inertia of the generator. Similarly, the supply should be changed to avoid lines overload and tripping.
being greater than the demand results in acceleration of
the generators’ rotors and a rise in the system’s frequency.
 This decrease/increase in the frequency of the sys-
tem cannot be tolerated for a long time since frequencies 2.4 Voltage Stability
lower than the nominal value severely damage the gener-
ators. If the frequency goes above or below a threshold Besides power line thermal limits, the power flows on
value, protection relays turn off or disconnect the gen- the lines are limited by their terminating buses’ voltages.
erators completely (see Fig. 4 for normal and abnormal The voltages at the buses are controlled by maintaining
frequency ranges in North America). Hence, within sec- the level of the reactive power ( ) supply. Voltage in-
onds of the first signs of decrease in the frequency, the stability or as it is called voltage collapse occurs when
primary controller activates and increases the mechani- the generated reactive power becomes inadequate. This
cal input which increases the speed of the generator’s ro- is mainly due to changes in system configurations due to
tor and correspondingly the frequency of the system [26]. line failures, increase in active or reactive power demand,
 or loss of generators. Voltage collapse should be stud-
 Despite stability of the system’s frequency after the
 ied using - (characterizing the relationship between
primary controller’s response, it may not return to its
 the voltage at the terminating bus of a line to the reactive
nominal frequency (mainly due to the generators gener-
 power flow) and - (characterizing the relationship be-
ating more than their nominal value). Hence, the sec-
 tween the voltage at the terminating bus of a line to the
ondary controller starts within minutes to restore the sys-
 active power flow) analysis which is beyond the scope of
tem’s frequency. The secondary controller modifies the
 this paper, but for more details see [62, Chapter 7].
active power set points and deploys available extra gen-
erators and controllable demands to restore the nominal Voltage collapse results in the infeasibility of the power
frequency and permanently stabilizes the system. flow equations. Hence, it can be detected when the power
 flow solver fails to find a solution to the power flow equa-
2.3 Power Flows tion (usually after an initial change in the system). In
 The equality of supply and demand is a necessary con- such scenarios, the grid operator is forced to perform load
dition for the stable operation of the grid, but it is far from shedding (i.e., outage in part of the grid) in order to re-
being sufficient. In order to deliver power from genera- cover the system from a voltage collapse and make the
tors to loads, the electric power should be transmitted by power flow equations feasible again. Hence, even fail-
the transmission lines. The power transmitted on each ures in a few lines or an increase in the active/reactive
line in known as the power flow on that line. power demands may result in large scale outages around
 Unlike routing in computer networks, power flows are the grid due to voltage collapse.

18 27th USENIX Security Symposium USENIX Association
40 portant and direct ways that such attacks can cause dam-

 Shipments in million units
 33.00
 age to the grid (summarized in Table 2):
 30
 25.50

 20 17.50 1. Significant frequency drop/rise: As briefly described
 12.00
 10
 in Section 2, the normal operation of the power grid relies
 7.50
 5.00 on the persistent balance between the supply and demand.
 2.50
 0
 2014 2015 2016 2017 2018 2019 2020
 Thus, an adversary’s approach could be to disrupt this
 Year balance using an IoT botnet. An adversary can leverage
 an IoT botnet of high-wattage devices and synchronously
Figure 5: Estimated number of homes with smart thermostats in
North America in millions. Data is obtained from Statista [56].
 switch on all the compromised devices. If the resulting
 sudden increase in the demand is greater than a thresh-
3 Attacking the Grid Using an IoT Botnet old, which depends on the inertia of the system, it can
 In this section, we reveal attack mechanisms that can cause the system’s frequency to drop significantly before
utilize an IoT botnet of high wattage devices to launch a the primary controllers can react. This consequently may
large-scale coordinated attack on the power grid. result in the activation of the generators’ protective relays
 and loss of generators, and finally a blackout. Sudden de-
3.1 Threat Model crease in the demand may also result in the same effect
 We assume that an adversary has already gained access but this time by causing a sudden rise in the frequency.
to an IoT botnet of many high wattage smart appliances An adversary can further increase its success by strate-
(listed in Table 1) within a city, a country, or a continent. gic selection of the timing of an attack using the online
Since most of the IoT devices are controlled using mo- data available via the websites of Independent System
bile phone applications, access to users’ mobile phones Operators (ISOs)3 (e.g., daily fuel mix and live updates
or corresponding applications can also be used to control of the demand values.) For example, we know that as the
these devices [28]. This access can potentially allow the share of renewable resources in the power generation in-
adversary to increase or decrease the demand in different creases, the inertia of the system decreases. Therefore,
locations remotely and synchronously. The adversary’s an attack that is coordinated with the time that renewable
power to manipulate the demand can also be translated penetration is highest, is more effective in causing large
into watts ( ) using the numbers in Table 1 and based changes in the frequency. Similarly, an attack during the
on the type and the number of devices to which it has peak hours can result in a slow yet persistent frequency
access. drop in the system. Such an attack may exhaust the con-
 For example, if we consider only the houses with smart troller reserves and force the system operator to perform
thermostats in 2018 as shown in Fig. 5 and assuming that load shedding. This may result in power outages in sev-
each thermostat only controls two 1 air condition- eral parts of the system if the situation is handled well
ers, an attacker can potentially control 35 of electric by the operator, or in a large-scale blackout if it is mis-
power2 –even a fraction of which is a significant amount. handled and the system’s frequency keeps dropping. Ac-
Recall that in the case of the Mirai botnet, the attackers cording to the European Network of Transmission Sys-
could get access to about 600 thousand devices within a tem Operators for Electricity (ENTSOE) guidelines, if
few months [12]. the frequency of the European grid goes below 47.5
 The 35 is computed by only considering the ther- or above 51.5 , a blackout can hardly be avoided [25].
mostats connected to a few air conditioners. By con-
 2. Disrupting a black start: Once there is a blackout,
sidering all the smart air conditioners as well as other
 the grid operator needs to restart the system as soon as
high wattage appliances such as water heaters, this value
 possible. This process is called a black start. Since the
would be much higher. Moreover, this amount will grow
 demand is unknown at the time of a black start, restarting
in the future as the trend shows in Fig. 5.
 the whole grid at the same time may result in frequency
 We call the attacks under this threat model the
 instability and system failure again. Hence, in a black
Manipulation of the demand via IoT (MadIoT) attacks.
 start, the operator divides the system into smaller islands
In the next subsection, we provide the details of various
 and tries to restart the grid in each island separately. The
types of attacks that can be performed by an adversary.
 islands are then connected to increase the reliability of
3.2 MadIoT Attack Variations the system.
 MadIoT attacks can disrupt the normal operation of the Since the grid is partitioned into smaller islands at
power grid in many ways. Here, we present the most im-
 3 The system operators are given different names in different coun-
 2 For the sake of comparison, this amount is equal to 7% of the entire tries and continents, but here for the sake of simplicity, we refer to all
U.S. 2017 Winter peak demand (about 500 ) [10]. of them as ISOs.

USENIX Association 27th USENIX Security Symposium 19
Table 2: MadIoT attack variations. The botnet size is in bots/ which is the number of bots required to perform a successful
variation of the MadIoT attack, if the total demand in the system is 1 . All the bots are assumed to be air conditioners.
 # Goal Attack action Initial impact Botnet size Simulation results
 1 Grid frequency rise/drop Synchronously switching on/off all the bots Generation tripping 200–300 Figs. 8,7,9
 Synchronously switching on all the bots
 2 Disrupting grid re-start Generation tripping 100–200 Fig. 11
 once the power restarts after a blackout
 3 Synchronously switching on or off the bots Lines tripping
 Line failures and cascades 4–10 Figs. 12,13,15
 in different locations
 Synchronously switching on (off) the bots in
 4 Failure in tie-lines Tie-lines tripping 10–15 Fig. 16
 importing (exporting) end of a tie-line
 Slowly switching on the bots during power Utilizing power
 5 Increasing the operating cost 30–50 Fig. 17
 demand peak hours generation reserve

the time of a black start, the inertia of each part is low of the demand increase only attack.
and therefore the system is very vulnerable to demand
 4. Failures in the tie-lines: Tie-lines between the ISOs
changes. Thus, an adversary can significantly hinder the
 are among the most important lines within an intercon-
black start process by suddenly increasing the demand us-
 nection. These tie-lines are usually used for carrying
ing the IoT botnet once an island is up. This can cause a
 large amounts of power as part of an exchange program
large frequency disturbance in each island and cause the
 between two ISOs. Failure in one of these lines may re-
grid to return to the blackout state.
 sult in a huge power deficit (usually more than 1 ) in
3. Line failures and cascades: Recall from Section 2.3 the receiving ISO and most likely a blackout due to the
that the power flows in power grids are determined by subsequent frequency disturbances or a large-scale out-
the Kirchhoff’s laws. Therefore, most of the time, the age due to load shedding by the grid operator.
grid operator does not have any control over the power Due to their importance, the tie-lines can be the tar-
flows from generators to loads. Once an adversary causes get of an adversary. An adversary can observe the actual
a sudden increase in the loads all around the grid, assum- power flows on the tie-lines through ISOs’ websites, and
ing that the frequency drop is not significant, the extra target the one that is carrying power flow near its capac-
demand is satisfied by the primary controller. Since the ity. In order to overload that line, all the adversary needs
power flows are not controlled by the grid operator at this to do is to turn on the high wattage IoT devices in the
stage, this may result in line overloads and consequent area at the importing end of the line and turn off the ones
lines tripping. at the exporting end (using the IP addresses of the de-
 vices).4 This can overload the tie-line and cause it to trip
 After initial lines tripping or failures, the power flows by triggering its protective relay.
carried by these lines are redistributed to other lines based
on Kirchhoff’s laws. Therefore, the initial line failures 5. Increasing the operating cost: When the demand
may subsequently result in further line failures or, as it is goes above the predicted value, the ISO needs to purchase
called, a cascading failure [54]. These failures may even- additional electric power from ancillary services (i.e., re-
tually result in the separation of the system into smaller serve generators). These reserve generators usually have
unbalanced islands and a large-scale blackout. a higher price than the generators committed as part of
 the day ahead planning. Thus, using the reserve genera-
 Moreover, failure in a few lines accompanied by an in-
 tors can significantly increase the power generation cost
crease in the power demand may result in a voltage col-
 for the grid operator but at the same time be profitable for
lapse (recall from Section 2.4) which consequently would
 the utility that operates the reserve generator.
force the grid operator to perform load shedding. Hence,
in some steps during the cascade, there are more outages Hence, the goal of an adversary’s attack may be to ben-
due to load shedding. efit a particular utility in the electricity market rather than
 to damage the infrastructure. The adversary can achieve
 An adversary may also start cascading line failures by this goal by slowly increasing the demand (e.g., switch-
redistributing the loads in the system by increasing the ing on a few devices at a time) at a particular time of the
demand in a few locations and decreasing the demand in day and in a certain location. Moreover, it may reach out
others in order to keep the total demand constant. This
redistribution of the demand in the system may result in 4 A sudden increase in the demand, only at the importing end of the

line failures without causing any frequency disturbances. tie-line, may also result in its overload. This is due to the fact that once
 there is an imbalance between the supply and demand, all the generators
The advantage of this attack is that it may have the same
 within an interconnection (whether inside or outside of the particular
effect without attracting a lot of attention from the grid ISO) respond to the imbalance which consequently results in an increase
operator. It can be considered to be a stealthier version in the power flow on the tie-line.

20 27th USENIX Security Symposium USENIX Association
to utilities to act in their favor in return for a payment. in completely different power flows in the grid. Hence,
 although losing a generator may not result in any is-
 Overall, the above attacks demonstrate that an adver- sues as planned, increase in the demands by an adver-
sary as described in Section 3.1 has tremendous power to sary may result in many line overloads. Moreover, the
manipulate the operation of the grid in many ways which imbalance caused by an adversary may surpass the im-
were not possible a few years ago in the absence of IoT balance caused due to losing the largest generator, and
devices. therefore results in unpredicted frequency disturbances.
 For example, the capacity of the largest operating gener-
3.3 Properties and Defensive Challenges ator in the system may be 1 (usually a nuclear power
 The MadIoT attacks have unique properties that make plant) which can be surpassed by an attack comprising
them very effective and at the same time very hard to de- more than 100 thousand compromised water heaters.
fend against. In this subsection, we briefly describe some Despite these difficulties, we provide sketches of coun-
of these properties. termeasures against the MadIoT attacks in Section 5.
 First, the sources of the MadIoT attacks are very hard
to detect and disconnect by the grid operator. The main 3.4 Connection to Historical Blackouts
reason is that the security breach is in the IoT devices, yet There have been several large-scale blackouts in the
the attack is on the power grid. The grid operator cannot past two decades around the world. Although these
easily detect which houses are affected since it only sees events were not caused by any attacks, the chain of events
the aggregation of the distributed changes in the demand that led to these blackouts could have been initiated by a
around the grid. At the same time, the attack does not MadIoT attack. For example, the initial reactive power
noticeably affect the performance of the IoT devices, es- deficit in Ohio in 2003 leading to the large-scale blackout
pecially if the smart thermostat is attacked. Moreover, in the U.S. and Canada [60], and the failures in the tie-
the attack may not be noticeable by the households since lines connecting Italy to Switzerland in 2003 leading to
the changes are temporary and can be considered as part the complete shutdown of the Italian grid [59], could have
of the automatic temperature control. been caused by MadIoT attacks. Most of these events
 Second, the MadIoT attacks are easy to repeat. An ad- happened beacuse the systems’ operators were not pre-
versary can easily repeat an attack at different times of pared for the unexpected initial event. Hence, the Ma-
the day and different days to find a time when the attack dIoT attacks could result in similar unexpected failures.
is the most effective. Moreover, this repeatability allows We reviewed a few of the recent blackouts in the power
an adversary to cause a persistent blackout in the power grids around the world and demonstrated how an adver-
grid by disrupting the black start process as described in sary could have caused similar blackouts. The details of
the previous subsection. these events are relegated to Appendix A.
 Third, the MadIoT attacks are black-box. An adversary
does not need to know the underlying topology or the de- 4 Experimental Demonstrations
tailed operational properties of the grid, albeit it can use In this section, we demonstrate the effectiveness of
the high-level information available on the ISOs’ web- the MadIoT attacks on real-world power grid models via
sites to improve the timing of its attack. It can also use state-of-the-art simulators. Recall that the MadIoT at-
the repeatability of these attacks and general properties tacks are black-box. Therefore, the outcome of an at-
of the power grids to achieve and perform a successful tack highly depends on the operational properties of the
attack. targeted system at the time of the attack (e.g., genera-
 Finally, power grids are not prepared to defend against tors’ settings, amount of renewable resources, and power
the MadIoT attacks, since abrupt changes in the demand flows). We emphasize this in our simulations by chang-
are not part of the contingency list that grid operators are ing the power grid models’ parameters to reflect the daily
prepared for. As mentioned in Section 2, power grids changes in the operational properties of the system.
are required to operate normally after a failure in a single
component of the grid (the − 1 standard). Therefore, 4.1 Simulations Setup
the daily operation of the grid is planned such that even a Our results are based on computer simulations. In par-
failure in the largest generator does not affect its normal ticular, we use the MATPOWER [65] and the Power-
operation. World [7] simulators. MATPOWER is an open-source
 The scenarios predicted by the − 1 standard, how- MATLAB library which is widely used for computing the
ever, are quite different from the scenarios caused by the power flows in power grids. PowerWorld, on the other
MadIoT attacks. Although an increase in the demand can hand, is an industrial-level software suite that is widely
be similar to losing a generator from the supply and de- used by the industry for frequency stability analysis of
mand balance perspective, these two phenomena result power systems. We used the academic version of Power-

USENIX Association 27th USENIX Security Symposium 21
(a) (b)
 Figure 7: Frequency disturbances due to unexpected demand
 increases in all the load buses in the WSCC system caused by an
 adversary, ignoring generators’ frequency cut-off limit (shown
 by red dashed line). Increase by (a) 23 and (b) 30 .
Figure 6: The WSCC 9-bus system. The generators at buses 2
and 3 are the buses with inertia, and the generator at bus 1 is a switching on/off 1,000 bots. Therefore, we can define the
slack bus with no inertia. The slack bus is a bus in the system normalized botnet size in bots/ to be the number of
that can change its generation to make the power flow equations bots required to perform a successful variation of the Ma-
feasible. The load buses are buses 5, 6, and 8. We consider two dIoT attack, if the total demand in the system is 1 .
operational settings of the WSCC system: (a) high inertia, in By this definition, it is easy to see that to increase the
which both generators 2 and 3 have inertia constants ( ) equal demand of any system by 1%, an adversary requires 10
to 15 , and (b) low inertia, in which generators 2 and 3 have in-
 bots/ .
ertia constants equal to 5 and 10 , respectively [51, Chapter 3].
In all the simulations, the IEEE type-2 speed-governing model 4.2 Frequency Disturbances
(IEEE-G2) is used for the generators [44].
 In this subsection, we evaluate the first two MadIoT
World. attack variations described in Section 3.2. We consider
 For frequency stability analysis in PowerWorld, to the two operational settings of the WSCC system: (a) high
best of our knowledge, there are no large-scale real-world inertia and (b) low inertia (for details see Fig. 6).
power grids available for academic research. Hence, for
evaluating the effects of the MadIoT attacks on the sys- 4.2.1 200–300 Bots per Can Cause Sudden
tem’s frequency, we use the WSCC 9-bus grid model that Generation Tripping
represents a simple approximation of the Western System In order to show the frequency response of the system
Coordinating Council (WSCC)–with 9 buses, 9 lines, and to sudden increases in the demand, we simulated the in-
315 of demand [35]. Despite its small size, due to crease of (a) 23 and (b) 30 in all the loads for
the complexity of power systems transient analysis, it is the high inertia and low inertia cases. These values can
widely used as a benchmark system [22, 48, 52]. roughly be considered as 20% and 30% increases in the
 For evaluating the effects of MadIoT attacks on the load buses, respectively. We similarly studied the fre-
power flows, however, we use the Polish grid which is one quency response of the system to sudden decreases of the
of the largest and most detailed publicly available real- demand. Figs. 7 and 8 present the results.
world power grids. To the best of our knowledge, there As mentioned in Section 2, the generators are protected
are no other real power grids at this scale and detail avail- from high and low frequency values by protective relays.
able for academic research.5 We use the Polish grid data These values depend on the type of a generator as well as
at its Summer 2004 peak–with 2736 buses, 3504 lines, the settings set by the grid operator. Here, we assume the
and 18GW of demand–and at its Summer 2008 peak–with safe frequency interval of 58.2 and 61.2 which is
3120 buses, 3693 lines, and 21GW of demand. Both are common in North America (see Fig. 4). Once a generator
available through the MATPOWER library. goes below or above these values, it gets disconnected
 Since the total demand in the WSCC system is from the grid by protective relays.
315 , but the total demand in the Polish grid is about As can be seen in Figs. 7(b) and 8(b), sudden increase
20 , for comparison purposes, we focus on the per- or decrease in the load buses by 30% or 20%, respectively,
centage increase/decrease in the demand caused by an cause the system’s frequency to go below or above the
attack instead of the number of switching on/off bots. frequency cut-off limits. Hence, an adversary requires
However, if we assume that all the bots are air condition- 200–300 bots/ , or in this case 60–90 thousand bots,
ers, 1 change in the demand corresponds simply to to perform these attacks.
 5 Topologies of other power grids may also be available through uni- As can be seen, however, the drop/rise in frequency
versity libraries, but they are limited to the topology with no extra in- is higher in the low inertia case (as predicted). There-
formation on the operational details. fore, there are cases in which the frequency may go be-

22 27th USENIX Security Symposium USENIX Association
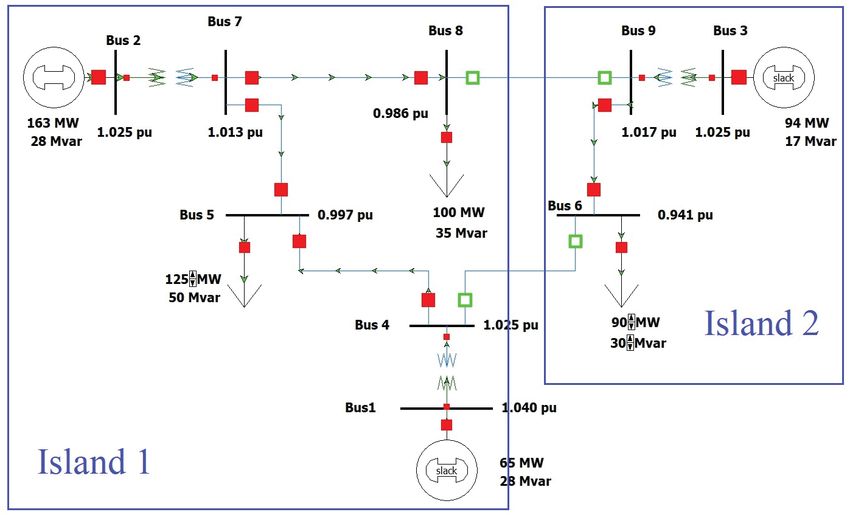
(a) (b)
Figure 8: Frequency disturbances due to unexpected demand
decreases in all the load buses in the WSCC system by an ad-
versary, ignoring generators’ frequency cut-off limit (shown by
red dashed line). Decrease by (a) 15 and (b) 20 .
 Figure 10: The WSCC 9-bus system during the black start.

 65 65 usually done by restarting the grid in parallel in discon-
 Low Inertia Low Inertia
 High Inertia High Inertia
 nected islands and then reconnecting the islands.
Frequency (Hz)

 Frequency (Hz)

 Fig. 10 shows one way of partitioning the WSCC sys-
 60 60
 tem into two islands. We assume that initially the grid
 operator could restart the two islands and stabilize the
 55 55
 frequency at 60 . Then, before the two islands are re-
 0 2 4 6 8 0 2 4 6 connected, an adversary increases the demand at all the
 Time (sec) Time (sec)
 load buses with the same amount (see Fig. 11).
 (a) (b)
 The attack is performed at time 30 and the two islands
Figure 9: Frequency disturbances due to unexpected demand
 are reconnected at time 50. As can be seen in Fig. 11(a),
changes in all the load buses in the WSCC system by an adver-
 when there are no attacks, the two islands are reconnected
sary, considering generators’ frequency cut-off limits (shown
by red dashed lines). (a) Demand increase of 30 and (b) with an initial small disturbance in the frequency and then
demand decrease of 20 . the system reaches a stable state.
 Fig. 11(b) shows the frequency of the system after
low/above the critical frequency in the low inertia case
 20 increase in all the load buses at time 30. In this
but may remain in the safe interval in the high inertia
 case, the frequency goes slightly below the minimum safe
case (see Figs. 7(a) and 8(a)). This suggests that an at-
 limit, but it is common in the black start process that the
tack that is not effective today, may be effective tomorrow
 generators’ lower (upper) frequency limits are set to lower
if the system’s inertia is lower due to a higher rate of re-
 (higher) levels than usual. Hence, the system may reach
newable generation.
 a stable state in this case as well.
 In Figs. 7 and 8, the frequency cut-off limits of the
generators are ignored. Hence, the generators are kept As can be seen in Fig. 11(c), a 30 increase in all
online even when the frequency goes beyond the safe the loads causes a large disturbance in the frequency, but
operational limits. In reality, however, these generators as the two islands are reconnected the system’s frequency
are disconnected from the grid by the protective relays. is completely destabilized. These substantial deviations
Fig. 9 presents the frequency response of the system when from safe frequency ranges can cause serious damage to
the protective relays are enabled for the cases shown in the generators and are not permitted even in the black
Figs. 7(b) and 8(b). As can be seen, the grid completely start process. Hence, in this case the system returns to
shuts down and the simulations stop in less than 10 sec- the blackout stage. Even if the grid operator decides not
onds due to disconnection of the generators. to reconnect the two islands due to the frequency distur-
 bances, Fig. 11(d) shows a significant drop in the sec-
 Simulation results in this subsection demonstrate that
 ond island’s frequency that results in disconnection of the
the effectiveness of an attack in causing a critical fre-
 generators. Therefore, even if the big drop in frequency
quency disturbance depends on the attack’s scale as well
 of island 1 (1 below the safe limit) is acceptable dur-
as the system’s total inertia at the time of the attack.
 ing the black start, island 2 goes back to the blackout state.
4.2.2 100–200 Bots per Can Disrupt the Grid For comparison purposes and to reflect on the role of
 Re-start the operational properties of the system on the outcome
 Once there is a blackout, the grid operator needs to of an attack, we repeated the same set of simulations
restart the system as soon as possible (a.k.a. a black start). with different maximum power outputs for the genera-
As mentioned in Section 3.2, due to frequency instability tors’ governors (see Fig. B.1 in the appendix). We ob-
of the system at the black start, the restarting process is served that under the new settings, demand increases of

USENIX Association 27th USENIX Security Symposium 23
61 61
 Freq. Island 1 Freq. Island 1 5
 Freq. Island 2 Freq. Island 2
 Frequency (Hz)

 Frequency (Hz)
 60 60

 59 59 4
 58 58
 3
 57 57
 0 50 100 0 50 100
 Time (sec) Time (sec)
 2
 (a) (b)
 100 62
 Freq. Island 1 Freq. Island 1 1
 Freq. Island 2 Freq. Island 2
Frequency (Hz)

 Frequency (Hz)

 80 60

 60 58 Figure 12: The cascading line failures initiated by a 1% increase
 in the demand in the Polish grid 2008 by an adversary (colors
 40 56
 show the cascade step at which a line fails). It caused failures
 20 54 in 263 lines and 86% outage.
 0 50 100 0 50 100
 Time (sec) Time (sec)

 (c) (d)
Figure 11: Frequency disturbances during the black start due 4
to unexpected increases in all the load buses by an adversary,
ignoring generators’ frequency cut-off limits (shown by red
dashed lines). (a) Normal black start in the absence of an adver- 3
sary. (b) Demand increases of 20 at the load buses before
the reconnection of the two islands. (c) Demand increases of
30 at the load buses before the reconnection of the two is-
 2
lands. (d) Demand increases of 30 at the load buses with-
out attempting to reconnect the two islands due to frequency
 1
instabilities.
up to 10 results is a successful black start, unlike the
previous case which could handle demand increases of Figure 13: The cascading line failures initiated by a 10% in-
 crease in the demand in the Polish grid 2004 by an adversary
20 at all the loads. Hence, an adversary requires at
 (colors show the cascade step at which a line fails). It caused
least 100–200 bots/ , or in this case 30–60 thousand failures in 11 lines and 46% outage.
bots, to increase the demand at all the loads by 10–20%
and disrupt the black start. Here again we observe that the supply and demand, since this balancing is unplanned,
the operational properties of the grid play an important it may cause line overloads.
role in the outcome of an attack. To demonstrate this, we assume that an adversary in-
 creases the demand at all the load buses by 1%. We also
4.3 Line Failures and Cascades assume that all the generators contribute proportionally
 In this subsection, we demonstrate the effectiveness of to their capacities to compensate for this sudden increase
the third and the fourth variations of the MadIoT attacks in the demand. This attack results in a single line fail-
described in Section 3.2. For simulating the cascading ure in the Polish grid 2004 but no outages. However, as
line failures, we use the MATLAB code developed by can be seen in Fig. 12, the same attack on the Polish grid
Cetinay et al. [18]. We had to slightly change the code to 2008 results in the cascade of line failures that lasts for
make it functional in the scenarios studied in this paper. 5 rounds, causes 263 line failures, and 86% outage. The
To evaluate the severity of the cascade, we define outage 1% increase in the total demand in the Polish grid 2008
as the percent of the demand affected by the power outage is roughly equal to 210 , requiring the adversary to
at the end of the cascade over the initial demand. access to 10 bots/ which is about 210 thousand air
 conditioners in this case. This number is equal to 1.5%
4.3.1 Only 10 Bots per Can Initiate a Cascad- of the total number of households in Poland [58].
 ing Failure Resulting in 86% Outage Since the Polish grid 2004 showed a good level of ro-
 As described in Section 3.2, once an adversary causes bustness against the 1% increase attack, we re-evaluated
a sudden increase in the demand, if it does not result in its robustness against a 10% increase in the demand.
a major frequency drop, the primary controllers at gen- Fig. 13 shows the resulting line failures and the subse-
erators are automatically activated to compensate for the quent cascade caused by this attack. It can be seen that
imbalance in the supply and demand. Despite balancing this attack causes much more damage with 11 line fail-

24 27th USENIX Security Symposium USENIX Association
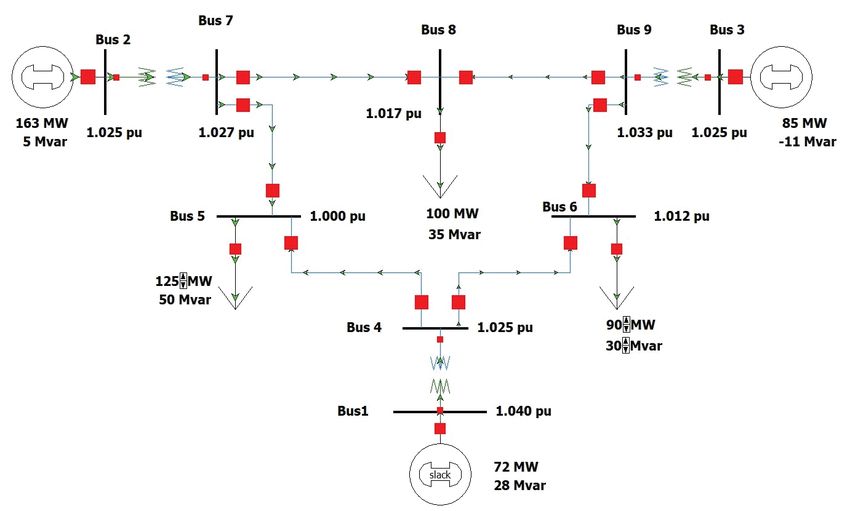
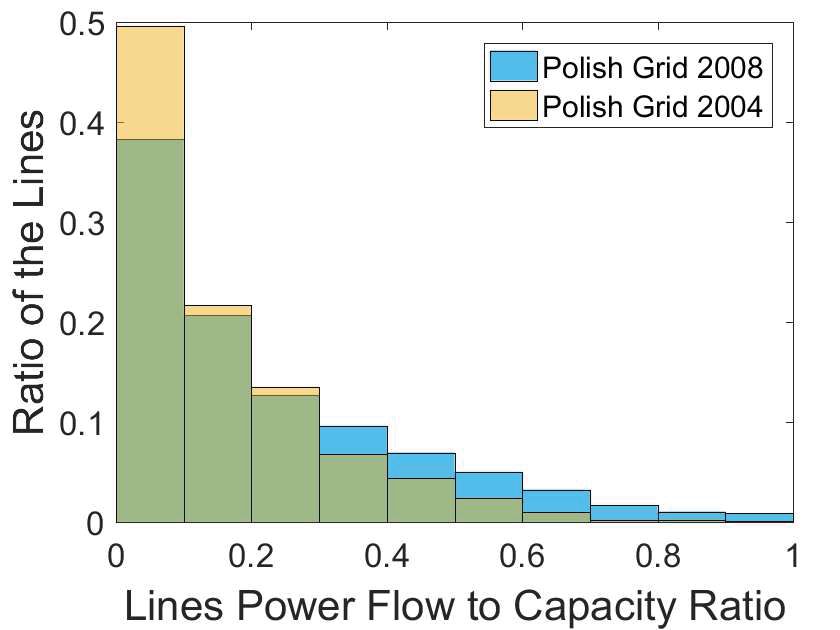
3

 2

Figure 14: Histogram of the Polish grid lines’ power flow to 1
capacity ratio in Summer 2004 compared to Summer 2008.
ures and 46% outage. Despite the effectiveness of the
 Figure 15: The cascading line failures initiated in the Polish grid
second attack, the Polish grid 2004 shows greater level
 2008 by redistributing the demand by an adversary. Demand of
of robustness than the Polish grid 2008 even under a 10- the loads buses with demand greater than 20 are changed
time stronger attack. Although this may be due to many by with a Gaussian distribution with zero mean and standard
factors such as online generator locations and their val- deviation 1 (colors show the cascade step in which a line
ues, topology of the grid, and even number of lines [54], fails). It caused failures in 77 lines and 85% outage.
one possible factor is how initially saturated the power
 mand greater than 20 . This can be estimated by the
lines are.
 adversary from the total number of IoT bots in a city or
 Fig. 14 presents the histogram of the Polish grid lines’ a town. The number of bots is correlated with the popu-
power flow to capacity ratio in Summer 2004 compared lation of an area and therefore the total demand. Hence,
to Summer 2008. There are about 10% more lines with an adversary detects these load buses and decreases or in-
flow to capacity ratio below 0.1 in the Polish grid 2004 creases the demands by a random value such that the total
compared to the Polish grid 2008. Consequently, there demand increase and decrease sum up approximately to
are more lines with power flow to capacity ratio greater zero. We assume this can be done by randomly increasing
than 0.3 in the Polish grid 2008 than in the Polish grid or decreasing the demand by a Gaussian random variable
2004 (to see the locations of the near saturated lines see with zero mean and selected standard deviation.
Fig. B.2 in the appendix). This clearly demonstrates that
 Again, the Polish grid 2004 showed a great level of
a small increase in the demand is more likely to cause line
 robustness against these attacks. Even if an adversary
overloads in the Polish grid 2008 than in the Polish grid
 decreases or increases the demand randomly by a Gaus-
2004 (as observed in Figs.12 and 13).
 sian random variable with zero mean and standard devia-
 Overall, as in the previous subsection, the results tion 10 at loads with demand greater than 20 ,
demonstrate that the effectiveness of an attack depends it only results in three line failures without any outages.
on the status of the grid at the time of the attack. How- However, the same attack with 10-time smaller changes,
ever, unlike the large botnet size (about 300 bots/ ) results in serious damage to the Polish grid 2008. As
required to cause a blackout from frequency instability in can be seen in Fig. 15, making only small changes with
the system, we observe here that even botnet size of 10 standard deviation of 1 at load buses with demands
bots/ can result in a significant blackout depend- greater 20 results in cascading line failures with
ing on the grid’s operational properties. Albeit the black- 77 line failures and outage of 85%. The total absolute
outs caused by frequency instabilities happen much faster value of the demand changes in this attack was about
(within seconds) than those caused by cascading line fail- 80 which means that an adversary only requires 4
ures (within minutes or even hours). bots/ , or in this case 80 thousand bots, to perform
4.3.2 Only 4 Bots per Can Initiate a Cascad- such an attack.
 ing Failure Resulting in 85% Outage by Redis- Although these changes are made randomly, due to the
 tributing the Demand stealthy nature of these attacks they can be repeated with-
 out attracting any attention until they are effective.
 Another way of causing line failures and possibly cas-
cading line failures in the grid is by redistributing the 4.3.3 Only 15 Bots per Can Fail a Tie-line by
demand without increasing the total demand. As men- Increasing (Decreasing) the Demand of the Im-
tioned in Section 3.2, the advantage of this attack is that porting (Exporting) ISOs
it may have a similar effect to the demand increase attack In order to demonstrate an attack on the tie-lines as de-
without attracting the grid operators’ attention due to fre- scribed in Section 3.2, since we do not have access to the
quency disturbances. European grid or the U.S. Eastern Interconnection, we
 Here, an adversary focuses only on the loads with de- modified the Polish grid 2008 in a principled manner to

USENIX Association 27th USENIX Security Symposium 25
1
 25 25

 Op Cost Increase (%)

 Op Cost Increase (%)
 5 Reserved Gen. 5 Reserved Gen.
 0.8 20 10 Reserved Gen. 20 10 Reserved Gen.

 15 15
 0.6
 10 10
 0.4
 5 5

 0.2 0 0
 1 2 3 4 5 1 2 3 4 5
 0
 Power Demand Increase (%) Power Demand Increase (%)

 (a) (b) (a) (b)
Figure 16: Tie-line vulnerabilities in the partitioned Polish grid Figure 17: Increase in the operating cost of the Polish grid 2004
2008. (a) The ratios of tie-lines’ power flows to their nominal by an adversary. The initial demand is 10% higher than the
capacity. (b) Failures in the tie-lines between the yellow area original demand during the Summer 2004 morning peak. (a)
and the light blue area caused by decreasing the demand by 1.5% If the operating costs of the reserve generators are linear func-
in the former and increasing the demand by 1.5% in the latter tions 1 ( ) = 100 , and (b) if the operating costs of the reserve
by an adversary. Failed lines are shown in black. generators are quadratic functions 2 ( ) = 5 2 + 100 .

represent a few neighboring ISOs in Europe connected by may result in a huge imbalance in the supply and demand
a few tie-lines. values and in uncontrollable frequency drop leading to an
 First, we used a spectral clustering method to partition inevitable blackout.
the Polish grid into 5 areas with a few connecting tie- Attacks on the tie-lines are an effective approach when
lines. This is done using MATLAB’s Community De- an adversary has a limited number of bots. By discon-
tection Toolbox [34, 36]. Since the Polish grid does not necting an ISO from its neighboring ISOs, an adversary
inherently have 5 areas, however, the number of tie-lines can cause a huge demand deficit in the targeted ISO and
between areas is slightly more than those of the European possibly a large-scale blackout.
grid or Eastern Interconnection. Therefore, we removed 4.4 Increasing the Operating Cost
one fifth of the tie-lines. In order to make the power flows
feasible then, we reduced the total supply and demand In this final subsection, we evaluate the last variation of
by 60% and increased the capacity on the lines that were the MadIoT attacks described in Section 3.2. In this vari-
overloaded. ation of the attacks, an adversary increases the demand
 not to necessarily cause a blackout, but rather to signifi-
 Fig. 16(a) shows the modified grid along with the ratios
 cantly increase the operating cost of the grid in favor of a
of tie-lines’ power flows to their nominal capacities. As
 utility in the electricity market.
can be seen, similarly to the real grid operation, some of
these tie-lines are carrying power flows near their capac- 4.4.1 50 Bots per Can Increase the Operating
ities. These lines–which can be detected through some Cost by 20%
of the ISOs’ websites [5]–are the most vulnerable to this For these simulations, we use the Polish grid in Sum-
variation of the MadIoT attacks. mer 2004. However, in order to mainly focus on the cost
 For example, as can be seen in Fig. 16(a), the two lines related issues, we increase the line capacities to make sure
that are connecting the yellow area to the light blue area that the attack causes no line overloads. To simulate the
are carrying power flows near their capacities. Therefore, system in its peak demand state, we increase the initial
increasing the demand in the light blue area and decreas- demand by 10% to make the demand before the attack
ing the demand in the yellow area (corresponding to the close to the online generators’ generation capacity.
direction of the power flow on the lines) can potentially We assume that the sudden increase in the demand
result in those lines tripping. It can be seen in Fig. 16(b) caused by the attack can temporarily be handled by the
that a 1.5% decrease in the demand of the yellow area and primary controller and no large frequency drops as in
a 1.5% increase of the demand in the light blue area by Section 4.2 happen in any of the scenarios here. There-
an adversary results in the failure of the two tie-lines (ad- fore, our focus is on the cost of the required reserve gen-
ditional attacks on the other tie-lines are demonstrated in erators for providing the additional power and returning
Figs. B.3(a) and B.3(b) in the appendix). Hence, an ad- the system’s frequency back to 60 (or 50 ).
versary can cause a failure in a tie-line by only a botnet We consider two cases, one with 5 reserve generators,
of size 15 bots/ , or in this case 60 thousand bots (30 and the other one with 10. We also consider two possible
thousand bots at each end of the tie-line). cost functions for the reserve generators: 1 ( ) = 100
 Since the tie-lines usually carry substantial amounts of and 2 ( ) = 5 2 + 100 , in which is in and the
power, failure in these lines can result in cascade of line ( )s are in $∕ℎ . The linear and quadratic cost func-
failures in other lines and eventually in disconnection of tions are the most common functions for approximating
an ISO from the interconnection. Such a disconnection the generation costs [62, Chapter 3]. The 1 ( ) is selected

26 27th USENIX Security Symposium USENIX Association
You can also read