Marine Estate Research Report - Developing the capacity to monitor the spatial and temporal distributions of jellyfish in western Scottish waters
←
→
Page content transcription
If your browser does not render page correctly, please read the page content below
Marine Estate Research Report

Developing the capacity to monitor the spatial and temporal
distributions of jellyfish in western Scottish waters
Developing the capacity to monitor the spatial and temporal

          distributions of jellyfish in western Scottish waters

    Thom Nickell1, Keith Davidson1, Clive Fox1, Peter Miller2 & Graeme Hays3

                     1
                      Scottish Association for Marine Science,
          Scottish Marine Institute, Oban, Argyll, PA37 1QA, Scotland, UK
2
Remote Sensing Group, Plymouth Marine Laboratory, Prospect Place, The Hoe
                         Plymouth PL1 3DH, England, UK
      3
       Swansea University, Singleton Park, Swansea SA2 8PP, Wales, UK

                                         i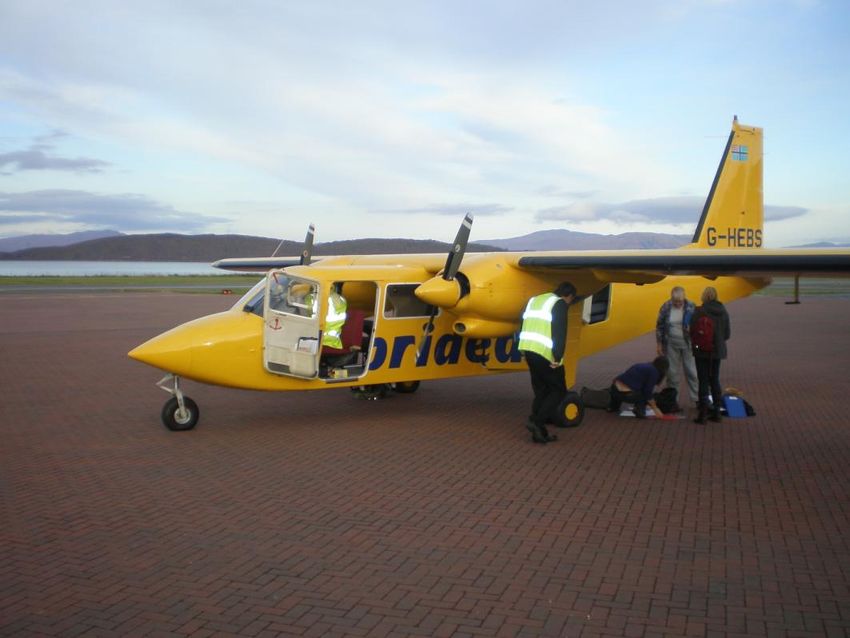
© Crown Copyright 2010
ISBN: 978-1-906410-23-0
Published by The Crown Estate on behalf of the Marine Estate.
This report is available on The Crown Estate website at:
www.thecrownestate.co.uk

Dissemination Statement
This publication (excluding the logos) may be re-used free of charge in any format
or medium. It may only be re-used accurately and not in a misleading context.
The material must be acknowledged as Crown Estate copyright and use of it must
give the title of the source publication. Where third party copyright material has
been identified, further use of that material requires permission from the copyright
holders concerned.

Disclaimer
The opinions expressed in this report are entirely those of the authors and do not
necessarily reflect the view of The Crown Estate, and The Crown Estate is not
liable for the accuracy of the information provided or responsible for any use of
the content.

Suggested Citation
Nickell, T., Davidson, K., Fox, C., Miller, P., Hays, G. 2010.
„Developing the capacity to monitor the spatial and temporal distribution of
jellyfish in western Scottish waters‟.
The Crown Estate, 70 pages. ISBN: 978-1-906410-23-0.

Project partners

Clive Fox, Keith Davidson & Thom Nickell - Scottish Association for Marine
Science, Scottish Marine Institute, Oban, Argyll, PA37 1QA, Scotland, UK

Peter Miller, Kevin Paxman & Haraldur Gunnarsson - Plymouth Marine
Laboratory, Prospect Place, The Hoe Plymouth PL1 3DH, England, UK

Graeme Hays & Vicky Hobson - Swansea University, Singleton Park, Swansea
SA2 8PP, Wales, UK

Acknowledgement
The project partners wish to acknowledge funding from The Crown Estate. They
also wish to acknowledge the assistance of the Scottish Salmon Producers
Organisation (SSPO), in distributing questionnaires and ID sheets, and the
enthusiastic support and advice from Hebridean Air Services.

                                         ii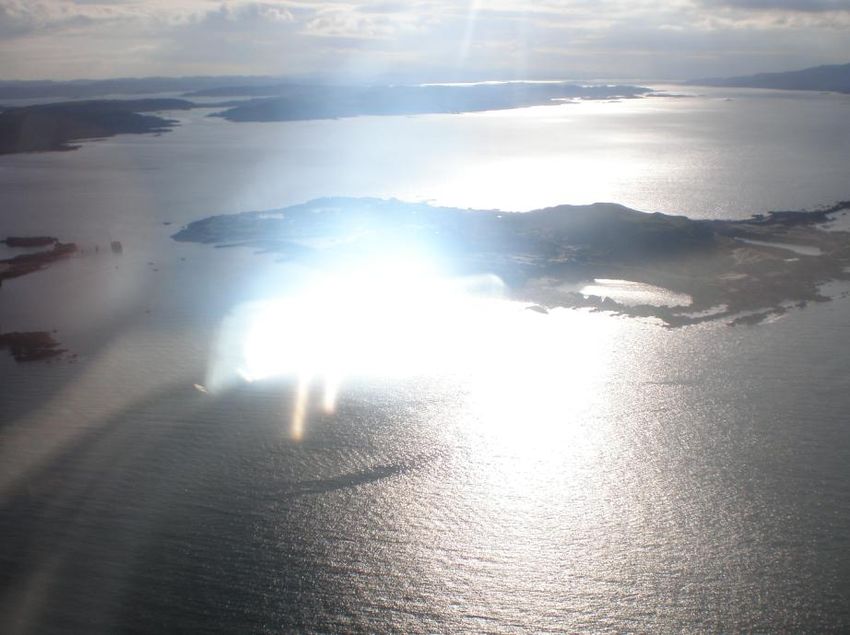
Contents

Executive Summary                                                             iv

1.    Introduction                                                            1
1.1   Background to the project                                               1
1.2   UK medusa                                                               2
1.3   Sources of jellyfish abundance for Scotland                             3
1.4   Jellyfish interactions with aquaculture – historical perspective        4

2.    Work Package 1: Industry survey                                         9
2.1   WP1 Methods                                                             9
2.2   WP1 Results                                                             14
2.3   WP1 Conclusions                                                         18

3.    Work Package 2: Aerial Survey                                           19
3.1   WP2 Methods                                                             19
3.2   WP2 Results                                                             23
3.3   WP2 Discussion                                                          24

4.    Work Package 3: Remote sensing- Satellite data                          28
4.1   WP3 Introduction                                                        28
4.2   WP3 Methods                                                             29
      4.2.1 Jellyfish bloom data                                              29
      4.2.2 EO data acquisition and processing                                30
            4.2.2.1 Aqua MODIS (1km resolution)                               30
            4.2.2.2 Terra MODIS (1km resolution)                              31
            4.2.2.3 Aqua MODIS (500m resolution)                              31
            4.2.2.4 Envisat MERIS (1km/300m resolution)                       32
      4.2.3 Match-ups between EO and jellyfish blooms                         32
4.3   WP3 Results and discussion                                              33
      4.3.1 Visual analysis of potential EO match-ups with jellyfish blooms   33
      4.3.2 Spectral analysis of potential EO match-ups                       36
      4.3.3 Classification experiments                                        41
      4.3.4 Additional experiments towards a generic classifier               46
      4.3.5 Assessment of cloud cover of Scottish waters                      48
4.4   WP3 Discussion                                                          49

5.    Overall discussion                                                      51
5.1   Alternative methods for monitoring medusa                               52
5.2   Recommendations for future work                                         57

6.    References                                                              60

                                            iii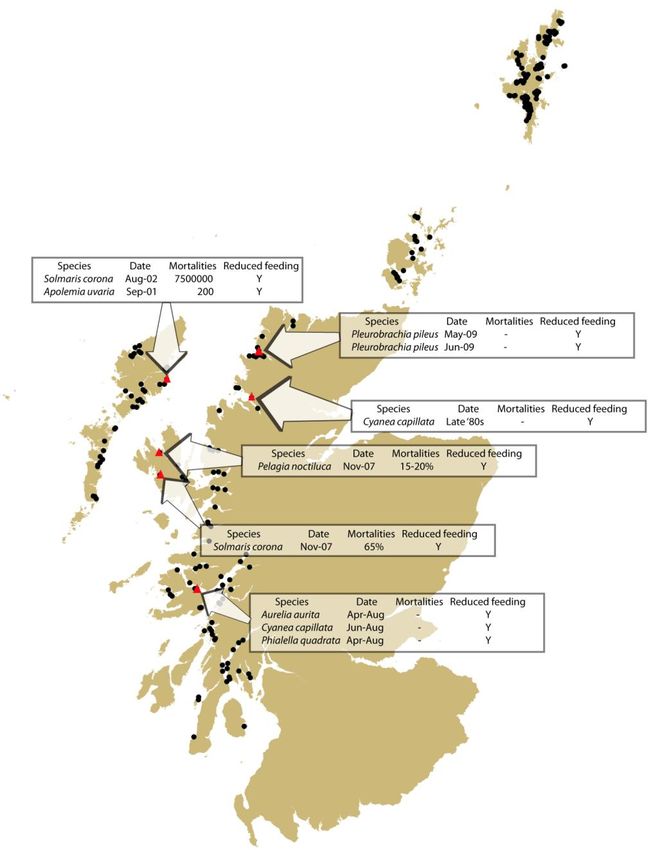
Executive Summary
Since the 1980‟s there have been an increasing number of reports of problems in
the European salmon farming industry with jellyfish blooms. When blooms
develop around aquaculture sites they can lead to a variety of problems including
oxygen stress to the fish by clogging cage walls, stress leading to reduced
feeding and also mortalities either by direct damage or from injuries allowing
pathogens to enter the fish. Alongside this are a number of scientific papers
postulating an increase in the frequency and severity of jellyfish blooms. Such
increases could be linked with a wide variety of factors including global warming,
climate cycles, coastal pollution, over-fishing and even marine litter. However,
records of jellyfish abundance and distribution are sparse and it has been difficult
to confirm whether blooms are really increasing. The present project was initiated
in response to concerns about jellyfish from the aquaculture industry in the west
of Scotland. The project firstly reviewed the history of the problem, what sources
of jellyfish abundance data are available and surveyed the industry to establish
which species are of principal concern.

Because of the extensive nature of the coastline and offshore areas to the west of
Scotland, monitoring would ideally be based on remote observation. Two
methods which have shown promise in other locations or similar applications
were trialled. Firstly, an aerial survey was conducted to evaluate whether it can
be applied to the coastal waters of the west of Scotland to identify blooms.
Secondly, satellite monitoring was investigated to see if blooms lead to sufficient
colouring of the water as to be detectable. Both methods showed some promise
but there are also specific limitations. The work undertaken in this project has
demonstrated that no single monitoring method is suitable for all the jellyfish
species of concern but that progress might be made using a combination of
techniques. The ultimate aim would be to establish a robust monitoring and
forecasting network for blooms to provide some advance warning of bloom
development for the aquaculture industry and other interested stakeholders. The
report concludes with a number of suggestions for the next steps which need to
be taken.

                                          iv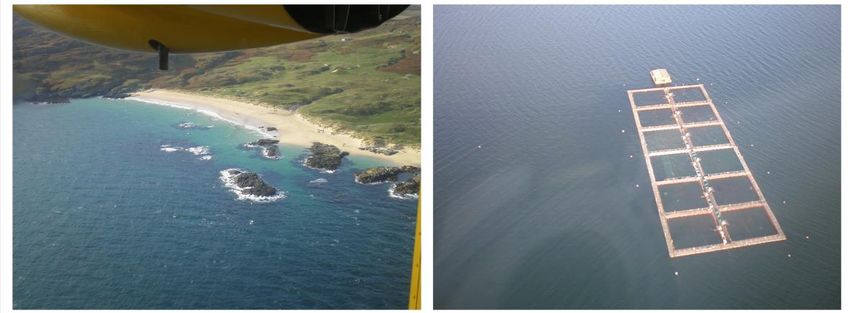
1      Introduction

1.1    Background to the project

This project was developed in response to the Scottish salmon mariculture
industry‟s concerns about mortalities related to jellyfish blooms as expressed to
The Crown Estate. Although there is a general perception that there is indeed a
problem particularly on the Scottish west coast, there is a lack of detailed
knowledge on the important causative species, on their spatial distribution and on
the timing of nuisance blooms.

The economic impacts of jellyfish blooms to marine finfish aquaculture were
brought into public awareness by a massive bloom of Pelagia noctiluca (the
mauve stinger) that killed more than 100,000 fish in Northern Ireland‟s only
salmon farm in 2007. The bloom extended into Scottish waters and was reported
to cover hundreds of square kilometres (Doyle et al., 2008). However, in addition
to such exceptional high profile events, mortalities caused by jellyfish are
potentially an on-going and recurrent problem for the aquaculture industry in
Scotland and elsewhere. In addition, there are suggestions in the literature that
jellyfish blooms may be increasing in frequency and size (Purcell et al., 2007;
Richardson et al., 2009) due to a range of factors including climate change
(Graham, 2001; Mills, 2001; Brodeur et al., 2002; Lynam et al., 2005a; Attrill &
Edwards, 2008; Gibbons & Richardson, 2009), food-web changes caused by
over-fishing (Lynam et al., 2006), changing nutrient profiles (Arai, 2001) and even
increases in marine litter which may provide settlement sites for those species
with benthic stages (Holst & Jarms, 2007). An increasing frequency of blooms in
UK waters is, however, difficult to establish for the following reasons. Firstly, the
historical record is poor: jellyfish in UK waters are not commercially important in
themselves and their abundance has not been monitored on a regular basis in
contrast to commercial fish species.

Secondly, jellyfish populations are naturally highly variable; many species
respond to favorable conditions by rapid population increases but these rapid

                                          1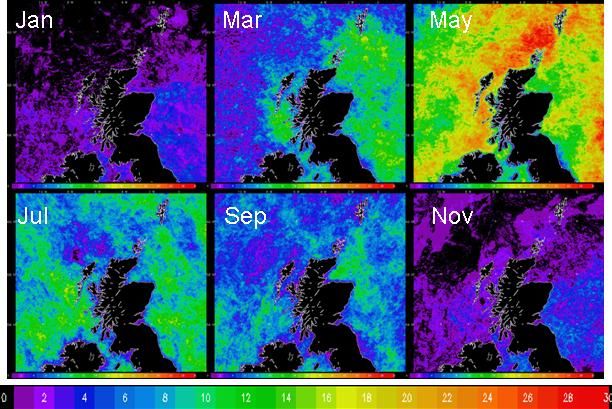
population changes themselves make them difficult to monitor (Boero et al., 2008;
Gibbons & Richardson, 2009). Population dynamics may also be linked to multi-
decadal climate cycles such as the North-Atlantic oscillation (Lynam et al., 2004)
so observations of increases over a limited period of time may coincide with only
a part of a cycle and be followed by a subsequent decline (Brodeur et al., 2008).

Thirdly, jellyfish are often severely damaged by traditional net based gears
usually used to collect plankton samples (Graham et al., 2003; Purcell, 2009).
Indeed Russell (1953) noted that this had led to much taxonomic confusion with
damaged specimens often being recorded as separate species in early works. To
obtain robust abundance estimates, large volumes of water also need to be
sampled when organisms are patchily distributed whilst specimens need
separating from other plankton rapidly after collection to avoid further damage
(Purcell, 2009). Finally, apart from the larger scyphomedusae which are relatively
easy to identify, correct identification of other species requires specialist
knowledge, meaning that routine monitoring using classical visual taxonomy is
time-consuming and therefore expensive.

1.2   UK medusae

For the British Isles, Russell produced two seminal identification texts (Russell,
1953; 1970) and suggested that around 100 species occur in UK waters. The
vast majority (around 90 species) belong in the Superclass Hydrozoa with only
around 13 scyphozoan species being recorded. Thus in addition to the larger
medusae familiar to most visitors to the UK coasts (almost all members of the
Scyphozoa) there are numerous smaller species which can only be observed by
careful collection and examination. As a group, the jellyfish show a remarkable
range of life-cycles but these can be classified into three basic patterns:

(1) Those with a hydroid stage. This is the most common pattern. Following
sexual reproduction by the adult medusae, planktonic larvae (planula) are
produced. These settle onto hard substrates changing into polyps which, in some
species, develop into colonies or hydroids. The next stage is strobilation or the
production of small medusae (ephyra) which are released into the water. Polyps

                                           2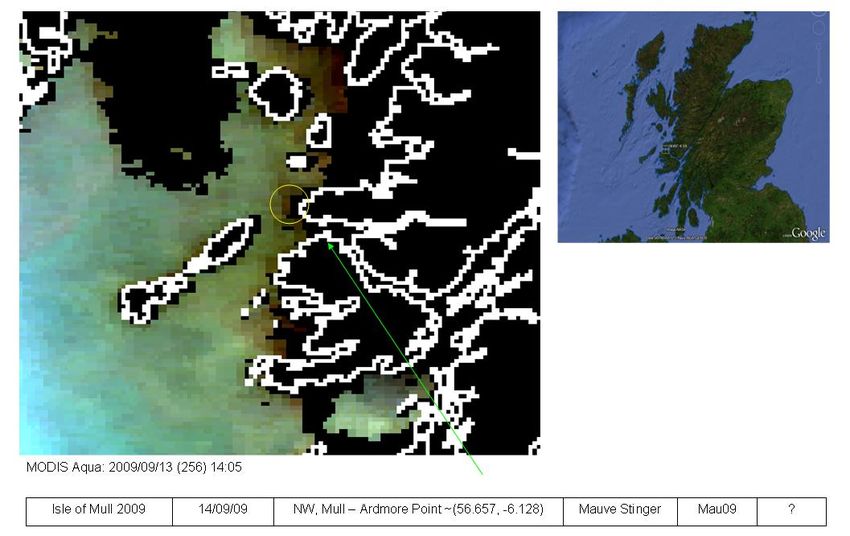
may over-winter and strobilation is often triggered by changes in water
temperature, salinity, light or prey abundance (Lynam, 2006). Many species of
jellyfish are therefore adapted to take advantage of the onset of favourable
conditions and their populations can exhibit rapid growth. In a few species a
planktonic planula is not released and the development cycle is completed on the
adult. In a few species the hydroid stage itself is free-swimming.

(2) Those with direct development. This is most common in oceanic forms
(including the mauve stinger, Pelagia noctiluca).

(3) Those with a parasitic life-stage. As far as is known none of the UK species
are parasitic.

1.3   Sources of jellyfish abundance data for Scotland

As mentioned above, there are a lack of baseline data on jellyfish distributions,
abundance and timing in UK seas. There has been no systematic recording of
jellyfish by DEFRA, SEPA or the Scottish Government through agencies such as
Cefas and Marine Scotland, although there have been periods when data were
recorded on fisheries surveys (for example Lynam et al., 2005b reported on 15
years of data collected from the North Sea).

Over recent years the Marine Conservation Society (MCS) has run a voluntary
observer reporting scheme. Members of the public are encouraged to report
jellyfish sightings by post or via the internet. The main aim of the survey is to
examine whether the distributions of turtles can be linked to jellyfish sightings.
Data for Scotland were kindly provided to this project by the MCS. Although the
data are patchy, there were 153 electronic reports from Scotland between 2007
and 2009, of which 86 were from the west coast. The majority of records were
from July and August coinciding with the expected higher abundance of larger
jellyfish (however it is important to note that these data will also be biased by the
times when observers are most likely in the area e.g. for vacations). Sightings
came from most areas of the Scottish west coast. The numbers of jellyfish
reported ranged from observations of individuals to large accumulations (tens of

                                          3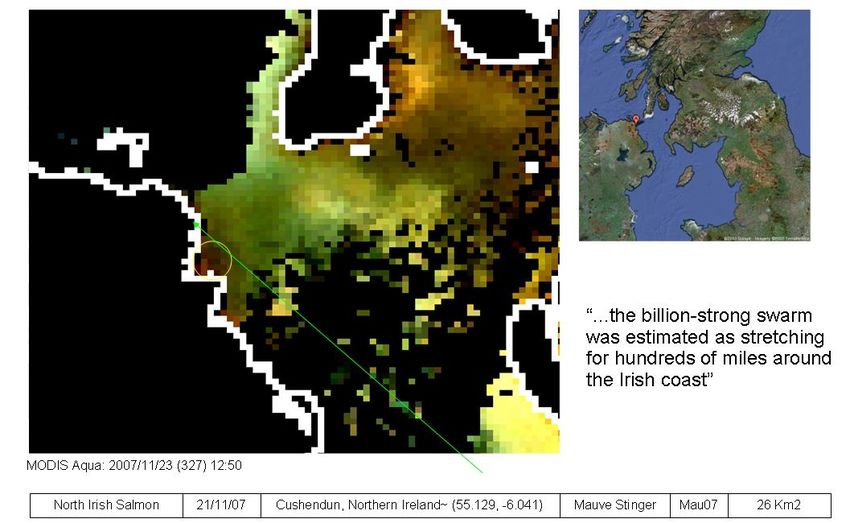
thousands of individuals), often in bays or lochs or on beaches. For many of
these reports identification of the species was uncertain but the most commonly
reported species was the moon jellyfish (Aurelia aurita), followed by lion‟s mane
jellyfish (Cyanea capillata). The barrel jellyfish (Rhisostoma octopus), Portuguese
man-of-war (Physalia physalis), blue jellyfish (Cyanea lamarckii), compass
jellyfish (Chrysaora hysoscella), by-the-wind-sailor (Velella velella) and mauve
stinger (Pelagia noctiluca) were only occasionally reported.

1.4   Jellyfish interactions with aquaculture - historical perspective

In August 1984, the Leptomedusa, Phialella quadrata (Figure 1.1) was reported
as the cause of 1500 Atlantic salmon smolt mortalities at an unnamed location in
Shetland (Bruno & Ellis, 1985; Seaton, 1989). This would appear to be the first
such documented case of salmonid mortality related to medusae in Scottish
waters in the scientific literature.

Figure 1.1 Phialella quadrata with scale. Photo courtesy of Susanna Knotz.

It was recognised relatively early on that more than one species of jellyfish was
problematic; Seaton (1989) mentions the lion‟s mane jellyfish (Cyanea capillata),
the moon jellyfish (Aurelia aurita) as well as P. quadrata as problem organisms.
The moon jellyfish was cited as causing mortalities but no details of the incident
(other than Shetland) were reported for this observation.

                                               4
The late 1980‟s must have seen a large number of jellyfish incidents in Norway,
as a patent was granted (Vadseth & Vadesth, 1989) for a bag pen enclosure for
cultivating a range of marine organisms, in part to avoid “… large schools of
jellyfish carried by natural currents, becoming entangled in the nets and causing
the farmed fish to suffocate due to a lack of circulated fresh water.” By the
following decade, the presence of jellyfish was being included in a suite of
indicators used to rate potential farm sites (Levings et al., 1995). A new species
was also beginning to cause problems for Norwegian salmon farmers, the string
jellyfish Apolemia uvaria (Figure 1.2). This species was first implicated in fish farm
mortalities in November 1997 (Båmstedt et al., 1998).
Figure 1.2. The string jellyfish Apolemia uvaria (Leseuer, 1815), a hydrozoan.
Around this time, the first mortalities associated with the narcomedusa Solmaris
corona (Figure 1.3) were reported from Shetland (Båmstedt et al., 1998) whilst
the mauve stinger Pelagia noctiluca was reported as causing fish mortalities in
Brittany in 1995 (Merceron et al., 1995).
5Figure 1.3 Solmaris corona (Keferstein and Ehlers, 1861). Photo courtesy of Dave Wrobel.
In their review of jellyfish blooms, Purcell et al. (2007) also listed Phialidium sp.,
Leuckartiara octona and Catablema vesicarium as having caused numerous fish
mortalities and large financial loss in 2001-2002 on the Isle of Lewis, although it
has not proved possible to verify this report. Occasionally, the scale of mortalities
due to jellyfish have led to farm closures e.g. in Loch Torridon in 2001 (McKibben
& Hay, 2002), although the jellyfish species responsible was not reported.
One of the most widely reported incidents in recent years was the closure of
Northern Ireland‟s only marine farm in 2007 due to a bloom of P. noctiluca (Doyle
et al., 2008). This incident was also widely reported in the media.1
Fish are affected by jellyfish in several ways: the stinging cells (cnidocysts) can
come into contact with skin, gill or eyes. Båmstedt et al. (1998) stated that while
secondary infections from skin lesions caused by the stings could be problematic,
contact with the eyes and especially the gills of fish would be the main concern.
Damage to the epidermis, necrosis of the gills (Bruno & Ellis, 1985),
hypersensitivity to jellyfish toxin (Seaton, 1989) and secondary infections with
pathogenic bacteria introduced via the jellyfish (Ferguson et al., 2009) have all
been implicated as causal agents in fish mortalities. Additionally, stress may
result from the fish seeking to avoid contact with the jellyfish, and physical
damage may result from contact with nets as escape is sought. Reduction or
1
http://www.timesonline.co.uk/tol/news/science/article2917659.ece
6cessation of feeding is also reported in affected fish (Bruno & Ellis, 1985). There
may also be oxygen stress if nets becoming fouled with large numbers of jellyfish,
reducing water flow through cages (Patursson, 2008).
Considering the potentially large impacts of jellyfish on marine ecosystems
(Purcell, 2009) and on mariculture operations, there are surprisingly few data on
jellyfish distribution and abundance in general, and in Scottish waters in
particular. As mentioned earlier, this lack of data is partly a consequence of
problems with sampling and monitoring these delicate organisms (Purcell, 2009).
A further consideration is that blooms may arise both through the processes of
rapid population growth and aggregation. It has already been mentioned that
large influxes of the mauve stinger (P. noctiluca) to coastal waters are probably
associated with increased inflow of warmer oceanic water (Doyle et al., 2008).
Similarly, under certain wind and tide conditions mass strandings of jellyfish in
inshore sites are common (section 1.3). Although many jellyfish have limited
swimming abilities, some of the larger scyphozoans can certainly regulate their
depth and this may enable them to control their dispersal to some extent (Hays et
al., 2008).
There is, therefore, a clear requirement for improved data on jellyfish distribution
and abundance in order to monitor trends and to identify whether distributions are
random or if hot-spots occur (Doyle et al., 2007). Ideally, methods need to be
developed which will allow routine estimates of abundance to be made to
reproducible standards at reasonable cost (Purcell, 2009). The availability of such
data would eventually allow the development and testing of predictive models
which might provide warnings to the industry of impending blooms and inform site
selection for new farms. Given sufficient warning, the industry can potentially take
precautionary actions such as harvesting or moving fish or employing physical
barriers such as mesh screens.
Remote sensing and ground-truthing by collection/identification has proved
successful in providing early warning of blooms of the harmful dinoflagellate
Karenia mikimotoi in Scottish waters and this monitoring is now proving of value
to the aquaculture industry. A range of projects funded by The Crown Estate and
7the EU are also developing and parameterising physical/biological mathematical
models to predict the location, abundance and transport of blooms of harmful
phytoplankton such as K. mikimotoi. A similar development path with regard to
jellyfish blooms is conceived and the work undertaken in the present project is a
first step towards this goal. The project was designed to evaluate the potential
scale of the jellyfish problem to the marine aquaculture industry in Scotland, to
assess the utility of two types of large-scale monitoring – aerial and remote
sensing, and to review any alternative methods which might be useful in a future
large-scale monitoring program.
82 Work Package 1: Industry survey
2.1 WP1 Methods
To attempt to identify the extent of jellyfish incidents in the Scottish aquaculture
industry, a questionnaire was compiled with the aid of the Scottish Salmon
Producers‟ Organisation (SSPO). The questionnaire is reproduced below:
SAMS Jellyfish Survey
Objectives:
To produce a map of areas affected by jellyfish blooms
To identify the time of year of worst impact
To identify areas at greatest risk of jellyfish blooms
Questions
1. What is the name and location of your farm?
2. Has your site been affected by jellyfish?
3
Density (estimate number per m ) Month/Year Species from the ID sheet
3. Did the incident(s) cause mortalities or some lesser effect?
4. If there were mortalities, how many?
5. Were there any days lost feeding or a starvation period following the incident?
6. What density of jellyfish do you think would pose a problem to your farm?
7. Are there specific weather conditions that would prove the most problematic to you? eg.
wind from a certain direction?
8. Would a forecast of a likely jellyfish bloom be of use to you?
9. How many days warning period would be of most use in the event of a bloom?
10. Would you be willing to pay for an early warning service?
Please return this questionnaire to:
Dr Thom Nickell
Ecology Department,
Scottish Association for Marine Science (SAMS),
Scottish Marine Institute, Oban, Argyll PA37 1QA
Scotland, UK
T: (+44) (0)1631 559261 (direct)
F: (+44) (0)1631 559001
E: tdn@sams.ac.uk
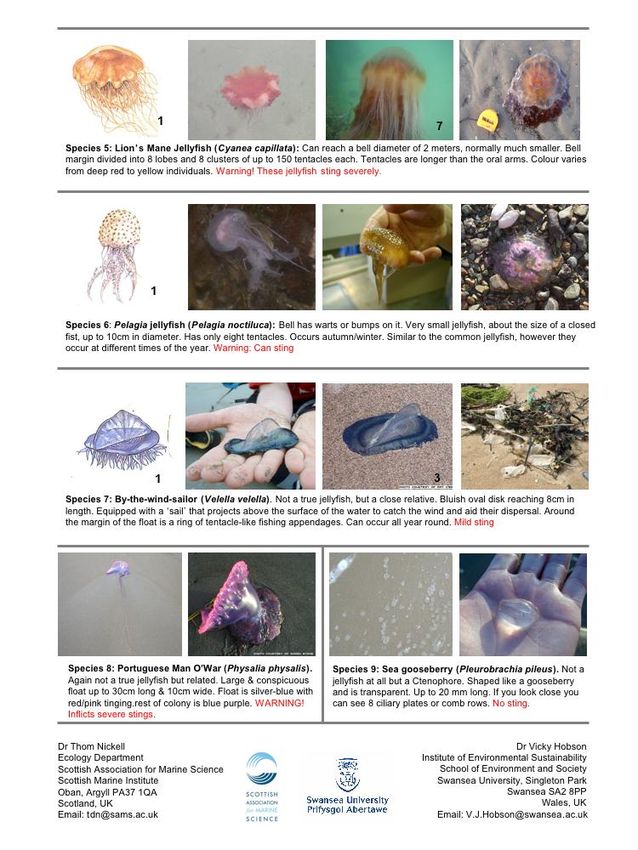
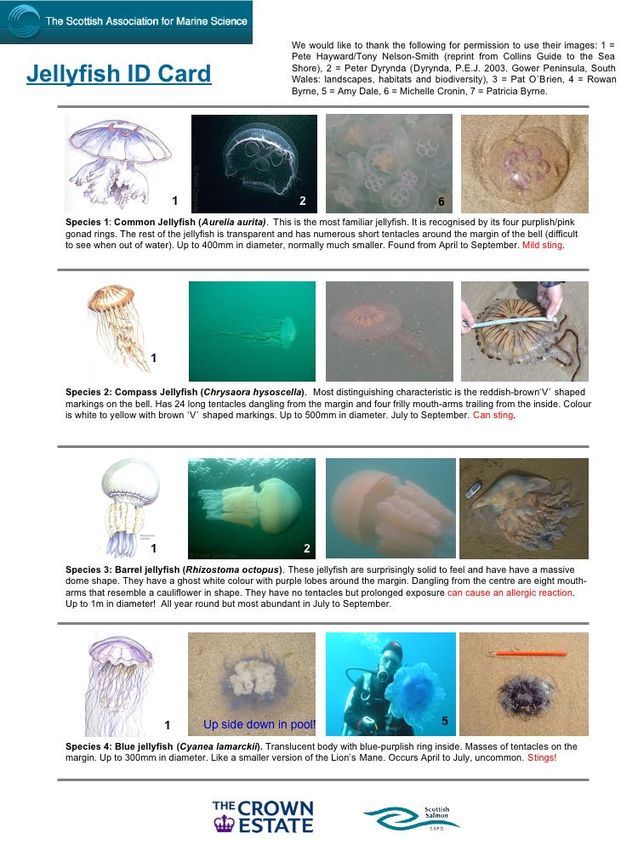
9Furthermore, to ensure the widest possible dissemination to the producers the
questionnaire was distributed via the SSPO, who were asked to send it to all of
their farm managers for completion. Along with the questionnaire, a jellyfish
identification chart was distributed (see overleaf):
1011
12
13
2.2      WP1 Results

The most recent data available from 2008 show 257 active Atlantic salmon farm
sites in Scotland (Figure 2.1) (Marine Scotland Science, 2008). The SSPO‟s
membership (16 companies)2 accounts for roughly 95% of the total salmon
production in Scotland (J. Smith, SSPO, pers. comm). The questionnaires were
disseminated via the SSPO but only nine farms made returns. Of these, 66%
reported serious jellyfish incidents (defined as causing loss of feeding as a
minimum). A total of six jellyfish species were identified as being involved in these
incidents (Cyanea capillata, Aurelia aurita, Phialella quadrata, Solmaris corona,
Apolemia uvaria and Pelagia noctiluca) and the gelatinous ctenophore
(Pleurobrachia pileus); of these, three species (Apolemia uvaria, Pelagia
noctiluca and Solmaris corona) were responsible for mortalities. Three farm sites
had experienced mortalities and one estimated losses of 65%.

2
    http://www.scottishsalmon.co.uk/aboutus/members.asp

                                                   14
Figure 2.1. Map showing active Scottish fish farming sites (). Data from Marine Scotland Science
(2008).
When all incidents of jellyfish (serious and non-serious) were plotted against time
of year (Figure 2.2), it was found that June and August were the most common
months for interactions. Mortalities were confined to August (one farm),
September (one farm) and November (two farms). Farms which responded to the
questionnaire and reported incidents are shown in Figure 2.3.
155
4
Number of Incidents
3
2
1
0
Apr May Jun Jul Aug Sep Oct Nov
Month
Figure 2.2. Graph showing jellyfish incidents by month.
In terms of monitoring acting as a useful early warning of impending jellyfish
blooms, three farm managers stated that one day‟s warning would be sufficient
notice of an impending bloom; one said two days; one said at least three days;
and one farmer wanted as much notice as possible.
16Figure 2.3. Map showing active Scottish fish farming sites () and incidents of jellyfish () from
responding farms. Data from Marine Scotland Science (2008).
In addition to the questionnaire responses received, the biological manager for a
major Shetland producer (with around 45 sites) responded by email to say that
they do monitor medusae in plankton samples and had recorded around 30
species, but were unwilling to release the data because of concerns about
insurance risk. According to this source the smaller species present in the inshore
waters throughout the summer months of the year are of greatest concern, with
17larger species of scyphomedusae and oceanic species of less concern, at least in
Shetland waters.
2.3 WP1 Conclusions
The low rate of responses is most noticeable. It may be that concerns about
exposing data to insurance companies may have discouraged some returns
(presumably the concern is that this could lead to premium increases). Although
at present the data are based on a small sample return, 66% of respondents who
did respond indicated that jellyfish have caused problems to their operation. The
fact that some producers also monitor jellyfish on a regular basis also suggests
that this is a serious problem to the industry which requires further investigation
within a framework that allows better integration of science and commercial
aquaculture interests.
183 Work Package 2: Aerial Survey
The large spatial extent and remoteness of much of the Scottish west coast
suggests that some form of remote sensing might be the only way of rapidly
covering large areas to assess adequately the density and transport of jellyfish to
provide an early warning to aquaculture farms. Aerial surveys have historically
been used to assess the distributions of sea-birds, seals, whales and dolphins.
Recent studies in the Irish Sea by the University of Swansea have indicated that
similar surveys can be successfully used to assess jellyfish hot-spots (Houghton
et al., 2006). These researchers applied the aerial survey method to three of the
larger species of jellyfish common throughout UK waters: Rhizostoma octopus
(the barrel jellyfish), Cyanea capillata (the lion‟s mane jellyfish) and Chrysaora
hysoscella (compass jellyfish). Many of the larger scyphomedusae exhibit diving
behaviour through active pulsing and adjustments to their buoyancy (Hays et al.,
2008). Vertical migration may therefore affect abundance estimates based on
surface observations.
However, notwithstanding these difficulties the method does appear to be useful
for determining the location and relative abundance of aggregations of all three
species. The aim of this work package was therefore, in collaboration with Prof.
Hays from University of Swansea, to conduct test flights to assess the suitability
of this methodology in Scottish waters. The original plan was to fly three missions
during the summer months when jellyfish blooms are expected. Unfortunately,
delays to the contract meant that it was only feasible to fly a single mission
towards the end of the autumn.
3.1 WP2 Methods
A single mission was flown using a Britten Norman Islander twin engine aircraft
hired from Hebridean Air Services (Figure 3.1). This company has experience of
conducting similar scientific surveys (e.g. JNCC), has a dispensation for low-level
flying and the plane is twin-engine which is an important safety consideration for
low-level surveys.
19Figure 3.1. Britten Norman Islander twin engined aircraft at Connel (Oban) airport
Our protocol closely followed that described in Houghton et al. (2006). Aerial
surveys require a calm sea state (no whitecaps) otherwise it is impossible to spot
animals at the sea surface. The date of the flight (22 Oct 2009) was therefore set
based on weather forecasts and in discussion with the charter company. Five
scientific staff participated in the survey, four from SAMS and one from University
of Swansea to provide training. Observations were made for a total of three
hours.
20Figure 3.2. Illustration of the overflight protocol
The aircraft flew at around 185 km h-1 at a height of ~ 150 m, providing a field of
view of ~ 250 m (determined by inclinometer) on either side of the aircraft (Figure
3.2). This allowed two observers, one each side of the aircraft, to assess an area
of 7.7 km2 per five min. period. At any one time two individuals acted as
observers, on opposite sides of the aircraft whilst a third person acted as
navigator. Five minute logging intervals were recorded by the navigator by
stopwatch in addition to an evaluation of sea state and glare (Table 2.1).
Waypoints were determined by GPS. Glare from the sea surface presents a
potential problem for observation (3.3) and was recorded as the fraction of the
observer‟s field of vision that was obscured, in octas, in each five minute logging
period. This information was passed to the navigator for logging. Observers were
swapped around every 30 min. to reduce fatigue. For each five min. period the
two observers recorded sightings using Table 2.2.
21Table 2.1. Navigator logsheet
Time @ end Latitude Longitude Sea state
Glare
Leg # of 5 min deg / min Deg/min single
LHS / RHS
interval North West estimate
Figure 3.3. Example of glare near Easdale Island.
22Table 2.2. Observer record sheet.
Date: Observer: Side of Plane:
Leg #: From - To:
Angle:
Time >10 >50 >100
mega- Notes: Jellyfish 0 500
(BST)The spatial coverage of the survey proved to be quite extensive allowing much of
the coastline and some open water areas of North Argyll to be surveyed within
the 3 h 15 min. of observation time (Figure 3.6). However, even with the rotation
of five scientific staff, this is probably near the maximum duration of survey time
that could be undertaken without a break as observer fatigue becomes significant
risking a corresponding decrease in the reliability of the observations.
Jellyfish were easily observed, but abundances were extremely low during the
survey. The only species observed was Cyanea capillata, with a single individual
being sighted during three separate logging intervals (Figure 3.6). A bloom of
Pelagia noctiluca which had been reported north of Mull (observed from a boat)
two days previously was not seen.
The original experimental design comprised of a large area survey on day 1,
followed on day 2 by a more detailed high resolution survey of any areas of high
jellyfish density. Boat-based ground-truthing using the SAMS research vessel
was also proposed as part of this second survey to ascertain the abundance of
jellyfish below the sea surface that would be missed by the aerial observations.
However, as jellyfish densities proved to be very low during the first survey, the
second survey (both aerial and boat) was not deemed worthwhile and on a
cost/benefit basis was not conducted.
3.3 WP2 Discussion
The single mission flown was sufficient to provide observer training and to provide
evidence that the method is workable on the west coast of Scotland providing
weather conditions are good. Further validation would be needed, however, when
a greater number of individual jellyfish and species are present. As the project did
not commence until early autumn the aerial survey was not conducted until
October 2009. While conducting the surveys earlier in the year would have been
ideal, a bloom of Pelagia noctiluca had been reported (observed from a boat)
near North West Mull two days previously indicating that potentially harmful
blooms were still present at this time. It is not possible to say whether this bloom
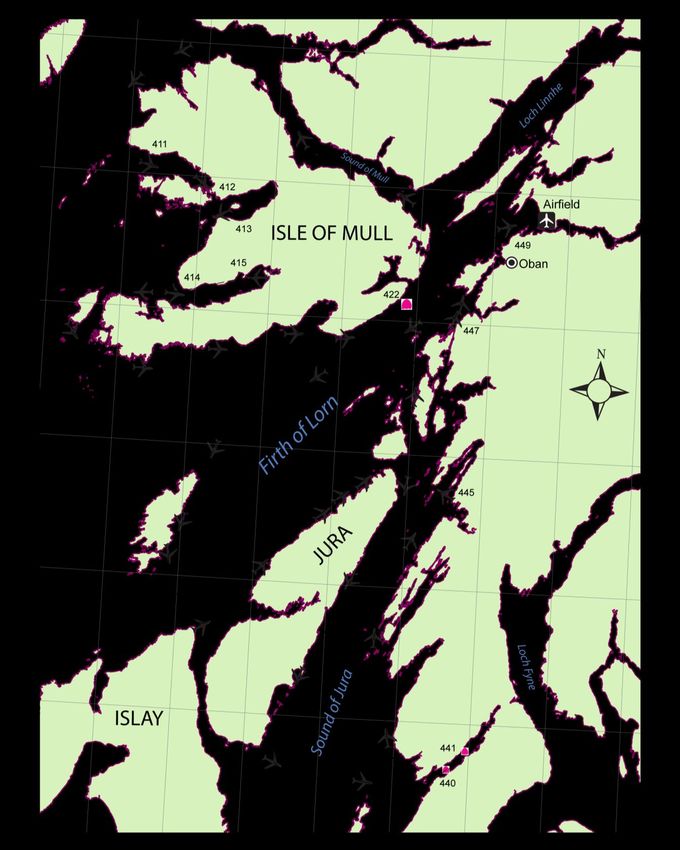
24Figure 3.6. Map showing track of aerial survey off Argyll coast. = waypoint; = jellyfish
sighting at waypoints 422, 440 and 441.
25was present and was not spotted or whether the bloom had become dispersed by
the time the flight was made.
If the method were to be applied more widely on the Scottish west coast, a major
logistical concern would be the number of days of calm weather experienced in a
typical summer/autumn. Data supplied by the Met Office from the Dunstaffnage
weather station (Table 2.3) show the average wind speed during daylight hours
(09:00-17:00) for the summer-autumn period in 2009. Using the criterion of
operating only in a wind speed less than Force 3 (7-10 kts), it is apparent that
aerial surveys could only take place on around 40% of the available days per
month in the period when jellyfish blooms are most probable. The timing of
surveys would require considerable flexibility and staff would need to be on
„stand-by‟ ready to fly in good weather windows, including weekends. These
restrictions could prove impractical although the charter company used
(Hebridean Air Services) were extremely flexible and were able to fly to Oban with
only one or two days notice. At other times of the year however the charter planes
are more heavily committed and such flexibility might be difficult.
The aerial survey method investigated is also limited to recording the larger
scyphozoan species or possibly to spotting large blooms of smaller species such
as P. noctiluca. According to the industry survey and literature review, smaller
species such as Solmaris corona and Phialella quadrata are responsible for a
greater proportion of aquaculture incidents. These species are generally less than
15 mm in diameter and it is unlikely that they would be visible from the air. In
addition, there are few data on the depth distributions of these species and sub-
surface blooms may occur. Thus, for many of the problem species, aerial early
warning may not be an effective monitoring method.
26Table 2.3. Average wind speed at Dunstaffnage from 09:00-17:00, June-November 2009 (Met
Office data).
Month
Jun Jul Aug Sep Oct Nov
Day Average speed (kts)
1 6.7 2.8 7.7 8.3 9.2 4.7
2 6.9 4.0 8.3 5.4 8.6 11.3
3 6.4 4.9 12.4 9.8 28.0 9.7
4 5.1 5.9 7.8 14.8 5.3 6.0
5 8.8 6.4 10.2 14.6 5.4 3.9
6 8.7 4.0 6.4 6.9 13.4 9.3
7 7.2 5.8 4.8 8.3 10.6 7.4
8 5.0 9.3 6.2 16.4 3.8 5.6
9 7.4 11.2 3.6 8.0 14.2 7.7
10 8.3 7.1 6.8 6.7 7.9 1.7
11 11.0 9.2 7.6 4.8 12.9 6.3
12 7.4 8.7 9.7 7.7 2.6 12.1
13 4.8 3.7 6.3 2.7 6.3 6.1
14 4.8 5.7 9.3 5.3 3.2 13.2
15 4.4 6.3 15.1 6.1 4.9 5.8
16 7.3 4.9 10.9 5.2 1.3 8.9
17 9.8 8.7 7.0 5.1 3.3 8.9
18 14.0 9.7 7.6 4.1 8.6 6.6
19 17.7 8.9 6.6 10.6 7.0 5.3
20 10.8 12.2 9.1 7.6 21.3 11.3
21 4.6 10.3 11.2 9.7 9.0 14.8
22 7.2 5.9 6.7 16.0 9.7 9.2
23 4.3 9.6 8.4 12.7 8.1 10.3
24 9.6 11.8 8.0 10.6 15.6 11.8
25 13.4 7.2 9.4 10.7 13.1 25.1
26 13.7 7.4 6.0 7.2 4.7 15.9
27 9.6 10.2 4.9 14.2 9.2 11.9
28 8.7 8.8 15.6 13.7 6.1 2.7
29 6.7 9.7 14.3 6.4 7.6 13.7
30 5.1 9.3 6.2 9.0 11.3 1.7
31 8.1 6.2 7.9
No. days4 Work Package 3: Remote sensing - Satellite data
4.1 WP3 Introduction
Satellite remote sensing has the potential to provide an advanced warning of the
offshore development of harmful algal blooms (HABs) such as the dinoflagellate
Karenia mikimotoi and hence indicate where they are likely to first affect coastal
waters (Miller et al., 2006; Davidson et al., 2009). We are not aware of any
previous attempts of using earth observation (EO) data to detect jellyfish blooms,
and so this has been the novel focus of this work package.
This work has involved application of the multi-spectral classification method
which has shown promising results for discriminating certain high-biomass mono-
specific bloom species (Miller et al., 2006). The training data for such classifiers
require match-ups between the times and locations of jellyfish bloom events and
cloud-free EO ocean colour scenes. Therefore a pre-requisite was a database of
jellyfish population observations produced in WP2. Unfortunately because of the
contract timing only one of the four originally planned aerial surveys on the
Scottish west coast was carried out, and this observed no jellyfish blooms. Hence
we have had to rely upon historically reported events.
The approach for assessing the feasibility of satellite monitoring for jellyfish was
as follows:
1. Acquire data on historical jellyfish bloom events.
2. Trawl EO archives for cloud-free match-ups with jellyfish events, and
reprocess scenes.
3. Visually study EO match-ups for features suggestive of jellyfish blooms.
4. Analyse potential jellyfish features quantitatively using colour radiance
spectra.
5. Carry out classification experiments to determine feasibility of EO
discrimination.
28Due to cloud cover we identified a small set of image scenes that contain features
suggestive of jellyfish blooms. Using the EO match-ups, examples of reflectance
spectra of jellyfish blooms were described and compared with spectra for clear
seawater and suspended sediment. Visual and statistical comparisons explored
whether there is any characteristic colouring of the water due to jellyfish that
could be detected by the limited colour information available from current EO
sensors.
4.2 WP3 Methods
4.2.1 Jellyfish bloom data
Various known jellyfish bloom events were collated into one database (Table 4.1).
These records came from three sources: marine biology websites,3,4 aerial
surveys by Swansea University (Hayes & Hobson, pers. comm.) and news
reports. Most sources gave only a single date, sometimes vague, and a general
location.
Some of these events can be grouped together into a large-scale influx of a single
species. The mauve stinger (Pelagia noctiluca) influx of late 2007 was a series of
presumably linked blooms that were recorded around Western Scotland and
Northern Ireland. This large-scale episode included the swarm that devastated
the Northern Irish salmon farm in November and was the prime focus of our
study. A similar mauve stinger influx occurred in the same region in 2009.
Also investigated were sightings of large groups of barrel jellyfish (Rhizostoma
octopus) recorded from the aerial surveys, conducted over the Irish Sea in 2008
and 2009. These did not occur in a quantity comparable to the mauve stinger
events but R. octopus are bright white and opaque so were chosen as a species
with a higher likelihood of being detected. These known blooms of jellyfish
3
http://marinebiology.suite101.com
4
http://www.whaledolphintrust.co.uk
29species and location provided the basis for attempts to match up with satellite
images.
Table 4.1. Recorded jellyfish bloom events collated from news reports, online material and aerial
surveys.
Quick Name Date Place(s) Species Influx Scale
Pre-Swansea Irish Sea Summer Irish Sea Rhizostoma Rhiz04 X 103
2004 octopus
Moon Jellyfish 2004 Summer West Coast Aurelia aurita Moon04 Bloom
2004
Portuguese man-of-war Summer SW England Physalia Port07 Individuals?
2007 physalis
Isle of Eigg 2007 11/07/2007 Laig Bay, Isle of Eigg Pelagia Mau07 X 106
(~56.918˚, -6.162˚) noctiluca
Isle of Mull 2007 07?/11/2007 Bloody May (East of P. noctiluca Mau07 ?
Andmore point), Isle of
Mull
Northern Irish salmon disaster 21/11/2007 Cushendun, Northern P. noctiluca Mau07 26 km2
Ireland
(~55.129˚, -6.041˚)
Swansea aerial study Jul 2008 21/09/2008 Irish Sea around R. octopus Rhiz08 Up to 100 per
Pembrokeshire and 1000 m3
West Wales coast
Swansea aerial study May 2009 30/05/2009 Irish Sea around R. octopus Rhiz09A Up to 100 per
Pembrokeshire and 1000 m3
West Wales coast
Isle of Lewis 2009 09/04/2009 Reef Beach, Trigh Na P. noctiluca Mau09 ?
Berie, Isle of Lewis
(~58.241˚, -6.894˚)
Swansea aerial study Sep 2009 09/12/2009 Irish Sea around R. octopus Rhiz09B Up to 100 per
Pembrokeshire and 1000 m3
West Wales coast
Isle of Mull 2009 14/09/2009 NW Mull - Ardmore P. noctiluca Mau09 ?
Point
(~56.657˚, -6.128˚)
Orkney 2009 (and Fair Isle?) 2?/11/2009 Orkney 2009 P. noctiluca Mau09 Bloom
4.2.2 EO data acquisition and processing
4.2.2.1 Aqua MODIS (1 km resolution)
MODIS (MOderate-resolution Imaging Spectroradiometer) is a 36 channel sensor
launched by NASA on-board both the Aqua and Terra EOS satellites launched in
2002 and 1999 respectively. MODIS has six bands in the visual range which were
utilised for this investigation. Apart from the red channel, they have a resolution of
1 km2. The six bands are centred on 412 nm, 443 nm, 488 nm, 531 nm, 551 nm
and 667 nm.
30Using the date and location given by the bloom records above, RGB colour
composites produced by NEODAAS (originally obtained from NASA‟s
OceanColor Web) were visually examined 7 days either side of the recorded date
of the bloom in order to pick out cloud-free images. The channels used for the
RGB composite were 551, 510, 443 nm, that is from the blue-green part of the
spectrum rather than red, green, blue; thus the resulting colours are not „true‟, but
enhance the information seen in the most important blue-green colours. These
images were then examined for an area of colour that could be possibly attributed
to a bloom of the relevant species of jellyfish. Cloud proved to be a major
hindrance in this study, especially for the Scottish waters, resulting in very few
useable images.
Images that were both cloud-free and had promisingly coloured RGBs were re-
downloaded from NASA's OceanColor Web as level 2 HDFs. The level 2 images
display geophysical properties as calculated by NASA; in this case Normalized
Water Leaving Radiance (Lwn). These images were then processed further by
NEODAAS to produce mapped netCDF images of Lwn for the six wavelengths.
These were used in the further investigations detailed in the next section.
4.2.2.2 Terra MODIS (1 km resolution)
Due to the unfortunate frequent cloud coverage in Aqua, Terra MODIS data was
also obtained, using the same process as above, in the hope of obtaining further
images which were cloud-free over the desired area. Aqua has the better
calibration of the two however, and some banding artefacts are present in the
obtained Terra images. Nevertheless, a few useful images were collected.
4.2.2.3 Aqua MODIS (500 m resolution)
Though not utilized during this study, the higher resolution red channel of MODIS
could be combined with the other channels used in order to take advantage of the
finer detail provided at that resolution.
314.2.2.4 Envisat MERIS (1 km/300 m resolution)
MERIS was looked at but unfortunately suffered from the same cloud issue as the
other sensors and only one useful image was found. It was decided that a
thorough investigation of MERIS images would be a useful follow-up to this study
due to its higher resolution mode.
4.2.3 Match-ups between EO and jellyfish blooms
Cloud free images were visually assessed for a distinct colour for the area of the
recorded bloom. For the mauve stinger events this was generally a dark or
purple-like colour. For Rhizostoma, we searched for areas of elevated brightness.
Shape and temporal characteristics were also useful indicators. The best images
found in regard to lack of cloud and possible jellyfish match-ups are detailed in
Table 4.2.
Table 4.2. Best satellite images found for all sensors. Highlighted images were analysed further
(below).
Event Best Aqua Image(s) Best Terra Image(s) Best MERIS Image(s)
Isle of Mull '07 2007/11/05 (309) 13:00
Isle of Eigg 2007/11/07 (311) 12:50 2007/11/05 (309) 11:10 2007/11/09 (313) 11:43
Northern Ireland 2007/11/23 (327) 12:50 2007/11/23 (327) 11:00
Cardigan Bay '08 2006/09/20 (264) 13:00
Cardigan Bay May '09 2009/05/30 (150) 13:30
(incl. Borth) 2009/05/31 (151) 12:35
2009/06/01 (152) 13:15
2009/06/02 (163) 12:20
Isle of Lewis 2009/09/06 (249) 14:00 2009/09/09 (250) 11:10
Cardigan Bay Sep '09 2009/09/09 (252) 12:50
(incl. Talybont) 2009/09/10 (253) 13:30
2009/09/11 (254) 12:40
2009/09/12 (255) 13:25
Isle of Mull '09 2009/09/13 (256) 14:05
2009/09/16 (259) 13:00
324.3 WP3 Results and discussion
4.3.1 Visual analysis of potential EO match-ups with jellyfish blooms
Due to the resolution of the images (1 km2 for MODIS), it was often just a few
discoloured pixels near the recorded bloom that were observable. Figure 4.1(a-d)
show example images from four different bloom locations, with recorded position
(green arrow) and suspected jellyfish pixels (yellow circles) indicated, as well as a
location map and information about bloom characteristics.
33Figure 4.1(a). Isle of Eigg, NW Scotland mauve stinger bloom, Jul. 2007, observed using Aqua-
MODIS data.
Figure 4.1(b). Northern Ireland mauve stinger bloom, Nov. 2007 bloom, observed using Aqua-
MODIS data.
34Figure 4.1(c). Isle of Mull mauve stinger bloom, Sep 2009, observed using Aqua-MODIS data.
Figure 4.1(d). Borth, Cardigan Bay Rhizostoma bloom, May 2009, observed using Aqua-MODIS
data.
Off the Isle of Eigg, the circled regions near the known mauve stinger bloom
appear to have a slightly mauve colouring (Figure 4.1a). The region along the
Northern Ireland coast which suffered a massive salmon loss due to mauve
stinger appears dark reddish brown in the enhanced RGB colours (Figure 4.1b),
35though it can be seen that quite similar colours are found on the Scottish coast,
probably associated with absorption by phytoplankton. The Isle of Mull mauve
stinger bloom is indicated by a similar reddish brown colour to the Northern
Ireland bloom (Figure 4.1c). For the Rhizostoma bloom in Cardigan Bay, we
identified a small isolated bright patch off the coast near to Borth (Figure 4.1d);
however this could be alternatively be an isolated patch of sediment or
coccolithophores.
4.3.2 Spectral analysis of potential EO match-ups
Training areas were visually chosen based on the true colour images and a
variety of image-dependent classes were delineated, with Jellyfish, Sediment and
Open Ocean present in each. A subset of pixels from each of these ROIs was
selected and their spectral signature over the six MODIS channels was plotted
using the Envi analysis package. Figure 4.2(a-e) presents the results of this
analysis for five of the bloom events using Aqua-MODIS data; Figure 4.2(f-g)
provides additional data for two events using Terra-MODIS data.
36Figure 4.2(a). Isle of Eigg, NW Scotland mauve stinger bloom, Jul. 2007, studied using Aqua-
MODIS data. Top: regions of interest indicated on a map, coloured according to key. Bottom:
water-leaving radiance (Lwn) spectrum for selected points within each region.
Figure 4.2(b). Northern Ireland mauve stinger bloom, Nov. 2007 bloom, studied using Aqua-
MODIS data.
37Figure 4.2(c). Isle of Mull mauve stinger bloom, Sep 2009, studied using Aqua-MODIS data.
Figure 4.2(d). Borth, Cardigan Bay Rhizostoma bloom, May 2009, studied using Aqua-MODIS
data.
38Figure 4.2(e). Talybont, Cardigan Bay Rhizostoma bloom, Sep. 2009, studied using Aqua-MODIS
data.
Figure 4.2(f). Isle of Eigg mauve stinger bloom, Jul. 2007, studied using Terra-MODIS data.
39Figure 4.2(g). Northern Ireland mauve stinger bloom, Nov. 2007, studied using Terra-MODIS data.
Figure 4.2a analyses the bloom off the Isle of Eigg in NW Scotland. The „Open
ocean‟ class shows a typical spectrum with a broad peak in the blue-green
radiance, much lower in the yellow-red. „Sediment‟ class peaks in the green-
yellow (551 nm) with some signal in the orange-red. In contrast, the Laig Bay
area and suspected bloom has a flatter spectrum, with the blue radiance slightly
higher than the green and red, and a sharp decrease between 530 and 550 nm.
In Figure 4.2b the analysis is applied to the Northern Ireland bloom. At this
location the shape of the suspected jellyfish spectra is similar to that of the open
ocean, though with more green than blue, and lower overall indicating strong
absorption. In fact the atmospheric correction has failed for these pixels,
generating negative radiance values in the blue channels. The spectra for the Isle
of Mull are more distinct (Figure 4.2c), with very low radiance in the blue (strong
absorption), peak in the green-yellow, and slow descent towards the red. The red
radiance is higher than would be associated with phytoplankton, so could be
indicative of jellyfish or a combination of plankton and sediment.
40Moving on to the Rhizostoma blooms, Figure 4.2d presents the analysis for Borth,
Cardigan Bay. Note that the suspected jellyfish pixels are brighter than the open
ocean (higher radiance), unlike the mauve stinger cases. The broad peak is in the
green, and could instead be a diatom bloom or a lower concentration of
coccolithophores. The second match-up for Cardigan Bay exhibits a different
spectral shape for the suspected jellyfish, with high radiance in the blue, peaking
in the green, and much lower in the red (Figure 4.2e). Again, this is brighter than
the surrounding seawater.
Further results from the older Terra-MODIS sensor are shown for the mauve
stinger blooms in Figure 4.2(f-g). It is reassuring that the suspected bloom off the
Isle of Egg has a similar flat shape to that derived from Aqua, though there is not
the same decrease from 530-550 nm (Figure 4.2f). The high intra-class variability
in the blue channel (412 nm) may signify some problems in the atmospheric
correction of Terra. The bloom in Northern Ireland has a flatter, darker spectrum
than the open ocean (Figure 4.2f); again the blue channel may be questionable.
It is difficult to derive generic characteristics of these spectra that are
discriminating of jellyfish blooms, though there are promising signs that in some
cases the blooms are a distinct colour. To progress with this analysis we need a
greater quantity and certainty of training data.
4.3.3 Classification experiments
Figure 4.3(a-g) shows attempts at supervised classification (again using Envi) for
the locations and ROIs detailed in Figure 4.2. A Maximum Likelihood classifier
was used with a lower boundary of 0.9. For each image, the classification result is
overlaid on original image data where white indicates no-data (cloud or land) and
grey to black are pixels for which data is present but have remained unclassified
due to not meeting the lower threshold criteria in any class.
41Figure 4.3(a). Supervised classification result from Aqua MODIS data: Mauve stinger bloom at Isle
of Eigg, Nov. 2007
42Figure 4.3(b & c). Classification results for mauve stinger blooms from Aqua MODIS (b) Northern
Ireland, Nov 2007; (c) Isle Mull, Sep 2009.
43Figure 4.3(d & e). Classification results for Rhizostoma in Cardigan Bay from Aqua MODIS (d)
Borth, May 2009; (e) Talybont, Sep 2009.
44Figure 4.3(f & g). Classification results for Mauve Stinger from Terra MODIS, Nov 2007 (f) Isle of
Mull; (g) Northern Ireland.
Without further ground-truthing the accuracy of these classifications cannot be
assessed, however for most of them the jellyfish classified pixels are not too
numerous and seem to be in plausible areas along the coast on which they were
detected. Some of these results are particularly encouraging for which the
classified jellyfish region is constrained around the suspected bloom. Figure 4.3a
(Isle of Eigg) indicates a small number of potential jellyfish pixels including the
suspected locations. Figure 4.3b (Northern Ireland) shows good classification of
the NW Ireland coast used for training, though with some additional jellyfish pixels
near the Scottish coast. Figure 4.3d-e (Cardigan Bay) is the most promising, in
which the only classified jellyfish pixels are around the bright patches believed to
be Rhizostoma blooms. The Isle of Mull classification appears to be highlighting a
45wider range of dense algae areas (Figure 4.3c). The Terra-MODIS version of the
Isle of Eigg is a good result given the cloud cover (Figure 4.3f). The final
classification attempt gave a poor result, enhancing the banded noise pattern
inherent in some Terra data (Figure 4.3g). These results provide some
justification of the spectral approach for discriminating jellyfish using EO data.
4.3.4 Additional experiments towards a generic classifier
The next stage of classifier development would be to pool all the training data for
each species of jellyfish bloom, and derive the optimal selection of radiance
variables for a generic classifier that could be applied to unseen testing data.
Unfortunately in this project we were not able to locate unequivocal
training/testing data with boundaries confirmed by aerial survey and satellite
matchups. Instead we looked at the feasibility of implementing a generic
classifier. The Envi package was appropriate for the single-image spectral
analysis and classification, but does not have facilities of dedicated statistical
software. Instead we decided to use the public domain „R‟ statistical language, so
that any training and testing procedures could be scripted for efficiency and
potential automation.
We used Linear Discriminant Analysis (LDA) classifier from the „MASS‟ package
for R, applied to all radiance bands from the images for discrimination (Lwn bands
412, 443, 488, 531, 551 and 667 nm). The classifier was trained using data from
a subset of the North Ireland salmon dataset, in the form of the regions of interest
associated with different classes of data drawn by a human operator (Figure 4.2g,
top). The prior probabilities were calculated from the training data, giving 5.7%
jellyfish, 11.7% sediment and 82.6% “sea” (changing the prior probabilities [to
1%, 30% and 69%] did not appear to make any significant difference). The
posterior values ouput by the classifier were then multiplied by 255 for each
respective class to give an RGB image – red for jellyfish, green for sediment and
blue for “sea”, with mixed classes indicated by intermediate colours.
46Table 4.3. Group means of spectral radiance variables for each class of training data.
Class Lwn 412 Lwn 443 Lwn 488 Lwn 531 Lwn 551 Lwn 667
Jellyfish -0.320 -0.061 0.359 0.460 0.403 -0.059
Sea 0.056 0.475 0.946 0.984 0.862 0.150
Sediment -0.460 -0.013 0.551 1.012 1.120 0.711
Discriminant factor 2
Discriminant factor 1
Figure 4.4. Supervised classification for Northern Ireland mauve stinger bloom, Nov. 2007, using
„R‟ Linear Discriminant Analysis: (a) Scatterplot of two discriminant functions; (b) Classification
result.
The separation of classes for each radiance channel individually is presented in
Table 4.3, indicating the variable separation between classes for different
wavelengths. This can be seen visually in „discriminant space‟, summarising the
multivariate separation between the three classes. The two points within the
47verified bloom region are highlighted with larger purple circles. The classification
results are shown as a map of the training image in which all non-cloud pixels
were classified into one of the three classes (Figure 4.4). The red patches on the
Northern Irish cost are the suspected jellyfish area, though there is also a long
red streak along the Scottish coast. That region was shown in the enhanced
colour images to be a red-brown (or very dark) in colour, not disimilar to the
jellyfish region, but more likely to be associated with dense, highly absorbing
phytoplankton. Again, without definite truth data there is a problem in attempting
to discriminate between the appearance of certain jellyfish and algae blooms.
Once better training data are identified we could extend these experiments to
develop a more generic classifier for each jellyfish species.
4.3.5 Assessment of cloud cover of Scottish waters
Satellite ocean colour data are limited by cloud cover, hence a part of the
feasibility of monitoring for jellyfish is to assess the likelihood of achieving cloud-
free views of Scottish coastal water during the periods when such blooms can
occur. Figure 4.5 presents the clear-sky count for selected months during 2008,
which of course is highly variable month-to-month and interannually. Some
months (e.g. May 2008) allow up to 20 cloud-free views, almost daily coverage;
while winter or even a poor autumn month might drop to below 10 views, and one
might have to wait up to a week for satellite coverage.
48Figure 4.5. Clear sky count for selected months. The number is the count of cloud-free Aqua-
MODIS data for each location during a month in 2008.
4.4 WP3 Discussion
Overall, there were problems gaining sufficient cloud-free match-ups with the
jellyfish bloom events we know about, which are themselves quite scarce.
Without any events studied comprehensively from airborne surveys, we are
unsure how large an area of sea these blooms may cover with density sufficient
to affect the ocean colour. But there are some promising results that certain
blooms would be visible from EO data. However, we conclude that we do not yet
have sufficient quantity or certainty of ground-truth data to determine whether we
can reliably discriminate jellyfish blooms from algal blooms.
There are many areas of future work that should be followed up in a continuation
project. The most important issue is to gain verified (through airborne surveys)
extents and densities of known jellyfish blooms for which there exists
simultaneous EO ocean colour match-ups. Additional training data would also be
collected on all possible „false alarms‟ such as dense algal blooms, to improve the
capability of the classifiers to discriminate these. With a greater quantity of
49training data we would further explore the higher resolution offered by MERIS
(300 m) and Aqua-MODIS (500 m), as this may be critical to the ability to detect
jellyfish blooms near to the coast.
There is also a great deal more scope on the methodology for spectral
classification: nonlinear classifiers or artificial neural networks; training on spectral
slope and inherent optical properties (absorption and backscatter estimates); and
combining verified ground-truth data from multiple events in order to develop
generic species-specific classifiers. Such classifiers could be trialled within a pilot
monitoring project as an early warning of possible jellyfish blooms before they
impact on the coast. Initially such warnings would need in situ verification to test
and improve classification accuracy to a level where a useful service could be
provided to the aquaculture industry.
50You can also read