DesPat: Smartphone-Based Object Detection for Citizen Science and Urban Surveys
←
→
Page content transcription
If your browser does not render page correctly, please read the page content below
i-com 2021; 20(2): 125–139

Research Article

Christopher Getschmann and Florian Echtler*

DesPat: Smartphone-Based Object Detection for
Citizen Science and Urban Surveys
https://doi.org/10.1515/icom-2021-0012

Abstract: Data acquisition is a central task in research
and one of the largest opportunities for citizen science.
Especially in urban surveys investigating traffic and peo-
ple flows, extensive manual labor is required, occasionally
augmented by smartphones. We present DesPat, an app
designed to turn a wide range of low-cost Android phones
into a privacy-respecting camera-based pedestrian track-
ing tool to automatize data collection. This data can then
                                                                         Figure 1: Smartphone capturing a pedestrian traffic dataset on loca-
be used to analyze pedestrian traffic patterns in general,
                                                                         tion.
and identify crowd hotspots and bottlenecks, which are
particularly relevant in light of the recent COVID-19 pan-
demic. All image analysis is done locally on the device
through a convolutional neural network, thereby avoiding                      When analyzing cities and urban space, evaluating
any privacy concerns or legal issues regarding video sur-                development projects, or backing civic action with quan-
veillance. We show example heatmap visualizations from                   tifiable data, the movement patterns of pedestrians and
deployments of our prototype in urban areas and com-                     other traffic participants are a key element. Usually, this
pare performance data for a variety of phones to discuss                 data is gathered only by expensive, permanently installed
suitability of on-device object detection for our usecase of             systems or through laborious fieldwork and manual count-
pedestrian data collection.                                              ing, and large datasets have consequently been out of
                                                                         reach for most citizens and many researchers. In addition
Keywords: citizen science, object detection, pedestrian                  to cost, automated data collection systems based on com-
tracking, smartphone                                                     puter vision do raise questions about consent, privacy, and
                                                                         compliance with local laws. While low-cost smartphones
                                                                         can already be used to collect manual pedestrian or car
1 Introduction                                                           counts, the device itself can also gather pedestrian data by
                                                                         using local processing power to run object detection net-
                                                                         works on the device itself to process camera input. This
Access to smartphones with their multitude of sensors has
                                                                         approach will help lower the entry barrier for citizens to
enabled a wide range of citizen science applications and
                                                                         participate in better knowing their own community, as ini-
contributions in the last decade. Some citizen science apps
                                                                         tially discussed by Jacobs in her seminal work [25] and also
are used as a frontend for manual data input while option-
                                                                         later elaborated on by Foth et al. regarding empowering
ally including built-in sensors, some rely primarily on data             citizens in the digital age [14].
provided by these sensors. From marking locations of spot-                    We present an object detection app for mobile devices
ted birds [48] or recording soundbites of nightingale popu-              that allows automated collection of pedestrian movement
lations [52] to repurposing cameras as air pollution detec-              data in a simple, inexpensive and privacy-preserving way.
tors [46], all available sensors are utilized in some way by             Smartphones can be placed on windows and balconies to
interested researchers.                                                  survey public spaces in view of the camera. The on-device
                                                                         object detection is performed with the Tensorflow mobile
*Corresponding author: Florian Echtler, Aalborg University, Aalborg,
Denmark, e-mail: floech@cs.aau.dk
                                                                         framework [1] running three different networks of varying
Christopher Getschmann, Aalborg University, Aalborg, Denmark,            speed and precision for different phones, all pretrained on
e-mail: cget@cs.aau.dk                                                   the Microsoft COCO Dataset [31]. Any detections of known

  Open Access. © 2021 Getschmann and Echtler, published by De Gruyter.         This work is licensed under the Creative Commons Attribution 4.0
International License.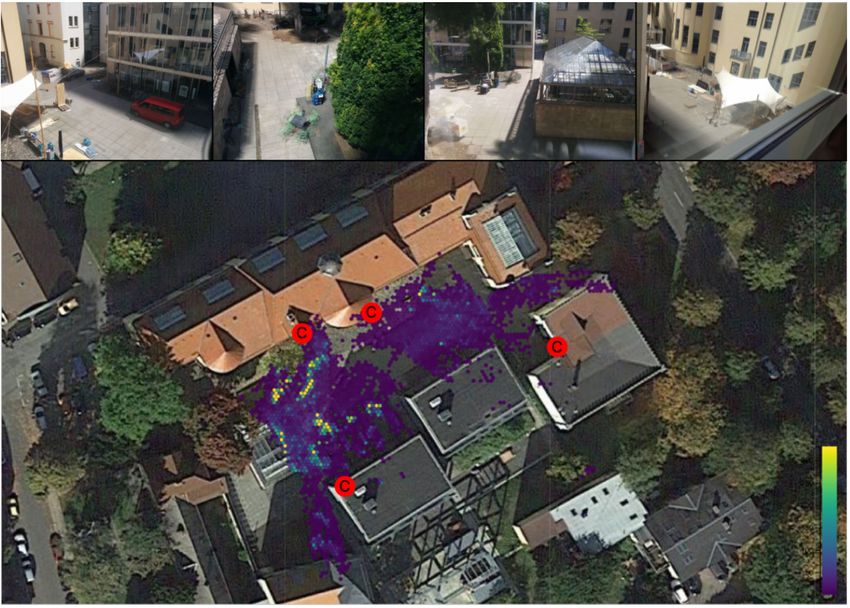
126 | C. Getschmann and F. Echtler, DesPat: Smartphone-Based Object Detection

                                                                Table 1: Citizen science apps and sensor usage.
objects by the network are postprocessed and transformed
to geocoordinates, computed from point correspondences
                                                                Project/App                            Sensor
between a map and the scene. These can be selected man-
                                                                eBird [48]                             Manual Data Input
ually by the user on an averaged image of all captures,
                                                                Nightingale [52]                       Microphone
thereby preserving all image features necessary for map-        Loss of the Night [27]                 Camera
ping points without storing or retaining any footage of in-     iSpex [46]                             Camera + external hardware
dividually identifiable pedestrians. Acquired observation       Cycletracks [42]                       GPS
data can be easily exported, shared and analyzed in a vi-       MyShake [26]                           Accelerometer

sualization tool we provide.
     Pedestrian data in general can be acquired at three lev-
els of fidelity: individual trajectories, counting data, and    image data as the main sensor to measure light pollution.
spatial distribution densities. DesPat currently allows ac-     For every built-in sensor, there is a project that makes use
quisition and visualization of distribution data, at the ad-    of direct or indirect measurements to collect data for their
vantage of lower processing requirements for inexpensive        specific research (see Table 1). This range of sensors can
or outdated smartphones.                                        even be extended by providing additional sensors or re-
     Although a server-based solution with far higher pro-      purposing existing sensors with additional hardware, as
cessing power would improve the performance allowing            demonstrated by the iSpex system [46] which turns the
trajectory detection, our approach has the advantages           smartphone camera into a spectrometer.
of being entirely self-contained, especially regarding net-          A related approach named Zensors [28] makes use
work connectivity, and will never collect any sensitive im-     of low-cost smartphones as computer vision sensors, an-
age data which might later be abused in unforeseen ways.        swering questions stated in natural language about im-
In addition, a purely app-based approach allows the cre-        age contents. The image data is sent to a server for man-
ation of datasets with a minimum of hardware cost and           ual processing by humans first. After receiving a sufficient
technical expertise, thereby enabling large-scale data col-     amount of answers from humans, a machine learning al-
lection to support novel research avenues.                      gorithm is trained on this data to take over. Zensors is well
     Our contribution is two-fold: we analyze the feasibility   suited for tasks which are not clearly defined or very di-
of running object detection networks on inexpensive and         verse in their requirements.
low-end mobile devices, and provide an open-source mo-
bile object detector app as a proof of concept for concerned
citizens and researchers to collect datasets of pedestrian,     2.2 Pedestrian Detection
cyclist and car densities with very low cost and effort.
                                                                However, for the very specific task of measuring pedestrian
                                                                traffic automatically, there are specialized hardware and
                                                                software products. To acquire an overview it is useful to
2 Related Work                                                  have a look at the most frequently used and installed tech-
                                                                nology (for a tabular overview see Table 2).
2.1 Citizen Science                                                  Short-range sensors such as pressure mats and in-
                                                                frared barriers [9] allow accurate measurements for low
Citizen scientist contributions have enabled a wide range       crowd densities on narrow walkways. While these are rela-
of research, either by contributing work, resources, or         tively inexpensive and therefore widely used sensors, they
data. However, two of the major challenges of citizen sci-      are unsuited for larger spaces. When privacy is a con-
ence are data collection and engaging with the commu-           cern, automated pedestrian counting for open spaces is of-
nity. Citizens’ smartphones can help tackle these issues,       ten conducted with far-infrared/thermal cameras, which
so researchers have been relying on them extensively.           allow better foreground/background separation and im-
     The eBird [48] project moved from purely web-based         prove detection accuracy [20]. However, like other com-
input to a smartphone app that allows citizen scientists        mercial systems in this application space, they are pro-
and birders to log locations of bird observations. Other        hibitively expensive for citizen scientists. Moreover, most
projects such as the Naturblick Nightingale app [52], log-      FIR-based counters are limited to a few meters in their op-
ging nightingale encounters, incorporate additional sen-        erational range. The same is true for stereoscopic depth
sor data and interaction, in this case microphone data. The     cameras [44], mostly used in small spaces such as en-
“Loss of the Night” app [27] relies on the camera, using the    trances in retail environments.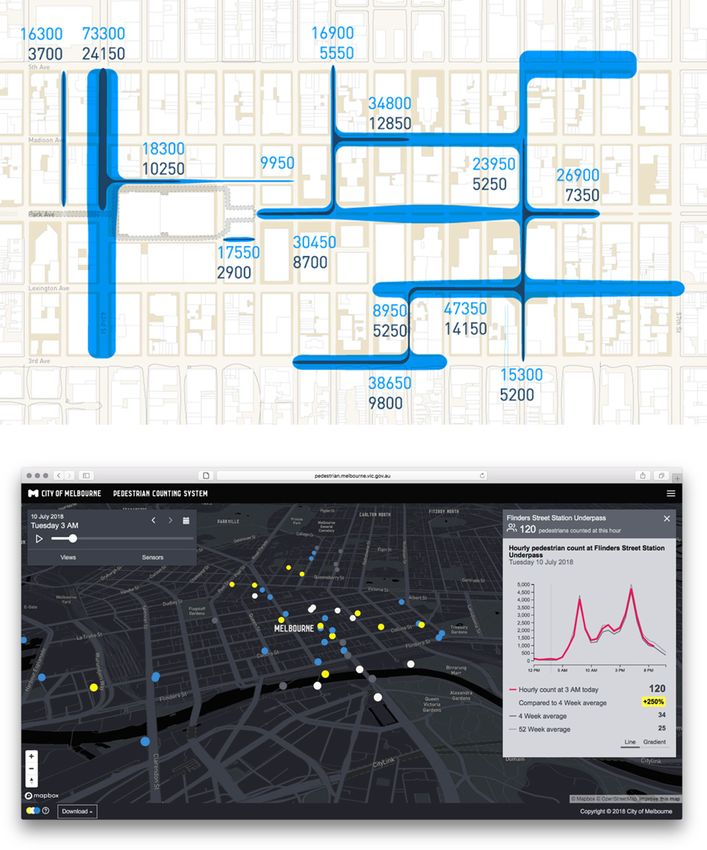
C. Getschmann and F. Echtler, DesPat: Smartphone-Based Object Detection   | 127

Table 2: Overview of available automated pedestrian data acquisition solutions.

Range              Sensor                                              Example                  Fixed Location           Accuracy
Short              Infrared Beam                                       EcoPost [9]              Yes                      High
Short              Thermal Camera                                      Goubet et al. [20]       Yes                      High
Short              Stereo Camera                                       Sensource [44]           Yes                      High
Medium             WiFi/Bluetooth-Tracking                             Bluemark [2]             Yes                      Low
Wide               Cell Data                                           MotionLogic [36]         No                       Low
Wide               Fitness Tracker                                     Strava Metro [47]        No                       Low
Wide               Citizen Science/Personal Data Donations             Cycletracks [42]         No                       Medium
Wide               Monocular Camera                                    Placemeter [38]          No                       Medium/High

     The usage of smartphone presence detection for                   to very low (on the order of 10–100 m due to wireless cell
counting and tracking passersby, either active or passive,            size), thereby only allowing very generalized statements
has emerged shortly after the widespread adoption of                  about pedestrian flows.
WiFi-enabled phones. For an extensive survey of this ap-                   Mobile optical systems are the most relevant traf-
proach, see [8]. Wide-range passive tracking of pedestri-             fic measurement systems for high-accuracy detection on
ans happens by installing static devices in retail stores             large-scale spaces. The Miovision Scout [33] is a mobile
or public spaces that record WiFi or Bluetooth signals                traffic counter camera. It can be mounted on an extend-
emitted from peoples’ phones for commercial [2] or aca-               able pole to survey streets. Computation is done after up-
demic purposes [50]. Coarse wide-area position data is                loading recorded footage to a server. The modcam [34]
also acquired by mobile network operators that track users            is marketed as a pedestrian counter for retail and facil-
based on cell tower antenna data and sell access to these             ity management. It is a monocular ceiling-mounted cam-
pseudonymized datasets. An example is Motionlogic [36],               era with a fisheye lens running the detection algorithm
a subsidiary of T-Mobile. Active tracking of smartphone               directly on the device. The startup Placemeter [38] used
users happens via installed apps or smart fitness track-              low-cost Android smartphones to gather image data. Video
ers. An example for a commercial product is Strava Metro              data from the devices is streamed to a central server where
[47], the dataset and visualization product for urban plan-           object detection is performed. Customers are billed per
ners by the fitness band company Strava. However, these               video stream and object type (car, pedestrian, etc.). Every
datasets incorporate mostly sports activities such as jog-            phone requires a constant broadband network connection
ging or cycling and are primarily useful for analyzing these          to stream video data and is not supposed to run on battery.
recreational traffic patterns rather than general traffic. In         Placemeter was acquired by Netgear and the service is no
addition, this data is biased towards social groups that              longer available to new customers.
use fitness tracking devices to quantify their workout. No-                A proof of concept for an open-source mobile object
tably, in early 2018, Strava Heatmap data inadvertently               counter is the opendatacam [35]. A Nvidia Jetson Board is
exposed previously unknown military bases in the Mid-                 used to capture webcam input on-site while processing the
dle East, thereby highlighting the privacy risks associ-              video feed with the YOLO object detection algorithm [39].
ated with pedestrian traffic data [22]. An example of a               While the opendatacam approach partly aligns with our
volunteer-driven approach is the Cycletracks app in San               goals, there are three major issues. Cost: the Jetson board
Francisco [42] which enabled cyclists to share their rides            including additional hardware is more expensive than a
with the San Francisco Transportation Authority. This data            state-of-the-art Android phone. This makes it infeasible
was used to help traffic planners understand which impact             for short-term deployments, citizen science projects, or in-
traffic elements like separated bike lanes have. After the            stallations requiring multiple viewing angles. Safety: the
project concluded in 2010, the app has been adapted by 18             wiring and lithium-polymer battery connectors need to be
other cities at the time of writing.                                  assembled by the user and soldered. Complexity: the en-
     All these methods have in common that they only pro-             closure is complex to build and the board requires solder-
vide a rough estimate of pedestrian or cyclist traffic since          ing skills; setting up the software also requires at least a
not every person carries an active smartphone or has the              basic understanding of software development.
required app installed. Access to datasets from carriers is                Similarly, the more recent Telraam project [49] as part
expensive but offers a higher amount of data in relation to           of the WeCount [53] initiative uses a Raspberry Pi for data
tracked area and time range. In both cases, accuracy is low           acquisition and processing. This approach requires less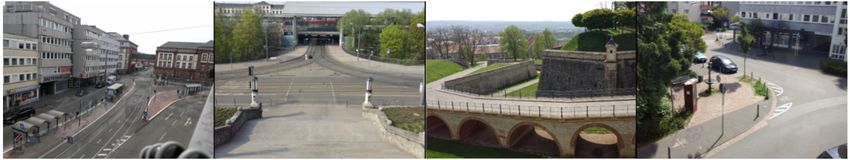
128 | C. Getschmann and F. Echtler, DesPat: Smartphone-Based Object Detection

hardware setup effort than opendatacam, but still is tar-              would otherwise require large-scale sensor installations
geted towards tech-savvy users. In contrast, DesPat aims               such as in [11, 51].
to reduce the required setup to simply installing an app
from the official store.
                                                                       2.4 Summary

2.3 Visualization and Use of Pedestrian Data                           Pedestrian tracking based on wireless data offers low-
                                                                       fidelity data for very large areas. Thermal and stereo cam-
Capturing data is only half of the work, visualizing these             eras allow more precise counting in small areas, but are
datasets is important to infer information. Most pedestrian            not applicable for larger spaces such as public places.
data visualizations are manually edited maps enriched                  Monocular camera systems such as Placemeter or Miovi-
with manually obtained data, such as maps from Gehl’s                  sion Scout make tracking objects on larger public spaces
“Public Life – Public Space” surveys [15] (see Figure 2a).             possible, although they are expensive and mostly tied to
                                                                       centralized servers.
                                                                            Consequently, none of the above-mentioned research
                                                                       or products is aligned with our approach of offering an
                                                                       open dataset acquisition tool suitable for citizen science
                                                                       and urban research. None with the exception of opendata-
                                                                       cam or the Cycletracks app is open-source or in any way
                                                                       suitable for low-cost data acquisition or citizen science.
                                                                       While Placemeter did follow the same low-cost approach
                                                                       in terms of raw data acquisition, privacy was not a con-
                                                                       cern in the architecture of their system. opendatacam and
                                                                       Telraam are similar in their purpose and share design deci-
                                                                       sions with our approach, but have a far higher entry barrier
                                                                       and are also costly.

                                                                       3 Pedestrian Detection
                                                                       Before presenting the design of our app, we will first briefly
                                                                       summarize relevant background information regarding
                                                                       vision-based pedestrian tracking and object detection us-
                                                                       ing convolutional neural networks (CNNs). Two different
                                                                       network architectures are relevant:
                                                                            Among the best-performing generalized object detec-
                                                                       tion networks is Faster Region-CNN [40] (FRCNN), which
Figure 2: Manual visualization of pedestrian counts in New York City
and online visualization for Melbourne.                                uses a two-stage approach. The first stage is the Region
                                                                       Proposal Network which generates proposals for image re-
                                                                       gions that are likely to contain a detectable object. These
     The City of Melbourne installed permanent pedestrian              region proposals are resized and fed into the second stage,
counters in the city center in 2009 and publishes this infor-          a network used solely for object recognition.
mation as a part of their open data portal [37]. This is one                Another approach in contrast to FRCNNs two-stage
of few examples where non-manual pedestrian data is vi-                architecture is handling bounding box regression and
sualized (see Figure 2b).                                              classification in a single network: Single Shot Detectors
     Once data about pedestrian flows is available, it can             (SSD) [32] generate a fixed number of pairs of class score
then be used to analyze the behavior of passersby in ev-               and bounding box coordinates for each image.
eryday situations, but also in relation to short-term in-                   The most prominent advantage of FRCNNs is that pro-
stallations such as large public displays [13, 41]. Inside             posal generation is run on the input image in original di-
larger buildings, pedestrian data can also be collected and            mensions without resizing, which is helpful for detecting
used to support Post-Occupancy Evaluation (POE), which                 small objects. For SSDs, the image needs to be resized to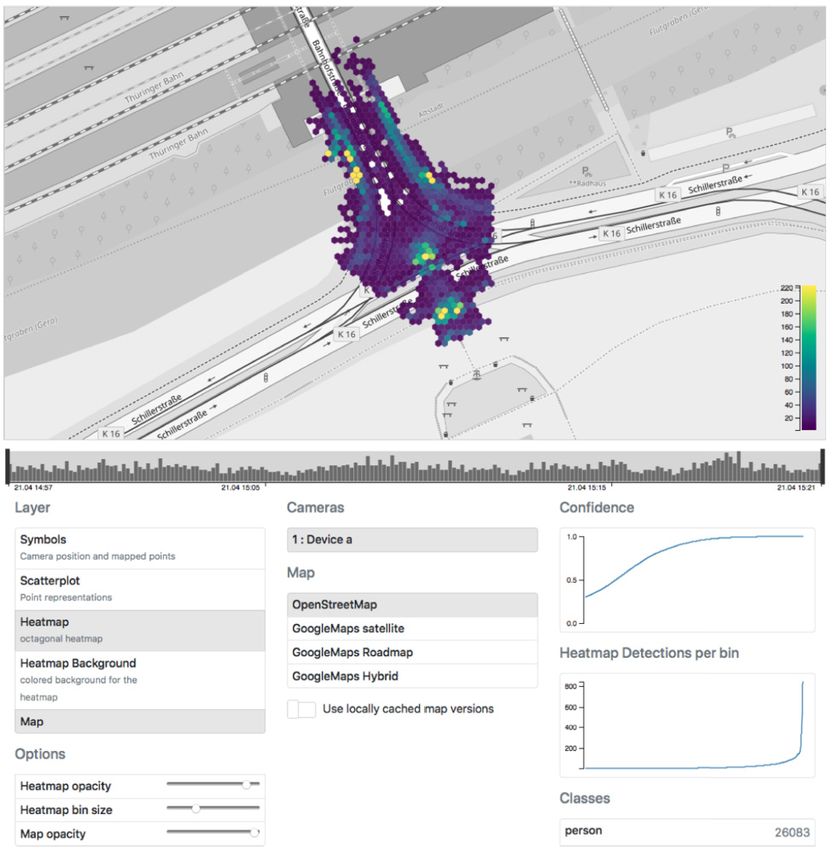
C. Getschmann and F. Echtler, DesPat: Smartphone-Based Object Detection   | 129

Figure 3: Averaged images of all four locations in our own dataset.

a fixed width and height prior to running the network.                Human feature more images with larger crowds from a
However, SSD-based networks are faster and have a lower               more diverse set of cities and are, therefore, an improve-
memory footprint.                                                     ment over other automotive pedestrian datasets in terms
     These architectures are combined with different net-             of data diversity and size, but still suffer from the same
work types, called base networks, contributing the exact              perspective issue as every other dashboard-recorded video
details of filter parameters and image operations. In ad-             frame sequence. None of these datasets is therefore suffi-
dition, both types of detection networks can be extended              ciently similar to a static pedestrian detection setup on an
by using Feature Pyramids (FPN) [30], efficient representa-           elevated viewpoint to be used for training or evaluation.
tions for image features at different scales. This increases               To the best of our knowledge, there is no comprehen-
precision for small objects at the cost of speed.                     sive dataset of urban scenes that features high-resolution
                                                                      images from a static, elevated viewpoint. Hence, we have
                                                                      decided to evaluate the performance of our system on a
3.1 Pedestrian Datasets                                               suitable self-compiled dataset.

Whenever machine learning algorithms are used, datasets
are as relevant as the algorithms themselves. Regarding               3.2 Evaluation Dataset
pedestrian detection, there are datasets which are specif-
ically created to train and evaluate detection algorithms             Our dataset consists of 160 manually annotated images
for persons in urban scenes and general datasets for ob-              from 4 different scenes (40 per scene), featuring four ele-
ject recognition and detection of multiple classes. An im-            vated observation positions with a downward viewing an-
portant example for the latter type of dataset is Microsofts          gle of 30 to 60 degrees (see Figure 3). The scenes show
Common Objects in Context (COCO) [31], a dataset for ob-              (from left to right) a bus station, a busy intersection, a
ject detection consisting of ∼200,000 images with 1.5 mil-            walkway in a public park, and a residential street corner,
lion objects labeled from 80 classes. These include person,           and are representative for a variety of urban settings. The
bicycle, car and truck.                                               2378 person bounding boxes in the evaluation batch of this
     Datasets which have been compiled to specifically                dataset have an average size of 83x193 pixel and can be
detect pedestrians include Caltech Pedestrian Detection               considered small in relation to the overall resolution of
Benchmark [7], KITTI Vision Benchmark Suite [16], INRIA               our images (11 to 20 megapixels). This is relevant regard-
Person Dataset [6], ETHZ datasets [12], TUD-Brussels [54],            ing the specific type of neural network used for detection.
CrowdHuman [45], Daimler [10], and CityPersons [56]. All of           Some architectures (SSDs, see above) require resizing of
the datasets above have in common that they are designed              the whole input image so the original resolution of an ob-
to facilitate pedestrian detection for autonomous driving             ject becomes less important, while others (Faster R-CNN,
(see also [21]).                                                      see above) operate on the original image data and bene-
     Consequently, they have several disadvantages for our            fit from a high-resolution input. In addition to person, the
application: the resolution is relatively low, the pedestri-          dataset also contains labels for the classes car, truck, bus
ans in these images are large compared to the total image             and bicycle, although only the class person will be used for
and sparse at ∼1 person per image on average, and the im-             this evaluation.
ages cover only a single city each [56]. The image data is                  Ground truth annotation of this dataset was done
recorded from a dashcam in a moving vehicle and features              manually using labelImg [29]. Bounding boxes are cover-
no elevated or static viewpoints. CityPersons and Crowd-              ing the whole extent of the object without padding, even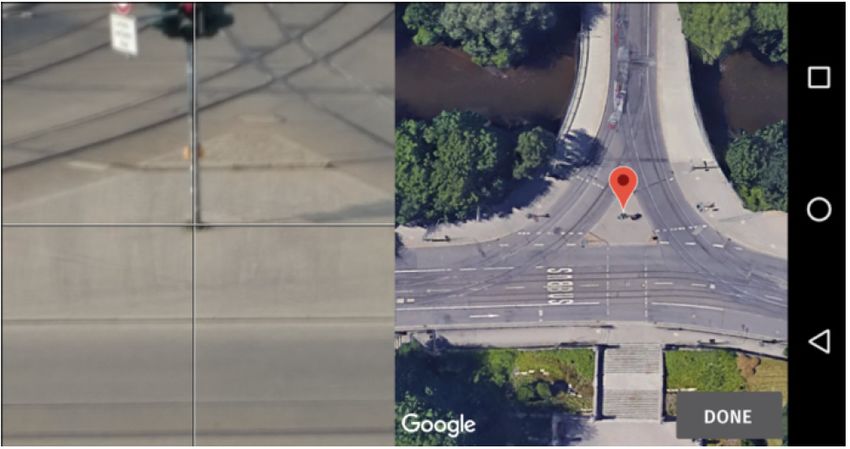
130 | C. Getschmann and F. Echtler, DesPat: Smartphone-Based Object Detection

occluded areas. As stated in [55], the learning process ben-
efits from this setting. Therefore, we also follow this ap-
proach for labeling our dataset.
     Caltech and other pedestrian datasets included the
concept of ‘ignore regions’ such as extremely crowded
parts of an image. In these regions, no detections of the
algorithm are rated as false positive or false negative. Our
evaluation dataset contains these annotations, but they
are currently ignored. Thus, performance is slightly under-
reported. The size of our dataset is small with 3495 bound-      Figure 4: Comparison of detection algorithms on full image (higher
ing boxes in total (2378 in the class person). This limits the   is better for precision, lower is better for runtime).
ability to generalize from the evaluation set, but gives a
better estimation of the overall performance for our spe-
cific use case.
                                                                 The lower precision of SSD-based models compared to
                                                                 FRCNN networks can be explained by their fixed input
                                                                 size. The SSD FPN models require rescaling to 640 pix-
3.3 Object Detection on Mobile Devices
                                                                 els, all other SSD models to 300 pixels before processing.
To select the best-suited architecture for our detector on       FRCNN networks deliver better precision, but also have
a mobile system, several requirements need to be consid-         higher memory consumption and are slightly slower.
ered:                                                                 To further improve performance for the task of detect-
     Precision and speed are always a tradeoff. For the          ing small pedestrians in high-resolution images, several
task of recording the paths of pedestrians precision is a        points must be taken into consideration.
higher priority than speed, for counting pedestrians it is
vice versa. For both modes, faster networks reduce battery
consumption and increase the total observation time.             3.4 Image Tiling
     Memory: on many smartphones, processing power is
not the limiting factor, but rather memory capacity and          One of the most promising approaches of upscaling the
speed. A big network may perform well on modern phones           whole image as proposed for the Citypersons dataset [56]
with 2–4 GB RAM but will run out of memory on older mod-         is not an option on a mobile platform, as this increases
els.                                                             memory consumption and is only suitable for FRCNN net-
     Object size. Pedestrians are small objects in high-         works. However, an effect similar to upscaling without
resolution images of public spaces. The network needs to         the same memory requirements can be achieved by a
detect objects at a lower scale reliably. This is our main       sliding-window approach. Consequently, we split the full-
problem which needs to be addressed.                             resolution input image in non-overlapping tiles of con-
     To test different networks on Android we use the Ten-       stant size, downscale each tile to the network’s fixed input
sorflow Mobile Framework [17] in combination with the            size, and detect objects in every tile separately.
Tensorflow Object Detection API [18]. This allows us to use           When applying this approach to the best-performing
the networks in the Tensorflow model zoo which have been         networks in terms of speed and precision, both compu-
pre-trained on the COCO dataset [31].                            tation time and precision improve considerably (see Fig-
     We compare several SSD and FRCNN models with dif-           ure 5). The mobilenet-based SSD has a fixed input size of
ferent base recognition networks (see Figure 4). The left        300 pixels and shows the best tradeoff between accuracy
bar (blue) represents average precision as mAP for the           and speed at image tiles of about twice its input size. If Fea-
class person (higher is better). The right bar (green) rep-      ture Pyramids are used (at 640 pixels input size), the image
resents the complete processing time of the network from         tiles can be increased to three times the input size before
image input to object output for one image. Runtime was          the models begin to show a strong decrease in precision.
measured on a mid-level smartphone (LG G6). The abso-            This shows that architectures with Feature Pyramids have
lute runtime is device-dependent, but the relative runtime       an advantage for detecting small objects in our evalua-
will remain fairly constant.                                     tion dataset, while differences between the base networks
     In terms of speed, Mobilenets in both versions [23, 43]     (resnet50 or mobilenets) can be neglected for the SSD FPN
as a base for SSD outperform the larger FRCNN networks.          architecture.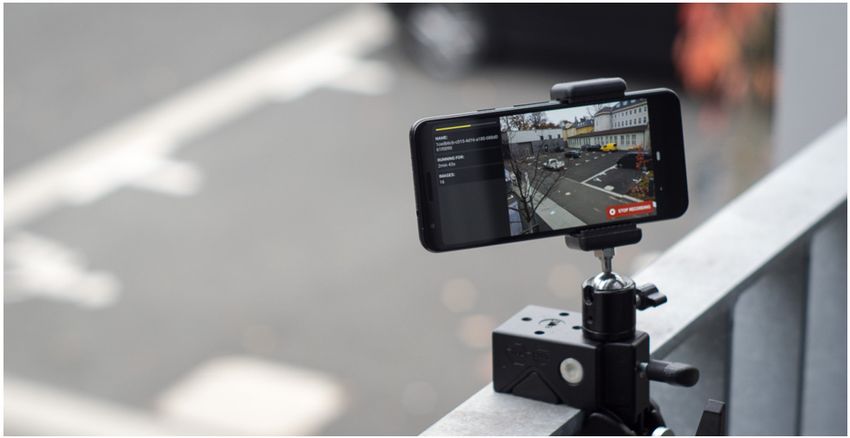
C. Getschmann and F. Echtler, DesPat: Smartphone-Based Object Detection | 131

                                                                         our small evaluation dataset. Expanding our dataset and
                                                                         reevaluating transfer-learning is part of the future work.

                                                                         3.6 Results
                                                                         While FRCNN outperforms SSD variants in terms of pre-
                                                                         cision, even small FRCNN networks have a higher mem-
                                                                         ory consumption than every SSD model. When choosing
                                                                         SSD models, we recognize that feature-pyramid networks
                                                                         (FPN) have a clear advantage over standard variants. The
                                                                         two FPN networks, SSD with mobilenets v1 and resnet50 as
                                                                         base networks perform at the same level while the resnet
                                                                         network has a slightly higher inference time and binary
                                                                         size. While FPN SSDs perform well on larger tiles than reg-
                                                                         ular SSDs, their inference time is considerably higher, es-
                                                                         pecially on mobile devices. Consequently, we settle on the
Figure 5: Precision and runtime for a full image in relation to tile     SSD mobilenet v1 network as the default object detection
sizes. Inference time was measured across the whole evaluation set       network for our app. We use non-overlapping tiles to im-
on a GPU (Nvidia GeForce GTX1050Ti). The FPN model has a larger
                                                                         prove the precision at small scales for SSD networks. Since
input size and is evaluated starting at 640 pixels. X-axis increments:
                                                                         this network offers the highest speed at the expense of pre-
50 pixels.
                                                                         cision, we call this the Low-Fidelity option. Phones with
                                                                         sufficient computing power can optionally use the FRCNN
                                                                         inception v2 model (Mid-Fidelity) or the SSD mobilenet v1
     When splitting the image into tiles, two issues are in-
                                                                         FPN network (High-Fidelity) for increased precision.
troduced. There are detection artifacts when objects are
split across tile boundaries (causing either no detection or
double detection) and a reduced field of view as fixed tile
sizes which are not an exact divisor of the image size will              4 App & Visualization
exclude areas around the image border, resulting in false
negatives.                                                               4.1 DesPat Android App
                                                                         We selected Android as our target platform, as we want to
3.5 Transfer Learning                                                    make use of inexpensive smartphones and need to access
                                                                         the camera without user interaction. Our app is targeted at
We assume that the precision of the networks, pre-trained                phones running Android 6.0 (API level 23) and above. At
on COCOs 80 classes, can be further improved by transfer                 the time of writing, this corresponds to about 74.8 percent
learning and fine-tuning on a more specific dataset. The                 of all active devices using the Google Play Store [19].
main difference between COCO’s examples for the person                        The core functions of our app consist of five distinct
class and our dataset are object sizes and viewing angles.               parts:
     To evaluate possible gains achieved by transfer learn-                   Image Capturing. For periodic image capture, the app
ing, we split our evaluation dataset into 120 images (3                  needs to trigger the shutter at fixed intervals without any
scenes) for training and 40 images (1 scene) for evaluation.             user interaction (and not when the system schedules it).
With a subset of three COCO-classes (person, bicycle, car)               The capturing service can run in two different modes: per-
we retrained the fastest but worst-performing network SSD                sistent and non-persistent camera.
mobilenet v1 on 5490 randomly-cropped image tiles de-                         In non-persistent mode, the camera module is closed
rived from the training set images. However, when evaluat-               after each capture. It is powered down and an event is
ing the precision of fine-tuned and original network on the              scheduled using Androids Alarm Manager to wake up in
remaining 40 images, no significant improvement could                    time for the next capture. Once this happens, the camera
be reported. We assume that examples of persons from                     is initialized and a full metering run is started to get a fo-
our dataset and COCO are too close for transfer learning                 cus lock as well as determine exposure and white balance.
to yield any substantial precision gains when trained on                 This may take up to 1.5 seconds, depending on the illumi-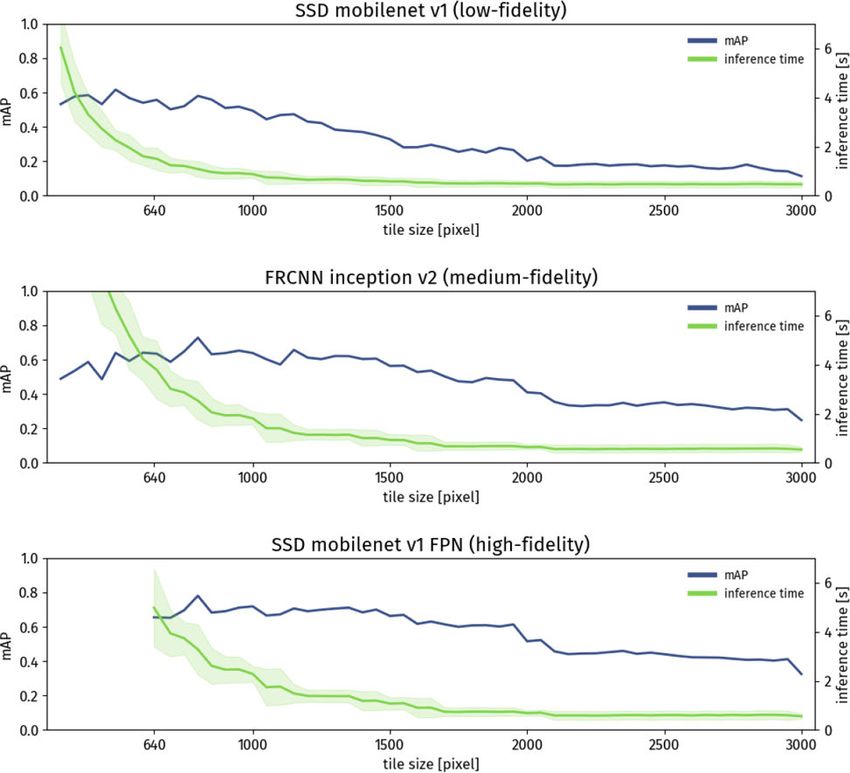
132 | C. Getschmann and F. Echtler, DesPat: Smartphone-Based Object Detection

nation and hardware. By allowing the device to sleep in                ther the phone is inaccessible, or touching the phone while
between captures, more than a full day of battery life can             mounted may change the camera orientation, thereby ren-
be achieved. The minimum shutter interval in this mode is              dering the point correspondences invalid. The alternative
6 seconds.                                                             is storing an image and selecting the correspondences af-
     In persistent mode, the camera is initialized at startup          ter capturing. To avoid inadvertent capture of unsuspect-
and runs permanently in preview mode. Consequently,                    ing pedestrians, we average all captured images to create
both the processor as well as the camera module are pow-               a mean image containing only static objects. Even persons
ered up and active. When the camera is triggered, images               standing or sitting in place will blur after processing only
can be captured without delay as the camera is active and              a few images. To achieve a fully pedestrian-less scene, a
autofocus/auto-exposure have already been finished. This               minimum of 30 to 50 images is usually sufficient, depend-
mode increases power consumption and heats up the de-                  ing on the amount of movement in the scene and the pixel
vice, but allows shutter intervals of less than 6 seconds.             size of the non-static objects.
3 hours of battery life are common in this mode among                       Data Export. All data from a single capturing session
tested phones if running at maximum possible speed, and                can be exported as a ZIP archive by using the Android
about 10 to 12 hours at one image per minute.                          share functionality. This allows to save the file on the de-
     Detection. After image capture the footage is ana-                vice, in a shared cloud folder, or directly attach it to an
lyzed for pedestrians and other tracked objects. Processing            email. Each archive contains three files: a CSV file with
of the buffered images is done in batches by the detector              all detections, including confidence values, class, and co-
service, which runs once a minute when the phone wakes                 ordinates; a JSON file with session metadata such as de-
up and takes care of the costly process of running the de-             vice name and homography points; and the averaged re-
tection algorithm on every image. After the algorithm has              sult from all captured images as JPEG.
processed the image, no image data is retained. The detec-
tion algorithms are discussed in detail in Section 3.
     Homography Transformation. The detection algo-                    4.2 VizPat Visualization Tool
rithm returns bounding boxes for detected objects, which
need to be transformed to map coordinates. Before trans-               The exported CSV data can be processed with spreadsheet
formation, bounding boxes are reduced to a single point.               software such as Excel and visualized with Google Maps,
For cars, this is the center point of the bounding box; for            but neither of these tools performs well on the task of vi-
pedestrians and bicycles, the center of the lower bounding             sualizing pedestrian density data. Since data acquisition
box boundary (e. g. a person’s feet). To transform these im-           is pointless without means of examining and evaluating,
age points to map coordinates, a homography transforma-                we present our own visualization tool:
tion is calculated. At least four corresponding points are                  Density data for arbitrary object classes is displayed as
required, which have to be manually selected on a map                  a binned heatmap or in a raw scatter plot on top of a map
and an image of the scene (Figure 6).                                  layer, which can be loaded from Google Maps or Open-
     Image Averaging. The corresponding points to com-                 StreetMap. All layers are interactive and can be turned on
pute the homography matrix need to be selected manually,               or off. The map allows panning and zooming; the heatmap
however, doing that on location is usually not feasible. Ei-           parameters regarding bin size and opacity can also be
                                                                       changed. Data can be filtered by time, object class and
                                                                       recording device. Datasets gathered in parallel from dif-
                                                                       ferent phones or sequentially from the same device can
                                                                       be combined. The JavaScript library D3 [3] is used to in-
                                                                       teractively manipulate the visualization and to filter data
                                                                       points.
                                                                            We choose a heatmap with hexagonal bins as default
                                                                       visualization [4], since binned map positions are easy to
                                                                       visually parse and do not give a false presumption of lo-
                                                                       cation accuracy in contrast to a scatterplot (which is also
                                                                       available as an optional visualization). The hexagon is an
                                                                       obvious choice for tile shape since its geometry is efficient
Figure 6: User interface for selecting image to map point correspon-   to compute and it is the highest-order polygon that allows
dences.                                                                tiling without overlapping.
C. Getschmann and F. Echtler, DesPat: Smartphone-Based Object Detection       | 133

                                                                       (high-fi), running on limited hardware in terms of process-
                                                                       ing power, memory and battery. Our reference network is
                                                                       the best-performing available network from the Tensor-
                                                                       flow model zoo, trained on COCO and executed on a desk-
                                                                       top GPU (NVidia GeForce GTX1050Ti). Ground truth was
                                                                       compiled by a human without time constraints and with
                                                                       access to the whole image and the complete image series.

                                                                       Table 3: Precision of the three networks used in the app (mAP [24]
                                                                       for class person). The reference network always uses 6 tiles per
                                                                       image and does not suffer from the tiling error of false negatives at
                                                                       image borders.

                                                                       Network                                                          mAP

                                                                       SSD mobilenet v1 @ 800 px (low-fi)                               0.54
                                                                       FRCNN inception v2 @ 800 px (mid-fi)                             0.65
                                                                       SSD mobilenet v1 FPN @ 800 px (high-fi)                          0.78
                                                                       FRCNN NAS @ 1/6 (reference)                                      0.86
                                                                       Ground Truth                                                     1.00

Figure 7: Web-based visualization tool with heat map (top), timeline
(center), and user settings (bottom).
                                                                            The low-fi network only achieves a relatively low over-
                                                                       all mAP of 0.54. However, the mid-fi and high-fi networks
                                                                       achieve an average precision of 0.65 and 0.78 respectively,
    For a live demo, see http://despat.de/visualize/.                  which compares very well to the reference network with an
                                                                       mAP of 0.86. An average precision of 0.78 and above on our
                                                                       very challenging dataset, without any additional postpro-
5 Performance Evaluation                                               cessing, can be noted positively. In addition, the reference
                                                                       network runs about 30 times slower than our high-fi net-
Our evaluation will focus on precision and speed of the de-            work when both are executed on the same desktop GPU.
tector network. Precision is reported as Mean Average Pre-
cision (mAP), calculated similarly to the COCO evaluation
as the area under the full interpolated precision-recall-
curve (but only with an Intersection over Union thresh-
old of 0.5 because the improved localization metric us-
ing multiple thresholds is not required). For a detailed
explanation of the mAP calculation, see [24]. All speed
measurements are given per image, independent of cam-
era resolution. When evaluating inference time measure-
ments it should be noted that all computation was done
on the CPU of the smartphone as no GPU support for all
                                                                       Figure 8: Runtime of the networks on different devices at native
used network models was available at the time of writing.              camera resolution, optimized for maximum precision (error bar is
This may change in the near future and we assume that                  standard deviation).
some phones in the mid- to high-cost section will improve
their performance with the Neural Networks Interface in-
troduced in Android 8.0.                                                    The phones used as test cases have been chosen from
                                                                       all price ranges over the last 2 years. The Google Pixel 3a
                                                                       is priced around 450 USD, representing the higher-end de-
5.1 Performance of the Detector                                        vice class (by performance). Mid-range phones are repre-
                                                                       sented by the LG G6, available at about 230 USD, while low-
We evaluate three networks: SSD mobilenet v1 (low-fi),                 end phones such as the Motorola 5GS are available for less
FRCNN inception v2 (mid-fi), and SSD mobilenet v1 FPN                  than 130 USD.
134 | C. Getschmann and F. Echtler, DesPat: Smartphone-Based Object Detection
Results from the low-fidelity network highlight the battery temperatures of 50 °C or less. Consequently, if the
runtime-precision tradeoff mentioned above. It runs at just individual combination of phone and network requires 5
4.5 s on the high-end and 4.6 s on the mid-range phone, seconds per image, a recommended shutter interval of 10
thereby easily allowing a capture rate of 5 to 6 images per seconds is suggested to the user.
minute. The performance on the low-end device is worst at
14.3 s.
The mid-fidelity network’s runtime is 32.7 s and 41.5 s
on high and mid-range phones. The low-end phone fin-
6 Example Results
ishes processing after 83 s, setting the maximum capture
interval to about 0.5 images per minute. Based on our performance analysis, we conclude that it
The high-fidelity network takes only marginally more is indeed feasible to support citizen science through ob-
time on the high and mid-level models, running for 36.4 ject detectors on inexpensive mobile devices. We present
and 45.9 s. Although it is possible to run the high-fidelity two real-world examples of recorded datasets and discuss
network on the low-end phone, it is prohibitively slow at these results (running the high-fi network).
about 153 s. The first dataset in Figure 9 from the rear entrance
While some phones will be slower in detection, their of the train station in Erfurt, Germany is a good example
maximum in precision is potentially higher due to their ad- of the amount of space a single camera can survey when
vantage in resolution. However, a gain in resolution can- placed well. It is clearly visible which routes people prefer
not be directly translated to gains in precision due to inex- to cross the street. When the visualization tool is used, it is
pensive optical systems, small sensor size, and resulting even possible to see the arrival time of trams and trains on
poor image quality. the timeline. Live visualization for this dataset is available
Note that all these measurements were conducted at http://despat.de/visualize/#dataset_erfurt.
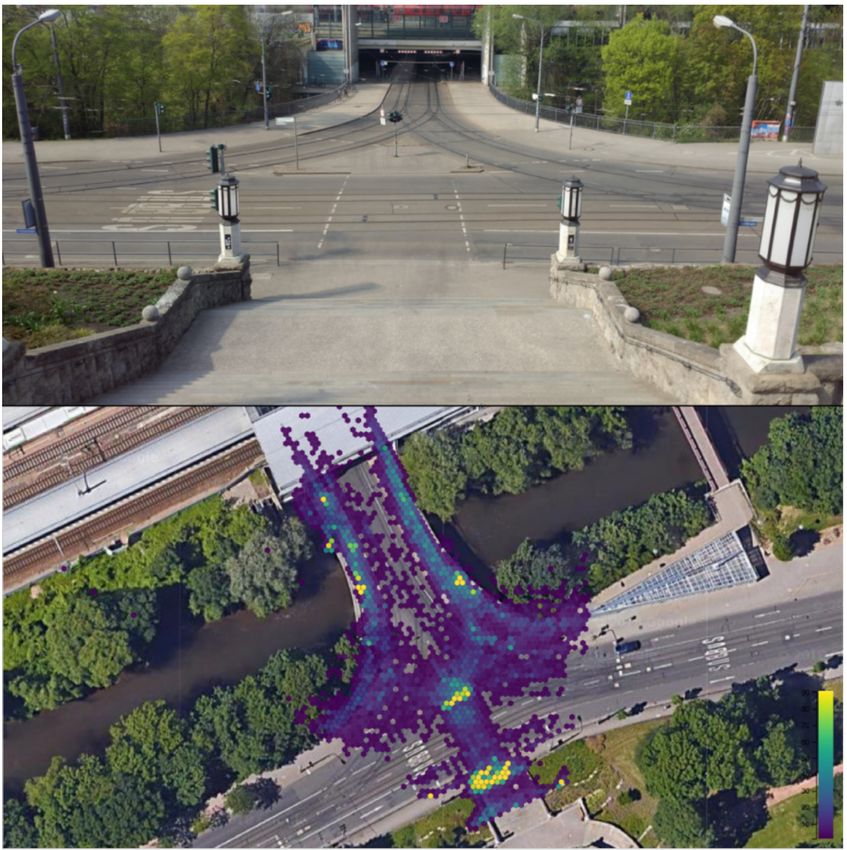
with networks running at maximum resolution and the The second dataset in Figure 10 was recorded at a
smallest feasible tile size and thus are the upper bound- the Summaery festival in Weimar, Germany by four de-
ary. If a phone is placed in a store entrance or on a balcony vices simultaneously. When using multiple phones in par-
surveying only a narrow street, distance from the camera allel, a more complex geometry of a public space (or sim-
to pedestrians is low and their size in the image is consid- ply larger spaces) can be surveyed. However, the visu-
erably higher. This allows to increase the tile size and re- alization tool will currently naively merge overlapping
duces the number of overall tiles, thereby improving run- areas, pedestrians that have been picked up by several
time. cameras at once are simply added up. Live visualization
In conclusion, we currently select the low-fi network for this dataset is available at http://despat.de/visualize/
as the default choice, even though it has relatively low pre- #dataset_summaery.
cision. However, its runtime stays below 10 s on most de-
vices, even at full resolution, thereby at least partially com-
pensating for missed detections through a higher update
rate.
7 Discussion
Based on experiences from our deployments for urban
survey datasets described above, we conclude that a
5.2 Performance and Thermal Limits
downward-facing viewing angle of approximately 30 de-
The heat management capacities of smartphones are not grees is best-suited for urban spaces. At lower angles,
designed to support long periods of full CPU load. When pedestrians will start occluding each other in groups,
running a phone constantly at full load, the temperature while at higher angles, the raw images will differ signif-
causes processor throttling, which increases processing icantly from the person images the neural network was
time. This sets device temperature as the upper bound- trained with, thereby lowering detection rate. In our sta-
ary of performance rather than computing resources of the tion dataset, the distance between the camera and the far-
processor. When running the camera subsystem perma- thest detections is approximately 80 m, while the closest
nently (camera is active and providing a preview datas- detections are about 14 m from the camera. This is caused
tream), battery temperature increases by 10 °C above am- by image tiling: at lower distances, pedestrians will be
bient. We determined empirically that about 50 to 70 % split across two or more image tiles, thereby inhibiting de-
CPU utilization keeps most phones within safe working tection. This problem can be mitigated by using larger tileC. Getschmann and F. Echtler, DesPat: Smartphone-Based Object Detection | 135 Figure 9: Train station rear entrance, Erfurt (top: averaged camera view, bottom: map visualization). Map image data: ©Google 2018, GeoBasis-DE/BKG ©2009. sizes if close-range detection is desired, e. g. in smaller in- During our deployments, we noted that while our door spaces where the minimum distance is likely to be processing workflow is designed to take people’s privacy lower. Despite these limitations, our app is able to provide into account and does not retain images, there is no way data on urban movement patterns with far less staff re- to communicate this without additional measures. When sources than common methods – a high-end device is po- running unattended setups from elevated viewpoints, it tentially able to run for over 12 hours continuously, which may be advisable to keep the smartphone unobtrusive. In could only be achieved with several persons taking turns all other cases, one needs to be prepared to engage with during a manual survey and would already constitute an pedestrians and discuss the work, however, this was not Accuracy Level 3 survey according to the guidelines of the an issue at any deployment as people tend to be curious City of London [5]. and are generally pleasant.
136 | C. Getschmann and F. Echtler, DesPat: Smartphone-Based Object Detection

Figure 10: Summaery festival, Weimar (top: averaged camera views, bottom: map visualization with camera locations). Map image data:
©Google 2018, GeoBasis-DE/BKG ©2009.

      The collected data is currently does not provide               smartphones, this compromise may be outdated in a few
additional attributes of passersby, such as group size,              years’ notice.
age, or walking speed, which can arguably be collected                    Nevertheless, we are already able to evaluate general
through manual surveys. We discuss potential exten-                  traffic patterns and desire paths (Where do people cross
sions to alleviate some of these limitations in the future           a public space?), quantify dwelling time (The bikelane in
work.                                                                front of my house is blocked by illegally parked cars for 6
      The approach of tiling images to increase detection            hours per day on average.), give relative usage estimation
precision for tiny objects is suitable for the specific prob-        (Pedestrian density at 9 am is twice as high as at 11 am.), or
lem at hand. While this is a tradeoff between speed and              analyze crowd hotspots which should be avoided during
precision, we conclude that this is the most feasible op-            the COVID-19 pandemic (Bus stop is overcrowded between
tion. Especially for small objects, the temporal resolution          7 and 8 am.).
still is limited, allowing us to record occurrences at fixed              While our app is compatible with every device running
intervals but not the individual paths. This yields neither          Android Version 6.0 or later, detector performance relies
trajectory data nor counting data, but allows object iden-           heavily on the hardware of the device. By offering faster
tification (Is this a pedestrian, a cyclist or a car?). While        but less precise networks and using less tiles per image, we
tracking individual trajectories of objects would be possi-          can still utilize even very slow hardware. However, preci-
ble using a different computer vision approach, tracking             sion also relies on the camera system and especially bud-
trajectories and object classes of small objects at the same         get hardware with 5 or 8 megapixel cameras are not suit-
is not feasible given commodity smartphones. However,                able for large spaces. Nevertheless, these low-end devices
given the rise in image processing capabilities of modern            can still be used for small streets and pathways.
C. Getschmann and F. Echtler, DesPat: Smartphone-Based Object Detection | 137
8 Future Work 9 Conclusion
We are currently planning real-world deployments with ur- We present an end-to-end open-source solution to enable
ban studies and architecture researchers exploring poten- researchers and citizen scientists alike to collect and ana-
tial integration of our app into their data acquisition pro- lyze pedestrian movement data using object detection al-
cedures. Historic and current data used in this context is gorithms on widely-available smartphones. Our app uses
overwhelmingly pedestrian counts, sampled in 10 to 60 convolutional neural networks running directly on a wide
minute timeslots. To include our app well in already exist- range of Android phones to enable automated data acqui-
ing data acquisition procedures, the additional functional- sition while avoiding potentially privacy-sensitive image
ity to record reliable counts in addition to pedestrian paths storage or transport. We conclude that it is indeed feasi-
is required and is part of our future work. We also will in- ble to augment citizen science apps by object detectors on
vestigate how DesPat can be integrated with related, more smartphones of all price-ranges, even old or inexpensive
centralized projects such as Telraam [49] without compro- devices. In the case of data acquisition for urban surveys,
mising the privacy of passersby. the tradeoff between runtime and accuracy is suitable for
Future workshops nonwithstanding, however, we detecting pedestrians in order to evaluate their paths or a
publish our app, all source code, and additional materials general assessment of crowdedness and space allocation
(datasets etc.) under permissive licenses to support adap- in a given timeframe.
tion and modification of resources. Further work will focus on improving detection perfor-
There are three main categories we want to improve mance, and exact counting of objects in small areas. We
in the app itself: we want to add functionality regarding encourage other researchers to evaluate if their research
data features, improve the performance of the detector, can benefit from this automatized and inexpensive way
and make our app more accessible for usage in a workshop of data acquisition. All resources (evaluation dataset with
scenario. annotations, source code, data from live deployments) are
Counting and Action Labels: We plan to introduce available under permissive licenses to reuse and adapt at
action labels for detected objects (static and moving) http://despat.de/visualize/#dataset_summaery.
based on inter-image comparison. This allows answering
the question where people are moving through, and where
people need or want to spend time lingering around. In ad-
dition, by generating object paths, the movement speed Reproduction Note
can be calculated and accurate counting becomes possi-
ble. We will investigate if this can be reliably done for small The application, source code including documentation,
regions of the image (e. g. zebra crossings, street corners, anonymized data, and scripts for generating all referenced
etc) with an increased update rate. Additionally, other ob- plots is available publicly: https://github.com/volzotan/
ject classes besides pedestrians could then be counted, despat.
such as fast-moving bicycles or cars.
Extending the dataset and transfer learning: Ex- Funding: This work was partially supported by the Ger-
tending our dataset of ground-truth annotated high- man Research Foundation (Deutsche Forschungsgemein-
resolution pedestrian images is a priority. We are explor- schaft, DFG) through individual grant EC437/1-1.
ing options how this could be integrated into a workshop
format with interested researchers. Once a larger dataset is
available, we will reevaluate the precision improvements
achievable with transfer-learning for our specific problem
References
domain of small-objects with a downward facing angle.
[1] Martin Abadi, Paul Barham, Jianmin Chen, Zhifeng Chen,
Ignore Regions: Not all parts of an image may contain Andy Davis, Jeffrey Dean, Matthieu Devin, Sanjay Ghemawat,
pedestrians. When starting a new session, the user could Geoffrey Irving, Michael Isard, Manjunath Kudlur, Josh
mark ignore regions such as sky or buildings. When the im- Levenberg, Rajat Monga, Sherry Moore, Derek G. Murray,
age is subdivided into tiles, all tiles that are covered by an Benoit Steiner, Paul Tucker, Vijay Vasudevan, Pete Warden,
Martin Wicke, Yuan Yu, and Xiaoqiang Zheng. 2016.
ignore region can be skipped during detection. This would
TensorFlow: A system for large-scale machine learning. In
reduce processing time as well as reducing false positives 12th USENIX Symposium on Operating Systems Design and
from reflections in mirror facades or people visible through Implementation (OSDI’16). 265–283. https://www.usenix.org/
windows. system/files/conference/osdi16/osdi16-abadi.pdf.138 | C. Getschmann and F. Echtler, DesPat: Smartphone-Based Object Detection
[2] Bluemark Innovations. 2021. Products. Website. Retrieved Jan object_detection.
10, 2021 from https://bluemark.io/products/. [19] Google 2021. Play Store Distribution Dashboard. Website.
[3] Mike Bostock. 2021. Data-Driven Documents (D3). Website. Retrieved Jan 10, 2021 from https://developer.android.com/
Retrieved Jan 10, 2021 from https://d3js.org/. about/dashboards/.
[4] D. B. Carr, R. J. Littlefield, W. L. Nicholson, and J. S. Littlefield. [20] Emmanuel Goubet, Joseph Katz, and Fatih Porikli. 2006.
1987. Scatterplot Matrix Techniques for Large N. J. Amer. Pedestrian tracking using thermal infrared imaging, Bjørn F.
Statist. Assoc. 82, 398 (1987), 424–436. https://doi.org/10. Andresen, Gabor F. Fulop, and Paul R. Norton (Eds.). 62062C.
1080/01621459.1987.10478445. https://doi.org/10.1117/12.673132.
[5] City of London. 2021. Measuring Pedestrian Activity. Website. [21] Irtiza Hasan, Shengcai Liao, Jinpeng Li, Saad Ullah Akram,
Retrieved Jan 10, 2021 from https://www.polisnetwork.eu/ and Ling Shao. 2020. Generalizable Pedestrian Detection: The
uploads/Modules/PublicDocuments/london_lip_measuring_ Elephant In The Room. arXiv:2003.08799 [cs.CV].
pedestrian_activity.pdf. [22] Alex Hern. 2018. Fitness tracking app Strava gives away
[6] Navneet Dalal. 2005. INRIA dataset. Website. Retrieved Jan 10, location of secret US army bases. Website. Retrieved Jan 10,
2021 from http://pascal.inrialpes.fr/data/human/. 2021 from https://www.theguardian.com/world/2018/jan/
[7] Pjotr Dollár, Christian Wojek, Bernt Schiele, and Pietro Perona. 28/fitness-tracking-app-gives-away-location-of-secret-us-
2009. Pedestrian Detection: A Benchmark. In Proceedings of army-bases.
CVPR 2009. http://www.vision.caltech.edu/Image_Datasets/ [23] Andrew G. Howard, Menglong Zhu, Bo Chen, Dmitry
CaltechPedestrians/. Kalenichenko, Weijun Wang, Tobias Weyand, Marco
[8] Adriana Draghici and Maarten Van Steen. 2018. A Survey of Andreetto, and Hartwig Adam. 2017. MobileNets: Efficient
Techniques for Automatically Sensing the Behavior of a Crowd. Convolutional Neural Networks for Mobile Vision Applications.
ACM Comput. Surv. 51, 1, Article 21 (Feb. 2018), 40 pages. arXiv:1704.04861 [cs] (April 2017).
https://doi.org/10.1145/3129343. [24] Jonathan Hui. 2021. mAP (mean Average Precision) for
[9] Eco Compteur. 2021. Pyro Post. Website. Retrieved Jan 10, 2021 Object Detection. Website. Retrieved Jan 10, 2021 from
from https://www.eco-compteur.com/en/products/pyro- https://medium.com/@jonathan_hui/map-mean-average-
range/urban-post. precision-for-object-detection-45c121a31173.
[10] Markus Enzweiler and Dariu M. Gavrila. 2009. Monocular [25] Jane Jacobs. 1961. The Death and Life of Great American Cities.
Pedestrian Detection: Survey and Experiments. IEEE Random House.
Transactions on Pattern Analysis and Machine Intelligence 31, [26] Qingkai Kong, Richard M. Allen, and Louis Schreier. 2016.
12 (Dec. 2009), 2179–2195. https://doi.org/10.1109/TPAMI. MyShake: Initial observations from a global smartphone
2008.260. seismic network. Geophysical Research Letters 43, 18 (2016),
[11] Varick L. Erickson, Alex Beltran, Daniel A. Winkler, Niloufar P. 9588–9594. https://doi.org/10.1002/2016GL070955.
Esfahani, John R. Lusby, and Alberto E. Cerpa. 2013. TOSS: [27] Christopher Kyba. 2021. Loss of the night. Website. Retrieved
Thermal Occupancy Sensing System. In Proceedings of the 5th Jan 10, 2021 from http://www.verlustdernacht.de/Loss_of_
ACM Workshop on Embedded Systems For Energy-Efficient the_Night_App_engl.html.
Buildings (Roma, Italy) (BuildSys’13). ACM, New York, NY, [28] Gierad Laput, Walter S. Lasecki, Jason Wiese, Robert Xiao,
USA, Article 35, 2 pages. https://doi.org/10.1145/2528282. Jeffrey P. Bigham, and Chris Harrison. 2015. Zensors:
2534155. Adaptive, Rapidly Deployable, Human-Intelligent Sensor
[12] Andreas Ess, Bastian Leibe, Konrad Schindler, and Luc van Feeds. In Proceedings of the 33rd Annual ACM Conference
Gool. 2008. A Mobile Vision System for Robust Multi-Person on Human Factors in Computing Systems (Seoul, Republic
Tracking. In IEEE Conference on Computer Vision and Pattern of Korea) (CHI’15). ACM, New York, NY, USA, 1935–1944.
Recognition (CVPR’08). IEEE Press. https://doi.org/10.1145/2702123.2702416.
[13] Patrick Tobias Fischer and Eva Hornecker. 2012. Urban HCI: [29] Tzu Ta Lin. 2021. labelImg. https://github.com/tzutalin/
Spatial Aspects in the Design of Shared Encounters for labelImg/.
Media Facades. In Proceedings of the SIGCHI Conference [30] Tsung-Yi Lin, Piotr Dollár, Ross Girshick, Kaiming He, Bharath
on Human Factors in Computing Systems (Austin, Texas, Hariharan, and Serge Belongie. 2016. Feature Pyramid
USA) (CHI’12). ACM, New York, NY, USA, 307–316. https: Networks for Object Detection. arXiv:1612.03144 [cs] (Dec.
//doi.org/10.1145/2207676.2207719. 2016).
[14] Marcus Foth, Laura Forlano, Christine Satchell, and Martin [31] Tsung-Yi Lin, Michael Maire, Serge Belongie, Lubomir Bourdev,
Gibbs. 2011. From Social Butterfly to Engaged Citizen: Urban Ross Girshick, James Hays, Pietro Perona, Deva Ramanan,
Informatics, Social Media, Ubiquitous Computing, and Mobile C. Lawrence Zitnick, and Piotr Dollár. 2014. Microsoft COCO:
Technology to Support Citizen Engagement. The MIT Press. Common Objects in Context. arXiv:1405.0312 [cs] (May 2014).
[15] Jan Gehl. 2004. Public spaces – public life. Arkitektens Forlag. [32] Wei Liu, Dragomir Anguelov, Dumitru Erhan, Christian
[16] Andreas Geiger, Philip Lenz, Christoph Stiller, and Raquel Szegedy, Scott Reed, Cheng-Yang Fu, and Alexander C. Berg.
Urtasun. 2013. Vision meets Robotics: The KITTI Dataset. 2016. SSD: Single Shot MultiBox Detector. arXiv:1512.02325
International Journal of Robotics Research (IJRR) (2013). [cs]. 9905 (2016), 21–37. https://doi.org/10.1007/978-3-319-
[17] Google. 2021. tensorflow Mobile. https://github.com/ 46448-0_2.
tensorflow/tensorflow/tree/master/tensorflow/examples/ [33] Miovision. 2021. Miovision Scout. Website. Retrieved Jan 10,
android/. 2021 from http://miovision.com/data-link/scout/.
[18] Google. 2021. tensorflow Object Detection API. https: [34] Modcam. 2021. Modcam. Website. Retrieved Jan 10, 2021 from
//github.com/tensorflow/models/tree/master/research/ https://www.modcam.com/.You can also read