Visible Attack Investigation for GUI Applications - NDSS Symposium
←
→
Page content transcription
If your browser does not render page correctly, please read the page content below
UIS COPE: Accurate, Instrumentation-free, and
    Visible Attack Investigation for GUI Applications

                       Runqing Yang † , Shiqing Ma ‡ , Haitao Xu § , Xiangyu Zhang ¶ , Yan Chen                £

                            †   Zhejiang University, ‡ Rutgers University, § Arizona State University,
                                           ¶ Purdue University, £ Northwestern University
                                † rainkin1993@zju.edu.cn, ‡ shiqing.ma@rutgers.edu, § hxu@asu.edu,
                                        ¶ xyzhang@cs.purdue.edu, £ ychen@northwestern.edu

    Abstract—Existing attack investigation solutions for GUI ap-       independent tasks. In this paper, we hence focus on GUI
plications suffer from a few limitations such as inaccuracy            applications.
(because of the dependence explosion problem), requiring in-
strumentation, and providing very low visibility. Such limitations         System event (e.g., system calls) auditing is a built-in
have hindered their widespread and practical deployment. In this       feature in mainstream operating systems and can be used for
paper, we present UIS COPE, a novel accurate, instrumentation-         such investigation. Existing work [41], [28], [25], [30], [45],
free, and visible attack investigation system for GUI applications.    [52], [42], [37] has demonstrated their great potential, but they
The core idea of UIS COPE is to perform causality analysis on          suffer from a few major limitations.
both UI elements/events which represent users’ perspective and
low-level system events which provide detailed information of              1) Inaccurate analysis results. In many causality anal-
what happens under the hood, and then correlate system events          ysis, when a long-running process interacts with many input
with UI events to provide high accuracy and visibility. Long           and output objects, each output object will be conservatively
running processes are partitioned to individual UI transitions, to     considered causally dependent on all the preceding input
which low-level system events are attributed, making the results       objects. This is known as the dependency explosion problem.
accurate. The produced graphs contain (causally related) UI            Such problems lead to significantly inaccurate analysis results
elements with which users are very familiar, making them easily
accessible. We deployed UIS COPE on 7 machines for a week,
                                                                       when there are long-running processes involved and makes the
and also utilized UIS COPE to conduct an investigation of 6 real-      investigation impossible to move forward.
world attacks. Our evaluation shows that compared to existing              2) Requiring instrumentation on end-user systems.
works, UIS COPE introduces neglibible overhead (less than 1%           Some approaches try to solve the dependency explosion prob-
runtime overhead and 3.05 MB event logs per hour on average)
while UIS COPE can precisely identify attack provenance while
                                                                       lem using instrumentation on source code or binary. How-
offering users thorough visibility into the attack context.            ever, instrumentation is generally not practical and prohibited
                                                                       in real-world production environments. Firstly, most COTS
                                                                       software only provides executable binaries and do not pro-
                       I.   I NTRODUCTION                              vide source code. Secondly, intrusive modification of binary
                                                                       code can make applications and operating system unstable.
    When security alerts are raised, a swift attack investigation      Even more, it can introduce new vulnerabilities which can
should be conducted to determine the cause and scope of                be leveraged by malware [11], [9], [2]. As such, Microsoft
the attack so that the impact of the attack can be minimized           integrated the Kernel Patch Protection (KPP) into Windows
and such attacks in the future can be prevented. Provenance            to prevent patching the kernel [8]. Thirdly, the party which
tracking and causality analysis is an important technique for          instruments COTS executables or operating systems has to
efficient attack investigation. Starting from a compromised sys-       take full responsibility for all potential accidents, no matter
tem entity (e.g., file, socket, or process), investigators perform     whether the accidents are caused by instrumentation or not.
causality analysis on the collected provenance to figure out:          Hence instrumentation is mostly prohibited in the enterprise
1) the root or origin of the entity, i.e., all the external entities   environment.
(e.g., a socket connection) affecting the target entity, and 2)
the causal path from the root to the entity. Such analysis                 3) Lack of visibility. Human-perceivable attack investi-
facilitates identifying attack root cause, assessing damage            gation report is largely preferred and would greatly facilitate
incurred, and developing countermeasures. GUI applications             security experts to understand attacks and take necessary
(e.g., browsers), one of the most popular attack vectors [7],          remedies. Some existing non-instrumentation studies employ
typically cause substantial accuracy degradation of causality          statistical analysis [29], [41] (e.g., only considering causal
analysis as they may run for a long time and process many              edges that rarely happened in the past) to guide causal de-
                                                                       pendency graph pruning to address the inaccuracy in causality
                                                                       analysis. However, they just provide system level information
Network and Distributed Systems Security (NDSS) Symposium 2020         (e.g., process id, file name) and cannot fully recover what
23-26 February 2020, San Diego, CA, USA                                happened from the user’s perspective, which plays a vital role
ISBN 1-891562-61-4                                                     in the forensic analysis [53].
https://dx.doi.org/10.14722/ndss.2020.24329
www.ndss-symposium.org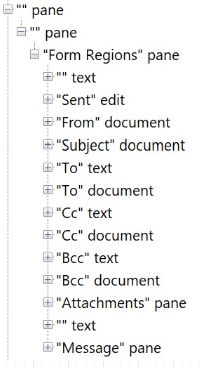
Our solution. We propose UIS COPE, a novel accurate and                   events in the kernel space to achieve our aforementioned
instrumentation-free attack investigation system which pro-               design goals.
vides meaningful contextual information to enhance the vis-              • We devise a novel UI event analyzer which analyzes UI
ibility of forensics analysis. The basic idea of UIS COPE is              events causality, and a correlation analyzer which correlates
to combine low-level causality analysis with high-level UI                UI events with system events to produce accurate and highly
elements and events analysis to grain the advantages of both.             visible causal graphs.
On one hand, we leverage detailed low-level system events                • Based on our design, we build a prototype on Windows
to fully recover what actually happens in the system. On the              and evaluate on 7 machines and 6 real-world attacks. Results
other hand, we attribute the system events to high-level UI               show that compared to existing works, UIS COPE introduces
elements and UI events to provide better visibility for attack            negligible extra runtime overhead (less than 1%) and extra
forensics and solve the dependence explosion problem (i.e.,               space overhead (3.05 MB event logs per hour on average)
attributing system events to individual UI elements instead of            while provides more accurate and highly visible attack
a single long-running process to avoid dependency explosion).             forensics.
By instrumentation-free, we mean that UIS COPE leverages
existing built-in event logging system and does not require                                   II.   M OTIVATION
extra instrumentation on the end user systems.
                                                                        A. Motivating Example
    In UIS COPE, there are two types of event collectors: the UI
elements and events collector and the system events collector.              One day, an office clerk Bob tried to download a piece
For the UI elements and events collector, we leverage the               of software (WinSCP.exe) from a website benign.com.
accessibility service shipped with major operating systems,             While waiting for the download to complete, he received an
and for the system event collector, we leverage built-in audit          email informing that he had been selected as a winner for
systems such as Event Tracing for Windows (ETW). These                  an iPad and asking him to claim the award on a website. It
systems are provided by OS vendors and thus usually have                was actually a phishing email leading to a malicious website.
very low runtime and storage overhead. As such, we avoid                The website uses the WordPress free host service and uses
instrumenting end user systems.                                         the domain name well-known.wordpress.com. It also
                                                                        leverages login detection techniques [10] to test if the user
    After collecting all UI events and system events, UIS COPE          has logged into any well-known bank website. In our attack
performs causality analysis on UI elements and events (through          story, Bob happened to login www.bank.com to manage
the UI event analyzer) as well as system events (the system             his company’s bank account. Hence, the malicious website
event analyzer) to generate causal graphs for both types of             launched a clickjacking attack [5] by creating a transparent
logs. We devise an additional correlation analyzer, which               frame containing a transfer form with the receiver being the
correlates UI events and system events based on timestamp               attacker’s own bank account on top of the “Get iPad” button.
alignment and resource attribution (e.g., attributing background        Bob clicked the “Get iPad” button, which actually triggered a
file accesses to the UI operation where the file resource               transfer from his bank account to the attack’s bank account,
was initialized). The details of the corresponding algorithm            without being noticed by Bob.
describing how UIS COPE deals with software background ac-
tivities are presented in Section III-F2. Through the correlation           The good news was that Bob’s company deployed protec-
algorithm, we partition a long-running process into individual          tion techniques. The security system raised an abnormal trans-
UI transitions, making the result more accurate. Also, the final        fer alert. Following this alert, forensics investigation began
graph represents information in a way closely coupled with              from the abnormal transfer socket communication, and tried
UI interactions which users are very familiar with, allowing to         to find how/when/where this happened and investigate if Bob
reconstruct the attack story from user’s perspective and provide        was an insider attacker who stole money from the company.
high visibility.
                                                                        B. Existing Attack Investigation Solutions
    We deployed UIS COPE on 7 machines for a week and
utilized UIS COPE to conduct investigation of 6 real-world                  1) Low-level Events Causality Analysis: Traditional
attacks. Our evaluation shows that UIS COPE can not only                causality analysis [34], [35] tracks the lineage of system
accurately identify the attack path but also provide fine-              objects (e.g., files and sockets) and subjects (e.g., processes)
grained human-comprehensible contextual semantics to users.             via system events (e.g., syscalls) and analyzes the causal
In addition, compared to existing works, UIS COPE introduces            relations among system objects and subjects to generate causal
negligible extra runtime overhead (less than 1%) and extra              graphs. With such graphs, investigators can perform backward
space overhead (3.05 MB event logs per hour on average).                provenance queries with the symptom (i.e., the abnormal
UIS COPE does not require any end system change or instru-              transfer socket) to understand the root cause of the attack or
mentation and can be deployed as an add-on to any existing              forward provenance queries to identify the effects of the attack.
threat detection system in production environments.                         Fig. 1 (I) shows a typical dependence graph generated by
   In summary, we make the following contributions:                     traditional causality analysis for this investigation. Note that
                                                                        in this figure (and also the rest of the paper), we use diamond
 • We identify a few limitations of existing attack forensics           nodes to denote sockets, box nodes to denote processes, and
  techniques in practice and propose a novel accurate and               oval nodes to denote files. Also, nodes in red represent the
  instrumentation-free attack investigation system, UIS COPE,           symptom event(s), the events which investigation starts from.
  which also provides high visibility in attack forensics. It           Specifically, when investigators perform backward tracking to
  leverages both UI information in the user space and system            find which website is related to the abnormal transfer, they

                                                                    2
Ⅰ. Traditional causality analysis UI Element
benign.com:443 x.x.x.x:80 mail.google.com:443 well-known.wordpress.com:80 Process
Socket
File
Chrome
UI Control Dependency
UI Content Dependency
y.y.y.y:80 drive.google.com:443 www.bank.com:443 UI-System Dependency
System-System Dependency
Ⅱ.Statistics-based works well-known.wordpress.com:80
Ⅲ. UIScope
mail.google.com:443
Attack-unrelated Events (FP)
C http://well-known.wordpress.com
benign.com:443
Type: Document
3 AddElement
x.x.x.x:80
Text: well-known.word
press.com Congratulations !
A
Type: Document D E
Text: mail.google.com Type: Text Type: Button Get iPad
Text: Congratulations! Text: Get iPad
Missed Event (FN)
3 RemoveElement F https://www.bank.com
well-known.wordpress.com:80 Type: Document
B Text: www.bank.com
Type: Hyperlink
Balance: $ 2,333
Text: well-known.word
press.com
Chrome G H
Type: Button Transfer
Type: Text
Text: Balance:$2,333 Text: Transfer
www.bank.com:443
www.bank.com:443
Fig. 1. Comparison between existing causality analysis solutions and our UIS COPE on the motivating example.
would be substantially distracted, because Chrome is a long back to two benign sockets, benign.com and x.x.x.x.
running process and could have been used to visit hundreds of The reason is that visiting well-known.wordpress.com
websites during an attack window (e.g., mail.google.com, which is hosted by WordPress is a common and normal
benign.com, drive.google.com and many other sites behavior (because WordPress is one of the largest blog host
in the figure), and thus the suspicious file is conservatively websites) while benign.com:80 and x.x.x.x:80 are
related to hundreds of preceding websites. This is known as rarely visited websites and thus deemed abnormal instead. As
the dependence explosion problem, which makes any further such, statistics based approach may produce unstable results.
tracking attempt nearly impossible. This is a major limitation In other words, the qualify of the results heavily depends on
of traditional causality analysis. the dataset used to calculate the observed distribution (e.g.,
which website gets more visits).
Many previous works tried to address this problem via
program analysis [37], [44], [45], [36]. Some of them require
source code or binary level instrumentation [37], [44], [45],
which is intrusive and not practical in enterprise environments, C. Problem Statement and UIS COPE
as discussed in Section I. Taint analysis [32], [51], [33] As discussed in the previous section, many low-level
is another way to solve the dependency explosion problem. event causality analysis based approaches are not applicable
However, it causes tremendous runtime and space overhead, in real world systems as they may suffer from the depen-
which makes it rarely used in production environments. dence explosion problem, causes heavy runtime overhead or
2) Statistics-based Graph Pruning: Observed that most requires instrumentation. Statistics based graph pruning has
attack-related events are abnormal and rarely occur in historical difficulty handling attacks leveraging popular (and benign)
event logs of an enterprise network, PrioTracker [41] and applications and/or websites. Furthermore, graphs generated
NoDoze [29] proposed statistics-based attack investigation by both approaches lack the user understandable high-level se-
approaches to prioritize abnormal events and causal depen- mantic information. Fig. 1 (II) shows a simplified causal graph
dencies. They introduce quantitative metrics (i.e., frequency generated by NoDoze (Note that using traditional low-level
and topological features) to distinguish normal and abnormal events causality analysis will introduce too many irrelevant
events and present a pruned causal graph to investigators. Pri- sockets and we preclude it from our discussion). With such
oTracker only considers the abnormality of individual events graphs, even if NoDoze may find the real malicious socket
while NoDoze takes the abnormality of event chains into con- well-known.wordpress.com:80 by tuning thresholds
sideration and thus can generate more precise causal graphs. or using high quality data to calculate the observed distribution,
it still cannot provide sufficient information to answer the
Fig. 1 (II) presents the causal graph generated by NoDoze key question in the investigation: is Bob an insider (i.e., did
for the investigation, which is more concise than the graph he intentionally initialize the transfer) or an victim of social
generated by traditional techniques (Fig. 1 (I)). However, engineering (e.g., fooled by clickjacking)? Without knowing
NoDoze cannot accurately locate the IP address which is the more contextual information, it is impossible to answer this
real source of the abnormal transfer. As shown, NoDoze traces type of questions.
3Event Collector Event Analyzer
UI Elements and Events
UI Element UI Event
and Event Analyzer
Collector Correlation
Analyzer
System Event
Collector System Event
Analyzer
System Events
Fig. 2. UIS COPE System Architecture.
The aforementioned limitations motivate the following de- Additionally, Fig. 1 (III) attributes low-level system ob-
sign goals for our own system: jects (e.g., detailed socket addresses and file names) to the
corresponding high-level UI elements (i.e., web pages in this
• Accurate: It should produce accurate investigation results,
case), that are well partitioned and denote autonomous sub-
i.e., low false positive and false negative rates.
executions. Doing so, we can accurately associate low-level
• Applicable: It requires NO extra end system change and system information with individual autonomous and high-level
causes low overhead so that it is deployable in an enterprise user actions. This avoids attributing all low-level events to the
environment. same process, achieving low false positive/negative rates in
• Visible: Its output should be visible to human investigators causality analysis, as shown by our results in Section IV-B. De-
so that they can easily understand what happened with the tails of how the attribution is done including how background
application level context information. Visibility plays a vital events are processed will be discussed in Section III-F.
role in the forensic analysis [53].
As far as we know, existing approaches cannot achieve all D. Threat Model
the three goals. Therefore, we propose a novel investigation
We assume that both Event Tracing for Windows (ETW)
system, UIS COPE, which combines low-level event causality
and Accessibility libraries provided by OSes (introduced in
analysis with high-level user interface (UI) elements/events
Section III) are trusted, and audit logs (i.e., system events
analysis to achieve a balance of all the aforementioned goals.
captured with ETW and UI events by Accessibility libraries)
That is, UIS COPE can achieve high attribution accuracy and
cannot be tampered with. Attacks that can compromise these
high visibility for GUI applications while incurring trivial over-
two auditing systems are beyond the scope of this study. This
head and requiring no instrumentation. UIS COPE is orthogonal
assumption is consistent with previous literature [29], [41],
to existing non-instrumentation techniques (e.g., probabilistic
[30]. In this paper, we focus on GUI-related attacks, in which
solutions [41], [29]). While the detailed design will be dis-
user involvement is needed to initiate/trigger an attack (e.g.,
cussed in Section III, Fig. 1 (III) shows the UIS COPE graph
phishing attacks, driven-by downloads and insider attacks). For
for the aforementioned investigation. In this graph, we use
attacks which do not entail any user interactions, we apply the
the same shape and color to represent low-level system events
same methods as previous works [29], [41], [30].
as before. We also introduce a new set of nodes and edges
to represent UI elements and new relations, which is defined
in Section III. Specifically, hexagons represent UI elements III. S YSTEM D ESIGN
and nodes with gray background denote UI elements operated
by the user. Dashed lines show the tree structure of different A. System Design Overview
UI elements pointing from the parent node to the child node, The overall workflow of UIS COPE is shown in Fig. 2.
which denotes causality as well. A dotted line represents UIS COPE has two major components: the event collector and
connection between a UI element and a system event and the the event analyzer. Specifically, the event collector consists
arrow is from the action initiator. A double solid line represents of the UI element and event collector and the system event
connection between two UI elements and the destination is collector. The event analyzer contains the UI event analyzer,
affected by the source via some user operation. For example, the system event analyzer and the correlation analyzer.
in Fig. 1 (III), hexagon H represents the Transfer button
that was actually clicked by Bob; hexagon E is the Get iPad The overarching idea of UIS COPE is to perform both UI
button which Bob intended to click, and hexagons C, D, E, F, G event causality analysis and low-level system event causality
are Document Object Model (DOM) elements in the same page analysis independently, and then attribute groups of low-level
with the button. Bob first clicked the link in his email (node system events to high-level UI event. In UIS COPE, we use
B), which led him to a new web page (whose UI elements UI events to deliver visibility to investigators and solve the
rooted in C). After Bob clicking the transparent button over dependency explosion problem in low-level causality analysis
the Get iPad button (node H), a socket was created and by attributing low-level events to high-level UI elements and
was used to perform the unintended money transfer. The UI events, which are well partitioned. Doing so, UIS COPE can
element nodes in this graph tell us that in the same web page, generate accurate (i.e., no dependence explosion problem) and
there were two clickable buttons in an identical position. If visible (i.e., through human understandable UI elements and
we reconstruct what was seen by Bob, we can get a graph like events) results. Moreover, we do not require instrumentation
Fig. 1 (III), indicating that Bob was fooled by a clickjacking or heavyweight runtime monitoring so that our technique is
attack. applicable in production systems.
4B. Event Collector the hypertext of a hyperlink or the title of a web page is
often recorded in the Name field of an event.
1) UI Element and Event Collector: We develop a UI
• Text contains the hidden value of a UI element, such as
element and event collector based on Windows UI Automation
URL of a web page or a hyperlink.
[46], to efficiently monitor interesting UI events triggered by
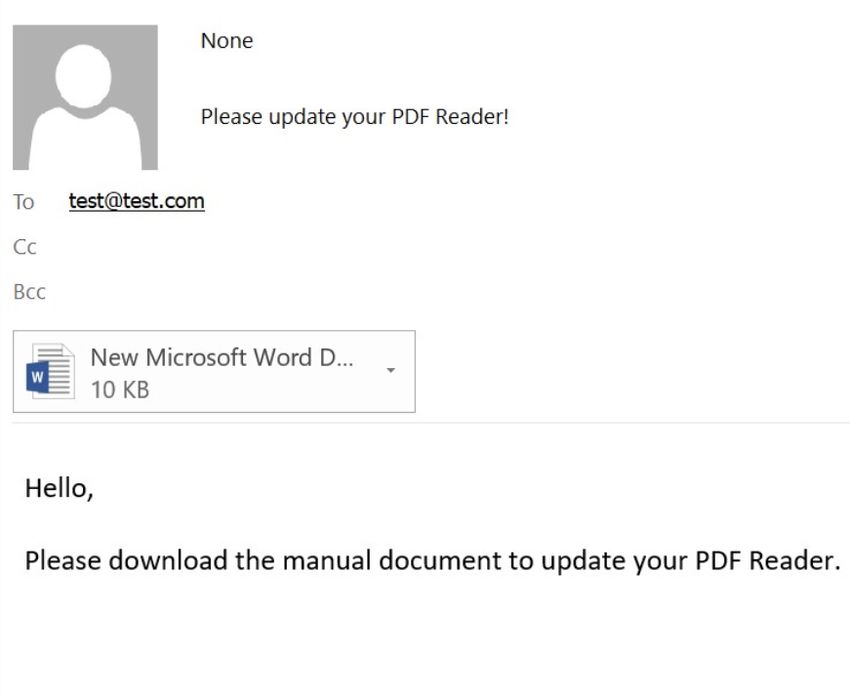
user interactions. Windows UI Automation is an accessibility
library developed by Microsoft. There are similar accessibility A. Outlook Email GUI B. UI Tree
libraries on other platforms as well including NSAccessibility
for Mac OS X [23], ATK and XAutomation for Linux [40]
and so on. Enforced by the federal IT Accessibility
Laws and Policies [27], mainstream OSes have to de-
velop these libraries to support accessibility features. With
these features, disabled people can have more control of the
user interface of electronic devices, such as 1) retrieving
information about UI elements (e.g., title of a window, name
of a button), 2) adjusting UI elements (e.g., customizing a
screen’s color, zooming in and out on a web page), and 3)
getting notification of changes to UI (e.g., website content
loaded, a hyperlink clicked). Essentially, Windows UI Automa-
tion provides UIS COPE the capability of logging UI events
triggered by any changes to UI elements. C. A UI event of clicking the attachment button
UI Automation works by subscribing provided UI events,
and UIS COPE queries the accessibility services to get the Timestamp: 2019/9/2 12:34:332156 (1)
EventType: Invoke
corresponding UI trees when a UI event happens. There are
Process
around 100 different UI events, falling into 5 categories,
(2)
including property change, element action, structure change, PID: 3345
global desktop change and notification [47]. Among all these Element Details
events, three type of events, namely Focus, Invoke, and ControlType: Button (3)
SelectionItem_ElementSelected, are used to cap- ClassName: NetUISimpleButton
ture common user interactions. Specifically, RuntimeId: [2A.72B44.4.2A1E6340.0]
BoundingRectangle: {left:1262, top:232, right:1451, bottom:272}
• Focus events indicate that the focus of the user shifts
Name: New Microsoft World Document.docx
from one element to another. For example, either clicking
Text: N/A
a hyperlink or yielding a new web page would trigger a
Focus event. And at a specific time in the system, only one
element can gain focus, and only that element can receive Fig. 3. Example of our collected UI information of the Outlook email
user inputs (e.g., via keyboard or mouse). composition page. (A) is the Outlook GUI which was seen by users, and
• Invoke events indicate when a UI element is triggered, (B) is the corresponding UI tree. (C) is a UI event raised by clicking the
email attachment button highlighted in green in (A) and (B).
such as clicking a button.
• SelectionItem_ElementSelected events indicate
that an item (i.e., a group of elements) or an element is Example. Fig. 3 (A) presents an example of our collected
selected, such as an email in the Outlook or a browser UI information of the Outlook email composition page, in
tab is selected. which important UI elements are marked in different colored
boxes. Fig. 3 (B) shows the corresponding UI tree, and each
Besides, each UI event has a uniform format with 170 node in the tree denotes a UI element. Our UI element
fields [48], out of which, eight fields provide wealthy semantics and event collector will collect such information at runtime,
helpful to understand user interactions: and the UI can be reconstructed (during analysis) with such
information. In Fig. 3 (C), we showcase a UI event of clicking
• ProcessId represents the process identifier (ID) of a UI
the attachment button. As shown in the figure, we will collect
element.
event related information (C-1), process related information
• EventType specifies the UI event type (e.g., Focus).
(C-2) and also UI element related information (C-3).
• ControlType specifies the type of the UI element which
triggers the event, such as a hyperlink, a document or a tab. 2) System Event Collector: UIS COPE uses OS built-in
• ClassName is the class name of the UI element assigned audit systems for system event collection. These systems
by software developers. Most of the time, ClassName are pre-installed on target systems. Without any additional
together with ControlType can determine what kind of configuration or optimization, they can be used in production
element triggers an event. runs. They are also of high quality and have technical support
• RuntimeId is a unique identifier (ID) of a UI element, from official providers. UIS COPE leverages Event Tracing for
used to identify the UI element which triggers an event. Windows (ETW) [15] to collect system events on Windows. It
• BoundingRectangle is the point coordinates of a UI allows users to collect system-level events (e.g., system calls)
element’s enclosing rectangle. It represents the element’s with negligible overhead [15]. ETW has been widely in both
position on the screen. academia [29], [45], [25], [24], [42] and industry [16]. Similar
• Name is the name of UI element and is usually the same to previous attack investigation tools [29], [41], UIS COPE only
as the human-perceivable text on the screen. For example, monitors security-relevant events.
5Timestamp: 2019/9/2 12:32:538364 (1) Algorithm 1 UI Event Analyzer
EventType: ProcessCreate Input: LU - List of UI events in the chronological order
Process Output: Graph - Provenance graph whose vertexes are UI elements and edges UI
Parent PID: 102 (2)
Control or Content Dependency.
PID: 25336
Functions: GetU IT ree(U ) - Returns the entire UI tree related to a UI event U
TID: 322
F indRootOf AddedElements(Tcur , Tprev ),
Event Details
Command: MicrosoftEdge.exe (3) F indRootOf RemovedElements(Tcur , Tprev ) - Returns the root element of a
Env: OS=Windows_NT set of added or removed UI elements by comparing two UI trees
Return Values Graph.addV ertex(E) - Add a UI element to the graph if it is not included
32248 (4) Graph.addEdge(Esrc , Edst , DependencyT ype) - Add a edge from Esrc to
PID:
Edst if the edge does not exist and the type of edge is set by DependencyT ype
GetChildren(E) - Returns a set of child nodes of UI element E in a tree
Fig. 4. Example of an ETW event.
Variable: T.root - the root element of the UI Tree T
U.element - The UI element operated by a UI event U
Example. Fig. 4 shows an example ETW event entry. The 1: function UIE VENTA NALYZER(LU )
first block (1) includes the basic information of the event such 2: Ucur ← null
as the timestamp of the event (Timestamp), the event type 3: Tcur ← null
4: Uprev ← LU [0]
(EventType) and so on. The second block (2) shows the process 5: Tprev ← GetU IT ree(Uprev )
and thread triggering the event and its parent process. The 6: AddT reeT oGraph(Tprev .root, Graph)
third block (3) lists details of the event. For instance, for a 7: for i = 1; i < Size(LU ); i ++ do
8: U = LU [i]
ProcessCreate event, we will have the command of the created 9: Ucur ← U
process and the environment where the created process was 10: Tcur ← GetU IT ree(U )
executed. The last block (4) has return values. In this case, it 11: /* Build AddElement UI Control Dependency */
12: Eadd ← F indRootOf AddedElements(Tcur , Tprev )
returns the child process PID value. 13: AddT reeT oGraph(Eadd , Graph)
14: Graph.addEdge(Ucur .element, Eadd , AddElement)
15: Set timestamp of above new added edge as the timestamp of Ucur
C. Event Analyzer Definitions 16: /* Build RemoveElement UI Control Dependency */
17: Eremove ← F indRootOf RemovedElements(Tcur , Tprev )
The event analyzers analyze the collected UI and system 18: Graph.addEdge(Ucur .element, Eremove , RemoveElement)
logs to derive dependencies between event entries (to construct 19: Set timestamp of above new added edge as the timestamp of Ucur
the final causal graph). In this section, we first define a number 20: Uprev ← Ucur
21: Tprev ← Tcur
of dependencies and then explain how they are derived. 22:
23: function A DD T REE TO G RAPH(Eroot , Graph)
UI Control Dependency. When a UI element change directly 24: for each Echild ∈ GetChildren(Eroot ) do
affects other UI elements, we say they have UI control de- 25: /* Build UI Content Dependency Recursively */
pendencies. A UI element can affect another one directly by 26: Graph.addV ertex(Eroot )
27: Graph.addV ertex(Echild )
adding and removing operations. Thus, there are two types 28: Graph.addEdge(Eroot , Echild , U IContentDependency)
of UI Control Dependencies: AddElement (for adding a UI 29: AddT reeT oGraph(Echild , Graph)
element) and RemoveElement (for removing a UI element.
For example, after the user clicks a hyperlink on a web page
and a new page is loaded to replace the current one. We will Sockets) and subjects (i.e., Processes). We adapt the same
create a RemoveElement edge from the hyperlink element definition and use the term System-System Dependency
to the root element of the current page and an AddElement to represent this category of dependency in our paper. In our
edge from the hyperlink element to the root element of the new paper, we use solid lines to represent this type of dependency.
page. It implies that all elements in this tree will be (directly or
transitively) affected. In our paper, we use double solid lines In addition, we use the term initial event to denote system
to represent this type of dependency. object creation events.
UI Content Dependency. UI elements are organized in a
D. UI Event Analyzer
tree structure. A parent tree node usually represents a larger
element such as a web page, and all the child nodes represent The UI analyzer is to find UI control dependencies and
sub-elements in this web page. The affiliation relations of UI content dependencies. The detailed analysis procedure is pre-
elements introduce content dependencies. In our paper, we use sented in Algorithm 1. For a list of given UI events in the
dashed lines to represent this type of dependency. chronological order and also all the related UI elements orga-
UI-System Dependency. A UI-system dependency is intro- nized in trees. Our goal is to compute a provenance graph, with
duced if the UI element lead to the system event (e.g., creating UI elements as nodes, connected by UI control dependency
a new socket for page loading in browsers) or the UI element and content dependency. After initializing the variables (lines
is affected by the system event (e.g., loading data from a 2 to 6), the algorithm starts to examine individual UI events
socket to refresh a web page). Such dependencies are critical and related UI Trees in the queue (lines 7 to 21) to build UI
for attributing low-level system events to execution structures Control Dependency based on temporal association. Basically,
enforced by UI elements (to avoid dependence explosion). changes in the UI Tree causally depend on the UI element
In our paper, we use dotted lines to represent this type of operated by the previous UI event, based on the fact that
dependency. there exists only one human user action at a time and that UI
changes following it are responding to such action. For each
System-System Dependency. Previous literature [34] clearly event, after getting the related UI tree (line 10), it finds all the
defined dependencies between system objects (i.e., Files, associated UI elements in the newly added or removed tree and
6Ⅰ. UI Event with UI Tree Ⅱ. UI Event with UI Tree Ⅲ. UI Event with UI Tree Ⅳ. Generated Graph
timestamp 2: timestamp 3: timestamp 6:
Focus, Element A Focus, Element B Focus, Element H
C C C
A Type: Document Type: Document A Type: Document
Type: Document Text: well-known.wordpress.com Text: well-known.wordpress.com Type: Document Text: well-known.wordpress.com
Text: mail.google.com Text: mail.google.com 3 AddElement
3 RemoveElement D E
D E D E
Type: Text Type: Button
B Type: Text Type: Button Type: Text Type: Button B Text: Congratulations Text: Get iPad
Type: Hyperlink Text: Congratulations Text: Get iPad Text: Congratulations Text: Get iPad Type: Hyperlink
Text: well-known.word Text: well-known.word
press.com press.com
F F
Type: Document Type: Document
Text: www.bank.com Text: www.bank.com 6 RemoveElement
UI Control Dependency
UI Content Dependency G H G H
Type: Text Type: Button Type: Text Type: Button
Text: Balance:$2,333 Text: Transfer Text: Balance:$2,333 Text: Transfer
Fig. 5. A log example of UI Event Analyzer.
updates the graph accordingly (lines 11 to 19). Specifically, with system subjects or objects as nodes and System-System
it introduces AddElement and RemoveElement types of Dependencies as edges.
control dependency to the root element of all added and
removed UI elements, respectively. Note that, all added or F. Correlation Analyzer
removed elements only have one root element and we adopt
the existing lowest common ancestor algorithm [17] to find the 1) UI-System Dependency: UI events and system events
root element. Lastly, it updates Uprev and Tprev to the current capture behaviors of the same attack from two different levels:
UI event and the current UI tree respectively (lines 20 to 21). If foreground with visibility and background with fine-grained
UI events do not add or remove elements, it simply updates the information. After acquiring the UI causal graph from the UI
Tprev and Uprev without adding new edges to the graph. We event analyzer and the low-level event causal graph from the
use the function AddTreeToGraph(Eroot , Graph) to add a system event analyzer, we analyze the correlations of the two
new tree to the existing graph (lines 24 to 29). In this function, so that low-level system events can be attributed to individual
the algorithm recursively traverses the whole UI tree starting UI elements (instead of the whole process) which makes the
from the root element Eroot , creates UI Content Dependency graph both visible and accurate (more accurate than using a
between parent nodes and child nodes, and adds them all to single node to represent the whole graph like in traditional
the graph. graphs, which leads to dependency explosion).
Example. Fig. 5 presents an example of how Algorithm We devise a timestamp-based attribution approach based
1 works on the motivating example where Bob clicked a on two observations: 1) an application has only one currently
hyperlink in the phishing email and was attacked by click- focused UI tree at a certain time; 2) system events and UI
jacking. Fig. 5 (I), (II), and (III) are UI events and their events are typically triggered by the same attack behavior at
corresponding UI trees occurring at timestamp 2, timestamp the same time. That is, the two categories of events are mostly
3, and timestamp 6, respectively. UI elements with gray time-aligned. There are also many background events and we
background represent the ones operated by users. Fig. 5 will discuss them in III-F2.
(IV) is the generated graph by the event analyzer. At times-
tamp 2, the web page mail.google.com was loaded and System events and UI events are correlated based on two
a Focus event was triggered. Because this is the first UI mechanisms. Firstly, for a system object that is associated
event, UI elements A and B were added to the graph. At with a sequence of system events such as a socket with many
timestamp 3, Bob clicked the hyperlink (element B), then socket read/write events, we use the creation of system object
the previous web page mail.google.com (elements A to correlate with UI events. This is known as the initial event
and B) was removed from the tree and a new web page based correlation. Secondly, we mainly use a timestamp
well-known.wordpress.com (elements C, D, E, F, G, based alignment to correlate general system events and UI
H) was added. The new page was thus added to the graph, elements/events, and this is referred as the timestamp based
together with a RemoveElement edge from element B to correlation. Basically, system events occurring between two
the root element of the removed page (element A) and an UI events chronologically would be attributed to the former
AddElement edge from element B to the root element of the UI event (or UI elements added by the UI event). The details
new page (element C). Note the timestamp of the edges is 3. At of the attribution process is presented in Algorithm 2. After
timestamp 6, Bob was tricked to click the Transfer button initializing variables (line 2), the algorithm generates two
(element H) masqueraded as a Get iPad button (element E). graphs using the UI Event Analyzer and the System Event
The embedded web page www.bank.com (elements F, G, Analyzer, respectively, and add them to the result graph (lines
and H) was removed, thus a RemoveElement pointing from 3 to 6). Then it starts to examine individual processes occurring
element H to the root element of the removed page (element in the graph (lines 7 to 15). For each process, it first checks
F) was added with timestamp 6. whether the process has GUI. If so, it extracts two sub-lists
of events related to the process and attributes system objects
or subjects to UI elements by invoking the function Attribute
E. System Event Analyzer (lines 10 to 12).
We follow the standard causality analysis method used in The function Attribute() first orders all system and UI
previous literature [37], [44], [45], which returns a causal graph events chronologically in list LU (line 18). For each event
7Algorithm 2 Correlation Analyzer (lines 38 to 42). Note that the direction of the newly created
Input: LS - A list of system events in the chronological order edge is the same as the one of the system events. For instance,
LU - A list of UI events in the chronological order
Output: Graph - A complete provenance graph combining both UI and system events.
the FileRead event creates an edge pointing from a file
Variable: Eactive - The current active UI element object to a UI element while the FileWrite event creates an
Minit - A key-value map of initialized objects and active UI elements edge pointing from a UI element to a file object. The essence
U.element - The UI element operated by a UI event U
S.sink, S.source - The system object pointed to or from by a system event S
of lines 38 to 42 is as follows. We observe that the usage of
Function: GetP rocessV ertexes(Graph) - Return all vertexes of processes a system object (e.g., socket read) may not be in the same
ExtractEventsByP rocess(L, process) - Extract events related to a specific time window of a UI event, rendering the timestamp-based
process from a list of events L.
AddGraphT oGraph(Gf rom , Gto ) - add the vertexes and edges in Gf rom to alignment (lines 33-35) ineffective, while its initialization (e.g.,
Gto if those vertexes and edges do not exist in the Gto socket creation) can be correctly aligned with the trigger of
ReorderInChronologicalOrder(Listone , Listtwo ) - merge two lists into a the UI event (e.g., button clicking) in most cases. Thus, for a
list in the chronological order
F indRootOf AddedElements(E, Graph) - check whether there is AddElement (background) system event related to some system object, we
dependency pointing from the element E, if yes, return the sink element of the trace back to the time when the system object was initialized
dependency, otherwise return null.
and attribute the event to the active UI element at that moment.
1: function C ORRELATE(LS , LU )
2: Graph ← a new empty graph 2) Background Activities: One may question if our tech-
3: Gsystem ← SystemEventAnalyzer(LS ) nique (based on timestamps and system object initialization)
4: Gui ← U IEventAnalyzer(LU )
5: AddGraphT oGraph(Gsystem , Graph) provides a sound solution for background activities. In the
6: AddGraphT oGraph(Gui , Graph) following, we discuss the possible background behaviors of
7: for each process ∈ GetP rocessV ertexes(Gsystem ) do popular applications and argue that our technique is highly
8: if HasGU I(process) then
9: /* For GUI applications*/ effective in practice, which is also demonstrated by our exper-
10: SubLsystem ← ExtractEventsByP rocess(LS , process) iment in Section IV-B.
11: SubLui ← ExtractEventsByP rocess(LU , process)
12: Attribute(process, SubLsystem , SubLui , Graph) GUI programs are mostly driven by keyboard and mouse
13: else
inputs. The execution trace of such a program is dominated by
14: /* For non-GUI applications, we follow traditional methods*/
15: continue event processing loops and the system events that are directly
16: or indirectly triggered by the loop body. UIS COPE captures
17: function ATTRIBUTE(process, Lsystem , Lui , Graph)
18: Levent ← ReorderInChronologicalOrder(Lui , Lsystem )
keyboard and mouse inputs by monitoring UI events, and
19: for i = 0; i < Size(Levent ); i ++ do then uses timestamp-based correlation and initial event-based
20: event ← Levent [i] correlation to attribute system events to UI events. We classify
21: if IsU IEvent(event) then
22: U ← event GUI applications into two categories: static and dynamic based
23: Eadd ← F indRootOf AddedElements(U.element, Graph) on if there are activities triggered in the background. For
24: if Eadd 6= null then static applications(i.e., no background activity), UI events and
25: /* Activate the root of the new added elements */
26: Eactive ← Eadd corresponding system events are triggered synchronously and
27: else UIS COPE works well. For example, there are no background
28: /* Activate the operated element if no new element occurs */ activities in Notepad PlusPlus when there are no user
29: Eactive ← U.element
30: else if IsSystemEvent(event) then inputs. For dynamic applications (i.e., with background activi-
31: S ← event ties), using time-based correlation is not enough. For example,
32: if IsInitialEvent(S) then Chrome can download videos or other files in the background
33: /* Timestamp-based approach */
34: Minit .put(S.sink, Eactive ) while the user is browsing in the foreground. Browser is the
35: Graph.addEdge(Eactive , S.sink, U ISystemDependency) most common and complex dynamic application type. In the
36: else
following, we will use browsers as an example to demonstrate
37: /* Initial event-based approach */
38: Einit ← Minit .get(S.object) how UIS COPE handles background activities.
39: if S.source = proc then
40: Graph.addEdge(Einit , S.sink, U ISystemDependency) The accuracy of UIS COPE for browsers is affected by 1)
41: else the types of visited websites, 2) the duration of web sessions,
42: Graph.addEdge(S.source, Einit , U ISystemDependency)
3) the number of websites with background activities. We use
Chrome to monitor the behaviors of 500 popular websites in
an hour after being loaded. Those websites are selected from
in the list, it first checks the event type. If it is a UI event, Alexa top websites [1]. Foreground activities will trigger new
it checks whether the UI event causes new elements in the UI events that will be captured by our system, and UIS COPE
UI tree. If so, it marks the root element of newly added has high attribution accuracy. Thus, we focused on monitoring
UI elements as the current active element (lines 24 to 26). website behaviors that are left in the background without user
Otherwise, it marks the element operated by the current UI interactions. Specifically, the GUI automation tool [4] first
event as the active one (lines 27 to 29). Basically, system events triggers typical behaviors of a website (e.g., playing video on
occurring between two active elements chronologically will be www.youtube.com) to simulate initial user activities when
attributed to the former element. If the event is a system event, the website was visited. Then it does not interact with the
it first tests whether the event is an initial event (line 32). If so, website anymore to simulate the scenario in which the website
it records the relationship between the initialized resource and has been put in the background. Furthermore, we only consider
the current active element in the map Minit (line 34). Then network events because network events in the background are
it adds a new UI-System Dependency edge pointing from the much more complex and diverse than file events. For instance,
active element to the sink (line 35). Otherwise, it retrieves the cache and cookie of all websites loaded by Chrome are
the UI element related to the operated resource from previous stored in several deterministic files or folders (e.g., an SQLite
records in Minit and conducts the same operations as before database for cookies). Furthermore, our preliminary results
8150
# of websites
100
50
0
0 10 20 30 40 50 60 70 80 90 100 110 120 130 140 150 160 170 180 190 200 210 220 230 240 250 260 270 280 290 300 310 320 330 340 350 360
# of active time unit (each unit is 10 s)
Fig. 6. The number of active time units is small for most websites.
on 20 minutes running of 20 background web pages show 4 websites that have the maximum number of background
that 84% of total file events are related to 10 files, several activities. The Y-axis represents the top 10 frequent top-level
of which are the aforementioned cache and cookie files. It domain names and X-axis shows the number of socket sessions
indicates that file access in Chrome is simple and typical. that are related to a certain domain name. As we can see,
Finally, 436 websites were successfully monitored and used most socket connections are related to a limited number of
in this experiment are listed in Table VI. After analyzing the top-level domain names, indicating that background behaviors
data, we make a few important observations. are largely repeated connections. This allows UIS COPE to use
pattern based filters to remove such background activities.
Observation 1: Most new website activities are narrowed in
a short period of time and activities in the background are Adaptive Adversary. In an adaptive attack scenario in which
not common. We monitor website activities every 10 seconds the attacker is aware of the presence of UIS COPE, the attacker
as a unit and count the total number of units the website may intentionally use delayed background activities that do not
initializes at least one new socket. The result is shown in Fig. 6. have the resources initialized when the UI event occurs (e.g.,
The Y-axis in the graph represents the number of websites and using a timer to postpone the creation of a socket to download
the X-axis represent the number of active units. For example, a payload). Such attacks may lead to incorrect attribution
the first bar denotes that 173 websites are active in only one of low-level events to UI operations. But we argue that 1)
unit (10 seconds). From the graph, we know that 71.11% of the this is a common unsolved challenge for all existing attack
436 websites finish all the work within 1 minute and 89.44% investigation systems (e.g., [34], [35], [41]). 2) Practically, it is
of websites are idle for at least 55 minutes during the whole very difficult to perform such attacks, and many popular attack
time (1 hour). vectors cannot be delayed. For example, about 71% attacks use
phishing emails for initial compromise [7], and the adversary
Observation 2: Most socket sessions are initialized during is not able to do delay actions in this scenario.
web page loading. Fig. 7 shows the average number of
initialized socket sessions within 60 seconds after a website is Example. Fig. 10 presents an example of how Algorithm
visited. For such sockets, we observe that around 87.13% of all 2 works on the motivating example. Fig. 10 (I) and (II)
socket sessions are initialized within 10 seconds and 94.11% show the graphs generated by the UI Event Analyzer and
socket sessions are initialized within 20 second. Together with the System Event Analyzer. Fig. 10 (III) shows the final
the analysis results in observation 1, it verifies the usefulness of output graph. We use the logic time in this case to denote
our timestamp-based event attribution approach (Section III-F). the order of all the events. Elements B and H were clicked at
timestamps 3 and 6 respectively, which lead to two sockets
being initialized at timestamps 4 and 7. According to the
10 algorithm, the root (element C) of newly added elements and
# of initialized sockets
the operated element (element H) were marked as active at
8 timestamps 3 and 6, respectively. Thus, the socket events are
attributed to elements C and H, respectively. System events
6 occurring at timestamps 5 and 9 are non-initial events and we
attribute them to elements C and H through the tracing-back
4
to initial system object method. The red dotted line in Fig. 10
2 represents UI-System Dependency defined in Section III-C.
Note that benign.com:80 was initialized before those two
0 UI events for downloading the software WinSCP.exe, thus it
0 10 20 30 40 50 60 was attributed to previous UI elements. Furthermore, the non-
timestamp (each unit is 1 second) initial system event related to benign.com:80 occurring
Fig. 7. The number of initialized socket sessions within the first 60 second. at time 8 was attributed to the previous element to which
the socket creation belongs to. Observe that by separating a
Observation 3: Background activities are usually repeated process to different autonomous UI trees and attributing low-
behaviors. We analyzed the socket connection destinations of level system events to these trees, our technique achieves the
all sockets, including both existing sockets and new sockets, effect of partitioning a long-running execution to autonomous
and the results are shown in Fig. 8. Blue bars are the number units, which is the key to avoiding dependence explosion.
of both types of sockets and red bars are the number of newly
created sockets. The X-axis is time, and one hour period is
divided to 360 units. As we can see, there are not many IV. E VALUATION
new sockets after the pages are loaded, which implies that We evaluate UIS COPE by answering following questions.
websites in the background connect to a limited set of domain
names repeatedly. To further verify our finding, we manually • Q1: How much runtime and space overhead does UIS COPE
check with source code of some of these sites. Fig. 9 shows incur in production environments? (Section IV-A)
9# of initialized sockets
0.8 existing and new sockets
0.6 new sockets
0.4
0.2
0.0
0 10 20 30 40 50 60 70 80 90 100 110 120 130 140 150 160 170 180 190 200 210 220 230 240 250 260 270 280 290 300 310 320 330 340 350 360
timestamp (each unit is 10 second)
Fig. 8. The number of initialized socket for each time slice starting from 1 minute to 1 hour.
www.youtube.com www.dailymotion.com
googleadservices.com moatads.com data source for most existing attack investigation systems.
fonts.googleapis.com rubiconproject.com UIS COPE uses the Windows built-in audit system ETW as its
ytimg.com advertising.com
doubleclick.net pubmatic.com system event collector. ETW has been evaluated to be quite
google.co.uk vidible.tv
youtube.com adrta.com
googlesyndication.com casalemedia.com lightweight, only imposing 0.4% ∼ 2.5% runtime overhead
top level domain
gstatic.com 1rx.io
google.com teads.tv [42]. The space overhead caused by ETW mainly depends
googlevideo.com adsafeprotected.com
0 50 0 100 on what event types ETW is configured to capture. We use
www.nytimes.com www.foxnews.com ETW to monitor the same system event types (i.e., only the
media.net criteo.com security-relevant types) as existing works [38], [57], [50], [28],
bluekai.com edgekey.net
googlesyndication.com chartbeat.net [31], and thus the space overhead by ETW in UIS COPE is
gstatic.com rubiconproject.com
rubiconproject.com google.com around 210 MB per week after deploying their system, which
google.com krxd.net
adsafeprotected.com moatads.com is reasonable. Therefore, we focus on evaluating the run-time
chartbeat.net doubleclick.net
nytimes.com foxnews.com overhead and space overhead introduced by the UI collector.
doubleclick.net akamaihd.net
0 50 100 0 100 200
the number of socket sessions Ⅰ. Graph generated by UI Event Analyzer
C
Fig. 9. Long-term active website examples. A Type: Document
Type: Document Text: well-known.wordpress.com
3 AddElement
Text: mail.google.com
• Q2: How accurately can UIS COPE cohere UI elements 3 RemoveElement D
Type: Text
E
Type: Button
B
and System objects/subjects? (Section IV-B) Type: Hyperlink
Text: Congratulations Text: Get iPad
Text: well-known.word
• Q3: How effective is UIS COPE in conducting real-world press.com
F
attack investigation and how does it compare to the state- Type: Document
Text: www.bank.com
of-the-art? (Section IV-C) 6 RemoveElement
G H
Type: Text Type: Button
Experiment Setup. We deploy UIS COPE on 7 Windows Text: Balance:$2,333 Text: Transfer
computers and run experiments for a week to collect UI events Ⅱ. Graph generated by System Event Analyzer
and system events triggered. Note that we do not require those benign.com:80 well-known.wordpress.com:80
7 users to perform any specific actions, and our purpose is to 1 TCPConnect 4 TCPConnect
www.bank.com:443
collect event traces generated by their daily usage. In addition, 8 TCPReceive
5 TCPReceive
7 TCPConnect
we simulate six real-world attacks listed in Table V to evaluate 9 TCPReceive
the effectiveness of UIS COPE in attack investigation. Chrome
TABLE I. T HE RUNTIME OVERHEAD OF THE UI C OLLECTOR Ⅲ. Correlated Graph
UI Control Dependency
well-known.wordpress.com:80
App Native (ms) UI Collector (ms) Overhead UI Content Dependency
UI-System Dependency
Notepad 22882 22909 0.12% 4 5
Notepad PlusPlus 21458 21502 0.20% C
A Type: Document
Sublime Text 30386 30415 0.10% Type: Document 3 AddElement Text: well-known.wordpress.com
Explorer 31090 31174 0.27% Text: mail.google.com
Paint 28551 28713 0.57% 3 RemoveElement D E
Type: Text Type: Button
Snipping Tool 13785 13791 0.05% B
Text: Congratulations Text: Get iPad
Type: Hyperlink
Chrome 48511 48836 0.67% Text: well-known.word
press.com
Edge 50832 51184 0.69% F
WinScp 32080 32186 0.33% Type: Document
Text: www.bank.com
FileZilla 34511 41079 19.03% 6 RemoveElement
Outlook 33138 33404 0.80% G 7 H
Type: Text www.bank.com:443 Type: Button
Skype 29085 29336 0.86% Text: Balance:$2,333
9
Text: Transfer
Adobe Reader 35356 35581 0.63%
Foxit Reader 36744 37057 0.85%
Fig. 10. A log example of correlation analyzer.
1) Runtime overhead: We evaluate the runtime overhead
A. Performance Overhead of UI collector in UIS COPE for 14 different GUI applications.
Firstly, we collect a lot of application traces from real-world
UIS COPE includes two event logging tools, the UI col- scenarios. Then, we automate these workloads in two different
lector and the system event collector, for trace collection on environments, i.e., with and without UIS COPE collecting UI
end hosts. System event traces are deemed to be the major events and trees. Table I shows the results. Column 2 represents
10TABLE II. S PACE OVERHEAD EVALUATION RESULTS
S-0 S-1 S-2 S-3 S-4 S-5 S-6 Total
CPU I5-9400 I7-6500U I7-8700 I7-8700 I7-7500U I7-8550U I5-7400 N/A
RAM (GB) 8 8 16 16 16 16 8 N/A
Windows Version 7 10 10 10 10 10 10 N/A
Duration (hours) 16.7 108.7 95.4 54.6 37.4 28.7 121.9 463.4
# of UI Events/Trees 1,131 32,824 18,687 34,010 22,766 8,704 354,907 473,029
Size (MB) 14.84 251.44 55.18 179.86 81.16 23.78 753.35 1416.62
TABLE III. ATTRIBUTION ACCURACY OF S TATIC A PPLICATIONS
the average running time of running on native environment,
column 3 represents the average running time of the same user Timestamp +
Timestamp
interaction with UI collector, and the column 4 is the runtime App Operation Initial Event
overhead. The table shows that the UI collector introduces TPR FPR TPR FPR
negligible (less than 1%) runtime overhead for almost all
Open 100 0 100 0
applications. UI collector introduces 19.03% overhead for Notepad Save 100 0 100 0
FileZilla. The reason is that the GUI of FileZilla has Save as 100 0 100 0
its own customized UI Automation APIs [13], which issues Open 100 0 100 0
larger overhead. Notepad PlusPlus Save 100 0 100 0
Save as 100 0 100 0
2) Space overhead: Table II presents the details about the Open 100 0 100 0
collected UI event logs on each host. For each user machine, Sublime Text Save 100 0 100 0
Table II lists the hardware configuration (i.e., CPU and RAM), Save as 100 0 100 0
Windows OS installed, duration of running the event collectors, Delete File 100 0 100 0
number of UI events triggered by daily user behavior, and Explorer Rename 100 0 100 0
Copy Paste 100 0 100 0
storage space for the UI events. Note that the users are free to
enable or disable UIS COPE, so the duration of event logging Open 100 0 100 0
Paint Save 100 0 100 0
varies from user to user. Save as 100 0 100 0
In summary, being deployed on 7 user machines for a New 100 0 100 0
SnippingTool Save 100 0 100 0
week (with a total active duration of 463.4 hours), UIS COPE Save as 100 0 100 0
collected 1416.62 MB UI log including 473,029 UI events
Login 100 0 100 0
and the corresponding UI trees. On average, the UI collector WinScp Download 81.32 2.21 100 0
component on one machine generates 3.05 MB event logs per Upload 90.23 1.13 100 0
hour. Hence, the space overhead is negligible, compared to Login 100 0 100 0
system logging. FileZilla Download 85.2 1.63 100 0
Upload 80.1 2.17 100 0
B. Accuracy of Events Correlation Open Email 81.4 2.06 99.2 0.07
Outlook Upload 100 0 100 0
1) Static Applications: To evaluate the accuracy of event Download 100 0 100 0
correlation, it is necessary to obtain the ground truth. Skype
Upload 100 0 100 0
Download 91.37 1.05 100 0
We did the following experiments with 12 popular appli-
cations, including editor software (Notepad PlusPlus, Open 100 0 100 0
Adobe Reader Save 100 0 100 0
Sublime Text, and Notepad), communication software Save as 100 0 100 0
(Outlook and Skype), file transfer software (WinSCP
Open 100 0 100 0
and FileZilla), PDF Reader (Adobe Reader and Foxit Reader Save 100 0 100 0
Foxit Reader), and miscellaneous software (Explorer, Save as 100 0 100 0
Snipping Tool, and Paint). These static applications
Average - 97.41% 0.29% 99.97% 0.002%
introduce no or negligible background activities (e.g., checking
new versions after opening the software).
For each application, we use a UI automation tool [54]
to trigger a typical application specific behavior and collect the correlation. Then we compare the results with the ground
system events, e.g., file opening and saving for Notepad truth to evaluate UIS COPE. As mentioned in Section III-F,
PlusPlus. We repeat this process three times in isolated we develop two attribution methods: timestamp-based and
environments and extract a common set of system events from initial event-based. We apply different combinations of these
these three runs. The pairings of the used UI events and the attribution methods to the collected traces. Table III shows
corresponding common set of system events are considered the attribution accuracy results on the 12 popular applications
our ground truth of one behavior. under different operations. The last row shows the average
value of True Positive Rate (TPR) and False Positive Rate
For each application, we performed its specific behavior 10 (FPR) for all the 12 applications.
times with different settings (e.g., opening 10 different files),
and obtain the ground truth for the 10 instances. Next, for each We can see that on average 97.41% system events can be
application, we trigger all the 10 behavior instances, collect attributed to the correct UI events only based on timestamps,
the generated system events, and use UIS COPE to perform which is consistent with our observation in Section III-F2.
11You can also read