Widespread reorganisation of pluripotent factor binding and gene regulatory interactions between human pluripotent states - Babraham Institute
←
→
Page content transcription
If your browser does not render page correctly, please read the page content below
ARTICLE
                  https://doi.org/10.1038/s41467-021-22201-4                 OPEN

                  Widespread reorganisation of pluripotent factor
                  binding and gene regulatory interactions between
                  human pluripotent states
                  Peter Chovanec1,2,6, Amanda J. Collier 3,6, Christel Krueger 3, Csilla Várnai 2,4, Claudia I. Semprich                                          3,

                  Stefan Schoenfelder 2,3,7, Anne E. Corcoran 1,2,7 & Peter J. Rugg-Gunn 3,5,7 ✉
1234567890():,;

                  The transition from naive to primed pluripotency is accompanied by an extensive reorgani-
                  sation of transcriptional and epigenetic programmes. However, the role of transcriptional
                  enhancers and three-dimensional chromatin organisation in coordinating these develop-
                  mental programmes remains incompletely understood. Here, we generate a high-resolution
                  atlas of gene regulatory interactions, chromatin profiles and transcription factor occupancy in
                  naive and primed human pluripotent stem cells, and develop a network-graph approach to
                  examine the atlas at multiple spatial scales. We uncover highly connected promoter hubs that
                  change substantially in interaction frequency and in transcriptional co-regulation between
                  pluripotent states. Small hubs frequently merge to form larger networks in primed cells, often
                  linked by newly-formed Polycomb-associated interactions. We identify widespread state-
                  specific differences in enhancer activity and interactivity that correspond with an extensive
                  reconfiguration of OCT4, SOX2 and NANOG binding and target gene expression. These
                  findings provide multilayered insights into the chromatin-based gene regulatory control of
                  human pluripotent states.

                  1 Lymphocyte Signalling and Development Programme, Babraham Institute, Cambridge, UK. 2 Nuclear Dynamics Programme, Babraham Institute,

                  Cambridge, UK. 3 Epigenetics Programme, Babraham Institute, Cambridge, UK. 4 Centre for Computational Biology, University of Birmingham,
                  Birmingham, UK. 5 Wellcome – MRC Cambridge Stem Cell Institute, Cambridge, UK. 6These authors contributed equally: Peter Chovanec, Amanda J. Collier.
                  7
                    These authors jointly supervised this work: Stefan Schoenfelder, Anne E. Corcoran, Peter J. Rugg-Gunn. ✉email: peter.rugg-gunn@babraham.ac.uk

                  NATURE COMMUNICATIONS | (2021)12:2098 | https://doi.org/10.1038/s41467-021-22201-4 | www.nature.com/naturecommunications                             1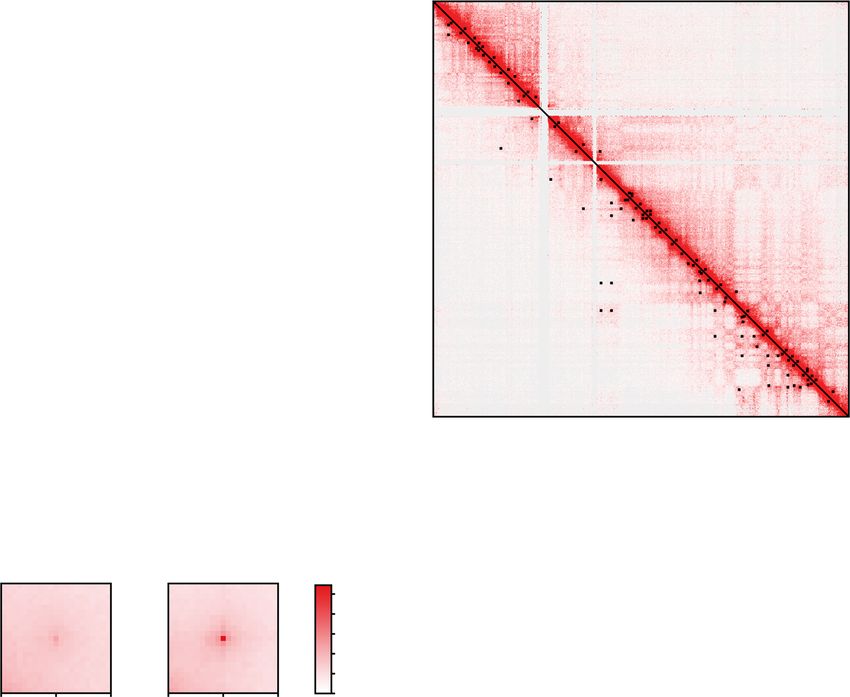
ARTICLE                                                                  NATURE COMMUNICATIONS | https://doi.org/10.1038/s41467-021-22201-4

T
       he spatial organisation of chromosomes instructs dynamic               sub-TADs40–42. In particular, Pancaldi and colleagues pioneered
       processes during development that underpin genome reg-                 the development of chromatin assortativity networks, based on
       ulation and transcriptional control1–5. Mammalian gen-                 the extent to which promoter-interacting regions share chromatin
omes are compartmentalised into a nested hierarchy of structural              properties, to uncover the relative importance of specific epige-
features6,7, including megabase-scale topologically associating               netic states and transcription factors to gene regulatory
domains (TADs) that are largely invariant across cell types, and              organisation43. What has not been reported so far, however, is the
smaller, nested sub-TADs, chromatin loops and insulating                      generation of a combined and highly scalable network to compare
neighbourhoods that are frequently reorganised between cellular               the global interactomes and epigenetic landscapes between cell
states8–17. Constrained within the larger structural features, distal         types, nor the application of different visualisation methods to
regulatory elements, such as enhancers, interact with target gene             provide additional organisational information to the networks.
promoters through DNA looping to control promoter activity.                      To investigate the hierarchical differences in 3D genome
Distal elements can loop to several genes, and genes can interact             organisation between naive and primed human PSCs, we used Hi-
with multiple distal elements, resulting in complex three-                    C36, PCHi-C37,38, and chromatin profiling to generate an anno-
dimensional (3D) interaction networks that are often re-wired                 tated high-resolution atlas of ~130,000 DNA interactions in these
upon cell state change5,14,18,19. The formation of regulatory                 two cell states. By developing a computational approach to inte-
interactions is directed in part by the cell type-specific occupancy           grate and visualise the atlas at a network level, we identify striking
of chromatin proteins and transcription factors20. The binding of             differences in organisational features between the two cell states at
these factors is often sensitive to epigenetic marks such as DNA              multiple spatial scales. Prominent genomic features included large,
methylation, and thus the close interplay between epigenetics and             highly connected hubs of interacting genes, such as the proto-
chromatin topology is critical for the appropriate gene regulatory            cadherin and histone H1 families, which changed substantially in
control of cell state transitions. Investigating how chromatin                interaction frequency and in their transcriptional co-regulation
interactions track with a changing epigenetic and gene regulatory             between pluripotent states. Additionally, small hubs frequently
landscape is important for understanding the principles of gen-               merged through newly formed Polycomb-associated interactions
ome organisation and transcriptional control.                                 to form larger networks in primed cells. We also identified
   One of the most striking periods of epigenome reorganisation               widespread state-specific differences in enhancer activity and
occurs as pluripotent stem cells (PSCs) transition from a naive               interactivity, whereby a surprisingly low proportion of active
state to a primed state. During this transition, DNA methylation              enhancers were shared between the two pluripotent cell types. By
levels rise from ~20% to ~70% genome-wide and there is a dra-                 mapping pluripotency factor occupancy, we found that changes in
matic gain in promoter-associated H3K27me3 at several thou-                   enhancer state corresponded with an extensive reconfiguration of
sand genes21–27. These events recapitulate similar molecular                  OCT4, SOX2 and NANOG binding and transcription of their
transitions as embryos progress from pre- to post-implantation                target gene promoters. Our findings uncover a global reorgani-
stages of development28–31 and PSCs therefore provide a tractable             sation of promoter interactions at multiple spatial scales that
system to investigate these processes. In mouse PSCs, global                  occurs during the transition from naive to primed PSCs, thereby
epigenetic changes occur in parallel with the reorganisation of               providing insights into the chromatin-based gene regulatory
gene regulatory interactions that take place within largely pre-              control of human development and pluripotency.
served structural domains17,32. For example, the acquisition of
H3K27me3 at gene promoters during the transition from a naive
to a primed state is concomitant with the emergence of a long-                Results
range network of promoter–promoter interactions that connect                  Mapping promoter interactions and chromatin states in naive
the H3K27me3-marked regions33. This spatial network is thought                and primed human PSCs. We used Hi-C and PCHi-C to profile
to constrain the transcriptional activity of developmental genes34.           the global, high-resolution interactomes of 22,101 promoters in
In human PSCs, the mapping of a subset of DNA interactions                    isogenic human naive and primed PSCs (cultured in t2iL+PKCi22
that are cohesin-associated revealed that the positioning of long-            and TeSR-E844 feeder-free conditions, respectively). There was a
range structural loops is similar between naive and primed states,            strong concordance in pairwise interaction read counts between
suggesting that their TAD and insulated neighbourhood struc-                  the biological replicates of the same cell type (r2 > 0.95; Supple-
tures are largely preserved35. Within those domains, however,                 mentary Fig. 1a). PCHi-C data normalisation and signal detection
individual interactions connecting active enhancers to cell-type-             using the CHiCAGO pipeline37,45 identified 75,091 significant
specific genes are re-wired between naive and primed states. This              cis-interactions between baited promoters and other genomic
raises the possibility that nested within TADs and cohesin-                   regions in naive PSCs, and 83,782 in primed PSCs (Supplemen-
mediated loops, altered interactions between genes and their                  tary Fig. 1b). Just under half of the interactions were common to
regulatory elements have widespread effects on controlling tran-              both cell types (n = 39,360). Pile-up plots showed that interaction
scriptional changes in pluripotent state transitions. There is a              signals are present in the same regions in both the PCHi-C and
pressing need, therefore, to compare regulatory interactions                  Hi-C datasets, and, as anticipated from prior studies37,38,45, the
between enhancers and their target genes in human PSC states                  signals are stronger in the PCHi-C data due to the higher cov-
globally and at high resolution, and to use these data to unravel             erage at these interacting regions compared with their respective
the nested structures of genome organisation.                                 Hi-C samples (Supplementary Fig. 1c). As expected, trans-inter-
   Chromatin conformation capture technologies such as Hi-C                   actions represented a small minority of promoter interactions
can reveal genome-wide spatial DNA interactions36 and can be                  (354 interactions). In both cell types, the majority of significant
combined with sequence enrichment to increase coverage of                     interactions were between the promoters of protein-coding genes
interactions at genomic features such as promoters (promoter-                 and non-promoter genomic regions (Supplementary Fig. 1b). To
capture Hi-C; PCHi-C)37,38. The rapid progress in experimental                functionally annotate the interactomes, we integrated new and
methods requires new ways to maximise the discovery of novel                  published histone ChIP-seq datasets to assign ChromHMM-
insights from the resulting interaction data39. Network approa-               defined46 chromatin states to the genome including interacting
ches have been applied successfully to global Hi-C data by using              regions (Supplementary Fig. 1d, e). These chromatin state maps
network modularity to identify communities of interacting loci                identified regions that are associated with active and poised
that represent high-level chromatin features such as TADs and                 classes of promoters and enhancers, Polycomb-bound sites and

2                 NATURE COMMUNICATIONS | (2021)12:2098 | https://doi.org/10.1038/s41467-021-22201-4 | www.nature.com/naturecommunications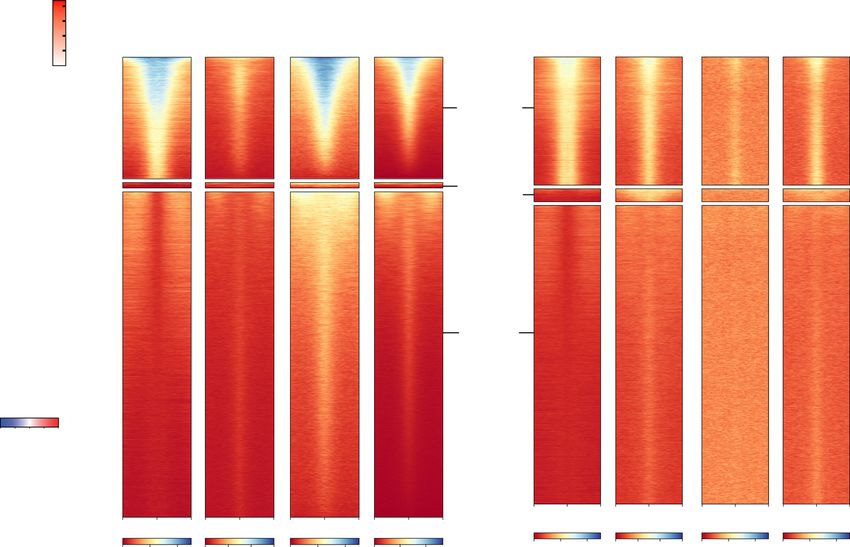
NATURE COMMUNICATIONS | https://doi.org/10.1038/s41467-021-22201-4                                                                 ARTICLE

heterochromatin marks. Processed datasets from this large-scale                 We additionally found, however, that the insulation score of
resource are available through the Open Science Framework                       TAD boundaries was higher in primed compared to naive PSCs
(https://osf.io/jp29m) and Supplementary Dataset 1, and                         (by 15%; naive: 0.80, primed 0.92; Supplementary Fig. 3b), sug-
sequencing data have been deposited to the Gene Expression                      gesting there are differences in TAD boundary strength between
Omnibus (accession ‘GSE133126’).                                                the two cell types. In addition to communities, this mid-level
                                                                                visualisation of the network graph identified large interaction
                                                                                clusters, exemplified by the histone H1 and protocadherin
Network visualisation of promoter interactomes. We next
                                                                                genes that we described above. Finally, the highest visualisation
developed a computational approach called Canvas (Chromo-
                                                                                level identifies high-resolution and detailed structure including
some architecture network visualisation at scales) to visualise and
                                                                                potential cis-regulatory regions of individual baited gene pro-
integrate high-resolution, capture-based DNA interaction data
                                                                                moters (Fig. 1d). Taken together, network scale visualisation of
and chromatin states at a network scale. Network graphs were
                                                                                annotated promoter interactomes can provide an intuitive
constructed where each node of the network represents an indi-
                                                                                method for data exploration at several scales of 3D chromosome
vidual HindIII genomic fragment (average size, 4 kb) and each
                                                                                organisation to reveal features of genome architecture that range
edge represents a CHiCAGO-called45 significant interaction
                                                                                from higher-order chromatin structure down to individual pro-
between nodes (Fig. 1a). We combined all significant interactions
                                                                                moter interactions.
detected in naive and primed PSCs to produce a single, unified
network graph, which retains information about whether an
interaction is shared or cell type-specific (Fig. 1a). The combined
                                                                                Long-range promoter interactions distinguish the two plur-
network was visualised with a force-directed layout47 that posi-
                                                                                ipotent states. To investigate the spatial regulation of human
tions highly interacting nodes closer together and pulls less
                                                                                pluripotent states, we examined promoter-interaction changes
interacting nodes apart (Fig. 1b).
                                                                                that occur within each defined sub-network between naive and
   Annotating naive-specific and primed-specific interactions
                                                                                primed PSCs. We compared the number of nodes and the overall
onto the combined network uncovered large clusters with high
                                                                                number of interactions within individual sub-networks. Using
and uniform cell-type-specific interactivity, which have not been
                                                                                this approach revealed that nearly all of the sub-networks that
reported previously in PSCs. Two of the most prominent
                                                                                changed in the number of nodes and interactions between plur-
examples of this are the histone H1 genes in naive PSCs and
                                                                                ipotent states were larger in primed PSCs (Fig. 2a). Sub-networks
the protocadherin genes in primed PSCs (Fig. 1b and Supple-
                                                                                in primed PSCs therefore contained a greater number of inter-
mentary Fig. 2a). The histone H1 cluster contained 198 nodes
                                                                                actions and more nodes compared to sub-networks in naive PSCs
connected by 984 edges, and the protocadherin cluster contained
                                                                                (Fig. 2a). We observed similar trends when examining each
165 nodes and 1188 edges. Overlaying transcriptional informa-
                                                                                replicate separately (Supplementary Fig. 4a). These findings
tion onto each node showed that the higher promoter
                                                                                suggest that smaller communities in naive PSCs come together to
interactivity within the histone H1 and in the protocadherin
                                                                                form larger sub-networks in primed PSCs.
clusters is associated with increased expression of nearly all genes
                                                                                   To begin to understand the increased size of sub-networks in
within each cluster, implying a coordinated transcriptional
                                                                                primed PSCs, we examined the sub-network that showed the
response (Fig. 1c and Supplementary Fig. 2b). Not all large gene
                                                                                largest change in the number of nodes and edges when
clusters that changed interaction frequency between cell types
                                                                                comparing between pluripotent states. In naive PSCs, this sub-
showed differential expression, as exemplified by the keratin and
                                                                                network was composed mainly of individual, separate commu-
olfactory receptor gene regions (Fig. 1b and Supplementary
                                                                                nities that are distributed across chromosome 5 (Fig. 2b).
Fig. 2a, b). We also generated network graphs using each
                                                                                However, in primed PSCs, these communities were connected
individual replicate to assess the reproducibility of the networks.
                                                                                by >200 long-range interactions (defined as >1 Mb in the linear
We found that the key interaction landmarks are very consistent
                                                                                distance) (Fig. 2b). The acquisition of long-range interactions to
when comparing datasets, demonstrating good reproducibility
                                                                                create large sub-networks in primed PSCs was a common feature,
between replicates (Supplementary Fig. 2c, d). Taken together, the
                                                                                as exemplified by regions on other chromosomes including the
combination of high-resolution DNA interactivity and gene
                                                                                HOXA, HOXD and NKX loci (Supplementary Fig. 4b, c). In
regulatory information on a whole-network graph provides a
                                                                                contrast, the only clear instance of a sub-network with more
systems-level visualisation of genome organisation, and uncov-
                                                                                promoter interactions and nodes in naive PSCs was for the
ered large clusters of promoter interactions as prominent
                                                                                histone H1 locus (Supplementary Fig. 4b, c). Analysing all
structural features in pluripotent cells.
                                                                                promoter interactions revealed a substantial increase in their
                                                                                number and linear distance in primed compared to naive PSCs
Multiscale exploration of promoter-interaction networks.                        (Fig. 2c) and this difference was independent of the applied
Network reconstruction of the promoter-interaction data using                   CHiCAGO threshold (Supplementary Fig. 4d).
Canvas allows the interrogation of genome organisation at                          We next confirmed the difference in the number of long-range
multiple spatial levels. Viewed at the lowest magnification, the                 promoter interactions between pluripotent states using an
network graph consists of >3000 individual sub-networks of                      alternative approach that is independent of promoter capture.
varying size (Fig. 1d). Using algorithms developed for the                      We analysed our Hi-C data using HiCCUPS12, which is an
detection of community structure48, each sub-network can be                     algorithm that calls interaction ‘peaks’ when a pair of loci show
further divided into communities that have high internal inter-                 elevated contact frequency relative to the local background. This
activity. We noticed that the positioning of the individual com-                approach revealed that the number of long-range chromatin
munities showed strong, significant overlap with TADs, which                     interactions (>1 Mb) was substantially higher in primed (n = 889)
we identified separately using matched Hi-C data (Supplemen-                     compared to naive PSCs (n = 480) (Fig. 2d). This striking
tary Fig. 3a–d). This finding demonstrates that Canvas is capable                difference is exemplified for several chromosomes by overlaying
of using promoter-interaction data to define and visualise                       the identified peaks onto Hi-C contact matrices (Fig. 2e and
structural components of genome organisation. In agreement                      Supplementary Fig. 5). Importantly, the interaction peaks
with previous studies35,49, the majority (70%) of TADs are                      identified by HiCCUPS in primed PSCs matched the positions
shared between naive and primed PSCs (Supplementary Fig. 3a).                   of long-range promoter interactions detected by PCHi-C (Fig. 2e),

NATURE COMMUNICATIONS | (2021)12:2098 | https://doi.org/10.1038/s41467-021-22201-4 | www.nature.com/naturecommunications                        3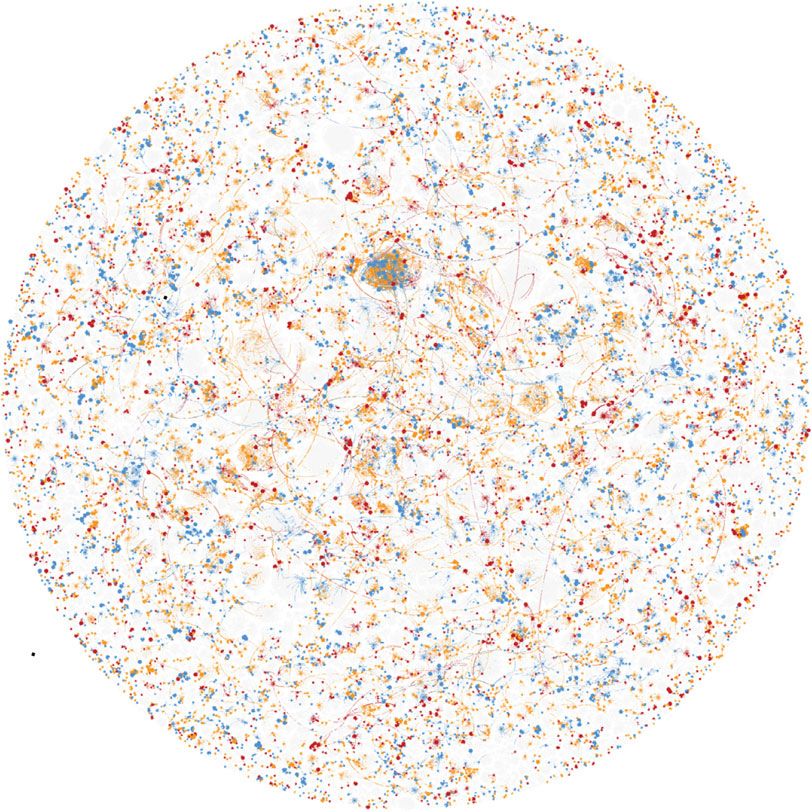
ARTICLE                                                                                                       NATURE COMMUNICATIONS | https://doi.org/10.1038/s41467-021-22201-4

     a                                                                                                                      b
           Canvas: Chromosome architecture network visualisation at scales
                                                                                                                                              Olfactory receptor gene cluster    Histone H1 gene cluster
                                                                                     Naïve PSC specific
                                                                                     Primed PSC specific
                                                                                                                                               HOXD                                     Keratin gene cluster
                                                                                     Shared
                                                                                                                              Protocadherin
                                                                                                                              gene cluster
                                                                                       Interaction (edge)
                                                                                       HindIII fragment (node)

          Naïve network     Primed network               Combined network

     c
                                                                          Naïve PSCs                 Primed PSCs
                                             Histone gene cluster

                                                                                                                                        HOXC
                                                                                                                                                                                                 HOXA
                                             Protocadherin gene cluster

                                                                                                                                                                    HOXB

         Upregulated in primed PSCs
         Upregulated in naïve PSCs
         Mixed
         Not differentially expressed

                                                                              HindIII interaction frequency

     d

                                                                                                 Sub-network                                                                    Sub-network
                                                                                                                                                                                communities

                                                                                                                                                                          Data overlay
                                                                                                                                                                      (ChromHMM states)
                                                                                                                                                                     within each community

                                                                                                                 Promoter interacting
                                                                                                                    regions (PIRs)

thereby validating the presence of the promoter-capture interac-                                                  interactions are a dominant feature in primed PSCs that connect
tions. To visualise the contact enrichment at the identified peaks                                                 individual communities into larger sub-networks.
in naive and primed PSCs more closely, we applied Aggregate
Peak Analysis12 to the long-range interaction loci. We found
there was a stronger enrichment (by ~2.5-fold) at these                                                           Acquisition of Polycomb-associated interaction networks in
aggregated sites over local background levels in primed PSCs                                                      primed human PSCs. To characterise the properties of the long-
compared to naive PSCs (Fig. 2f). This result confirms the                                                         range promoter interactions, we investigated the chromatin states
observed differences in long-range contact frequency between                                                      of the individual HindIII fragments. The chromatin state of
pluripotent cell types. Taken together, long-range promoter                                                       regions that are brought together by long-range interactions

4                    NATURE COMMUNICATIONS | (2021)12:2098 | https://doi.org/10.1038/s41467-021-22201-4 | www.nature.com/naturecommunications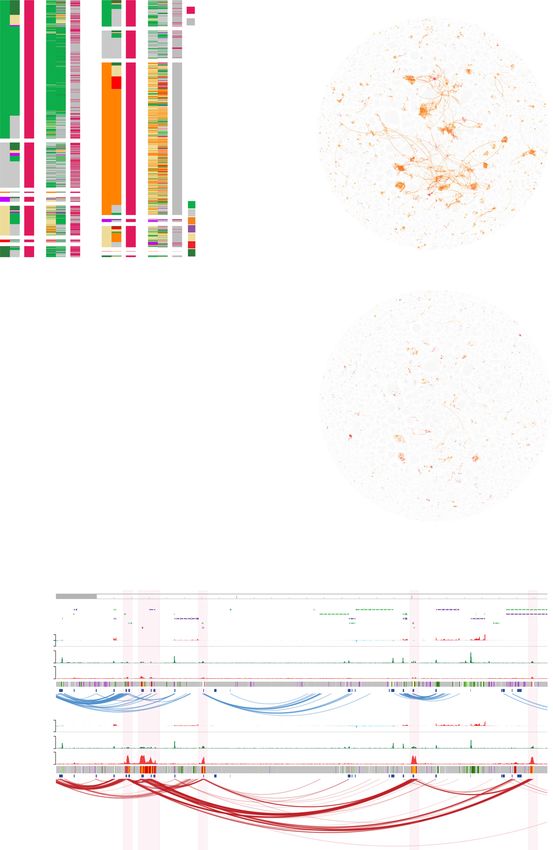
NATURE COMMUNICATIONS | https://doi.org/10.1038/s41467-021-22201-4                                                                       ARTICLE

Fig. 1 Multiscale exploration of promoter-interaction data using force-directed network graphs. a Representation of PCHi-C data as arc diagrams
(upper) and as corresponding network graphs (lower). Interacting HindIII genomic fragments are depicted as nodes that are connected by edges
(significant interactions). A combined network graph is created by merging naive and primed human PSC datasets whilst retaining cell type-specific
information. Blue, naive-specific nodes and edges; red, primed-specific nodes and edges; grey, shared nodes and edges. b Canvas produces a force-directed
layout of the combined, whole-network graph. Nodes that interact more frequently are pulled closer together, and less interacting nodes are pushed further
apart. c Differential gene expression (P-adj < 0.05; n = 3 biologically independent samples per cell type) categories between naive and primed PSCs
overlaid onto the combined network graph. The ‘mixed’ category refers to the small subset of nodes that contain two or more genes that differ in the
direction of their transcriptional change. Expanded examples are shown for the histone H1 gene cluster (upper) and the protocadherin gene cluster (lower).
The size of each node corresponds to the number of interactions (degree) of the node. d The network graph (left) shows the combined promoter
interactomes for naive and primed PSCs, visualised using Canvas. Each sub-network is assigned a different colour. Following the arrow, the next part of the
figure shows a single, isolated sub-network (the largest sub-network in the dataset). The boxed region is expanded in the next area of the figure to show
the distinct, sub-network communities that have high internal interactivity. The same communities and structure are shown in the next part of the figure,
where the nodes are coloured according to their predominant chromatin state (green, active; orange, bivalent; red, polycomb-only; purple, heterochromatin;
grey, background). A small part of the community is magnified in the final area of the figure to show all of the interacting regions for one promoter.

differed between the two cell types. The longest interactions in                cis-interactions and also trans-interactions with regions on other
naive PSCs were marked by active chromatin states at the pro-                   chromosomes, including the HOX clusters themselves (Supple-
moter and at the interacting region (Fig. 3a, left). The clear                  mentary Fig. 7a). The lower levels of H3K27me3 at gene
majority of these interactions and their chromatin states were also             promoters in naive PSCs corresponded to the absence of
present in primed PSCs (Fig. 3a, left). In contrast, the longest                interactions within the HOX loci (Supplementary Fig. 7b, c).
interactions in primed PSCs were dominated by bivalent chro-                    Three-dimensional DNA-FISH experiments validated these
matin states (dual H3K27me3 and H3K4me1/3 methylation) at                       findings by showing that in primed PSCs, HOXD10/11 and
both ends of the interaction (Fig. 3a, right). Only one-third of                DLX1/2 loci were in closer proximity compared to HOXD10/11
these regions were classified as bivalent in naive compared to                   and a control locus that is equidistant in the opposite direction
primed PSCs (208/1000, naive; 655/1000, primed) and very few of                 along the chromosome (Supplementary Fig. 7d). In contrast, in
these interactions were detected in naive PSCs (n = 37/1000;                    naive PSCs, there was no difference in the proximity between
Fig. 3a), suggesting that they are formed de novo upon the                      HOXD10/11—DLX1/2 and HOXD10/11—control locus (Supple-
transition from naive to primed pluripotency.                                   mentary Fig. 7d). Taken together, these results reveal that the
   To further investigate the establishment of H3K27me3-                        majority of long-range interactions connect regions that gain
associated interaction networks in primed PSCs, we examined                     H3K27me3 during the naive to primed conversion, thereby
the chromatin state of these same regions in naive PSCs.                        creating large spatial networks of developmental genes in
Approximately one-quarter of the regions were already marked                    primed PSCs.
by H3K27me3 in naive PSCs (Fig. 3b). More commonly, the
regions were classified as active or mixed state chromatin in naive              Pluripotent state-specific enhancer activity and interactivity.
PSCs, and therefore acquired H3K27me3 during the transition to                  Our current understanding of the differences in gene regulatory
primed PSCs (Fig. 3b). A closer look at the individual HindIII                  control between human pluripotent states is incomplete due to
fragments that were classified as mixed chromatin state in naive                 the lack of global and high-resolution mapping of promoter cis-
PSCs revealed that these regions contained patches of active and                regulatory interactions. To overcome this important knowledge
repressive chromatin states (Supplementary Fig. 6a), commonly                   gap, we annotated enhancers in naive and primed PSCs and then
with H3K4me1/3-only peaks residing within larger blocks of                      used PCHi-C data to identify the target gene promoters for those
H3K27me3. This implies that the H3K4me1/3-marked sites                          enhancers. We defined super-enhancers (SEs) by running
are protected from H3K27me3 in naive PSCs, but that                             H3K27ac ChIP-seq data through the ranking of super-enhancer
H3K27me3 spreads throughout the region in primed PSCs.                          (ROSE) pipeline50,51. This approach identified 182 naive-specific
Genes within these regions were associated with developmental                   SEs and 62 primed-specific SEs (Fig. 4a). We also curated
processes, with examples including DLX, GATA and HOX factors                    ~600–700 SEs that are shared between both cell types (Fig. 4a).
(Supplementary Fig. 6b).                                                        Integrating the enhancer annotations with the PCHi-C data
   Using Canvas to visualise all H3K27me3-associated interac-                   identified the gene promoters that interact with each SE.
tions clearly highlights the differences between pluripotent states.            Remarkably, the majority of SE-target genes (85%, n=931) were
This category of interactions formed numerous highly interacting                cell type-specific and only 15% of genes were contacted by SEs in
clusters in primed but not naive PSCs (Fig. 3c). Individual                     both naive and primed PSCs (Fig. 4b). In particular, there were a
clusters were connected through long-range interactions and,                    large number of gene promoters (n=633) that interacted with a
remarkably, nearly all (98%) of the long-range cis-interactions                 shared SE only in naive PSCs (Supplementary Fig. 8a). In con-
within the dataset were associated with bivalently-marked                       trast, relatively few promoters (n=250) interacted with a shared
promoters (Supplementary Fig. 6c).                                              SE only in primed PSCs (Supplementary Fig. 8a). Based on this,
   Protein-coding genes belonging to the major developmental                    we hypothesised that SEs might interact with more promoters in
gene families were spatially organised within the H3K27me3-                     naive compared to primed PSCs, however, we found that the
associated interaction network in primed PSCs (n = 696; Fig. 3c).               number of interacting promoters per SE was very similar between
This large gene set was strongly enriched for transcriptional                   the two cell types (Supplementary Fig. 8b,c). Genes that inter-
regulators and homeobox-containing factors (Supplementary                       acted with SEs only in naive PSCs included members of signalling
Dataset 2). For example, a region on chromosome 7 that includes                 pathways such as IL6 and GDF3 and chromatin regulators such as
SHH, EN2 and MNX1 formed a highly interacting cluster in                        TET1 and REST (Fig. 4b). Similarly, genes in contact with a SE
primed PSCs through the presence of long-range interactions that                only in primed PSCs included transcription factors such as KLF7,
align closely to H3K27me3 peaks (Fig. 3d). Other examples                       TCF4 and ZIC2 (Fig. 4b). Relatively few genes (n = 170) inter-
include the HOX gene loci, where we detected long-range                         acted with a SE in both cell types and this set of genes included

NATURE COMMUNICATIONS | (2021)12:2098 | https://doi.org/10.1038/s41467-021-22201-4 | www.nature.com/naturecommunications                                 5
ARTICLE NATURE COMMUNICATIONS | https://doi.org/10.1038/s41467-021-22201-4
a b
600 44.9%●
Naïve PSCs Primed PSCs
HISTH1
400
Interactions (Naïve - primed)
200
0
45.1%
−200
Stress score: 0.139
−400 HindIII fragments
Most Interactions (length represents genomic distance)
−600 ● changing PCDH
sub-network ●
−300 −200 −100 0 100
HindIII Fragments (Naïve - Primed)
c e
Long Mid Short 23
(>1Mb) (~150kb) (~6kb) Naïve PSCs
●
● ●
●
Interaction distance (log scale)
●
●
●
●
●
33.5Mb ●
●
●
●
●
●
●
●
1Mb
Juicer tools HiCCUPS loops
33kb
●
● ●
●
●
● ●
●
● ●
●
●
Naïve Primed Naïve Primed Naïve Primed
d
1000
Number of loops
800
600
Primed PSCs
400 23
200 Chr.5
Mb
80 Primed 1398 50 100 150
CHiCAGO score
0 213
Naïve Primed
40
0
40 Naïve 1022
13
0
f
Naïve P2LL:1.323 Primed P2LL:3.19
5000
4000
3000
2000
1000
0
-2.5 Mb 0 +2.5 Mb -2.5 Mb 0 +2.5 Mb
ACTB and LIN28B (Fig. 4b). In line with the proposed capability promoters detected as interacting with a normal enhancer, 49%
of SEs to promote the expression of genes that are important for were found to contact an enhancer in both cell types (Fig. 4e and
cell identity50,52, we observed a higher transcriptional output of Supplementary Fig. 8d), which contrasts with the much lower
SE-target genes in a cell type-specific manner and a comparable, proportion for SEs (15%; Fig. 4b). Several core pluripotency-
high transcriptional output for genes contacted by SEs in both cell associated genes interact with enhancers in both naive and
types (Fig. 4c). The large number of cell type-dependent gene primed PSCs including DPPA4, TCF3 and TFAP2C—all of which
promoters that contact SEs demonstrates the substantial changes are highly expressed in both cell types. More generally, differences
in SE activity and interactivity that occur between the two plur- in enhancer interactivity were concordant with transcriptional
ipotent states. changes of their target genes in naive and primed PSCs (Fig. 4f).
We next examined interactions between promoters and Genes that interact with enhancers only in naive PSCs include
enhancer elements other than SEs (Fig. 4d). Of the gene RRAD and YPEL2, and in primed PSCs this gene set includes
6 NATURE COMMUNICATIONS | (2021)12:2098 | https://doi.org/10.1038/s41467-021-22201-4 | www.nature.com/naturecommunications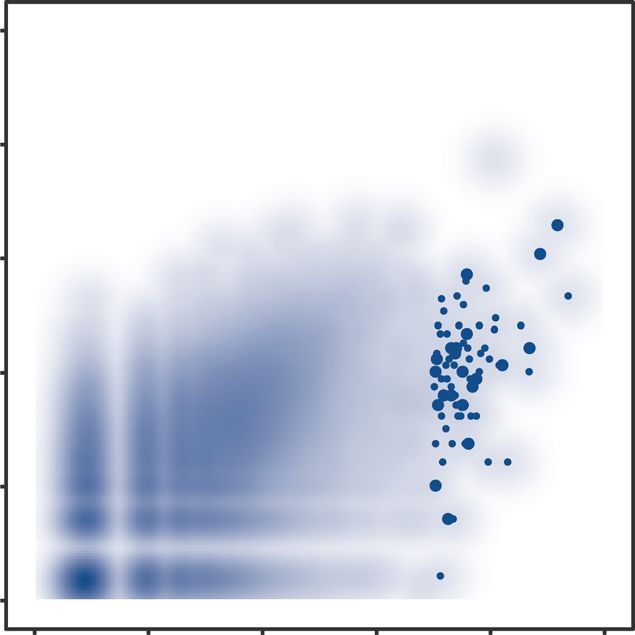
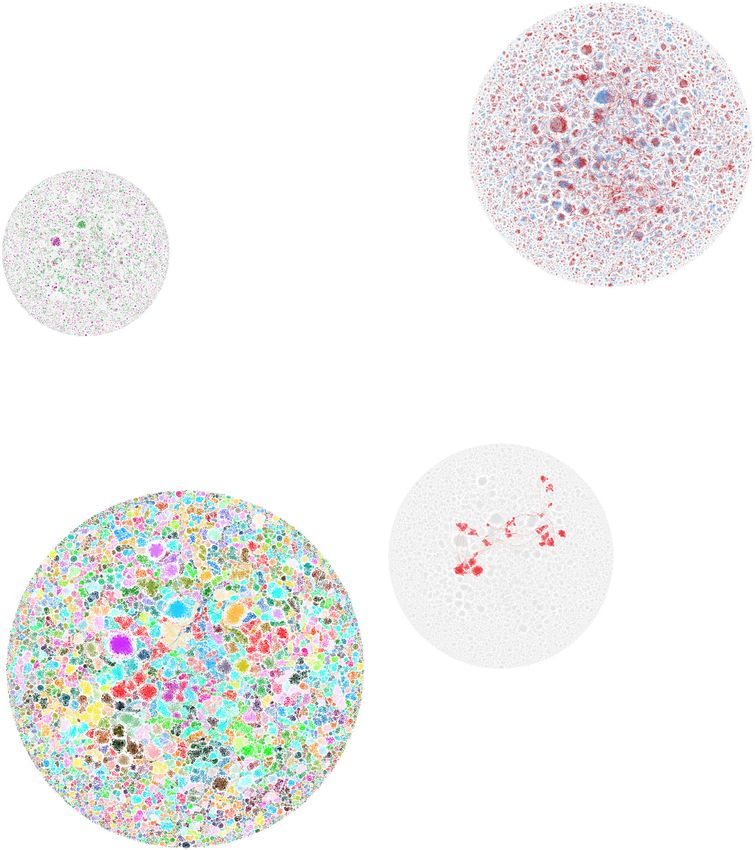
NATURE COMMUNICATIONS | https://doi.org/10.1038/s41467-021-22201-4                                                                      ARTICLE

Fig. 2 Long-range promoter interactions in primed PSCs drive genome conformation changes between pluripotent states. a Plot shows the number of
interactions (edges) and the number of interacting HindIII fragments (nodes) for each sub-network in naive and primed PSCs. Each small circle represents a
different, individual sub-network. The lower-left quadrant reveals sub-networks that are larger in primed PSCs, and the upper-right quadrant shows the
small number of sub-networks that are larger in naive PSCs. The protocadherin (PCDH), histone H1 (HISTH1) and ‘most changing’ (containing diverse
genes) sub-networks are highlighted in red. b Multidimensional scaling representation (MDS) of the ‘most changing’ sub-network plotted using the linear
genomic distance between nodes as edge weights. The measured stress score of 0.139 indicates there is a reasonable fit between the linear genomic
distances and the spacing of the nodes as determined by MDS111. c Plot shows the distribution of linear genomic distances between interacting nodes in
naive and primed PSCs, binned into long-, mid-, and short-range distances (n = 1000). The box bounds the interquartile range (IQR) divided by the median
(horizontal line), and Tukey-style whiskers extend to a maximum of 1.5 × IQR beyond the box. Circles indicate individual outliers. d Plot shows the total
number of long-range chromatin interactions identified on all chromosomes in naive and primed PSCs. e Hi-C interaction matrix of chromosome 5 at a
resolution of 250 kb with Knight–Ruiz (KR) normalisation; upper right, naive PSCs; lower left, primed PSCs. Areas of contact enrichment were defined
separately for naive and primed PSCs using HiCCUPS and each cell-type-specific set of chromatin interactions are highlighted as a black square on their
respective heatmap. The two corner numbers indicate the maximum intensity values for the matrix. The tracks below the Hi-C heatmap show the PCHi-C
interactions and CHiCAGO scores over the same region. f Heatmap shows the aggregate peak analysis (250 kb resolution) of all naive and primed
chromatin interactions genome-wide for naive and primed PSCs. Chromatin interactions >5 Mb from the diagonal were used for the analysis. The ‘peak to
lower left’ (P2LL) score denotes the enrichment of the central pixel over the pixels in the lower left quadrant.

DUSP6 and OTX2. Given the differences in the transcriptional                    median DNA methylation levels). In primed PSCs, however, only
activity and regulatory control of the identified genes, this                    primed-specific and shared enhancer categories showed lower
integrated dataset uncovers factors that could have important cell              DNA methylation than background (by >10%), suggesting that
type-specific functions.                                                         these regions are protected to some extent from global events
   The resultant dataset uncovered changes in promoter–enhancer                 (Fig. 5a). Examination of histone ChIP-seq data confirmed the
interactions that occur between naive and primed PSCs, thereby                  expected reduction in H3K27ac and H3K4me1 levels at naive-
revealing insights into gene regulatory control of human pluripo-               specific active enhancers when comparing between naive and
tency. For example, DPPA5 is highly transcribed in naive PSCs and               primed PSCs (Fig. 5b, log2 fold-change of median >1). Overall,
the promoter interacts with SEs that are marked by high levels of               naive-specific active enhancers did not gain H3K9me3 or
H3K27ac and H3K4me1 (Fig. 4g). In contrast, in primed PSCs, this                H3K27me3 in primed PSCs (log2 fold-change of median  0) and H3K4me1 signals (98%)
(Fig. 5a 22,53). In naive PSCs, all enhancer categories were, overall,          and open ATAC-seq regions (84%, Supplementary Fig. 9a). A
less methylated compared to background (>10% difference in                      small subset of OSN regions was also positive for H3K4me3 (12%)

NATURE COMMUNICATIONS | (2021)12:2098 | https://doi.org/10.1038/s41467-021-22201-4 | www.nature.com/naturecommunications                                7
ARTICLE NATURE COMMUNICATIONS | https://doi.org/10.1038/s41467-021-22201-4
a c
Top 1000 longest Top 1000 longest PAX9 DMRTA2
interactions Naïve interactions Primed FOXG1 FOXD2 GSX2
Naïve Primed Primed Naïve NKX2.1 CDKN2C MSX1
NKX2.8 HOXD TAL1 NEUROG2
Background Active
NKX2.3
Top 1000 LRI NKX6.1 PITX2
No interaction Primed PSCs PAX2 GPET3
TLX1 HMX1
PHOX2B LBX1
LIMCH1
VAX1
EMX2
Active
EN2
MNX1
SHH
HOXB
Bivalent PAX6
RNC1
Background
WT1
ALX4
DBX1
SLC5A5
ChromHMM SLC17A6
states
Active
Mixed
Background
Bivalent
Mixed
Heterochromatin PAX1
Mixed NKX2.2
Polycomb repressed NKX2.4
H3K4me1 OTP
EBF1 FOXA2
HOXC HOXA INSM1
Pr
D
PI mo
D
Pr
PI o
D
Pr
PI mo
Pr
PI mo
D
AP3B1
is
is
is
is
R te
R te
R te
R te
o
o
o
om
ta
ta
ta
ta
nc
nc
nc
nc
e
e
e
e
r(
r(
r(
r(
Naïve PSCs
ba
ba
ba
ba
it)
it)
it)
it)
b
Naïve PSCs Primed PSCs
Bivalent
[12%]
Polycomb
Repressed
[9%]
Active Bivalent
[21%] [100%]
Background
[16%]
H3K4me1
[8%]
Heterochromatin
Repressed Polycomb
[2%] Repressed
[100%]
Mixed
[33%]
Unclassified
[0%]
d
chr7 q36.3
100kb 155.0M 156.0M 157.0M
HTR5A INSIG1 CNPY1 LOC389602 LOC285889 LMBR1 UBE3C PTPRN2
HTR5A-AS1 BLACE LOC100506302 LINC01006 NOM1 DNAJB6 PTPRN2
PAXIP1-AS1 INSIG1 RBM33 RNF32 NOM1 DNAJB6
LOC100286906 SHH RNF32 MNX1 LOC101927914
EN2 SHH MNX1-AS1
200
RNA-seq 0
Naïve PSCs
-200
40
H3K4me3
0
40
H3K27me3
0
ChromHMM
Promoter
interactions
200
RNA-seq 0
Primed PSCs
-200
40
H3K4me3 0
40
H3K27me3 0
ChromHMM
Promoter
interactions
while showing lower H3K4me1 (Supplementary Fig. 9a), sug- between OSN binding and enhancer activity. Similarly, nearly all
gesting that they have promoter activity. While still included in active enhancers showed OSN signal (Fig. 6b, c). These results
our OSN peak annotation, these regions have a comparatively demonstrate a remarkable overlap between OSN occupancy and
lower OSN signal (Supplementary Fig. 9a). Consistently, distal active enhancers in naive and primed PSCs.
OSN sites had higher OSN signal than those overlapping tran- Despite the strong associations between OSN binding
scriptional start sites (Supplementary Fig. 9b), reinforcing the link and active enhancers in both cell types, we found that only
8 NATURE COMMUNICATIONS | (2021)12:2098 | https://doi.org/10.1038/s41467-021-22201-4 | www.nature.com/naturecommunicationsNATURE COMMUNICATIONS | https://doi.org/10.1038/s41467-021-22201-4 ARTICLE
Fig. 3 Long-range promoter interactions are associated with bivalent chromatin in primed human PSCs. a Heatmaps show the chromatin states of the
promoters and promoter-interacting regions (PIRs) that are connected by the longest interactions in naive (left) and primed (right) PSCs. Each heatmap is
ordered and divided by the chromatin state of the promoter HindIII fragment. b Plot shows the chromatin states of HindIII fragments in naive PSCs that
transition into the bivalent or Polycomb-associated states in primed PSCs. The percentages shown are within each state. c Visualising all bivalent and
Polycomb-associated interactions on the network graph highlights several interaction clusters particularly in primed PSCs (upper) that contain many
developmental genes. The clusters, together with the interactions, are largely absent in naive PSCs (lower). d Genome browser view in naive (upper) and
primed (lower) PSCs of a ~2.5 Mb region that contains several developmental genes including EN2, SHH and MNX1. Significant promoter interactions are
shown as blue and red arcs. ChIP-seq (H3K4me3 and H3K27me3) and strand-specific RNA-seq tracks are shown. Chromatin states for each genomic
region were defined by ChromHMM46 using ChIP-seq data (active chromatin, light green; H3K4me1-only chromatin, dark green; bivalent chromatin,
orange; Polycomb-associated, red; heterochromatin, purple; background, grey).
one-quarter of active enhancers are shared between naive and of this was a region containing multiple histone H1 genes, which
primed PSCs (Supplementary Dataset 3). This unexpected unexpectedly had higher promoter interactivity and transcrip-
observation suggests there is a widespread remodelling of OSN tional output in naive PSCs. This finding is in line with a recent
occupancy and enhancer activity between naive and primed PSCs. proteomic study that reported a higher abundance of some his-
Furthermore, when OSN occupancy was lost during the tone H1 variants in naive compared to primed PSCs56. The
transition from a naive to a primed state, 74% (n = 4294) of all interaction cluster included sets of histone H1 genes that are
interactions at these sites were also lost, and when OSN was transcribed with cell cycle-dependent and -independent control,
gained, 86% (n = 247) of all interactions at these regions were which suggests that the difference in the chromatin organisation
gained (Fig. 6d; p < 0.0001; Chi-squared test). Enhancers that of this region between pluripotent states is likely to be driven by
either retained OSN binding or were not bound by OSN typically additional factors that act outside of the cell cycle. Given that the
retained or gained interactions (Fig. 6d), which is probably due to expression and regulation of individual H1 isoforms vary sub-
the higher number of OSN-bound enhancers in naive PSCs stantially between cell types and these properties are associated
(Supplementary Fig. 9a). closely with pluripotency, differentiation and development57,58, a
Given that OSN binds different active enhancers in each cell focused examination of histone H1 function in these cell types
type, we reasoned that OSN is likely to be recruited by cell-type- would be a promising future direction of research. More com-
specific factors. As a first look at this, we identified transcription monly though, we discovered that sub-networks tended to be
factor motifs that were significantly enriched at OSN sites in one larger and to contain a greater number of interactions in primed
cell type compared to the other. Few primed-specific candidate compared to naive PSCs. Examples of this included the proto-
factors were identified, however, our analysis uncovered several cadherin gene cluster, which encodes cell adhesion molecules that
transcription factors that were expressed in naive PSCs and whose are predominantly expressed in the neural lineage59. In neural
binding motif occurred more frequently at OSN sites in naive cells, active protocadherin gene promoters and enhancers are
compared to primed PSCs (Fig. 6e). These factors included KLF5, brought together by CTCF and cohesin-mediated DNA loops to
KLF16, SP transcription factors, TFAP2C and ZFX (Fig. 6e, f). By form an interaction hub60. Our results show that this hub begins
re-analysing ChIP-seq data55, we found that the naive-associated to pre-form during early development, potentially priming this
transcription factor TFAP2C was enriched (>3-fold) at OSN- region for coordinated activation upon neural development. A
bound regions in naive PSCs (Fig. 6g) and indeed ~20% of these recent study reported that during the transition from naive to
regions contained TFAP2C peaks. This percentage is just under primed PSCs there is a change in the chromatin signatures of the
the proportion of OSN-occupied sites in naive PSC that contain a clustered protocadherin gene locus leading to ‘pre-set’ patterns of
TFAP2C motif (~30%; Fig. 6f). TFAP2C signal was low at protocadherin gene expression61. Together with our findings,
primed-specific OSN sites in naive PSCs, which suggests that these studies imply a coordinated mechanism involving both gene
TFAP2C does not pre-bind to regions that later acquire OSN interactions and chromatin states that establishes protocadherin
occupancy in primed PSCs (Fig. 6g). Taken together, these results gene control during development. More generally, cell-specific
lead us to propose that combinations of transcription factors, changes in sub-network organisation may also provide opportu-
including TFAP2C but also others, could help to recruit the nities for transcriptional co-regulation and resilience to pertur-
shared pluripotency factors OSN to active enhancers in naive bation. Our study has identified a large cohort of networks that
PSCs. Overall, these findings uncover the widespread and global can now be systematically targeted to test these predictions.
reorganisation in enhancer activity, interactivity and OSN The aggregation of interaction hubs into larger networks in
binding that occurs during the transition between human primed PSCs was frequently associated with the acquisition of
pluripotent states. long-range interactions that bridged Polycomb-occupied regions.
These events created spatial networks connecting >600 cis-reg-
Discussion ulatory elements that control the transcription of developmental
We have generated high-resolution profiles of chromatin inter- regulators. Similar, smaller-scale, Polycomb-mediated networks
actions and enhancer states in naive and primed PSCs and have been described in serum-grown mouse PSCs33,34,62 and the
uncovered widespread rewiring particularly of large interaction prevalence of Polycomb-associated long-range interactions is
sub-networks and also of promoter–enhancer contacts that strongly reduced after mouse PSCs are transitioned to a naive
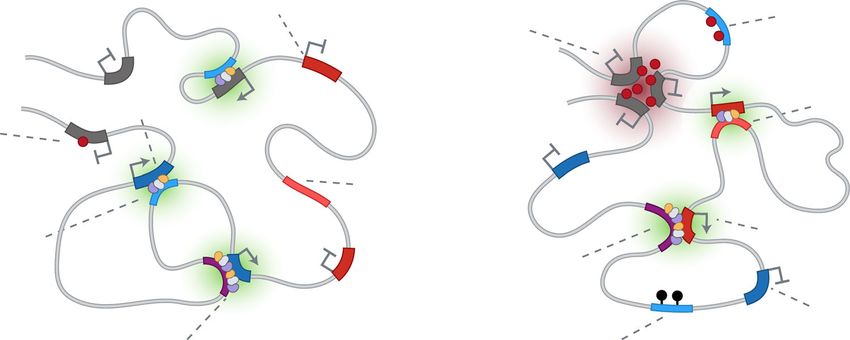
change between pluripotent cell types (Fig. 7). These findings state33. These changes have been attributed in mouse PSCs to the
together with the annotated chromatin interaction maps advance global redistribution of DNA methylation and H3K27me3 that
our understanding of the molecular control of gene regulation in occurs between primed and naive pluripotent states26,33,63. H3K4
pluripotency and in the earliest stages of human development. methyltransferases also orchestrate long-range interactions at
We found that interaction sub-networks that are formed of enhancers and bivalent promoters64,65, although whether they
large, highly connected hubs changed substantially in their show state-specific differences has not been examined. Preventing
interaction frequency and, for a subset, also in their transcrip- the redistribution of DNA methylation and H3K27me3 during
tional activity between pluripotent states. A prominent example the transition to a naive state is sufficient to block changes in
NATURE COMMUNICATIONS | (2021)12:2098 | https://doi.org/10.1038/s41467-021-22201-4 | www.nature.com/naturecommunications 9ARTICLE NATURE COMMUNICATIONS | https://doi.org/10.1038/s41467-021-22201-4
a Super-Enhancers b c p = 2.2e−16 p = 8.1e−07 p = 0.64
Genome DDX43 NFKB2 ACTB FGF2
10
Naïve SE/E
DEPTOR OLAH BCL2L1 JMJD1C
DPPA5 OOEP EIF4A2 KLF7
Gene expression (log2 FPKM)
Primed SE/E
GDF3 REST HNRNPK MAP7
800
HIST1H4F SUN3 ID1 SALL2
Number of super-enhancers
696 IL6 SUSD2 ILF2 TCF4 5
597 IL6ST TET1 LIN28B ZIC2
600 KHDC3L TRIM60 SPEN ZIC5
0
400
200 182 Naïve Shared Primed −5
641 170 290
62
0 n=641 n=290 n=170
ïve d-
ed d-
ïve
ed
na hare
are
Naïve Primed Naïve Primed Naïve Primed
im
Na
prim
Pr
Sh
PSC PSC PSC PSC PSC PSC
S
d e f
Enhancers
ALPPL2 CD9 DUSP6 p = 8.3e-06 p = 2.2e−16 p = 9.8e−14
CD7 DNMT1 HOOK1 10
FOLR1 DPPA4 ID3
GDF11 GAPDH NOTCH3
Gene expression (log2 FPKM)
4942
5000
4565 IL6R NCOA2 OTX2
RRAD TCF3 PODXL 5
Number of enhancers
4000
TBX3 TET3 SALL1
YPEL2 TFAP2C ZIC3
3124
3000
0
2000
1262
−5
1000
Naïve Shared Primed
1997 3023 1151
0
ïve d-
ed d-
ïve
ed
n=1997 n=1151 n=3023
−10
na hare
primare
im
Na
Naïve Primed Naïve Primed Naïve Primed
Pr
Sh
S
PSC PSC PSC PSC PSC PSC
CHD8
SALL2
F11R
TEP1
g ZNF219
ITLN2
NECTIN4
h CD229
Chr. 6
73330K 73350K 73360K 73370K 73380K 73390K 73400K 73410K 73420K
5kb
DPPA5 OOEP DDX43
refGene KHDC3L
5,900
RNA-seq 0
-5,900
30
H3K4me1
0
85
H3K4me3
0
30
H3K27me3
0
85
Naïve
H3K27ac
0
ROSE
150
OCT4
0
200
SOX2
0
500
NANOG
0
ChromHMM
ChromHMM HindIII
Baited HindIII fragments
DDX43
Interactions DPPA5
KHDC1
KHDC3L
OOEP
FZD5
MYLIP / Naïve SE/E
5,900
SH3GLB2 / Primed SE/E
RNA-seq 0
-5,900
TOMM7 / Shared SE/E
30
H3K4me1
0
85
H3K4me3
0
30
H3K27me3
0
85
Primed
H3K27ac
0
ROSE
150
OCT4
0
200
SOX2
0
500
NANOG
0
ChromHMM
ChromHMM HindIII
Baited HindIII fragments
Interactions
chromatin compaction at several exemplar regions, thereby observations collectively imply that the stable transition from a
directly linking epigenome remodelling with aspects of genome naive to a primed state of pluripotency requires the reconfi-
organisation66. The transcriptome and cell state of mouse and guration of DNA interactions to provide a coordinated set of
human naive PSCs are largely unaffected by experimentally dis- ‘poised’ regulatory signals to control promoter priming.
rupting Polycomb levels67–70. In contrast, primed PSCs are A clear difference between human pluripotent cell types that
sensitive to the removal of Polycomb proteins67,70–72. These we observed was in enhancer interactivity and activity state, and
10 NATURE COMMUNICATIONS | (2021)12:2098 | https://doi.org/10.1038/s41467-021-22201-4 | www.nature.com/naturecommunicationsNATURE COMMUNICATIONS | https://doi.org/10.1038/s41467-021-22201-4 ARTICLE
Fig. 4 Dynamics of enhancer activity and interactivity between human pluripotent states. a Plot showing the number of ROSE-called SEs in naive and
primed PSCs. As illustrated in the diagram, two values are given for shared SEs because a SE in one cell type may overlap with two individually called SEs in
the other cell type. b Diagram showing the number of genes that are contacted by SEs in the two pluripotent cell types. Shared genes (orange) are genes
that are contacted by SE elements in both naive and primed PSCs. Naive-specific genes (blue) and primed-specific genes (red) are contacted by SEs in
either naive or primed PSCs, respectively. c Plots showing the log2 FPKM expression of genes that interact with SEs in each cell type (naive, n = 641 genes;
primed, n = 290 genes; shared, n = 170 genes). The inner box bounds the IQR divided by the median (horizontal line), and Spear-style whiskers extend to
the minimum and maximum of the data values. P-values are derived from a two-sided Mann–Whitney U test; n = 3 biologically independent RNA-seq
datasets per cell type. d Plot showing the distribution of ROSE-called enhancers in naive and primed PSCs. e Diagram showing the number of genes that are
contacted by enhancers in the two pluripotent cell types. Genes that are also in contact with a SE have been removed from this list of enhancer-interacting
genes. f Plots showing the log2 FPKM expression of genes that interact with enhancer elements in each cell type (naive, n = 1997 genes; primed, n = 1151
genes; shared, n = 3023 genes). The inner box bounds the IQR divided by the median (horizontal line), and Spear-style whiskers extend to the minimum
and maximum of the data values. P-values are derived from a two-sided Mann–Whitney U test; n = 3 biologically independent RNA-seq datasets per cell
type. g Genome browser view of the DPPA5 promoter interactomes in naive (upper) and primed (lower) PSCs. Significant interactions are shown as blue
arcs that connect the baited HindIII fragment containing the DPPA5 promoter with promoter-interacting regions. ChIP-seq (H3K4me1, H3K4me3,
H3K27me3, H3K27ac, OCT4, SOX2 and NANOG) and strand-specific RNA-seq tracks are shown. Chromatin states include active chromatin, light green;
H3K4me1-only chromatin, dark green; bivalent chromatin, purple; background, grey. ROSE tracks show the location of enhancers (green) and super-
enhancers (red), and OSN tracks show the position of shared (orange) and naive-specific (blue) regions of OSN occupancy. h Network graph showing the
locations and cell type-origin of enhancer and SE elements. Colours depict naive-specific (blue), primed-specific (red) and shared (orange) enhancer and
SE elements. Node size represents SE (large nodes) and enhancers (small nodes). Lines represent interactions and are coloured according to the colour of
the node of origin.
a b
H3K27ac H3K27me3 H3K4me1 H3K9me3
100
4 4 4 4
75
% DNA methylation
log2 RPM
50 0 0 0 0
Naïve PSC enhancers
Primed PSC enhancers
25 Shared enhancers
-4 -4 -4 -4
Shared background
0
Naïve Primed Naïve Primed Naïve Primed Naïve Primed Naïve Primed
PSC PSC PSC PSC PSC PSC PSC PSC PSC PSC
c d
6 DNA methylation of naïve PSC specific enhancers
Naïve PSC H3K27me3 signal (log2 RPM)
100
4
75
% DNA methylation
TFAP2A
2 GATA6
GATA2
GATA3
ZIC4
GBX2
TLX1 NEUROG1 50
0 TFAP2A
WNT3 TFAP2B
MNX1
Naïve PSC specific enhancers:
TFAP2A HNFAG
GATA3 NEUROG1 H3K27me3 in primed PSCs
WNT10A no H3K27me3 in primed PSCs
25
−2 PAX5
VENTX
−4 0
−4 −2 0 2 4 6 Naïve PSCs Primed PSCs
Primed PSC H3K27me3 signal (log2 RPM)
Fig. 5 Naive-specific active enhancers are decommissioned predominantly by DNA methylation. a, b Plots show the a percent DNA methylation or
b histone modification levels in naive and primed PSCs at shared (n = 23,371) and cell type-specific active enhancers (naive, n = 26,134; primed, n =
36,759). Regions that are in the background chromatin state in both cell types are shown to indicate genome-wide levels (n = 69,685). c Smoothed scatter
plot shows H3K27me3 levels at naive-specific enhancer regions in both pluripotent states. Enhancers that gain H3K27me3 in primed PSCs are highlighted
and annotated with their nearest gene. d Violin plot shows the per cent DNA methylation of two classes of naive-specific enhancers depending on whether
those regions gain (maroon) or do not gain (green) H3K27me3 after the transition to a primed state. Naive-specific enhancers that acquire H3K27me3 are
protected from DNA hypermethylation.
NATURE COMMUNICATIONS | (2021)12:2098 | https://doi.org/10.1038/s41467-021-22201-4 | www.nature.com/naturecommunications 11ARTICLE NATURE COMMUNICATIONS | https://doi.org/10.1038/s41467-021-22201-4
Active enhancers
a b Active enhancers c Bivalent enhancers
Bivalent enhancers
OSN occupancy Naïve PSCs Inactive enhancers Primed PSCs Inactive enhancers
Background
Percent H3K27ac OCT4 SOX2 NANOG H3K27ac OCT4 SOX2 NANOG
Heterochromatin 6 3 4 6 4 3 1 4
Polycomb only 80 4 2 3 3 2 3
4
60 2 2 0.5 2
Mixed 2 1 1 2 1 1 1
40
Poised enhancers 20 0 0 0 0 0 0 0 0
Inactive enhancers
Active
Active
Active promoters
enhancers
Active enhancers
N
Pr e s
N ed red
Pr e s are
N ed cifi
Pr e r ec
aï
aï sh
aï s c
im an ific
im ha
im pe d
v
v
v p
ed do
ra m
nd Bivalent
om enhancers
d
Lost (5770)
Inactive
Gained (289) enhancers
OSN
Retained (848)
None (15907)
Lo
G
R
et
ai
st
ne
ai
0 1
(1
ne
d
15
d
(7
22
(3
49
80
)
0)
2)
Enhancer interaction
-2Kb 0 2Kb -2Kb 0 2Kb -2Kb 0 2Kb -2Kb 0 2Kb
-2Kb 0 2Kb -2Kb 0 2Kb -2Kb 0 2Kb -2Kb 0 2Kb
0 2 4 0 1 2 3 0 0.4 0.8 0 0.8 1.6
0 2 4 0 2 4 6 0 0.8 1.6 0 3 6
e f TF motif enrichment g
% of enhancer peaks with TF motif
50 Naïve PSCs
Motif Logo p-value 3
Fold enrichment
Primed PSCs TFAP2C
CREB1 5.72 x 10
-12 40
OSN naïve
2
OSN shared
KLF16 4.35 x 10
-12 30 OSN primed
Random
-16
KLF5 3.60 x 10 20
1
-14
SP1 8.25 x 10 10 OSN peak
centre
-18
SP2 2.91 x 10 0
SP3 -16 1 6 F5 1 2 3 8 2C ZFX
1.48 x 10 EB F1 KL SP SP SP SP AP
CR KL TF
-15
SP8 3.92 x 10
-15
TFAP2C (var.2) 7.36 x 10
-18
ZFX 3.74 x 10
Fig. 6 Widespread reorganisation of OCT4, SOX2 and NANOG binding at enhancers occurs between human pluripotent states. a Heatmap shows the
percentage of OSN sites that fall within each of the ChromHMM-defined chromatin states. Columns 1 and 2 indicate OSN sites that are common to both
naive and primed PSCs; columns 3 and 4 are OSN sites that are specific to either naive or primed PSCs; columns 5 and 6 represent random regions that do
not contain OSN sites. b, c ChIP-seq data for H3K27ac, OCT4, SOX2 and NANOG in b naive and c primed PSCs. Metaplots (upper) and heatmaps (lower)
show normalised ChIP-seq read counts within a 4 kb peak-centred window. Regions were subsetted into active enhancers (naive, n = 43,966; primed, n =
54,633), bivalent enhancers (naive, n = 1,998; primed, n = 5,502) and inactive enhancers (naive, n = 117,609; primed, n = 127,146) based on ChromHMM-
defined chromatin states, and ranked by H3K27ac signal. d Heatmap shows the log2 odds ratio for the associated changes in OSN occupancy and
promoter–enhancer interactions in primed compared to naive PSCs. e Table shows the highest-ranking (by adjusted P-value, one-tailed Fisher’s exact test)
transcription factor motifs that are enriched at OSN sites in naive compared to primed PSCs. Four motifs associated with transcription factors that are not
expressed in naive PSCs (log2 RPKM < 0) were removed from the list: KLF1, NR2F1, ZNF354C and VDR. f Bar chart shows the percentage of OSN-bound
enhancers that contain each of the identified transcription factor motifs in naive and primed PSCs. g Enrichment of TFAP2C ChIP-seq signal across OSN
peaks and the 2 kb up- and downstream regions.
these differences were associated with the widespread reorgani- fewer differences in OCT4 and NANOG occupancy compared to
sation of transcription factor binding (Fig. 7). The shared factors primed PSCs73. Our results suggest that there is a substantial
OCT4, SOX2 and NANOG bound predominantly to active reorganisation of gene regulatory elements between human
enhancers in both pluripotent states. There was, however, a pluripotent states. In mouse PSCs, enhancer activation, SE
remarkable lack of overlap in OSN-occupied enhancers between interactions and OSN occupancy are also dynamic between
naive and primed PSCs. The remodelling of OSN binding is likely pluripotent states69,74–76 and these processes are modulated by
to occur at a late stage of primed to naive PSC resetting because the presence of other state-specific transcription factors such as
PSCs that are only partially reset towards the naive state show far ESRRB in naive cells and OTX2 and GRHL2 in primed
12 NATURE COMMUNICATIONS | (2021)12:2098 | https://doi.org/10.1038/s41467-021-22201-4 | www.nature.com/naturecommunicationsYou can also read