West Coast Regional Transport Efficiency - Draft Indicative Business Case (to Options Framework stage) - Local Government ...
←
→
Page content transcription
If your browser does not render page correctly, please read the page content below
West Coast
Regional
Transport
Efficiency
Draft Indicative
Business Case
(to Options Framework
stage)

                        February 2016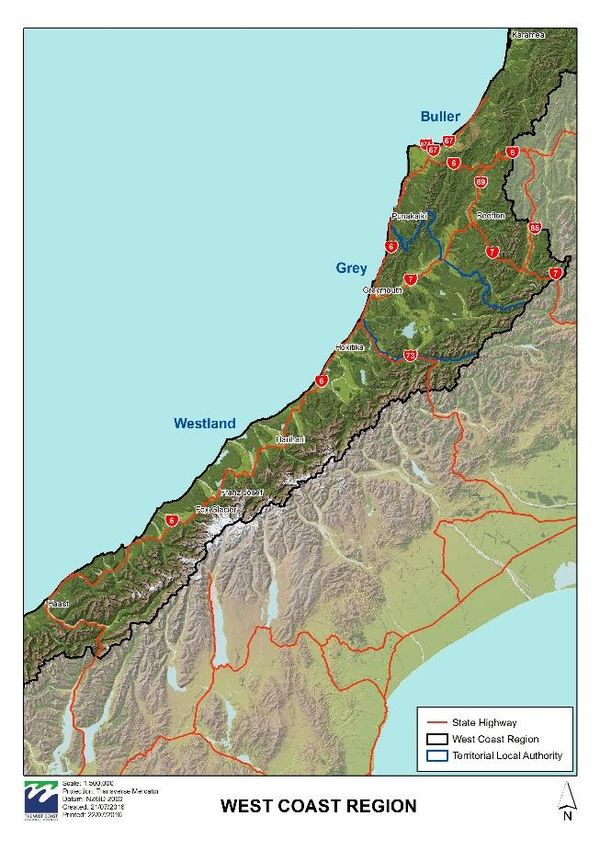
Document Title:
                                West Coast Regional Transport Efficiency:
                      Draft Indicative Business Case (to Options Framework stage)
 West Coast Regional Transport Efficiency:                                         Draft Indicative Business
                              Case (to Options Framework stage)
                                                 Prepared for:
                                  LOCAL GOVERNMENT COMMISSION

                                       Quality Assurance Statement
 Rationale Limited             Project Manager:              Edward Guy
 5 Arrow Lane                  Prepared by:                  Cheryl Steiner / Gavin Flynn
 PO Box 226                    Reviewed by:                  Edward Guy
 Arrowtown 9351                Approved for issue by:        Edward Guy
 Phone: +64 3 442 1156         Job number:                   J000528

                                         Document Control History
 Rev No.     Date              Revision Details      Prepared by              Reviewed by        Approved by
 1.0         08 Jul 2016       Initial Draft            CS/GF                   TL/NC

 1.1         28 Jul 2016       Draft                         CS/GF               TL/NC
 2.0         05 Aug 2016       Draft for comment             CS/GF               TL/NC                 TL

 3.0         16 Aug 2016       Draft following LGC               GF                TL                  TL
                               feedback
 4.0         14 Oct 2016       Draft following West              GF                EG                  EG
                               Coast councils’
                               feedback
 5.0         14 Nov 2016       Final issue to Client             GF                EG                 EG

                                              Current Version
 Rev No.      Date              Revision Details       Prepared by             Reviewed by        Approved by
 6.0          7 Feb 2017        Final with Foreword         GF                     EG                 EG

File path: https://rationaleltd.sharepoint.com/Shared Documents1/Clients/DIA/West Coast Report on Roading/5 Draft
Report/Draft Indicative Business Case - West Coast Roading Arrangements v3.docx
Contents
Foreword ................................................................................................................................................ 1
Executive Summary .............................................................................................................................. 3
       Purpose .......................................................................................................................................... 7
       Introduction ................................................................................................................................... 8
       Strategic Context .......................................................................................................................... 9
3.1 Organisational overview .................................................................................................................. 9
3.2 Strategic Drivers ............................................................................................................................ 12
3.3 Alignment to existing strategies .................................................................................................... 15
3.4 Existing collaborations .................................................................................................................. 17
       Case for Change .......................................................................................................................... 19
4.1 West Coast overview .................................................................................................................... 19
4.2 Efficiency benchmarking ............................................................................................................... 20
4.3 Issue Identification ........................................................................................................................ 22
4.4 Defining the problems ................................................................................................................... 25
4.5 Support for considering options for improvement ......................................................................... 25
       Investment Objectives ................................................................................................................ 26
5.1 Defining the benefits of change .................................................................................................... 26
5.2 Existing arrangements and future business needs ....................................................................... 28
       Scope and Service Solution Options ........................................................................................ 32
       Defining the Option ..................................................................................................................... 39
       Options Assessment Process ................................................................................................... 40
8.1 Establish Assessment Criteria ...................................................................................................... 40
8.2 Apply Assessment Criteria ............................................................................................................ 40
       Next Steps .................................................................................................................................... 41
Appendix 1: Business Case Framework ........................................................................................... 43
Appendix 2: Household Income and Industry Statistics ................................................................ 45
Appendix 3: Investment Logic Map process .................................................................................... 46
Appendix 4: Key Stakeholders .......................................................................................................... 49
Appendix 5: NZTA High Productivity Freight Network and proposed upgrades ......................... 50
Appendix 6: Scope and Service Solution Options Key Advantages / Disadvantages (West Coast
context) ................................................................................................................................................ 51
Appendix 7: Defining the Options ..................................................................................................... 53
Appendix 8: Strategic Options Assessment Worksheet ................................................................. 56
West Coast Regional Transport Efficiency:
                                                       Draft Indicative Business Case (to Options Framework stage)

Foreword
The Local Government Commission and the West Coast councils are pleased to release this report on
options for strengthening transport arrangements in the West Coast region. The report was prepared
by Rationale after discussions with local government, the New Zealand Transport Agency, iwi,
stakeholders and service providers.
The report arose from the Local Government Commission’s offer to assist the West Coast councils with
actions in their Commitment to Regional Efficiency work programme. This work programme identified
several services currently being delivered individually by each council with the aim of investigating
whether there were any efficiencies to be gained by combining these services regionally. The West
Coast councils and the Local Government Commission identified two of the services, transport
arrangements and Resource Management Act services, as priority areas for joint work on possible
options. A separate report has been prepared on Resource Management Act services.
This report identifies the current challenges and opportunities for delivering cost effective and efficient
transport arrangements in the West Coast region, together with a list of possible options for change.
This is an opportunity to build on the collaboration already occurring across several areas, including the
Regional Transport Committee, joint tender evaluation for roading contracts and joint funding for the
Road Safety Promotion and Education contract.
The next step is for the councils, together with the Commission, to decide whether further work on a
potential option or options should be done. Increasing the amount of collaboration in this area is a
potential way of improving on the status quo and bringing about better services to benefit West Coast
residents, ratepayers and businesses.
The Local Government Commission looks forward to continuing to work with the West Coast councils
as we further develop our thinking about the best approach for transport arrangements on the West
Coast.
Finally, our thanks go to all those who made themselves available to talk to Rationale in the
development of this report.

  Dr Suzanne Doig
  Chief Executive Officer
  Local Government Commission

 LOCAL GOVERNMENT COMMISSION                                                                  Final with Foreword
                                                                         7 Feb 2017      REV 6.0           Page 1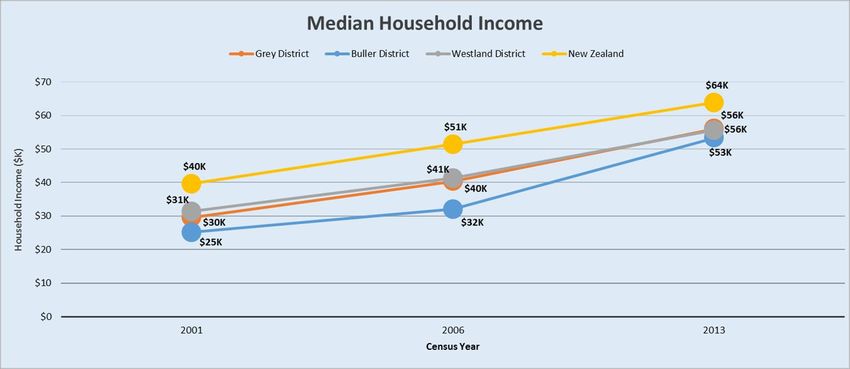
West Coast Regional Transport Efficiency:
                                                Draft Indicative Business Case (to Options Framework stage)

Acronyms

BBC        Better Business Case               MoU             Memorandum of Understanding
BDC        Buller District Council            NOC             Network Outcome Contract
CCO        Council Controlled Organisation    NLTP            National Land Transport Plan
DOC        Department of Conservation         NZTA            NZ Transport Agency
FAR        Financial Assistance Rate          ONRC            One Network Road Classification
FTE        Full Time Equivalents              RLTP            Regional Land Transport Plan
GDC        Grey District Council              RTP             Regional Transport Committee
GPS        Government Policy Statement on     RCA             Road Controlling Authority
           Land Transport

HNO        NZTA Highway Network Operation     REG             Road Efficiency Group
HPMV       High Productivity Motor Vehicles   RTAG            Road Technical Advisory Group
ILM        Investment Logic Mapping           SH              State Highway
KPI        Key Performance Indicators         TLA             Territorial Local Authority
LoS        Level of Service                   WCRC            West Coast Regional Council
LG Act     Local Government Act               WDC             Westland District Council
LGNZ       Local Government NZ                50 max          50 tonnage maximum load vehicles

LOCAL GOVERNMENT COMMISSION                                                            Final with Foreword
                                                                  7 Feb 2017      REV 6.0           Page 2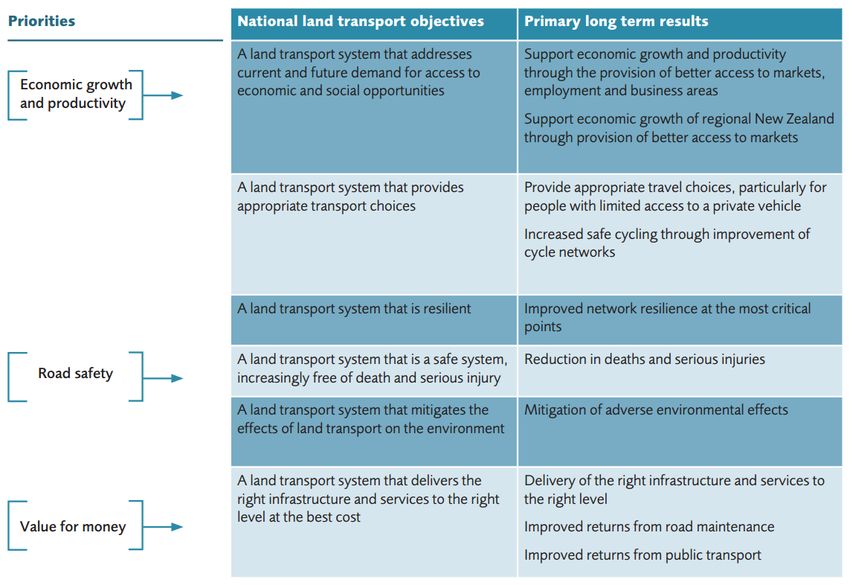
West Coast Regional Transport Efficiency:
Draft Indicative Business Case (to Options Framework stage)
Executive Summary
In April 2015, West Coast Regional Council, Westland District Council, Grey District Council, and Buller
District Council and the Local Government Commission signed a memorandum of understanding (MoU)
seeking to introduce positive change, as evidenced by their Commitment to Regional Efficiency. The
first tranche of this commitment is to explore regional efficiencies in roading arrangements and
Resource Management Act functions. These areas represent commonality across the councils and the
potential for significant gains to be made in how these services are delivered. The New Zealand
Transport Agency, whilst not being a signatory to the MoU, is supportive of the process.
This report considers roading arrangements for local roads and state highways and uses the New
Zealand Treasury’s Better Business Case (BBC) process to understand the case for change could be
and the range of options for delivering efficient and cost effective roading for the region. While the initial
focus has been on roading arrangements, to maximise efficiency opportunities, the business case
widens the scope to include all transport-related functions.
The purpose of the report is to achieve a shared understanding of transport in the region in order that
a potential case for change can be developed. The report is intended to be used to inform discussion
between the West Coast councils and the Commission about how more efficient and cost effective
transport arrangements for the region could be delivered. Reflecting the requirements in the Terms of
Reference, this report does not provide any specific recommendations concerning the way forward.
The West Coast region extends over a distance of 600 kilometres with significant landscapes and
features that present both challenges and opportunities to the economic and social wellbeing of the
West Coast communities. Population decline, loss of industries, and significant exposure to natural
hazards and extreme climatic conditions create ongoing uncertainty and cost for the region.
One part of the challenge of dealing with a changing West Coast regional economy is an increasing
tourism sector being attracted to the experiences available in the large conservation estate. This is
shifting some of the expectations delivered by transport activities contributing to the need to review
service delivery.
Transport collaboration is already occurring across several areas including governance and decision-
making through the Regional Transport Committee, joint tender evaluation for roading contracts, and
joint funding for the Road Safety Promotion and Education contract. National transport initiatives
through the ‘Top of the South’ Regional Efficiency Group such as the One Network Road Classification
are also being explored.
An extensive partner, stakeholder, customer and user engagement process has been undertaken to
gauge the issues and opportunities, with workshops using BBC methodology to agree on the main
problems and benefits being sought.
The case for further change to the current arrangements is influenced significantly by the following:
The environmental challenges of the West Coast and the need to increase the resilience of the
transport network.
The proposed changes to the Funding Assistance Rate for maintenance and improvements
and for the Special Purpose Roads in Westland and Buller.
Increasing national expectations for greater collaboration and better business case
development to support investment in transport outcomes.
The inherent inefficiencies with a roading network that was not designed for large freight load
and movement requirements, and on which High Productivity Motor Vehicles (HPMV) routes
are requiring substantial upgrades.
Development of problem statements and investment objectives with key stakeholders overwhelmingly
identified resilience of the network as the biggest issue and potential biggest gain that could be
achieved from greater collaboration.
LOCAL GOVERNMENT COMMISSION Final with Foreword
7 Feb 2017 REV 6.0 Page 3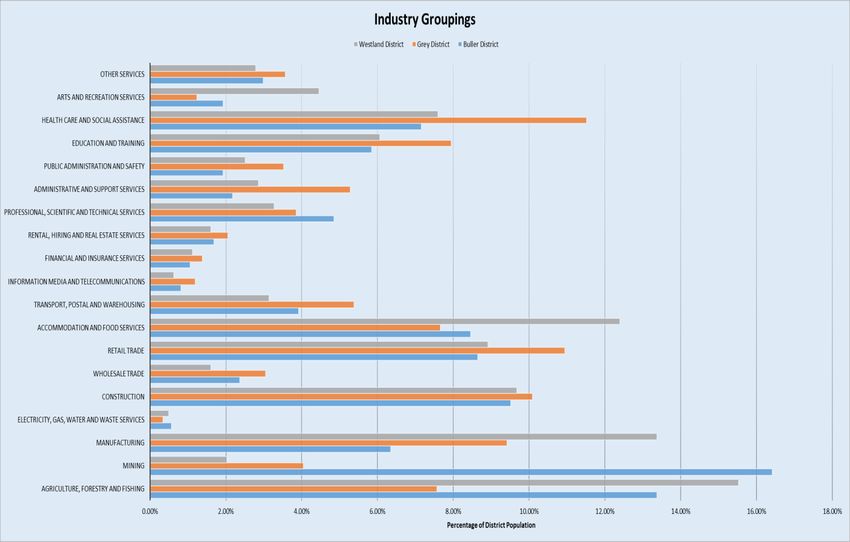
West Coast Regional Transport Efficiency:
                                                        Draft Indicative Business Case (to Options Framework stage)

The problem statements are outlined below with scoring percentages emphasising the weight
associated with each statement.

  Problem One: Isolation, natural hazards and poor communications impact on journey reliability,
  safety, response times and customer experience. (40%)
  Problem Two: The transport system, amenities and communications have not kept up with
  tourism growth, compromising experience and safety. (25%)
  Problem Three: Available skills, training, succession and investment, limits the value for money
  gains available through technology, asset management and specialist decision-making. (20%)
  Problem Four: Assets are ageing, lack resilience, do not meet customer needs nor provide
  confidence, meaning opportunities for the West Coast are potentially missed. (15%)

By addressing these problems, the following benefits are expected;

  Benefit One:     Improved journey reliability, resilience and safety. (40%)
  Benefit Two:     Improved tourism and customer experience. (25%)
  Benefit Three: Improved capability and capacity. (20%)
  Benefit Four: An efficient and cost effective freight network. (15%)

The options for change traverse all aspects of the transport function and explore a range of collaboration
approaches, many of which can build on learnings from other similar models delivered in regions across
New Zealand.
The six options are as follows:
    1. Road Technical Advisory Group - status quo and already established.
    2. Transport Asset Manager Group – addition of joint programmes and joint procurement
       processes operating under a more formalised meetings and terms of reference framework.
    3. ‘Transport centre of excellence’ - a semi-formal arrangement whereby Councils collaborate and
       share resources on identified priority areas guided by an MoU.
    4. Shared Services - a professional services business unit combining internal and external
       expertise, which may be undertaken by one Council, or a combination, with the option to
       procure certain disciplines with other service providers.
    5. Business Unit - A combined formal business unit for transport arrangements with co-location
       arrangements for some staff.
    6. One Agency - A formal separate entity established either under the Local Government Act or a
       separate entity such as a joint venture, that includes transport planning, management and
       operations.
Governance arrangements for options 1-4 would not require any significant change. Options 5-6 begin
to get more complex in terms of potential staff employment issues and would require more careful
consideration of governance arrangements such as whether there is a requirement to establish an
independent board.
The six options defined could be considered as cumulative, in that they provide the opportunity to build
on the outcomes of each previous option to create an evolutionary rather than revolutionary outcome.
The graphic below shows the possibilities of this continuum, building the trust and test/trial nature before
a more ambitious and permanent solution is settled on. The higher the levels of formal collaboration
going up the continuum the more likely that benefits identified will be attained. What potential scope
options and what the service solutions could be designed to deliver these, is compared in more detail
in Appendix 7.

 LOCAL GOVERNMENT COMMISSION                                                                   Final with Foreword
                                                                          7 Feb 2017      REV 6.0           Page 4
West Coast Regional Transport Efficiency:
Draft Indicative Business Case (to Options Framework stage)
NZTA Highway Network operations (HNO) have demonstrated a desire to participate in the future
arrangements with the West Coast local authorities. From previous experience, there are some
limitations to this including being part of a Council Controlled Organisation (CCO) or Combined
Business Unit. The limitations extend from the ‘centrally planned regionally delivered’ aspect of the
HNO’s business model. Essentially HNO wish to retain control of the decision making on their network.
There are examples where this need has been overcome including Gisborne’s Tairāwhiti Roads (shared
management), Marlborough Roads (HNO delegation), Northland Transportation Alliance (co-location)
and Westlink BOP (shared maintenance contract and management). All future options and optioneering
should consider the participation of NZTA HNO.
The advantages and disadvantages have been assessed and evaluation criteria have been suggested
to evaluate these options against the critical success factors of strategic fit and business needs,
potential value for money, capability and capacity, affordability and achievability using a multi criteria
template.
The template or tool breaks down the assessment into the following areas;
Delivery on benefits being sought
Cost
Time
Risks
Dis-benefits
Dependencies
Other benefits
LOCAL GOVERNMENT COMMISSION Final with Foreword
7 Feb 2017 REV 6.0 Page 5West Coast Regional Transport Efficiency:
Draft Indicative Business Case (to Options Framework stage)
It is recommended that the evaluation criteria and process outlined in this report, be further developed
and then applied to determine a short list of options or a preferred option that would then require further
assessment and detailed consideration using the Better Business Case process.
LOCAL GOVERNMENT COMMISSION Final with Foreword
7 Feb 2017 REV 6.0 Page 6West Coast Regional Transport Efficiency:
Draft Indicative Business Case (to Options Framework stage)
Purpose
This Indicative Business Case is the first stage of a process to assess possible options for improved
efficiency and effectiveness of transportation services in the West Coast Region.
The principal objective of this first stage is to establish and document the range of options available
and set out the way forward for further analysis of those options.
To ensure the credibility and integrity of the outcomes, the methodology employed follows the general
principles of the Better Business Cases framework promoted by New Zealand Treasury. For this stage
of the process that means the report:
outlines the strategic context and fit of the proposed options
outlines the case for change and the need for investment of resources (time, effort, cost) to
achieve change
recommends an indicative way forward for further development of the business case;
supported by a full range of options that could be considered and a framework for evaluation.
provides an opportunity for all key stakeholders to understand the case for change and
potential responses to this, and
ensures that effort is focused on agreed options that could proceed to development of a
detailed business case.
In accordance with the terms of reference, this stage of the process specifically excludes ranking,
prioritisation or comparative analysis of the options. Such analysis will follow in a subsequent stage
should that be the preferred course of action of the key stakeholders.
For further information on the Business Case approach as it relates to this stage of the process refer to
Appendix 1.
LOCAL GOVERNMENT COMMISSION Final with Foreword
7 Feb 2017 REV 6.0 Page 7West Coast Regional Transport Efficiency:
Draft Indicative Business Case (to Options Framework stage)
Introduction
The West Coast Regional Council, Westland District Council, Grey District Council, and Buller District
Council (the Councils) are the local authorities with jurisdiction in the West Coast Region. New Zealand
Transport Agency (NZTA) has responsibilities for management of state highways as well as being the
funding agency for subsidised transportation activities.
The Councils have adopted a unified approach to improve the efficiency of local government service
delivery within the region. Collaborative projects are underway in a range of areas with the key goal of
achieving greater cost effectiveness and efficiency in the delivery of public services.
The Local Government Commission and the Councils have agreed to work together to identify the
potential for regional efficiencies for transport. This represents an area of local government expenditure
where there is commonality across the Councils. Experience across New Zealand indicates there is
potential for significant gains to ratepayers and businesses from reviewing how transport services are
delivered. While the initial focus has been on roading arrangements, to maximise efficiency
opportunities, the business case widens the scope to include all transport-related functions.
This indicative business case (to options framework stage) outlines the following:
Current transport arrangements for all aspects of the transport function.
Challenges and opportunities for delivery of efficient, cost effective and aligned transport.
Options for improving efficiency and cost effectiveness of transport.
Advantages and disadvantages of each option.
Evaluation criteria for assessing a preferred option (or options) for further investigation.
LOCAL GOVERNMENT COMMISSION Final with Foreword
7 Feb 2017 REV 6.0 Page 8West Coast Regional Transport Efficiency:
Draft Indicative Business Case (to Options Framework stage)
Strategic Context
The strategic context provides an overview of the transport outcomes that participants seek to achieve,
or contribute to, through their operation and management of the land transport system and networks.
3.1 Organisational overview
The West Coast Region has three district council boundaries. These, along with the state highway
network and main centres and towns, are shown in Figure 1.
Figure 1: West Coast Region
LOCAL GOVERNMENT COMMISSION Final with Foreword
7 Feb 2017 REV 6.0 Page 9West Coast Regional Transport Efficiency:
Draft Indicative Business Case (to Options Framework stage)
Table 1: Responsibilities of Transportation Agencies in the West Coast Region
Agency Role 2016/17
Programme Value
WCRC Responsible for coordinating safe, efficient, responsive and $166,870
sustainable transport systems through the Regional Land
Transport Plan (RLTP).
Co-ordinates the Regional Transport Committee consisting of
representatives of the TLAs and NZTA, which are responsible for
the development of the RLTP.
NZTA Delivers transport solutions on behalf of the government. $40,100,000
Responsible for planning the land transport network, providing
access to the land transport system, managing the state highway
network and co-investing in land transport with Territorial Local
Authorities.
TLAs Responsible for planning and managing land use development; $17,900,000
developing, maintaining and operating the local transport system
and network; and delivering transport solutions on behalf of the
respective council and community. TLA roles and specific issues
are discussed in more detail below.
3.1.1 Territorial Local Authorities
The three Territorial Local Authorities (TLAs) all operate traditional but relatively ‘lean’ structures in the
transportation area. In-house staff are supported on an as-needed basis by external consultant
resources. Transport staff also assist regulatory functions relating to or impacting on the road corridor
including approval of temporary traffic management plans, corridor access and High Productivity Motor
Vehicles (HPMV) permits. Resources for each council are detailed in Table 7 (Section 5.2).
Common themes from TLAs’ Long Term Plans and Annual Plans relevant to transport arrangements
include:
Affordability to ratepayers of building, operating and maintaining infrastructure assets.
Renewal or replacement costs for ageing bridge assets.
Needing to plan for and fund resilience responses.
Impact of natural hazards on infrastructure.
Impact of One Network Road Classification (ONRC) on levels of service and potential funding
implications of this.
Ability to strengthen bridges/roads to cater to HPMV and 50 max (50 tonnage maximum load
vehicles).
Impact of reductions in the Financial Assistance Rate (FAR) from NZTA, particularly about the
funding of Special Purpose Roads.
These themes are reflected further in the issues section of this report. Further information on the
Territorial Local Authorities transportation activities is summarised in Table 2. Appendix 2 provides
further background in the form of demographic information and key economic information about each
district. It should be noted that NZTA contributes between 57-63% transport funding assistance to
each West Coast council, with the remaining local share paid for by the District ratepayers.
LOCAL GOVERNMENT COMMISSION Final with Foreword
7 Feb 2017 REV 6.0 Page 10West Coast Regional Transport Efficiency: Draft Indicative Business Case (to Options Framework stage)
Table 2: Summary of key statistics for district councils
District 2013/2043 Land Area Size of roading 2016/17 Council focus for Transport Services Activity
(forecast) network Budget
population
Westland 8,304 / 8,244 11,880 km² 673 km Road $5.9 To ensure the safe, efficient and sustainable maintenance, operation,
million renewal and upgrading of roads and bridges, and to work in conjunction
269 Bridges
with other transportation agencies.
Buller 10,473 / 9,773 8,574 km2 604 km Roads $5.5 This activity recognises that a safe, efficient roading system is vital to
million Buller to assist in overcoming isolation, for health and safety, for
153 Bridges
communication, and to help promote development.
This activity recognises that access is important as it enables the
Grey 13,371 / 12,921 3,513 km2 610 km Roads $6.5 convenient movement of people and goods to places of work, trade,
million health services, education and recreation. Promotion of road safety is
212 Bridges also important to avoid damage to property, injury and deaths while
people are using land transport.
Key Issue: Change to Special Purpose Roads Status & Reduced Funding
Westland District: Haast Jackson Bay Road Special Purpose Road
The area of road between Haast and Jackson Bay was designated as a Special Purpose Road qualifying for 100% funding from NZTA. NZTA have notified
Westland District Council of the intention to reduce this funding to 58% in 2018/19 which will have a significant impact on the local share component or level of
service currently provided.
Buller District: Karamea Highway Special Purpose Road
The Karamea Special Purpose Road was previously state highway and was proposed to be transferred to Buller District Council management with 100% subsidy
from NZTA. The road provides a vital lifeline to the Karamea community, Heaphy Track terminus and takes daily dairy tanker traffic. NZTA have indicated that
the road may lose this designation and revert from 100% subsidy to 63%, with a three-year phase in period. This would add a considerable maintenance liability
to Buller District Council and could have a large impact on the general rate from year four of their Long-Term Plan.
LOCAL GOVERNMENT COMMISSION Final with Foreword
7 Feb 2017 REV 6.0 Page 11West Coast Regional Transport Efficiency:
Draft Indicative Business Case (to Options Framework stage)
3.2 Strategic Drivers
A range of strategic drivers at the national level are influencing change in local government and
transport sectors throughout New Zealand.
3.2.1 Local Government Act 2002
The Act seeks to ensure local government services are provided in the most cost effective way, and
encourages greater collaboration and cooperation to improve effectiveness and efficiency. Recent
additions to the legislation such as Section 17A require Councils to review service delivery with these
objectives in mind.
The October 2015 Cabinet paper ‘Local Government – better local services reforms’ scope
for consideration of changes is to drive:
regional economic growth and to encourage councils to improve their organisation
of functions and structures
more effective and efficient delivery of services and infrastructure.
The Local Government Act 2002 Amendment Bill (No 2) seeks to implement a set of reforms to enable
improved service delivery and infrastructure provision arrangements at the local government level. This
includes two ‘pre-approved’ regional and local Council Controlled Organisation models for transport,
and capacity for bespoke models to be developed subject to approval from the Ministry of Transport.
3.2.2 Land Transport Management Act 2003
The purpose of this Act is to contribute to an effective, efficient and safe land transport system in the
public interest. Amendments enacted in 2013 include replacement of Regional Land Transport
Strategies and Regional Land Transport Programmes into one single regional planning document, to
help streamline transport related planning information.
3.2.3 Government Policy Statement 2015/16 – 2024/25
The Government Policy Statement on Land Transport (GPS) continues the national drive for improved
performance and focuses on three priority areas: economic growth and productivity, road safety, and
value for money. National land transport objectives, and the results that these will deliver, are
summarised in Table 3.
LOCAL GOVERNMENT COMMISSION Final with Foreword
7 Feb 2017 REV 6.0 Page 12West Coast Regional Transport Efficiency:
Draft Indicative Business Case (to Options Framework stage)
Table 3: GPS Strategic priorities, national land transport objectives and primary long term results
3.2.4 National Requirements
Table 4 provides a summary of several national requirements that seek to achieve greater collaboration
and improved efficiencies and cost effectiveness:
Table 4: National Requirements Driving Change in Transportation
Driver of Change Description
ONRC The One Network Road Classification (ONRC) categorises all roads
based on their function and agreed customer levels of service for
each function. ONRC will make it easier for RCAs to collaborate, as
it provides a consistent framework to benchmark performance and to
develop shared strategies to deliver better value for money. RCAs
are currently implementing ONRC to inform the 2018-2021 Regional
Land Transport Plan. As the evidence grows, the ONRC and its
performance measures will enable RCAs to compare performance,
identifying varying levels of customer outcome. This may involve a
change in the existing levels of service and reallocation of
maintenance funding.
LOCAL GOVERNMENT COMMISSION Final with Foreword
7 Feb 2017 REV 6.0 Page 13West Coast Regional Transport Efficiency:
Draft Indicative Business Case (to Options Framework stage)
Driver of Change Description
Business Cases NZTA require that the Business Case approach must be used to
support all investment applications and asset management thinking.
There are higher expectations for development of better quality
evidence and rigorous analysis, and strengthened activity
management and asset management planning information. RCAs
will need to ensure they have the appropriate skills and expertise to
deliver to these standards. This will require a significant investment
in time, expertise and resources with the intended outcomes being
delivery of better ‘joined-up’ thinking and increased value for money.
National Infrastructure The New Zealand National Infrastructure Plan vision to 2045 is for
Plan our infrastructure to be resilient, coordinated and contribute to a
strong economy and high living standards. The plan classes the
required responses into three categories: strengthening asset
management practices, increasing understanding of levels of service
and future drivers of demand, and optimising decision making.
30yr Infrastructure Development of 30-year Infrastructure Strategy to outline the ‘most
Strategies likely scenario’ for the management of council infrastructure assets,
and identify significant issues, options and financial implications. It is
likely that there should be strong alignment between strategies of
adjacent networks that are subject to similar environmental and
developmental impacts.
Asset Management There is an increasing requirement to deliver improved planning and
Capability to support this with advanced asset management based on robust
evidence and analysis. Asset management capability and capacity
has been identified as a key issue throughout the country by several
bodies, including councils, Local Government New Zealand (LGNZ),
NZTA, the National Infrastructure Unit and the Office of the Auditor
General.
Regional Development LGNZ – Mobilising the Regions paper (September 2015), which
identifies that regional prosperity will be enhanced by transport
decision-makers applying consistent criteria across all modes, and
by local communities and regional leaders working with transport
decision-makers to highlight regional priorities and impacts. This
requires a strong and cohesive approach by all RCAs.
3.2.5 National Collaboration Models
Partly as a result of the drivers of change noted above, transport collaboration is becoming the norm
across New Zealand. There is no “one size fits all” with each area developing a model that is fit for
purpose and relevant to their local needs. Consideration of new ways of working spans the spectrum
of transport related functions from governance through to service delivery. There is an increasing
expectation that RCAs identify collaboration opportunities, taking into consideration learnings from
existing models in place across the country. Whilst none of the initiatives below are necessarily directly
applicable, they give some indication of what is happening elsewhere; and what might be achievable
for the West Coast.
LOCAL GOVERNMENT COMMISSION Final with Foreword
7 Feb 2017 REV 6.0 Page 14West Coast Regional Transport Efficiency:
Draft Indicative Business Case (to Options Framework stage)
Initiative Benefits
Waikato Road Asset Collaborative data asset management delivered $170,000 savings
Technical Accord to the participants in the first 12 months and achieved a much-
improved data collection and management approach.
Tairāwhiti Roads Shared Services Business Unit delivers $900,000 (6%) annual
maintenance cost savings to Gisborne District and $2,400,000
(21%) annual maintenance cost savings to NZTA through
collaborative contract model.
Mid/South Canterbury A range of collaborative procurement initiatives showed savings of
Region 10-15% at the tender box.
NZTA Network Outcome Improved procurement, economies of scale return savings of 15-
Contracts 20% in various examples across New Zealand.
Manawatu Aligned maintenance contract conditions and procurement
processes. Did not result in cheaper pricing, but participant councils
receiving more value for money through scale of contract allowing
contractor to respond with specialised resources on a regional
basis.
Marlborough Roads Local NZTA office known as Marlborough Roads provides
management of all local roads under a contractual arrangement
with Marlborough District Council, alongside their state highways
responsibilities. During the initial procurement of the maintenance
contacts there were considerable savings gained from reducing 11
contracts down to 4. At that time, Marlborough Roads contracts
achieved some of the lowest costs in the country for maintaining
state highways. This number was reduced to one combined
Network Outcomes Contract in 2013.
Northland Transportation Shared Services Business Unit for 3 TLAs with co-location and
Alliance collaboration of NZTA and regional council. Business Case
identifies potential economic benefits of $18-34 million plus over 10
years. Improved asset management and decision making,
increased capacity and capability through shared resources and
economies of scale.
3.3 Alignment to existing strategies
This section outlines existing strategies in place for the West Coast Region that must be considered in
the consideration of any new service delivery.
3.3.1 National Land Transport Programme 2015-2018 (for the West Coast region)
This programme includes the West Coast in the southern region along with Canterbury, Otago and
Southland. Safety and route resilience, particularly for freight and tourists, are identified as the greatest
challenges facing the southern region. The long travelling distances, terrain and climatic conditions all
impact significantly on the condition and use of the transport network. Investment in the West Coast
over the three-year period focuses on safety improvements (Taramakau Bridge replacement and visitor
safety initiatives) and improving the resilience of State Highway 6.
3.3.2 West Coast Regional Land Transport Plan 2015-2021
This plan is developed by the Regional Land Transport Committee as a requirement of the Land
Transport Management Act. The plan recognises the importance of collaborative relationships between
key stakeholders to achieve a safe, effective and efficient land transport network. Identified transport
priorities are:
LOCAL GOVERNMENT COMMISSION Final with Foreword
7 Feb 2017 REV 6.0 Page 15West Coast Regional Transport Efficiency:
Draft Indicative Business Case (to Options Framework stage)
A secure land transport network resilient enough to withstand the natural events the West Coast
is susceptible to.
Safety for increasing diverse user types on a constrained network.
A fit for purpose land transport network.
Much of the projects prioritised in the plan seek to enhance the resilience of the network and involve
several bridge replacement projects and construction of slow vehicle bays.
3.3.3 Draft South Island Freight Plan – July 2015
This plan has been prepared to help decision-makers improve their coordination and dialogue across
the South Island’s freight system. The plan recognises that most freight in the South Island is moved
by road, with a small percentage moved by rail, coastal shipping or air. This is forecast to continue and
will impact on planning and investment decisions for the transport network.
The West Coast region has the lowest freight task (tonnes of freight moved) in the South Island with a
slight increase forecast over the next 20 plus years 1. Most freight movement occurs within the region,
and to the east, accessing the domestic and international connections provided within the Canterbury
region. West Coast region specific actions from the draft plan are led by NZTA and focus on bridge
replacements and enhancing network resilience.
3.3.4 West Coast Regional Public Transport Plan 2015
The West Coast Regional Public Transport Plan 2015 (RPTP) sets out the Regional Council's intentions
regarding public transport for the West Coast over the next three years. It reflects the limited public
transport services available on the West Coast, which includes the Total Mobility scheme and the
financial assistance provided by the Buller and Westland District Councils to ensure the ongoing viability
of their local taxi services.
3.3.5 West Coast Regional Walking and Cycling Strategy 2009
Development of this strategy was overseen by a steering group made up of the three district councils,
West Coast Regional Council, NZTA, community and public health representatives. This document
aims to provide a framework that will guide local action to improve the environment for walking and
cycling in the region. The strategy recognises that the economic future of the region relies on strong
transport networks, and that walking and cycling are being increasingly considered as important choices
within this transport mix. The strategy sets the framework for future aspirations and recognises that
collaboration and partnerships are vital to making progress towards these aspirations.
3.3.6 West Coast Regional Economic Development Plan 2014-2030
This plan aims to grow jobs in the region to increase population and income, particularly export income.
Increasing job numbers are expected to strengthen the resilience and sustainability of communities on
the West Coast. Amongst other things, the vision includes the need to stay near the forefront of modern
living, communications, transport and technology trends. The plan promotes improved alignment as a
region and collective advocacy to central government partners to assist with achieving long term targets
relating to growth in population, regional GDP, exports and job numbers.
3.3.7 Regional Growth Programme 2016
The West Coast is one of five regions included in the Regional Growth Programme. This programme is
commissioned jointly by the Ministry of Business, Innovation and Employment (MBIE) and the Ministry
for Primary Industries (MPI) working in partnership with stakeholders: businesses, iwi and Māori, and
councils in each region. This looks at the potential to attract further investment, raise incomes and
increase employment opportunities. One of the key themes raised in the West Coast Growth Study
Opportunities Report (September 2016) is cross cutting infrastructure opportunities, in particular;
1
http://www.nzta.govt.nz/assets/resources/draft-south-island-freight-plan/docs/draft-south-island-
freight-plan.pdf
LOCAL GOVERNMENT COMMISSION Final with Foreword
7 Feb 2017 REV 6.0 Page 16West Coast Regional Transport Efficiency:
Draft Indicative Business Case (to Options Framework stage)
transport improvements to support tourism “..the case for investment in upgrades on routes to
key visitor icons should be assessed. The roads to be assessed would depend on the priorities
determined through the tourism strategy and plan.”
Information and Communications Technology (ICT) “..the key opportunity is for the West Coast
to secure funding support for the extension of UFB/RBI and mobile network coverage and for
the roll-out of the extension and digital enablement initiatives to be undertaken as soon as
feasible”.
A Regional Economic Action Plan will be developed as an outcome of this work.
3.3.8 West Coast Councils – A Commitment to Regional Efficiency 2015
The members of the West Coast ‘Mayors and Chairs’ forum have entered into a memorandum that
signals their commitment to working together collaboratively. The memorandum documents the range
of collaborative approaches already in place between the four councils and sets out future intentions
for further collaboration (including a road maintenance centre of excellence). One of the goals is to
achieve greater cost effectiveness and efficiency in the delivery of public services. The Regional
Transport Plan is identified as a recent collaborative project that has strategically focused regional effort
on improving the Taramakau Bridge and State Highway 73, east of Arthurs Pass.
3.3.9 Local Government Commission reorganisation application
The Local Government Commission received an application for establishment of a simplified and unified
local government system on the West Coast, with a view to this creating more efficient and cost effective
local government arrangements. To assist the Commission understand the level of community support
for change to local government arrangements it undertook community engagement in June 2016. Taken
overall, the results of the engagement indicated a sufficient level of support for continuing the
reorganisation process.
3.4 Existing collaborations
The West Coast Councils – A Commitment to Regional Efficiency identifies several collaborative
regional approaches to public services. Collaboration is already occurring within the transport activities
of councils (and NZTA) both in terms of decision-making and service delivery. Existing collaborations
that are specific to transport include:
Joint funding with NZTA for the Road Safety and Education promotion contract.
Regional Road Safety Committee.
Regional Transport Committee and Regional Transport Advisory Group.
Joint tender evaluation for roading contracts.
Collaboration in applying ONRC categorisation.
Support for the Regional Transport Committee to collaborate with Regional Transport
Committees across the South Island to develop and implement a shared programme of work.
Development of a regional strategy for walking and cycling.
Joint approach to central government on the two national cycleways.
Informal information sharing with the Tasman/Nelson/Marlborough regions through the ‘Top of
the South’ Roading Efficiency Group.
Other collaborations that have relevance to transport include:
Civil Defence West Coast.
Regional approach to natural hazards planning and investigation (Lifelines).
Joint development of the Digital Enablement Plan for the region – enabling Ultra-Fast
Broadband and cell black spots throughout the region to be addressed (with local funding from
Development West Coast).
Joint funding of Tourism West Coast.
LOCAL GOVERNMENT COMMISSION Final with Foreword
7 Feb 2017 REV 6.0 Page 17West Coast Regional Transport Efficiency:
Draft Indicative Business Case (to Options Framework stage)
Joint funding of a Regional Economic Development Agency.
Planning and Operations managers group of eight second tier managers drive various shared
initiatives at an operational level, meeting on a quarterly basis.
This highlights the willingness of the West Coast councils (and other organisations) to explore and
action opportunities that seek to achieve improved outcomes for their communities.
LOCAL GOVERNMENT COMMISSION Final with Foreword
7 Feb 2017 REV 6.0 Page 18West Coast Regional Transport Efficiency:
Draft Indicative Business Case (to Options Framework stage)
Case for Change
Exploring whether there is a case for change starts with consideration of the current situation within the
existing strategic context. We consider all the issues that impact on service delivery and from this
identify a concise list of ‘problems’ the case for change might seek to overcome. Using the Investment
Logic Map process, we then define the benefits that may be achieved by overcoming the identified
problems; as well as the KPIs that might be used to measure progress towards achievement.
4.1 West Coast overview
Approximately 84% of the 23,000 km2 West Coast Region is administered by the Department of
Conservation, with several national parks contributing to the tourism offer available from this region.
This places considerable demand on all council services including the transport network, particularly on
state highway and local roads that provide access to key tourism destinations such as Franz Josef and
Fox Glacier towns and The Pancake Rocks at Punakaiki.
Tourism continues to grow with Tourism West Coast forecasts showing a 5.4% increase in guest nights
over the next three years. While this is good for the local economy, it does increase demand and place
pressure on the capacity of services and there is no direct ability to recover the costs associated with
this increased demand.
The population at the 2013 Census was 32,148, an increase of 2.6% from the 2006 Census. Statistics
New Zealand medium population projections show a near static population for the region up to 2043.
The West Coast is New Zealand’s most sparsely populated region, exacerbating the problems noted
above about recovery of costs associated with increased tourism demand on services. The median
household income amongst the three Districts ranges from $53,000-56,000, which is considerably lower
than the national level of $64,000. However, The West Coast is tracking in a similar way to national
trends with similar increases to the median household income over time (see Appendix 2).
The biggest contributors to economic growth in the region over the last ten years are mining, agriculture,
forestry and fishing. The dairying industry is the largest employer, with accommodation and hospitals
tracking second and third respectively. Dairy product manufacturing had the greatest increase in
employment over 2014/2015 with the coal mining industry seeing the greatest decrease in employment
over this time period2. The closure and reduction in traditional extract industries, such as timber, coal
mining and concrete processing, has impacted the regional centres especially Greymouth and
Westport.
The West Coast region has a rail network primarily used for transporting milk products, coal, aggregate
and limestone/cement/fertiliser. Regional river ports are located at Westport and Greymouth, with the
primary regional airport at Hokitika, and a smaller airport at Westport.
Local roads and state highways provide important linkages and are a key enabler of economic
development throughout the region. The road network is made up of 870 km of state highway and 1,640
km of local roads. The main access routes into the region are State Highway 6 from the north and south,
and State Highway 73 from the Canterbury region. Development of new alternative routes in and out of
the region are constrained by topography and national park status. A proposal for private development
of a 136 km road connecting the West Coast with Milford Sound is currently under consideration, with
Southland District Council and Westland District Council supporting further evaluation of the financial
and environmental implications. There have also been several proposals in recent times for a northern
route connecting Nelson with Karamea for tourism and freight purposes. The most recent proposal is a
route from Little Wanganui (18 km south of Karemea) using part of the DOC Wangapeka Track to
Tapawera (58 km south-west of Nelsen). The proposal is at a very early stage with Business Case
using NZTA Better Business Case criteria being commissioned.
2 Infometrics – West Coast Region Economic Profile
LOCAL GOVERNMENT COMMISSION Final with Foreword
7 Feb 2017 REV 6.0 Page 19West Coast Regional Transport Efficiency:
Draft Indicative Business Case (to Options Framework stage)
The changing nature of the West Coast Region economy, combined with challenges associated with
the large proportion of conservation estate and increasing tourism numbers placing pressure on
capacity of existing infrastructure, contributes to the need to review service delivery options.
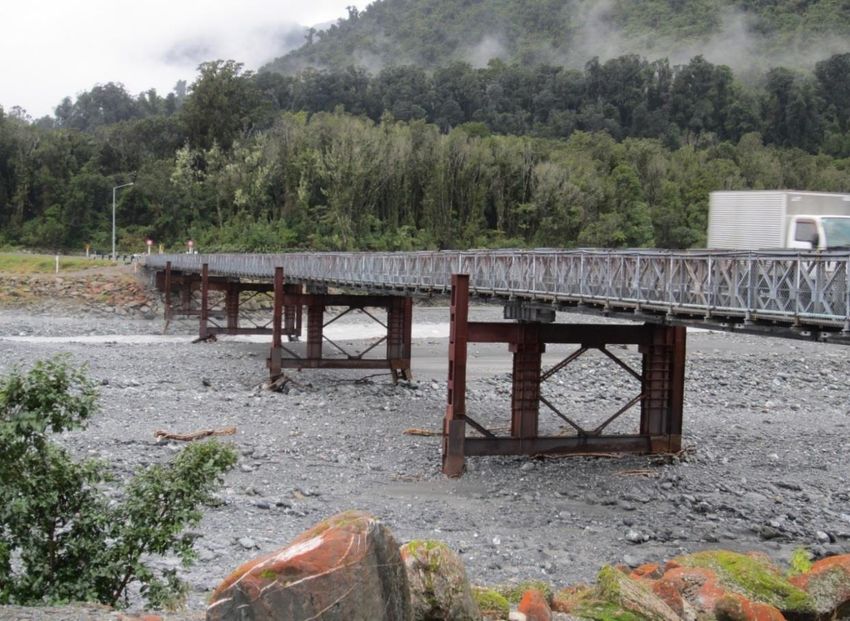
4.2 Efficiency benchmarking
The performance of the West Coast TLAs, regarding expenditure on maintenance, operations and
renewals of the local roading network, has been benchmarked against other rural and semi-urban
councils in New Zealand. This plots the total cost of all maintenance, operations and renewals (sealed
and unsealed, excludes non-subsidised activities) averaged over six years, against the level of usage
of the network.
Figure 2: Comparative analysis of New Zealand Rural/Semi Rural Network Maintenance, Operations and Renewals
Figure 2 highlights the wide variation in the cost per lane kilometre across different New Zealand
networks. For example, while some areas may have the same level of usage, the costs may vary
considerably. The graph shows that Buller District Council and Westland District Council are performing
well in terms of maintenance investment relative to the amount of use that the roading network receives,
sitting slightly below the average line of best fit. While the investment is slightly higher for Grey District
Council relative to the amount of use, this is not enough to highlight any specific areas of concern.
LOCAL GOVERNMENT COMMISSION Final with Foreword
7 Feb 2017 REV 6.0 Page 20West Coast Regional Transport Efficiency:
Draft Indicative Business Case (to Options Framework stage)
Figure 3: Comparative analysis of New Zealand road maintenance, renewals and operations cost per head of
population
Further benchmarking of maintenance, renewals and operations costs per head of population against
other rural/semi-urban councils places all three councils in a similar position, within the medium range
of spend relative to population.
Whilst benchmarking indicates local road networks are generally efficiently maintained by the
councils, recent analysis by the Ministry of Transport confirms that councils across New Zealand
have made improvements in cost effectiveness over the past 5-6 years; with the underlying message
that even councils that have traditionally been seen to be ‘doing OK’ cannot afford to rest on their
laurels.
LOCAL GOVERNMENT COMMISSION Final with Foreword
7 Feb 2017 REV 6.0 Page 21West Coast Regional Transport Efficiency:
Draft Indicative Business Case (to Options Framework stage)
4.3 Issue Identification
Multiple avenues for engagement with stakeholders were initiated to gain the widest possible feedback:
Facilitated workshop with senior representatives from councils and NZTA.
Drop in days where stakeholders could learn about the process and provide feedback
User surveys for those stakeholders who could not attend drop in days.
The facilitated workshop was held on Tuesday 21 June 2016 with council and NZTA representatives to
understand the key issues and the case for change. This built on the work undertaken by the Road
Efficiency Group with Rationale in 2014 looking at transport sector collaboration where issues and
challenges, and objectives and opportunities were identified.
The chief executives of Tourism West Coast and Development West Coast and senior representatives
from Westland Milk, Fulton Hogan, and Westroads Ltd all provided considerable feedback through the
drop-in sessions.
Te Rūnanga O Makaawhio - Natural Resources Coordinator attended the drop-in day and provided a
detailed background of the challenges around transport resilience and rūnanga cultural and business
interests in the Westland area.
The Department of Conservation (DOC) operations manager provided an overview of the department’s
role both as joint custodians of the conservation estate and in a community supporter role such as
providing civil defence leadership in the towns of Franz Josef and Fox Glacier. There was an indication
that increased collaboration with the TLAs and NZTA was supported, especially around the asset
management and business case requirements for DOC as an ‘approved organisation’ and recipient of
NZTA financial assistance. Both Buller and Westland District Councils already collaborate with DOC to
manage the maintenance of several roads that receive the FAR, with an agreement in place to
financially compensate the councils for this role.
Customer representatives from groups such as Federated Farmers and Minerals West Coast who were
not able to make the drop-in sessions, were all sent user surveys to fill out and were encouraged to
send them back. Follow up phone calls were placed with many of these groups to gain a wider
perspective of the issues and opportunities for the West Coast transport arrangements.
A summary of key issues identified from the workshop is outlined in Table 5. Issues identified at the
drop-in sessions and user surveys are outlined in Table 6.
Table 5: Summary of Key Issues from Workshop
Issue Key comments
Affordability Funding infrastructure required especially for visitor economy and dairy
industry puts considerable strain on affordability of this for ratepayers.
Competitive market Reduced number of contractors due to the Network Outcomes Contract
(NOC) has potential impacts on competition. (On the other hand, this
arrangement benefits all parties as local contractors access a greater
range of skills and knowledge, delivering improved levels of service on
isolated roads, and the NOC benefits from local experience and
knowledge).
National transport National transport standards such as ONRC impacts on levels of service
standards and funding.
Isolation The cost of goods and services are higher and harder to source as a
result of geographical distance.
LOCAL GOVERNMENT COMMISSION Final with Foreword
7 Feb 2017 REV 6.0 Page 22You can also read