Lawrence Berkeley National Laboratory - Recent Work
←
→
Page content transcription
If your browser does not render page correctly, please read the page content below
Lawrence Berkeley National Laboratory
Recent Work

Title
Whole-Genome Comparisons of Ergot Fungi Reveals the Divergence and Evolution of
Species within the Genus Claviceps Are the Result of Varying Mechanisms Driving
Genome Evolution and Host Range Expansion.

Permalink
https://escholarship.org/uc/item/5664328g

Journal
Genome biology and evolution, 13(2)

ISSN
1759-6653

Authors
Wyka, Stephen A
Mondo, Stephen J
Liu, Miao
et al.

Publication Date
2021-02-01

DOI
10.1093/gbe/evaa267

Peer reviewed

 eScholarship.org                           Powered by the California Digital Library
                                                            University of California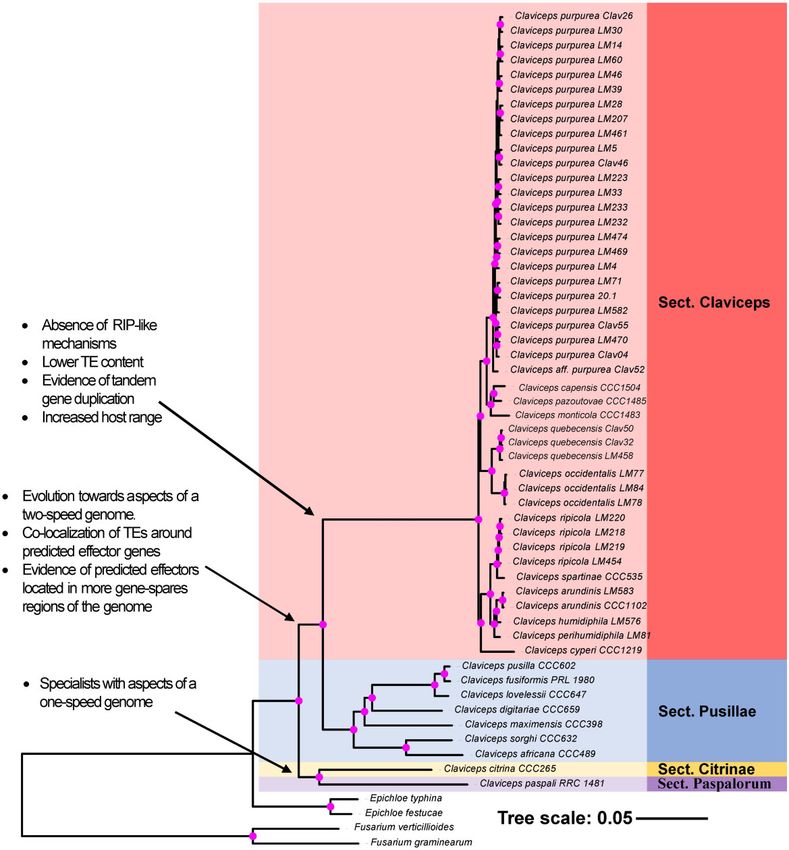
GBE

Whole-Genome Comparisons of Ergot Fungi Reveals the
Divergence and Evolution of Species within the Genus
Claviceps Are the Result of Varying Mechanisms Driving
Genome Evolution and Host Range Expansion
Stephen A. Wyka 1, Stephen J. Mondo1,2, Miao Liu3, Jeremy Dettman3, Vamsi Nalam1, and
Kirk D. Broders1,4,§,*

1
 Department of Agricultural Biology, Colorado State University, Fort Collins, Colorado, USA
2
 U.S. Department of Energy Joint Genome Institute, Berkeley, California, USA
3
 Ottawa Research and Development Centre, Agriculture and Agri-Food Canada, Ottawa, Ontario, Canada
4
 Smithsonian Tropical Research Institute, Panama, Repu
                                                      blica de Panama

§
 Present address: Mycotoxin Prevention and Applied Microbiology Research Unit, USDA, Agricultural Research Service, National Center for
Agricultural Utilization Research, Peoria, IL, USA
*Corresponding author: E-mail: kirk.broders@usda.gov.
Accepted: 16 December 2020

Abstract
The genus Claviceps has been known for centuries as an economically important fungal genus for pharmacology and agricultural
research. Only recently have researchers begun to unravel the evolutionary history of the genus, with origins in South America and
classification of four distinct sections through ecological, morphological, and metabolic features (Claviceps sects. Citrinae,
Paspalorum, Pusillae, and Claviceps). The first three sections are additionally characterized by narrow host range, whereas section
Claviceps is considered evolutionarily more successful and adaptable as it has the largest host range and biogeographical distribution.
However, the reasons for this success and adaptability remain unclear. Our study elucidates factors influencing adaptability by
sequencing and annotating 50 Claviceps genomes, representing 21 species, for a comprehensive comparison of genome architec-
ture and plasticity in relation to host range potential. Our results show the trajectory from specialized genomes (sects. Citrinae and
Paspalorum) toward adaptive genomes (sects. Pusillae and Claviceps) through colocalization of transposable elements around
predicted effectors and a putative loss of repeat-induced point mutation resulting in unconstrained tandem gene duplication
coinciding with increased host range potential and speciation. Alterations of genomic architecture and plasticity can substantially
influence and shape the evolutionary trajectory of fungal pathogens and their adaptability. Furthermore, our study provides a large
increase in available genomic resources to propel future studies of Claviceps in pharmacology and agricultural research, as well as,
research into deeper understanding of the evolution of adaptable plant pathogens.
Key words: adaptive evolution, gene cluster expansion, fungal plant pathogens, RIP.

Introduction                                                                                   Adaptation and diversification of fungal species can be medi-
Fungi, particularly phytopathogenic species, are increasingly                                  ated by changes in genome architecture and plasticity, such as
being used to gain insight into the evolution of eukaryotic                                    genome size, transposable element (TE) content, localization
organisms, due to their adaptive nature and unique genome                                      of TEs to specific genes, genome compartmentalization, gene
structures (Gladieux et al. 2014; Dong et al. 2015).                                           duplication rates, recombination rates, and presence/absence
                                                                                               polymorphism of virulence factors (Dong et al. 2015; Möller

ß The Author(s) 2021. Published by Oxford University Press on behalf of the Society for Molecular Biology and Evolution.
This is an Open Access article distributed under the terms of the Creative Commons Attribution License (http://creativecommons.org/licenses/by/4.0/), which permits unrestricted reuse,
distribution, and reproduction in any medium, provided the original work is properly cited.

Genome Biol. Evol. 13(2) doi:10.1093/gbe/evaa267 Advance Access publication 29 January 2021                                                                                         1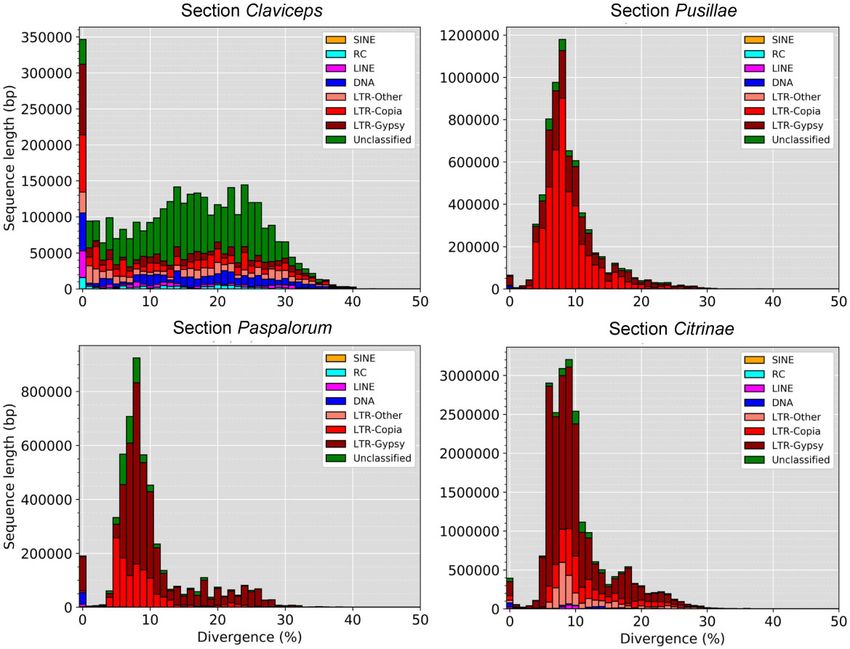
Wyka et al.                                                                                                           GBE

    Significance
    Lack of genomic data for the Claviceps genus has hampered the ability to identify factors influencing the adaptation of
    Claviceps species and mechanisms associated with the broad host range of some species. Our analysis reveals the
    trajectory from specialized genomes toward adaptive genomes through a variety of genomic mechanisms which
    coincided with increases in host range potential. These results demonstrate a clear example of how genomic alter-
    ations can influence and shape the evolutionary trajectory of fungal pathogens in association with host range.

and Stukenbrock 2017). The presence or absence of repeat-           sections Citrinae and Paspalorum originated in South
induced point (RIP) mutation is also an important mechanism         America, whereas section Pusillae experienced speciation
for fungal genome evolution, as RIP works on a genomewide           throughout the Eocene, Oligocene, and Miocene as these
scale to silence TEs and duplicated genes, which can also           species encountered newly emergent PACMAD warm-
“leak” onto neighboring genes (Galagan et al. 2003;                 season grasses (subfamilies Panicoideae, Aristidoideae,
Galagan and Selker 2004; Raffaele and Kamoun 2012;                  Chloridoideae,        Micrairoideae,    Arundinoideae,        and
Urguhart et al. 2018; Möller and Stukenbrock 2017). It is          Danthonioideae) when an ancestral strain was transferred
becoming increasingly evident that variations in these factors      from South America to Africa (Pıchova et al. 2018). In con-
can be used to classify genomes as a one speed (one com-            trast, the crown node of section Claviceps is estimated at 20.4
partment), such as the powdery mildew fungi Blumeria gra-           Ma and was followed by a radiation of the section corre-
minis f.sp. hordei and f.sp tritici, two speed (two                 sponding to a host jump from ancestral sedges
compartments), such as the late blight pathogen                     (Cyperaceae) to the Bamboo, Oryzoideae, Pooideae (BOP)
Phytophthora infestans, or multispeed (multicompartment)            clade (cool-season grasses; subfamilies Bambusoideae,
such as the multihost pathogen Fusarium oxysporum (Dong             Oryzoideae [syn: Ehrhartoideae]; Soreng et al. 2017,
et al. 2015; Frantzeskakis et al. 2019). These different            Pooideae) in North America (Bouchenak-Khelladi et al.
“speeds” are characterized by their potential adaptability          2010; Pıchova et al. 2018). Section Claviceps has the largest
such that one-speed genomes are often considered less               host range with C. purpurea sensu stricto (s.s.) having been
adaptable, whereas two-speed and multispeed genomes                 reported on up to 400 different species in clade BOP
are often considered more adaptable (Dong et al. 2015;              (Alderman et al. 2004, Pıchova et al. 2018) across six tribes
Frantzeskakis et al. 2019; Möller and Stukenbrock 2019).           and retains the ability to infect sedges (Cyperaceae)
   The ergot fungi of the genus Claviceps (Ascomycota,              (Jungehülsing and Tudzynski 1997). In contrast, section
Hypocreales) are biotrophic species that share a specialized        Pusillae is specialized to the tribes Paniceae and
ovarian-specific nonsystemic parasitic lifestyle with their grass   Andropogoneae, and sections Citrinae and Paspalorum only
hosts (Pıchova et al. 2018). Infections are fully restricted to   infect members of tribe Paspaleae and tribe Cynodonteae,
individual unpollinated ovaries (Tudzynski and Scheffer 2004),      respectively (Pıchova et al. 2018). The shared specialized in-
and the fungus actively manages to maintain host cell viability     fection life cycle of the Claviceps genus, the drastic differences
to obtain nutrients from living tissue through a complex cross-     in host range potential of different species, and geographic
talk of genes related to pathogenesis, such as secreted effec-      distribution represent a unique system to study the evolution
tors, secondary metabolites, or cytokinin production (Hinsch        and host adaptation of eukaryotic organisms.
et al. 2015, 2016; Oeser et al. 2017; Kind, Schurack, et al.           Despite their ecological and agriculture importance, little is
2018; Kind, Hinsch, et al. 2018). Species of Claviceps are most     known about the evolution and genomic architecture of these
notably known for their production of toxic alkaloids and sec-      important fungal species in comparison with other cereal
ondary metabolites but are also known for their expansive           pathogens such as species in the genera Puccinia (Cantu
host range and negative impact on global cereal crop produc-        et al. 2013; Kiran et al. 2016, 2017), Zymoseptoria (Estep
tion and livestock farming. These negative effects on human         et al. 2015; Grandaubert et al. 2015, 2019; Poppe et al.
and livestock health are the primary reason Claviceps species       2015; Testa, Oliver et al. 2015; Wu et al. 2017;
are referred to as plant pathogens. However, under the light        Stukenbrock and Dutheil 2018), or Fusarium (Kvas et al.
of coevolution with their grass hosts, some Claviceps species       2009; Ma et al. 2010; Rep and Kistler 2010; Watanabe
are considered conditional defensive mutualists with their          et al. 2011; Sperschneider et al. 2015). Unfortunately, the
hosts as they prevent herbivory and can improve host fitness        lack of genome data for the Claviceps genus has hampered
(Raybould et al. 1998; Fisher et al. 2007; W€ali et al. 2013).      our ability to complete comparative analyses to identify fac-
   The genus Claviceps contains 59 species divided into four        tors that are influencing the adaptation of Claviceps species
sections as follows: Claviceps, Pusillae, Citrinae, and             across the four sections in the genus, and the mechanisms by
Paspalorum (Pıchova et al. 2018). It was postulated that          which species of section Claviceps have adapted to such a

2    Genome Biol. Evol. 13(2) doi:10.1093/gbe/evaa267 Advance Access publication 29 January 2021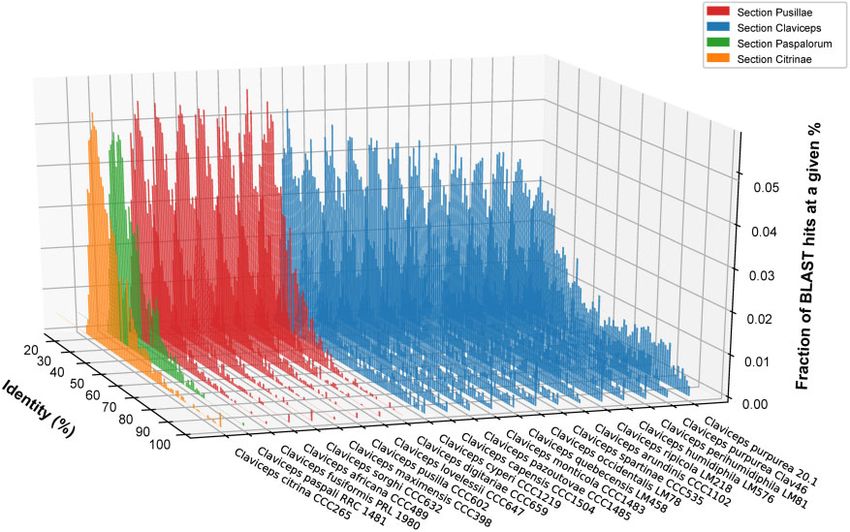
Whole-Genome Comparisons of Ergot Fungi                                                                            GBE

broad host range, in comparison with the other three sec-          with Trimmomatic v0.36 (Bolger et al. 2014) using the com-
tions. Here we present the sequences and annotations of            mands (SLIDINGWINDOW: 4:20; MINLEN:36; HEADCROP:10)
50 Claviceps genomes, representing 19 species, for a compre-       to remove poor quality data, only paired-end reads were
hensive comparison of the genus to understand evolution            used. To better standardize the comparative analysis, all 50
within the genus Claviceps by characterizing the genomic           samples were subject to de novo genome assembly with
plasticity and architecture in relation to adaptive host poten-    Shovill v0.9.0 (https://github.com/tseemann/shovill; last
tial. Our analysis reveals the trajectory from specialized one-    accessed May 11, 2020) using SPAdes v3.11.1 (Nurk et al.
speed genomes (sects. Citrinae and Paspalorum) toward              2013) with a minimum contig length of 1,000 bp.
adaptive two-speed genomes (sects. Pusillae and Claviceps)            The reference genomes of C. purpurea strain 20.1
through colocalization of TEs around predicted effectors           (SAMEA2272775),          C.       fusiformis     PRL     1980
and a putative loss of RIP resulting in tandem gene duplication    (SAMN02981339),         and      C.     paspali   RRC    1481
coinciding with increased host range potential.                    (SAMN02981342) were downloaded from NCBI. Proteins
                                                                   for C. fusiformis and C. paspali were not available on NCBI
                                                                   so they were extracted from GFF3 files provided by Dr Chris
Materials and Methods
                                                                   Schardl and Dr Neil Moore, University of Kentucky, corre-
Sample Acquisition                                                 sponding to the 2013 annotations (Schardl et al. 2013) avail-
Field collected samples (Clav) were surfaced sterilized, allowed   able at http://www.endophyte.uky.edu (last accessed March
to grow as mycelia, and individual conidia transferred to make     22, 2020). Reference genomes were standardized for com-
single spore cultures. Thirteen cultures were provided by Dr       parative analysis with our 50 annotated genomes, by imple-
Miroslav Kolarık from the Culture Collection of                  menting a protein length cutoff of 50 aa and removal of
Clavicipitaceae (CCC) at Institute of Microbiology, Academy        alternatively spliced proteins in C. fusiformis and C. paspali,
of Sciences of the Czech Republic. Raw Illumina reads for          only the longest spliced protein for each locus remained.
samples (LM28, LM582, LM78, LM81, LM458, LM218,
LM454, LM576, and LM583) were downloaded from NCBI                 Transposable Elements
SRA database. Raw Illumina reads from an additional 21 LM          TE fragments were identified following procedures for estab-
samples were generated by Dr Liu’s lab (AAFC), sequencing          lishment of de novo comprehensive repeat libraries set forth
protocol of these 21 samples followed (Wingfield et al. 2018).     in Coghlan et al. (2018), a brief summary is described below.
Summarized information can be found in supplementary ta-           The following steps were automated through construction of
ble S1, Supplementary Material online.                             a custom script, TransposableELMT (https://github.com/
                                                                   PlantDr430/TransposableELMT). Each of the 53 Claviceps ge-
Preparation of Genomic DNA                                         nome were used to create a respective repeat library using
                                                                   RepeatModeler v1.0.8 (Smit and Hubley 2015),
Cultures grown on cellophane PDA plates were used for ge-
                                                                   TransposonPSI (Hass 2010), and long terminal repear (LTR)
nomic DNA extraction from lyophilized mycelium following a
                                                                   LTR_finder v1.07 (Xu and Wang 2007) on default settings.
modified CTAB method (Doyle JJ and Doyle JL 1987;
                                                                   LTR_harvest v1.5.10 (Ellinghaus et al. 2008) was additionally
Wingfield et al. 2018) without using the RNase Cocktail
                                                                   run on default settings, and results were filtered with
Enzyme Mix, only RNase A was used. DNA contamination
                                                                   LTR_digest v1.5.10 (Steinbiss et al. 2009) with an HMM
was checked by running samples on a 1% agarose gel and
                                                                   search for Pfam domains associated with TEs; only candidates
a NanoDrop Onec (Thermo Fishcer Scientific). Twenty samples
                                                                   with domain hits were kept. Repeat libraries from these four
(7 Clav and 13 CCC) were sent to BGI-Hong Kong HGS Lab
                                                                   programs were concatenated with all curated TEs from
for 150-bp paired-end Illumina sequencing on an HiSeq 4000.
                                                                   RepBase (Bao et al. 2015) and redundant sequences were
                                                                   removed using Usearch v11.0.667 (Edgar 2010) with a per-
Genome Assembly                                                    cent identity cutoff of 80%. TEs for each of the nonredun-
Preliminary data showed that raw reads of LM458 were con-          dant libraries were classified using RepeatClassifier v1.0.8
taminated with bacterial DNA but showed strong species sim-        (Smit and Hubley 2015). RepeatMasker v4.0.7 (Smit et al.
ilar to Clav32 and Clav50. To filter out the bacterial DNA         2015) was then used, on default settings with each assemble
sequences, reads of LM458 were mapped against the assem-           genome and its respective repeat library, to soft mask the
bled Clav32 and Clav50 genomes using BBSplit v38.41                genomes and identify TE regions. TE content was represented
(Bushnell 2014). All forward and reverse reads mapped to           as the proportion of the genome masked by TE regions de-
each of the genomes were concatenated, respectively. Both          termined by RepeatMasker, excluding simple and low com-
sets were then interleaved to remove duplicates and used for       plexity repeats.
further analysis. Reads for all 50 samples were checked for            The TE divergences, calculated from RepeatMasker for TEs
quality with FastQC v0.11.5 (Andrews 2010) and trimmed             in all 53 Claviceps genomes, were used to plot the divergence

Genome Biol. Evol. 13(2) doi:10.1093/gbe/evaa267 Advance Access publication 29 January 2021                                     3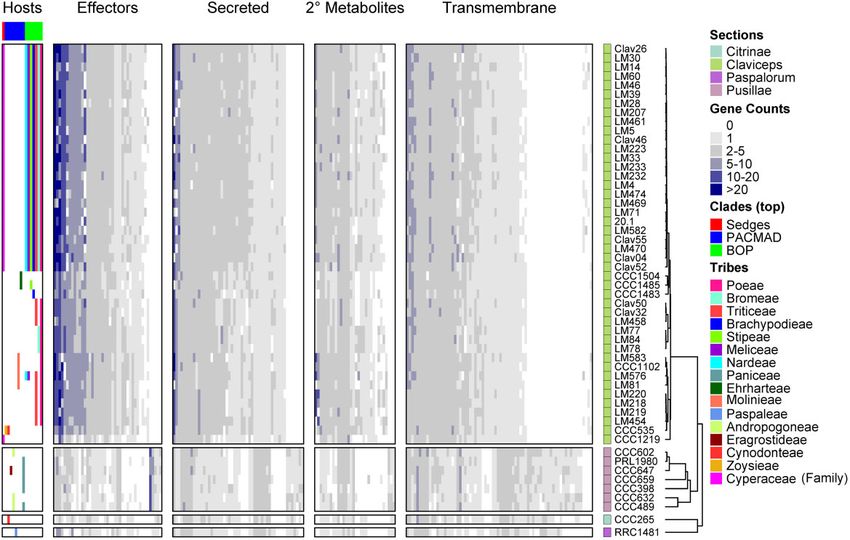
Wyka et al.                                                                                                       GBE

landscape using a custom script (https://github.com/             Pochonia chlamydosporia 170, Ustilago maydis 521, and
PlantDr430/CSU_scripts/blob/master/TE_divergence_land-           Epichloe festucae F1) were used as protein evidence. The
scape.py). The RepeatMasker results were also used with          AUGUSTUS pretrained C. purpurea files were used as
the respective GFF3 file from each genome to calculate the       BUSCO seed species along with the Sordariomyceta database
average distance (kb) of each gene to the closest TE frag-       and all five ab initio predictions were passed through the –
ment on the 50 and 30 flanking side. Values were calculated      other_gff flag with weights of 1. The following flags were also
for predicted effectors, noneffector secreted genes, non-        used in Funannotate “predict”: –repeats2evm, –optimize_au-
secreted metabolite genes, and all other genes using a           gustus, –soft_mask 1000, –min_protlen 50. BUSCO was used
custom      script   (https://github.com/PlantDr430/CSU_         to evaluate annotation completeness using the Dikarya and
scripts/blob/master/TE_closeness.py).                            Sordariomyceta databases (odb9) with –prot on default
                                                                 settings.
Genome Annotation
                                                                 Functional Annotation
AUGUSTUS v3.2.2 (Mario et al. 2008) was used to create
pretrained parameters files using the reference C. purpurea      Functional analysis was performed using Funannotate
strain 20.1, available expressed sequence tag (EST) data from    “annotate.” The following analyses were also performed on
NCBI, and wild-type RNAseq data (SRR4428945) created in          the three reference Claviceps genomes. Secondary metabolite
Oeser et al. (2017). RNA-seq data was subject to quality check   clusters were predicted using antiSMASH v5 (Blin et al. 2019)
and trimming as above. All three data sets were also used to     with all features turned on. Functional domain annotations
train parameter files for the ab initio gene model prediction    were conducted using eggNOG-mapper v5 (Huerta-Cepas
software’s GeneID v1.4.4 (Blanco et al. 2007) and                et al. 2017, 2019) on default settings and InterProScan v5
CodingQuarry v2.0 (Testa et al. 2015). GeneID training fol-      (Jones et al. 2014) with the –goterms flag. Phobius v1.01
lowed protocols available at http://genome.crg.es/software/      (K€all et al. 2007) was used to assist in prediction of secreted
geneid/training.html. For CodingQuarry training, RNA tran-       proteins. In addition to these analyses Funannotate also per-
scripts were created de novo using Trinity v2.8.4 (Grabherr      formed domain annotations through an HMMer search
et al. 2011) on default settings and EST coordinates were        against the Pfam-A database and dbCAN CAZYmes data-
found by mapping the EST data to the reference genome            base, a BlastP search against the MEROPS protease database,
using Minimap2 v2.1 (Li 2018).                                   and secreted protein predictions with SignalP v4.1 (Nielsen
    Gene models for the 50 genomes were then predicted           2017).
with GeneID and CodingQuarry using the trained                       For downstream analysis, proteins were classified as se-
C. purpruea parameter files. CodingQuarry prediction was         creted proteins if they had signal peptides detected by both
also supplemented with transcript evidence by mapping the        Phobius and SignalP and did not possess a transmembrane
available EST and RNA-seq C. purpurea data to each genome        domain as predicted by Phobius and an additional analysis of
using Minimap2. BUSCO v3 (Waterhouse et al. 2018) was run        TMHMM v2.0 (Krogh et al. 2001). Effector proteins were
on all 50 genomes using the AUGUSTUS C. purpurea pre-            identified by using EffectorP v2.0 (Sperschneider et al.
trained parameter files as the reference organism and the        2018), with default settings, on the set of secreted proteins
Sordariomyceta database. The resulting predicted proteins        for each genome. Transmembrane proteins were identified if
for each sample were used as training models for ab initio       both Phobius and TMHMM detected transmembrane
gene prediction using SNAP (Korf 2004) and GlimmerHMM            domains. Secondary metabolite proteins were identified if
v3.0.1 (Majoros et al. 2004). Last, GeMoMa v1.5.3                they resided within metabolite clusters predicted by
(Keilwagen et al. 2016) was used for ab initio gene prediction   antiSMASH. Proteins were classified as having conserved pro-
using the soft-masked genomes and the C. purpruea 20.1           tein domains if they contained any Pfam or IPR domains.
reference files.
    Funannotate v1.6.0 (Palmer and Stajich 2019) was then        Gene Family Identification and Classification
used as the primary software for genome annotation.              OrthoFinder v2.3.3 (Emms and Kelly 2019) was run on default
Funannotate additionally uses AUGUSTUS and GeneMark-             settings using Diamond v0.9.25.126 (Buchfink et al. 2015) to
ES (Ter-Hovhannisyan et al. 2008) for ab initio gene model       infer groups of orthologous gene clusters (orthogroups) based
prediction, Exonerate for transcript and protein evidence        on protein homology and Markov Cluster Algorithm (MCL)
alignment, and EVidenceModeler (Hass et al. 2008) for a final    clustering. To more accurately place closely related genes into
weighted consensus. All C. purpurea EST and RNAseq data          clusters an additional 78 fungal genomes (supplementary ta-
were used as transcript evidence and the Uniport Swiss-Prot      ble S3, Supplementary Material online) with emphasis on
database and proteins from several closely related species       plant associated fungi of the order Hypocreales were added.
(C. purpurea strain 20.1, C. fusiformis PRL1980, C. paspali      To standardize, all 78 additional genomes were subject to a
RRC1481, Fusarium oxysporum f. sp. lycopersici 4287,             protein length cutoff of 50 amino acids and genomes

4   Genome Biol. Evol. 13(2) doi:10.1093/gbe/evaa267 Advance Access publication 29 January 2021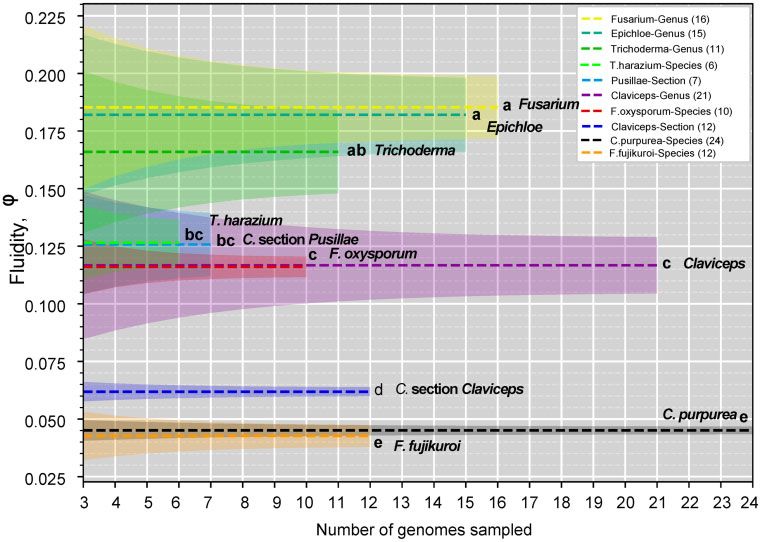
Whole-Genome Comparisons of Ergot Fungi                                                                               GBE

downloaded from http://www.endophyte.uky.edu had alter-             C. purpurea strains were extracted from our OrthoFinder de-
natively spliced proteins removed. For downstream analysis,         fined gene clusters. Additional species- and genus-wide gene
orthogroups pertaining to the 53 Claviceps genomes were             cluster data sets from the additional 78 fungal genomes were
classified as secreted, predicted effectors, transmembrane,         extracted for comparative purposes. All section- and genus-
metabolite, and conserved domain orthogroups if 50% of             wide data sets contained one representative isolate from each
the Claviceps strains present in a given cluster had at least one   species to reduce phylogenetic bias. Each extracted data set
protein classified as such.                                         was used to calculate the genomic fluidity using a custom
                                                                    script (https://github.com/PlantDr430/CSU_scripts/blob/mas-
Phylogeny and Genome Fluidity                                       ter/pangenome_fluidity.py). The result files for each data set
                                                                    were then used for figure creation and two-sample two-sided
Phylogenetic relationship of all 53 Claviceps genomes, with
                                                                    z test statistics (Kislyuk et al. 2011) using a custom script
Fusarium graminearum, F. verticillioides, Epichloe festucae,
                                                                    (https://github.com/PlantDr430/CSU_scripts/blob/master/
and E. typhina as outgroups, was derived from 2,002
                                                                    combine_fluidity.py).
single-copy orthologs obtained from our OrthoFinder defined
gene clusters (described above). This resulted in a data set of
                                                                    Gene Density Compartmentalization
114,114 amino acids sequences that were concatenated to
create a supermatrix and aligned using MAFFT v7.429 (Katoh          A custom script (https://github.com/PlantDr430/CSU_scripts/
and Standley 2013) on default settings. Uninformative sites         blob/master/genome_speed_hexbins.py) was used to calcu-
were removed using Gblocks v0.91 (Castresana 2000) on de-           late local gene density measured as 50 and 30 flanking distan-
fault settings. Due to the large scale of the alignment maxi-       ces between neighboring genes (intergenic regions). To
mum likelihood reconstruction was performed using FastTree          statistically determine whether specific gene types had longer
v2.1.11 (Price et al. 2010) using the Whelan and Goldman            intergenic flanking regions than all other genes within the
matrix model of amino acid substitution with the –gamma, –          genome we randomly sampled 100 each group of genes
spr 4, –mlacc 2, –slownni, and –slow flag with 1,000 boot-          (specific gene vs. other genes) 1,000 times for both the 50
straps. MEGA X (Sudhir et al. 2018) was used for neighbor           and 30 flanking distances. Mann–Whitney U test was used to
joining (NJ) reconstruction using the Jones, Taylor, and            test for significance on all 2,000 subsets corrected with
Thorton matrix model of amino acid substitution with gamma          Benjamini–Hochberg. Corrected P values were averaged per
distribution and maximum parsimony (MP) reconstruction us-          flanking side and then together to get a final P value. Genes
ing the tree bisection reconstruction (TBR) algorithm with 100      that appeared on a contig alone were excluded from analysis
repeated searches. Nodal support for both NJ and MP recon-          (supplementary table S4, Supplementary Material online). For
structions were assessed with 1,000 bootstraps. In addition,        graphical representation, genes that were located at the start
an alignment and maximum likelihood (ML) reconstruction             of each contig (50 end) were plotted along the x axis, whereas
was performed on each of the 2,002 protein sequences fol-           genes located at the end of each contig (30 end) were plotted
lowing the procedure as above (MAFFT, Gblocks, FastTree). A         along the y axis.
density consensus phylogeny was created from all gene trees
using the program DensiTree v2.2.5 (Bouckaert and Heled             RIP and Blast Analyses
2014). PhyBin v0.3-1 (Newton RR and Newton IL 2013) was             For all 53 genomes a self-BlastP v2.9.0þ search was con-
used to cluster trees from three data sets (1: Claviceps genus      ducted to identify best hit orthologs within each genome
without outgroups, 2: section Pusillae species, and 3: section      with a cutoff e-value of 105 and removal of self-hits. This
Claviceps species) together to identify frequencies of concor-      process was automated using a custom script (https://github.
dant topologies using the –complete flag with –editdist ¼ 2.        com/PlantDr430/CSU_scripts/blob/master/RIP_blast_analysis.py).
To reduce noise, from abundant incomplete lineage sorting in        We further examined if gene pairs with a pairwise identity of
section Claviceps, we implemented a –minbranchlen ¼ 0.015           80% were located next to each other and/or separated by
for our Claviceps genus data set.                                   five or fewer genes. Fifty-six important Claviceps genes (supple-
   Following methodologies established in Kislyuk et al.            mentary table S7, Supplementary Material online) including the
(2011) genomic fluidity, which estimates the dissimilarity be-      rid-1 homolog (Freitag et al. 2002) were used in a BlastP analysis
tween genomes by using ratios of the number of unique gene          to identify the number of genes present that passed an e-value
clusters to the total number of gene clusters in pairs of           cutoff of 105, 50% coverage, and 35% identity. Genes that
genomes averaged over randomly chosen genome pairs                  appeared as best hits for multiple query genes were only
from within a group on N genomes, was used to assess                recorded once for their overall best match. In addition, the
gene cluster dissimilarity within the Claviceps genus. For a        web-based tool The RIPper (Van Wyk et al. 2019) was used
more detailed description refer to Kislyuk et al. (2011). Data      on default settings (1-kb windows in 500-bp increments) to
sets containing gene clusters from representative members of        scan whole genomes for presence of RIP and large RIP affected
section Pusillae, section Claviceps, Clavieps genus, and all        regions (LRARs).

Genome Biol. Evol. 13(2) doi:10.1093/gbe/evaa267 Advance Access publication 29 January 2021                                         5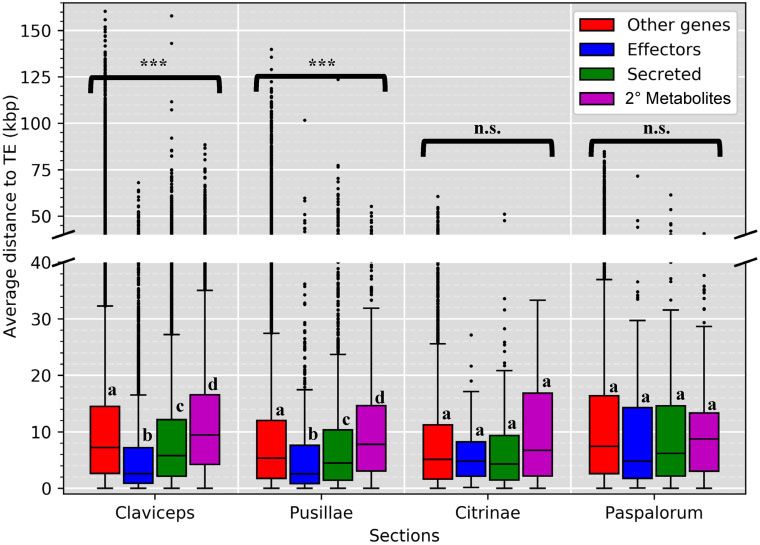
Wyka et al.                                                                                                            GBE

Statistical Programs and Plotting                                     addition, our topology of section Claviceps is concordant
Statistics and figures were generated using Python3 modules           with a larger multilocus phylogeny of the section (Liu et al.
SciPy v1.3.1, statsmodel v0.11.0, and Matplotlib v3.1.1.              2020). Our ML topology was also supported by NJ and max-
                                                                      imum parsimony supermatrix analyses (supplementary fig. S2
Heatmaps were generated using ComplexHeatmap v2.2.0
                                                                      and S3, Supplementary Material online). Notable exceptions
in R (Gu 2016).
                                                                      were the placement of C. paspali (sect. Paspalorum) which
                                                                      grouped closer to C. citrina (sect. Citrinae) instead of section
Results                                                               Claviceps, and C. pusilla which grouped closer to C. fusiformis
                                                                      instead of C. maximensis (fig. 1). We also found that section
Genome Assembly and Annotation
                                                                      Claviceps diverged from a common ancestor with section
To provide a comprehensive view of variability across                 Pusillae as opposed to section Paspalorum. Our results provide
Claviceps, we sequenced and annotated 50 genomes (19                  support for the deeply divergent lineages of sections Pusillae,
Claviceps spp.), including C. citrina the single species of section   Paspalorum, and Citrinae with a long divergent branch result-
Citrinae, six species belonging to section Pusillae, and 44           ing in section Claviceps (fig. 1).
genomes (12 species) belonging to section Claviceps, of which             Each of the 2,002 single-copy orthologs were also inde-
23 genomes belong to C. purpurea s.s. (table 1 and supple-            pendently aligned and analyzed in the same manner as our
mentary table S1, Supplementary Material online). The assem-          supermatrix phylogeny from representative isolates of each
blies and annotations were of comparable quality to the               species. A density consensus tree of all 2,002 topologies
reference strains (table 1). A more detailed representation           was concordant with our supermatrix analysis but reveals ev-
of the assembly and annotation statistics can be seen in table 1      idence of incongruencies, particularly within section Claviceps
and supplementary figure S1 and table S2, Supplementary               (supplementary fig. S4, Supplementary Material online),
Material online.                                                      which could be caused by biological, analytical, and sampling
    Overall, species of section Claviceps had better assemblies       factors (Steenwyk et al. 2019). Although grouping of species
and annotations than species of other sections regarding con-         generally held true to figure 1, variation was more related to
tig numbers, N50’s, and BUSCO completeness scores (table 1).          the order of branches, with C. cyperi, C. arundinis,
Nearly all species of section Claviceps showed higher BUSCO           C. humidiphila, and C. perihumidiphila showing the most var-
scores than the references, whereas species of sections               iability. These results indicate the presence of some incon-
Pusillae and Citrinae generally showed lower scores, likely           gruencies within section Claviceps, section Pusillae, and
due to their higher TE content (average 34.9 6 11.0%, ta-             across the genus (supplementary fig. S5–S7, Supplementary
ble 1). Exceptions to the low BUSCO scores were C. digitariae         Material online) but a consensus supporting our ML species
and C. maximensis (sect. Pusillae), which had lower TE con-           tree (fig. 1 and supplementary fig. S4, Supplementary
tent, 20.0% and 19.8%, respectively, than the rest of the             Material online). There are several potential causes of these
species in section Pusillae (table 1). Although, C. africana          incongruencies that are currently the focal point of an ongo-
(sect. Pusillae, TE content ¼ 34.0%) also had comparable              ing study.
BUSCO scores, to the references, with a higher N50 and lower              To further elucidate trends of divergence within the genus,
contig number, than the rest of the species in section Pusillae       we examined genomic fluidity (Kislyuk et al. 2011) using all
(table 1). Despite the differences in assembly quality between        82,267 orthogroups from our previous OrthoFinder analysis.
species of section Pusillae, the genomic findings reported in         Genomic fluidity estimates the dissimilarity between genomes
this study were found to be comparable between members of             by using ratios of the number of unique orthogroups to the
this section indicating that both higher quality and lower qual-      total number of orthogroups in pairs of genomes averaged
ity genomes of section Pusillae provided similar results.             over randomly chosen genome pairs from within a group on
                                                                      N genomes. For example, a fluidity value of 0.05 indicates that
                                                                      randomly chosen pairs of genomes in a group will on average
Phylogenomics and Genome Fluidity
                                                                      have 5% unique orthogroups and share 95% of their
Orthologous gene clusters (orthogroups), which contain                orthogroups (Kislyuk et al. 2011). Section Claviceps, which is
orthologs and paralogs, were inferred from protein homology           composed of 12 different species, showed a relatively small
and MCL clustering using OrthoFinder. Across the 53                   genomic fluidity (0.0619 6 0.0019) with limited variation, in-
Claviceps isolates and outgroups species Fusarium graminea-           dicating pairwise orthogroup dissimilarity between randomly
rum, F. verticillioides, Epichloe festucae, and E. typhina, we        sampled genomes was quite low. The amount of variation
identified 2,002 single-copy orthologs. We utilized a super-          between 12 different Claviceps species was similar to the var-
matrix approach to infer an ML species tree, based on these           iation between 24 C. purpurea s.s. isolates, however, the flu-
protein sequences. Results showed statistical support for four        idities were significantly different (P < 0.0001; supplementary
sections of Claviceps with a near concordant topology to the          table S5, Supplementary Material online). In comparison, the
Bayesian five-gene phylogeny in Pıchova et al. (2018). In           fluidity of section Pusillae (0.126 6 0.014; P < 0.0001;

6   Genome Biol. Evol. 13(2) doi:10.1093/gbe/evaa267 Advance Access publication 29 January 2021
Table 1
Assembly and Annotations Statistics for the Three Reference Claviceps Genomes and the 50 Claviceps Genomes Used in This Study
Organism Strain Section Host of Origin Read Genome Contig N50 Genomic TE Gene BUSCO Completeness
Coverage size (Mb) (#) GC (%) Content Count
Family/Tribe Genus/Species (%) Dikarya Sordario-
(%) myceta (%)
References
C. purpruea 20.1 Claviceps Triticeae Secale cereale — 32.1 1,442b 46,498b 51.6 10.9 8,703 95.30 94.70
C. fusiformis PRL1980 Pusillae Paniceae Pennisetum typhoideum — 52.3 6,930 19,980 37.3 47.5 9,304 96.70 94.90
C. paspali RRC1481 Paspalorum Paspaleae Paspalum sp. — 28.9 2,304 26,898 47.7 17.5 8,400 94.30 93.30
This study
C. purpruea Clav04 Claviceps Bromeae Bromus inermis 46 31.8 3,288 21,051 51.7 10.1 8,824 95.50 94.10
C. purpruea Clav26 Claviceps Triticeae Hordeum vulgare 59 30.8 1,361 49,697 51.7 9.1 8,737 97.70 96.50
C. purpruea Clav46 Claviceps Triticeae Secale cereale 58 30.8 1,409 49,302 51.7 9.7 8,597 98.00 96.60
Whole-Genome Comparisons of Ergot Fungi
C. purpruea Clav55 Claviceps Poeae Lolium perenne 59 30.7 1,525 44,299 51.8 9.8 8,480 97.10 95.90
C. purpruea LM4 Claviceps Triticeae Tricosecale 64 30.6 1,296 47,441 51.8 10.0 8,470 97.00 95.80
C. purpruea LM5 Claviceps Triticeae Hordeum vulgare 67 30.5 1,258 51,505 51.8 9.0 8,508 96.90 95.50
C. purpruea LM14 Claviceps Triticeae Hordeum vulgare 49 30.6 1,297 49,955 51.8 10.0 8,422 97.40 95.60
C. purpruea LM28 Claviceps Triticeae Triticum aestivum 49 30.6 1,343 51,635 51.7 9.6 8,713 97.30 96.10
C. purpruea LM30 Claviceps Triticeae Secale cereale 64 30.6 1,224 51,374 51.8 9.4 8,526 97.00 95.50
C. purpruea LM33 Claviceps Triticeae Secale cereale 45 30.5 1,398 44,564 51.8 9.2 8,557 96.30 95.50
C. purpruea LM39 Claviceps Triticeae Triticum turgidum subsp. durum 81 30.5 1,282 48,443 51.8 10.1 8,591 97.10 96.10
C. purpruea LM46 Claviceps Triticeae Triticum turgidum subsp. durum 79 30.6 1,291 50,932 51.8 9.6 8,455 97.00 95.80
C. purpruea LM60 Claviceps Poeae Avena sativa 81 30.6 1,259 47,464 51.7 9.3 8,498 97.00 95.80
C. purpruea LM71 Claviceps Poeae Alopercurus myosuroides 168 30.5 1,400 45,114 51.8 9.6 8,472 97.10 95.60
C. purpruea LM207 Claviceps Triticeae Elymus repens 53 30.5 1,352 45,388 51.8 9.2 8,475 97.00 95.70
C. purpruea LM223 Claviceps Bromeae Bromus riparius 74 30.8 1,297 46,577 51.7 10.5 8,438 97.00 95.70
C. purpruea LM232 Claviceps Poeae Phalaris canariensis 53 30.7 1,348 49,571 51.7 9.4 8,512 96.60 95.70
C. purpruea LM233 Claviceps Poeae Phalaris canariensis 49 30.6 1,331 50,327 51.8 9.9 8,717 96.70 95.90
C. purpruea LM461 Claviceps Triticeae Elymus repens 37 30.5 1,440 44,216 51.8 8.4 8,656 96.60 95.20
C. purpruea LM469 Claviceps Triticeae Triticum aestivum 75 30.5 1,257 48,403 51.8 10.0 8,394 97.30 96.00
C. purpruea LM470 Claviceps Triticeae Elymus repens 26 30.5 1,797 32,579 51.8 9.0 8,591 96.50 95.30
Genome Biol. Evol. 13(2) doi:10.1093/gbe/evaa267 Advance Access publication 29 January 2021
C. purpruea LM474 Claviceps Triticeae Hordeum vulgare 64 30.6 1,354 47,245 51.8 9.4 8,500 96.80 95.70
C. purpruea LM582 Claviceps Triticeae Secale cereale 89 30.7 1,600 39,003 51.8 9.6 8,518 97.20 95.40
C. aff. purpruea Clav52 Claviceps Poeae Poa pratensis 60 29.6 1,334 48,893 51.8 8.2 8,316 96.80 96.20
C. quebecensisa Clav32 Claviceps Triticeae Hordeum vulgare 64 28.7 1,068 58,118 51.6 4.5 8,232 98.00 96.60
C. quebecensisa Clav50 Claviceps Triticeae Elymus sp. 59 28.8 1,075 66,795 51.6 6.9 8,046 97.50 96.30
C. quebecensisa LM458 Claviceps Poeae Ammophila (plant) 78 28.4 1,166 45,693 51.6 6.1 8,055 97.10 95.80
C. occidentalisa LM77 Claviceps Poeae Phleum pratense 58 28.7 1,728 29,222 51.4 6.0 8,162 96.10 94.70
C. occidentalisa LM78 Claviceps Bromeae Bromus inermis 64 28.8 1,689 29,608 51.4 6.0 8,231 95.80 94.70
C. occidentalisa LM84 Claviceps Bromeae Bromus inermis 164 28.9 1,404 36,685 51.4 6.0 8,221 97.00 95.40
C. ripicolaa LM218 Claviceps Poeae Phalaris arundinacea 146 31.1 1,072 60,464 51.4 10.3 8,327 96.70 95.70
C. ripicolaa LM219 Claviceps Poeae Phalaris arundinacea 55 30.8 1,239 55,312 51.4 9.5 8,381 96.80 95.80
(continued)
GBE
78
Table 1 Continued
Organism Strain Section Host of Origin Read Genome Contig N50 Genomic TE Gene BUSCO Completeness
Coverage size (Mb) (#) GC (%) Content Count
Family/Tribe Genus/Species Dikarya Sordario-
Wyka et al.
(%)
(%) myceta (%)
C. ripicolaa LM220 Claviceps Poeae Phalaris arundinacea 91 30.9 1,223 54,100 51.4 9.3 8,449 97.10 95.90
C. ripicolaa LM454 Claviceps Poeae Ammophila breviligulata 156 31.2 1,508 40,844 51.4 8.4 8,562 97.10 96.10
C. spartinae CCC535 Claviceps Zoysieae Sporobolus anglicus 60 29.3 1,456 42,688 51.4 7.1 8,433 97.50 95.90
C. arundinis LM583 Claviceps Molinieae Phragmites australis 69 30.6 996 70,672 51.4 9.8 8,235 96.80 95.70
C. arundinis CCC1102 Claviceps Molinieae Phragmites australis 61 30.3 896 91,905 51.4 8.3 8,486 97.70 96.50
C. humidiphila LM576 Claviceps Poeae Dactylis sp. 77 31.2 1,236 55,717 51.5 9.9 8,440 97.00 95.90
C. perihumidiphilaa LM81 Claviceps Triticeae Elymus albicans 140 31.2 1,003 67,487 51.5 11.0 8,291 97.10 95.90
C. cyperi CCC1219 Claviceps Cyperaceae (family) Cyperus esculentus 56 26.6 1,921 27,113 51.7 8.9 7,673 97.70 95.40
C. capensis CCC1504 Claviceps Ehrharteae Ehrharta villosa 66 27.7 1,136 59,777 51.7 6.2 8,037 97.60 95.70
C. pazoutovae CCC1485 Claviceps Stipeae Stipa dregeana 61 27.6 1,304 42,785 51.7 6.8 7,941 97.50 96.00
C. monticola CCC1483 Claviceps Brachypodieae Brachypodium sp. 58 27.8 1,144 56,619 51.6 7.0 7,977 98.10 96.50
C. pusilla CCC602 Pusillae Andropogoneae Bothriochloa insculpta 52 45.9 5,068 15,010 40.4 42.1 8,735 90.90 88.30
C. lovelessii CCC647 Pusillae Eragostidinae Eragrostis sp. 53 41.1 5,300 12,480 42.1 33.9 8,862 91.60 88.20
C. digitariae CCC659 Pusillae Paniceae Digitaria eriantha 57 33.4 1,773 32,638 44.8 20.0 8,285 95.90 94.70
C. maximensis CCC398 Pusillae Paniceae Megathyrsus maximus 58 33.0 829 81,956 44.9 19.8 7,943 98.30 96.50
C. sorghi CCC632 Pusillae Andropogoneae Sorghum bicolor 60 35.6 3,660 16,225 44.4 30.4 8,208 89.90 87.10
C. africana CCC489 Pusillae Andropogoneae Sorghum bicolor 56 37.7 1,781 37,639 42.5 34.0 8,119 95.00 91.50
C. citrine CCC265 Citrinae Cynodonteae Distichlis spicata 64 43.5 4,772 16,294 41.5 51.7 7,821 92.20 88.20
NOTE.—TE content represented as percent of the genome masked by TEs.
a
Newly identified species (Liu et al. 2020).
b
The reference strain C. purpurea 20.1 was additionally assembled into 191 scaffolds with a scaffold N50 of 433,221.
Genome Biol. Evol. 13(2) doi:10.1093/gbe/evaa267 Advance Access publication 29 January 2021
GBEWhole-Genome Comparisons of Ergot Fungi GBE
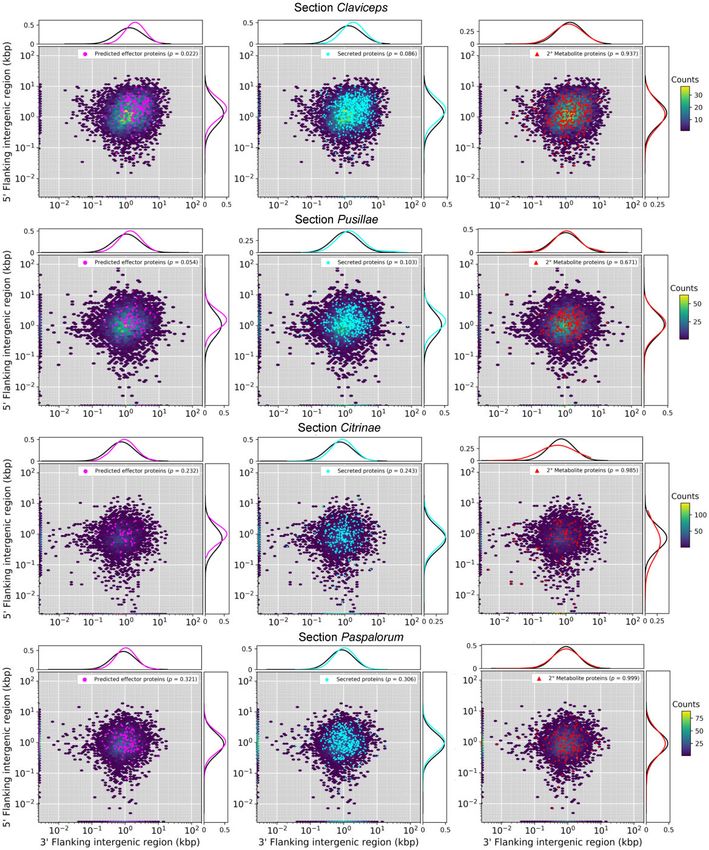
FIG. 1.—ML phylogenetic reconstruction of the Claviceps genus using amino acid sequences of 2,002 single copy orthologs with 1000 bootstrap
replicates. Pink dots at branches represent bootstrap values 95. Arrows and descriptions indicate potential changes in genomic architecture between
Claviceps sections identified in this study.
supplementary table S5, Supplementary Material online) was Overall, our ML phylogeny (fig. 1) and genome fluidity
two times greater than the fluidity of section Claviceps and analysis (fig. 2) indicate a large evolutionary divergence sep-
exhibited greater variation, indicating greater dissimilarities in arating section Claviceps. Our subsequent analyses of the
orthogroups between randomly sampled species of section genomic architecture of all Claviceps species examine fac-
Pusillae. tors that could be associated with the evolutionary
Genome Biol. Evol. 13(2) doi:10.1093/gbe/evaa267 Advance Access publication 29 January 2021 9Wyka et al. GBE
FIG. 2.—Genomic fluidity (dashed lines) for specified groups within the order Hypocreales. Species level groups contain multiple isolates of a given
species, whereas section and genus level groups contain one strain from representative species to remove phylogenetic bias. Shaded regions represent
standard error and were determined from total variance, containing both the variance due to the limited number of samples genomes and the variance due
to subsampling within the sample of genomes. Letters correspond to significant difference between fluidities determined through a two-sided two-sample z
test (P < 0.05; supplementary table S4, Supplementary Material online). Legend is in descending order based on fluidity, and names are additionally
appended to mean lines for clarity.
divergence of section Claviceps and those driving cryptic with 0% divergence suggesting very recent TE expansion
speciation. (fig. 3 and supplementary fig. S9, Supplementary Material
online). The TE landscape of C. cyperi showed a more striking
TE Divergences and Locations peak of divergence between 5% and 10% that more closely
resembled the TE divergences of sections Pusillae,
Due to variation in sequencing platforms that generated the
Paspalorum, and Citrinae. However, the content of the TE
genome data, we examined the relationship of sequence
peak in C. cyperi largely contained DNA, LINE, and unclassified
quality with predicted TE content to test for potential biases.
TEs as opposed to LTR’s (supplementary fig. S9,
Results identified two clusters of genomes with differing se-
Supplementary Material online).
quence qualities, which was determined to be a result of the To identify where genes were located in relation to TEs, we
sequencer used. Although these differences existed, analysis calculated the average distance (kb) of each gene to the clos-
of each cluster showed a lack of relationship between se- est TE fragment. This analysis was performed for predicted
quence quality and TE content (supplementary fig. S8, effectors, secreted (noneffector) genes, secondary metabolite
Supplementary Material online). In addition, section (nonsecreted) genes, and all other genes. Secreted genes and
Claviceps samples were sequenced with both sequencers predicted effectors of sections Claviceps and Pusillae species
and results were highly comparable between these samples were found to be significantly closer to TEs compared with
(reported below), indicating no sequence quality bias. other genes within each respective section (fig. 4;
TE divergence landscapes revealed an overrepresentation P < 0.0001), suggesting that these genes could be located
of LTR elements in sections Pusillae, Citrinae, and Paspalorum. in more repeat-rich regions of the genome. It should be noted
All three sections showed a similar large peak of LTRs with that we did observe a significant difference (P < 0.001,
divergences between 5% and 10% (fig. 3 and supplementary Welch’s test) in TE content between section Pusillae (32.5 6
fig. S9, Supplementary Material online), indicating a relatively 9.59%) and section Claviceps (8.79 6 1.52%). In both sec-
recent expansion of TEs. The landscapes of sections Pusillae, tions Claviceps and Pusillae, secondary metabolite genes were
Citrinae, and Paspalorum are in striking contrast to species of located farther away from TEs (fig. 4; P < 0.0001), that is,
section Claviceps that showed more similar abundances of repeat-poor regions of the genome. These trends hold true
LTR, DNA, LINE, SINE, and RC (helitron) elements. Species of for individual isolates, with a notable exception of C. pusilla
section Claviceps showed broader peaks of divergence be- (sect. Pusillae) showing no significant differences in the prox-
tween 5% and 30% but also showed an abundance of TEs imity of TEs to specific gene types (P > 0.12; supplementary
10 Genome Biol. Evol. 13(2) doi:10.1093/gbe/evaa267 Advance Access publication 29 January 2021Whole-Genome Comparisons of Ergot Fungi GBE
FIG. 3.—TE fragment divergence landscapes for representative species of each Claviceps section; C. purpurea 20.1 (sect. Claviceps), C. maximensis
CCC398 (sect. Pusillae), C. paspali RRC1481 (sect. Paspalorum), and C. citrina (sect. Citrinae). Stacked bar graphs show the nonnormalized sequence length
occupied in each genome (y axis) for each TE type based on their percent divergence (x axis) from their corresponding consensus sequence. Landscape for all
remaining isolates can be seen in supplementary figure S8, Supplementary Material online.
fig. S10, Supplementary Material online). Variation existed in gene density compartmentalization (i.e., clustering of genes
whether particular isolates had significant differences be- with differences in intergenic lengths) within each genome.
tween all other genes compared with secreted genes and Results showed that all 53 Claviceps strains exhibited a one-
secondary metabolite genes, but all species in sections compartment genome (lack of multiple compartments of
Claviceps and Pusillae (aside from C. pusilla) had predicted genes with different intergenic lengths). Although, there
effector genes located significantly closer to TEs (P < 0.003; was a tendency for more genes with larger intergenic regions
supplementary fig. S10, Supplementary Material online). No in sections Claviceps and Pusillae compared with sections
significant differences in the proximity of TEs to specific gene Citrinae and Paspalorum (fig. 5; supplementary fig. S11,
types were observed in sections Citrinae and Paspalorum Supplementary Material online).
(fig. 4; P > 0.11), suggesting that TE’s are more randomly To further clarify evolutionary tendencies, we evaluated
whether gene types showed a difference in their flanking
distributed throughout these genomes.
intergenic lengths compared with other genes within their
genomes. Results showed that predicted effector genes in
Gene Density Compartmentalization
section Claviceps had significantly larger intergenic flanking
To further examine genome architecture, we analyzed local regions compared with other genes, indicating they may re-
gene density measured as flanking distances between neigh- side in more gene-sparse regions of the genome (P < 0.04,
boring genes (intergenic regions) to examine evidence of fig. 5, supplementary fig. S11, Supplementary Material
Genome Biol. Evol. 13(2) doi:10.1093/gbe/evaa267 Advance Access publication 29 January 2021 11Wyka et al. GBE
FIG. 4.—Boxplot distributions of predicted effectors, secreted (noneffectors), secondary metabolite (nonsecreted) genes, and other genes (i.e., genes
that are not effectors, secreted, or secondary [2 ] metabolite genes) in Claviceps sections showing the mean distance (kb) of each gene to the closest TE
fragment (50 and 30 flanking distances were averaged together). Kruskal–Wallis (P value: *Whole-Genome Comparisons of Ergot Fungi GBE
FIG. 5.—Gene density as a function of flanking 5’ and 3’ intergenic region size (y- and x axis) of representative isolates of each of the four sections within
the Claviceps genus; C. purpurea 20.1 (sect. Claviceps), C. maximensis CCC398 (sect. Pusillae), C. paspali RRC1481 (sect. Paspalorum), and C. citrina (sect.
Citrinae). Colored hexbins indicate the intergenic lengths of all genes with color code indicating the frequency distribution (gene count) according to the
legend on the right. Overlaid markers indicate specific gene types corresponding to legends in the top right within each plot. Line graphs (top and right of
each plot) depict the frequency distributions of specific gene types (corresponding legend color) and all other genes not of the specific type (black). For
visualization purposes, the first genes of contigs (50 end) are plotted along the x axis and the last gene of each contig (30 end) are plotted along the y axis. For
information on statistical test, see Methods and for plots of all remaining isolates see supplementary figure S10, Supplementary Material online.
Genome Biol. Evol. 13(2) doi:10.1093/gbe/evaa267 Advance Access publication 29 January 2021 13Wyka et al. GBE
FIG. 6.—Representative isolates of each Claviceps species showing the fraction of Blast hits at a given % identity (y axis) within each isolate (z axis) at a
given percent identity (x axis) from the second closet BlastP match of proteins within each isolate’s own genome. Two C. purpruea s.s. isolates are shown to
compare a newly sequenced genome versus the reference.
of the pairs were located next to each other, indicating signs of effectors, secreted (noneffector) orthogroups, and
tandem gene duplication within the section (supplementary orthogroups encoding genes with conserved domains (fig. 7
table S6, Supplementary Material online). C. cyperi showed and supplementary figs. S13 and S14, Supplementary
the smallest proportions of highly similar tandem genes Material online). Transmembrane orthogroups also showed
(7.77% and 5.7%) compared with other species within sec- evidence of expansion with several isolates having five to
tion Claviceps. Additional variations in the proportions of ten genes. Orthogroups with secondary metabolite genes
highly similar tandem genes between other species of section showed the lowest amount of expansion (supplementary
Claviceps were not evident as these proportions appeared to fig. S15, Supplementary Material online). Overall, section
vary more between isolate than species (supplementary table Claviceps showed expansion in a greater number of
S6, Supplementary Material online). orthogroups than section Pusillae, Citrinae, and Paspalorum
in all categories except transmembranes (supplementary fig.
Gene Cluster Expansion S15, Supplementary Material online). Orthogroups with an
The proteome of Claviceps genomes were used to infer average greater than or equal to five genes per isolate, within
orthologous gene clusters (orthogroups) through protein ho- section Claviceps, contained a variety of functional proteins,
mology and MCL clustering using OrthoFinder. Our results with generally more proteins encoding protein/serine/tyrosine
revealed evidence of orthogroup expansion within section kinase domains (supplementary table S9, Supplementary
Claviceps as species contained more genes per orthogroup Material online). Additional details can be obtained from sup-
than species of the other three sections (supplementary fig. plementary tables S10 (ordered orthogroups corresponding
S12, Supplementary Material online). To identify the types of to heatmaps; fig. 7 and supplementary figs. S13 and S14,
gene clusters that were showing putative expansion, we fil- Supplementary Material online), S11-1, and S11-2,
tered our clusters by following two criteria: 1) at least one Supplementary Material online (orthogroups identification
isolates had two or more genes in the orthogroup and 2) and functional annotation of all proteins).
there was a significant difference in the mean number of Within section Claviceps patterns of gene counts per
genes per orthogroup between all 44 isolates in section orthogroup appeared to break down and contain variations
Claviceps and the 9 isolates from sections Pusillae, Citrinae, in the number of genes per orthogroups with some presence/
and Paspalorum (a 0.01, Welch’s test). absences occurring between isolates and species. Notably,
Overall, we identified 863 (4.7%) orthogroups showing C. cyperi (CCC1219) showed the lowest amount of expan-
putative expansion. We observed extensive expansion sion, across all taxa, in comparison with other species of sec-
(orthogroups with observations of greater than or equal to tion Claviceps. In addition, C. spartinae (CCC535), C. capensis
ten genes per isolate) present in many unclassified, predicted (CCC1504), C. monticola (CCC1483), C. pazoutovae
14 Genome Biol. Evol. 13(2) doi:10.1093/gbe/evaa267 Advance Access publication 29 January 2021Whole-Genome Comparisons of Ergot Fungi GBE
FIG. 7.—Heatmap of gene counts in orthogroups for all 53 Claviceps strains ordered based on ML tree in figure 1 and separated by sections.
Orthogroups are separated based on their classification and are only represented once (i.e., secondary [2 ] metabolite orthogroups shown are those
that are not already classified into the effector or secreted orthogroups) and are ordered based on hierarchical clustering, see supplementary table S9,
Supplementary Material online, for list of orthogroups corresponding to the order shown in the heatmaps. The host spectrum (right) is generalized across
species, as no literature has determined the existence of race specific isolates within species, is shown on the left side of the figure determined from literature
review of field collected samples (Supplementary Material in Pıchov a et al. 2018) and previous inoculation tests Campbell (1957) and Liu et al. (2020). For
heatmap of conserved domains, see supplementary figure S12, Supplementary Material online, and for unclassified gene families, see supplementary figure
S13, Supplementary Material online.
(CCC1485), C. occidentalis (LM77, 78, 84), and less adaptable) in narrow host-range Claviceps species (sects.
C. quebecensis (LM458, Clav32, 50) also showed lower ex- Citrinae and Paspalorum) toward aspects that are character-
pansion (fig. 7, supplementary figs. S13 and S14, istic of a two-speed genome (i.e., more adaptable) in broader
Supplementary Material online). However, no patterns were host-range lineages of sections Pusillae and Claviceps (fig. 1;
observed linking the variation in expansions with the literature Dong et al. 2015; Frantzeskakis et al. 2019).
determined host range of different species within section The oldest divergent species of the genus (Pıchova et al.
Claviceps. 2018), C. citrina (sect. Citrinae) and C. paspali (sect.
Paspalorum), are characterized by a proliferation of TEs, par-
ticularly LTRs, which do not appear to be colocalized around
Discussion particular gene types (fig. 4). Coupled with a lack of large-
Our comparative study of 50 newly annotated genomes from scale genome compartmentalization (fig. 5), these two spe-
four sections of Claviceps has provided us with an enhanced cies can be considered to fit with aspects of a one-speed
understanding of evolution in the genus through knowledge genome which are often considered to be less adaptable
of factors associated with its diversification. Our results have and potentially more prone to being purged from the biota
revealed that despite having nearly identical life strategies, (Dong et al. 2015; Frantzeskakis et al. 2019). This could help
these closely related species have substantially altered geno- explain the paucity of section lineages and restricted host
mic architecture and plasticity, which may drive genome ad- range to one grass tribe, as similar patterns of large genome
aptation. One key difference we observe is a shift from size, abundant TE content, and equal distribution of TEs has
aspects that are characteristic of a one-speed genome (i.e., been observed in the specialized barley pathogen Blumeria
Genome Biol. Evol. 13(2) doi:10.1093/gbe/evaa267 Advance Access publication 29 January 2021 15Wyka et al. GBE graminis f.sp. hordei (Frantzeskakis et al. 2018). Although, Faino et al 2015, 2016; Seidl et al. 2015). Despite the number of rapid adaptive evolution within B. graminis f.sp. hordei, has studies that suggest this role of TEs in genome evolution, been suggested to occur through copy-number variation and/ there has been limited evidence for the mechanism by which or heterozygosity of effector loci (Dong et al. 2015; TEs drive evolution in filamentous pathogens. However, stud- Frantzeskakis et al. 2018, 2019). Our results show a lack of ies incorporating improved genome assemblies of multiple gene duplication occurring in sections Citrinae and individuals of a species along with transcriptome data have Paspalorum likely due to the presence of RIP-like mechanisms. been able to demonstrate that transcriptionally active TEs However, even with the presence of RIP-like mechanisms, were observed in lineage-specific regions of the plant patho- there was a high LTR content in these species (fig. 3). This gen Verticillium dahliae (Amyotte et al. 2012; Faino et al. suggests that these LTR elements have found a way to avoid 2016), resulting in genomic diversity through large scale dupli- RIP-like mechanisms or indicate that these species harbor a cations in these lineage-specific regions (Faino et al. 2016). less active version of an RIP-like mechanisms as is found in This also lead to the frequent loss of the effector Ave1 in several fungal species (Kachroo et al. 1994; Nakayashiki et al. populations of V. dahliae, which is located in a TE-rich line- 1999; Graı̈a et al. 2001; Ikeda et al. 2002; Chalvet et al. 2003; age-specific region (de Jonge et al. 2012). Kito et al. 2003). Nonetheless, due to the high abundance of Although we did not have transcriptome data to determine TEs (fig. 4) and presence of RIP (fig. 6 and supplementary how many of the TEs are transcriptionally active, our data do tables S6 and S7, Supplementary Material online), we hypoth- show that most of the repetitive elements in section Claviceps esize that aspects of RIP-like “leakage” could be a likely mech- species have very low nucleotide divergence (
You can also read