No. 1135 2020 - Banco de la República
←
→
Page content transcription
If your browser does not render page correctly, please read the page content below
Misallocation of the Immigrant
                                                                                                     Workforce: Aggregate Productivity
                                                                                                     Effects for the Host Country

                                                                                                     By: José Pulido
                                                                                                         Alejandra Varón

                                                                                                                                No. 1135
                                                                                                                                    2020

Bogotá - Colombia - B ogotá   - Bogotá - Colombia - Bogotá - Colombia - Bogotá - Colombia - Bogotá - Colombia - Bogotá - Colombia - Bogotá - Colombia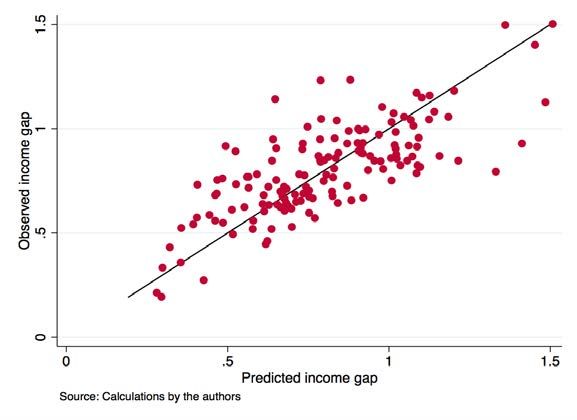
Misallocation of the Immigrant Workforce: Aggregate
                   Productivity Effects for the Host Country⇤
                                 José Pulido† and Alejandra Varón‡

The opinions contained in this document are the sole responsibility of the authors and do not commit
Banco de la República or its Board of Directors.

                                                Abstract

        Mass migrations can impact the amount of labor misallocation in the host country if im-
        migrants, relative to natives, face more frictions that prevent them from working in their
        preferred occupations. The resulting misallocation would imply an aggregate productiv-
        ity loss in the short run while migration occurs, but an subsequent lapse of productivity
        growth when the immigrants start to be assimilated by the labor market. We study the
        case of Colombia during 2015-2019, a period when the country received a massive inflow
        of migrants from Venezuela. Through the lens of a Roy model of occupational choice
        with two types of frictions - discrimination and barriers preventing workers from choos-
        ing their preferred occupations - we quantify the extent of occupational misallocation
        for immigrants, and its implications for Colombian aggregate labor productivity. Our
        estimates indicate that both type of frictions significatively misallocate Venezuelan immi-
        grants. Removing those frictions would lead at least one third of immigrants to reallocate,
        permanently increasing Colombian aggregate productivity by 0.9%.

        Keywords: Immigration, misallocation, Roy model, discrimination, productivity.
        J.E.L. Classification: F22, O15, J61, O24.

  ⇤
    We would like to thank Hernando Vargas and Juan Ospina for helpful comments and suggestions. All
errors are ours.
  †
      Corresponding author, Banco de la República, Colombia. E-mail: jpulidpe@banrep.gov.co.
  ‡
      Universidad de los Andes, Colombia. E-mail: ma.varon10@uniandes.edu.co.

                                                     1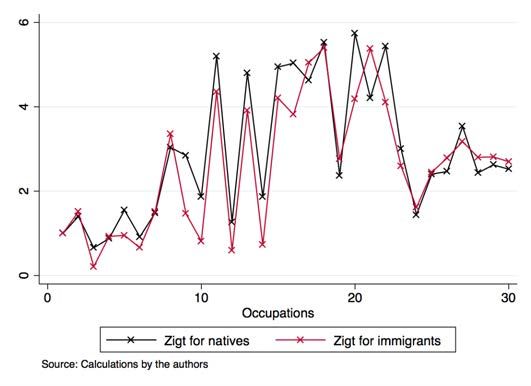
Asignación Ineficiente de la Fuerza Laboral Migrante: Efectos
         sobre la Productividad Agregada del País de Destino⇤
                                 José Pulido† and Alejandra Varón‡

Las opiniones contenidas en el presente documento son responsabilidad exclusiva de los autores y no
comprometen al Banco de la República ni a su Junta Directiva.

                                                 Resumen

        Las migraciones masivas pueden aumentar la ineficiencia en la asignación del trabajo en
        el país anfitrión si los trabajadores inmigrantes, en relación con los nativos, enfrentan más
        fricciones en el mercado laboral que les impidan trabajar en sus ocupaciones deseadas.
        La mala asignación resultante genera una pérdida de productividad agregada en el corto
        plazo mientras la migración ocurre, pero un crecimiento posterior cuando los inmigrantes
        se asimilen en el mercado laboral. En este artículo estudiamos el caso de Colombia du-
        rante 2015-2019, un período en el que el país recibió una afluencia masiva de migrantes
        desde Venezuela. A partir de un modelo de Roy de elección ocupacional con dos tipos
        de fricciones – discriminación laboral y obstáculos que obligan a los trabajadores a elegir
        ocupaciones distintas a las de su preferencia – cuantificamos el grado de mala asignación
        del trabajo de los inmigrantes y sus implicaciones sobre la productividad agregada laboral
        colombiana. Nuestras estimaciones indican que ambos tipos de fricciones generan asigna-
        ciones ocupacionales ineficientes para los migrantes, y que al eliminar dichas fricciones al
        menos una tercera parte de los trabajadores migrantes cambiaria de ocupación, lo que
        incrementaría la productividad colombiana en un 0.9 % de forma permanente.

        Palabras clave: Migración, asignación ocupacional, modelo de Roy, discriminación, pro-
        ductividad.
        Clasificación J.E.L.: F22, O15, J61, O24.

  ⇤
    Agradecemos a Hernando Vargas y a Juan Ospina por sus comentarios y sugerencias. Todos los errores
son nuestros.
  †
      Autor correspondiente, Banco de la República, Colombia. E-mail: jpulidpe@banrep.gov.co.
  ‡
      Universidad de los Andes, Colombia. E-mail: ma.varon10@uniandes.edu.co.

                                                     1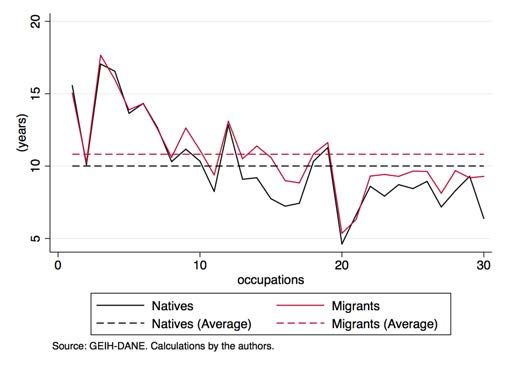
1        Introduction
Studies on the impacts of immigration on the host countries’ labor markets have usually
focused either on the process of immigrants assimilation or the possible displacement effects for
natives workers.1 An issue with macroeconomic implications that has been under-explored in
the literature is the impact of immigrants on the destination country’s aggregate productivity
through their effect on the extent of misallocation in the labor market of the host country. If
immigrants, relative to natives, face more frictions that prevent them from working in their
preferred occupations, immigration might increase overall occupational misallocation, resulting
in a loss of aggregate productivity due to the implied worsening of allocative efficiency.2 In
cases of massive immigration flows, this channel might generate sizable implications for the
macroeconomic performance of the destination country.
        The purpose of this paper is to assess whether this occupational misallocation is effectively
larger for immigrants in a period of mass migration, and to derive its implications for the
aggregate productivity of the host country. We study the case of Colombia during 2015-2019,
a period when the country received a massive inflow of migrants from Venezuela, its main
neighbor country. Over this time interval, the Latin America region witnessed an exodus
of over 4.5 million Venezuelans, as a result of the country’s economic and governance crisis.
Neighboring Colombia was, by far, the main receptor of those migrants: By 2019, the country
hosted around 2 millions of immigrants, leading to an important increase in its workforce, as
high as 4.6%.
        Using the Colombian household survey, we begin our study by documenting some facts
that could suggest a greater amount of occupational misallocation for Venezuelan migrants
relative to non-migrants. First, we show that although immigrants have on average more years
of education than non-migrants, they tend to work in occupations with lower requirements of
education relative to non-migrants.3 Further, when we factor out differences in educational
attainment and other observable characteristics, we find significant residual income gaps for
immigrants. We show these gaps are the result of both a composition effect of observationally
equivalent immigrants working more in occupations with lower remunerations relative to non-
migrants, and of the presence of within-occupations gaps. In addition, the residual income-gaps
are time-variant and positively correlated with the fraction of immigrants in the workforce.
    1
     For an extensive literature review of the empirical studies until the the early 1990s see Borjas (1994); and
for the empirical studies for more recent years, see Kerr and Kerr (2011).
    2
    The literature on resource misallocation emphasizes that, given some amount of factors endowments, the
micro-level misallocation of these factors across heterogeneous uses generates sizable losses in aggregate TFP.
For an extensive review of this literature from the perspective of heterogeneous firms, see Restuccia and
Rogerson (2013) or Hopenhayn (2014).
    3
    This educational mismatch, where migrant workers are “overeducated” (i.e., their schooling level is greater
than is typical for workers in each occupation) is commonly observed in the cases of high-skilled migration.
For a summary of evidence, see McDonald and Worswick (2015) and Borjas, Chiswick and Elsner (2019).

                                                       1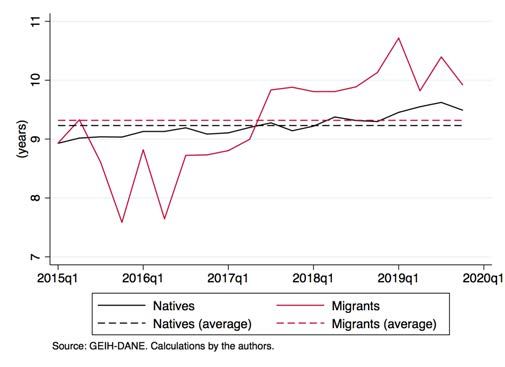
Recent literature suggest that in a context where workers self-select into different sectors or
occupations, residual-income gaps by themselves do not provide enough information about the
presence of frictions or lack thereof (Hsieh et al., 2019; Pulido and Święcki, 2020). However,
taken together, findings in earnings and occupational allocations can discipline a structural
model to explore whether immigrants, relative to natives, might have been facing additional
frictions preventing them from working in their preferred occupations. If true, the possibility
that the massive inflow of Venezuelan migrants could impact Colombian aggregate productivity
is not negligible. For this reason, we continue by guiding our analysis through the lens of a
standard Roy’s (1951) model of occupational choice. Within the model every worker is born
with different draws of non-observable skills across occupations and are endowed with a certain
amount of human capital, obtained before the period of migration. Each worker then chooses
the occupation where she gets the highest indirect utility given her skills and human capital
endowment.
       We allow for two types of frictions that prevent migrant workers to choose their preferred
occupations. First, we introduce pure discrimination in the labor market. Similar to Hsieh
et al. (2019), discrimination takes the form of an occupation-specific wedge between marginal
products and wages, a specification that is intended to capture the standard formulations of
employer taste for discrimination in the literature (Becker, 1971; Altonji and Blank, 1999).
Second, we allow that even after taking into account the implicit discrimination, immigrants
are forced to make involuntary occupational choices in a different proportion than natives.4
This could be consequence of additional potential obstacles that immigrants face to find a
job in their desired occupations, including lack of professional connections or networks, issues
with the recognition of educational degrees or difficulties to obtain permits to work legally. As
in Pulido and Święcki (2020) we represent the extent of these barriers indirectly, by assuming
that a fraction of workers in each period is forced to work in occupations other than the desired
ones (randomly assigned), and by allowing these fractions to be different between native and
immigrants workers.
       We identify the extent of both types of frictions using the implications of our self-selection
model for the occupational residual income gaps of immigrants. In the model, those gaps
depend both on the relative occupational allocations of immigrants, reflecting how workers
sort across occupations, and on the frictions each group of workers faces in the labor market.
In this way, we are able to isolate the component of the immigrants’ residual income gaps
that only depends on frictions to assess how extensive those frictions are in the labor market.
We find discriminatory wedges have a considerable dispersion among occupations, suggesting
potential gains from reallocating workers across occupations when we remove those wedges.
Further, we find that the proportions of immigrants in each period who are forced to make
   4
    In our model, we use the word “natives” to refer to the group of non-migrants. But it is worth to mention
that in the earlier years a significant proportion of immigrants were return migrants (born in Colombia).

                                                     2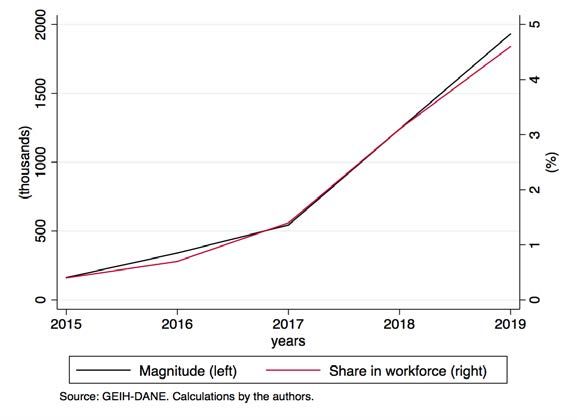
involuntary choices tend to grow over time, coinciding with the rise in the immigration rate,
increasing from 5% in 2015 to 9% in 2019. These values are larger than the obtained for native
workers (4.7%).
   Once our frictions are inferred, we conduct two counterfactual exercises to evaluate their
quantitative importance. In the first, each set of frictions for immigrants is entirely removed.
This a drastic reform in which all immigrants choose occupations according to their efficient
allocation, an exercise that allows us to understand the relative importance of each set of
frictions. We find that removing entirely both types of frictions would lead at least one
third of immigrants to reallocate, and because it triggers general equilibrium effects, it also
causes a small reallocation of natives, around 0.4% of their workforce. The reallocation of the
entire workforce rises total output by as much as 0.9%, a result that is due to the increase in
aggregate productivity by improving allocative efficiency among occupations. By decomposing
the contribution of each type of frictions, we find that discrimination accounts for around two-
thirds of the total gains from the extreme reform of eliminating all frictions, and involves
stronger general equilibrium effects than the frictions that force workers to choose random
allocations.
   Our second counterfactual consists in equalizing immigrants’ frictions to those inferred
for natives. This reform provides a calculation of the aggregate productivity gains when
immigrants are assimilated by the labor market, i.e. when they face the same extent of
frictions than natives. By this way, this exercise offers a crude quantification of the aggregate
implications of different programs that help immigrants to compete in the labor market under
the same conditions than native workers, a valuable input from the viewpoint of policy analysis.
Our results suggest that reducing immigrants frictions to a similar level to the inferred for
natives would lead at least 9% of immigrants to reallocate, and as result, aggregate productivity
would increase as much as 0.4%. Finally, we show that our macroeconomic gains from our
counterfactual exercises are robust to non-trivial variations in the calibrated parameters and
to alternative specifications of our model.

   Related literature

   Our paper contributes to the recent literature that quantitatively evaluates the role of
misallocation of heterogeneous workers across sectors, locations or occupations in a context of
self-selection (Lagakos and Waugh, 2013; Adamopoulos et al., 2017; Hsieh et al., 2019; Bryan
and Morten, 2019; Pulido and Święcki, 2020). This quantification is usually tackle with a
framework that encompasses a Roy’s (1951) type model augmented by micro-level frictions.
We apply this setting to study the extent of occupational misallocation of immigrants and its
consequences on the host country’s aggregate productivity, but our approach can be extended
to study discrimination between more groups of workers, for example. Mainly, our specification
borrows elements from the models used by Hsieh et al. (2019) and Pulido and Święcki (2020)

                                               3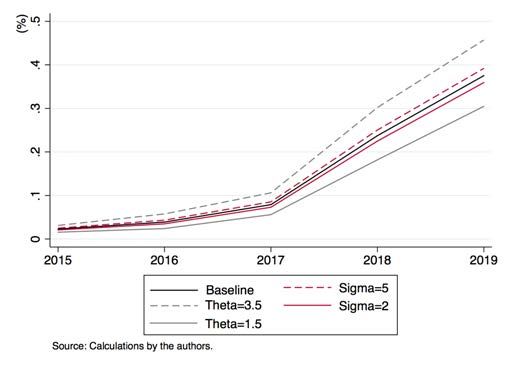
for studying the allocation of all workers across occupations and sectors, respectively. As in
these papers, we emphasize that reduced-form findings in income-gaps alone are not enough
statistics to distinguish between sorting and misallocation. Hence, to make inferences about
the extent of misallocation is necessary to nourish the empirical findings with the guidance of
a structural model.
   From the perspective of the migration literature, although the educational mismatch of
immigrants to jobs within local labor markets in cases where migrants are more educated on
average than natives is well documented (Chiswick and Miller, 2011; Nielsen, 2011; Joona,
Gupta and Wadensjö, 2014; McDonald and Worswick, 2015; Borjas, Chiswick and Elsner,
2019), the exploration of the macroeconomic implications of this type of mismatch (or sim-
ilar misallocations) has been less studied. Some recent studies address the consequences for
aggregate efficiency of the degree of matching of immigrants and local firms. For example,
using French matched employer-employee data, Orefice and Peri (2020) document that since
immigrants have a larger dispersion on productivities, they increase the positive assortative
matching between firms and workers. In the same vein, Burzynski and Gola (2019) illustrates
that immigration may trigger a similar sorting mechanism in the host country using a model
where two types of workers draw country-specific skills from different sets. Our paper con-
tributes to this branch of literature using a different modeling approach. Instead of assuming
immigrants are intrinsically different than natives because their skills are drawn from distri-
butions with different attributes, we assume immigrants are misallocated due to the inherent
frictions they face in the destination labor market. In the light of the Venezuelan migration to
Colombia, where immigrants are culturally close to natives (both countries share a common
language and demography and have similar average income and historical background, among
other features), our approach seems to be more appropriate.
   In broader terms, our paper aims to enrich the migration literature that explores macroe-
conomic effects in the host country beyond the usual short-term impacts on the labor market
outcomes for natives. Particularly, we contribute to a body of work looking at the effects of
immigration on aggregate productivity (Peri, 2012; Lewis, 2013; Hornung, 2014; Ortega and
Peri, 2014; Aleksynska and Tritah, 2015). This literature usually highlights channels such as
changes in the demographic composition of the workforce, shifts in firms’ production func-
tions, and the boost to innovation and total factor productivity growth; see Nathan (2014)
for a review. Compared with these studies our research focus instead on a pure allocative
mechanism, i.e. the way immigration shapes how total labor allocates across heterogeneous
occupations, a channel that could also have sizable impacts on aggregate productivity, as the
recent misallocation literature suggests.
   Moreover, since a type of our differentiated frictions for immigrants can be rationalized
as discriminatory preferences, our study also talks to the literature on discrimination for
immigrants. Studies with evidence supporting the existence of such discrimination include
Rydgren (2004) for Sweden, Oreopoulos (2011) for Canada, and Weichselbaumer (2017) for

                                               4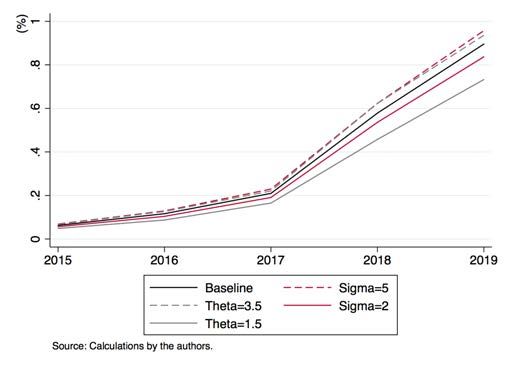
Austria. One of the findings in this studies is that although statistical discrimination (due to
stereotypical thinking) seems to contribute to the phenomenon, there is also an component
that can be driven by employers’ preferences against working with minority group members,
the way we choose here to model discrimination.
        Finally, this study belongs to a collection of recent papers which have used the Venezue-
lan exodus to assess its consequences for the Colombian economy: Rozo and Vargas (2018),
Peñaloza (2019), Santamaria (2019), Caruso, Gomez Canon and Mueller (2019), Bonilla-Mejía
et al. (2020), Knight and Tribín-Uribe (2020) and Bahar, Ibañez and Rozo (2020). With ex-
ception of Rozo and Vargas (2018) and Knight and Tribín-Uribe (2020), who explore electoral
and crime outcomes respectively, the remaining works mainly investigate consequences of
Venezuelan migration on the Colombian labor market, focusing on natives and immigrants
wages, unemployment and participation rates. Their results, in line with the findings in the
migration literature, show relatively minor displacement effects from immigration in terms of
total earnings and employment for native workers; being the moderate effects mainly due to ad-
justments in the informal segment. Further, granting work permits to Venezuelan immigrants
do not seem to have generated short run impacts on labor outcomes.
        The organization of this paper is as follows. Section 2 presents our empirical motivation.
Section 3 introduces our Roy model of occupational choice with two groups of workers and
frictions for immigrants. Section 4 discusses the procedure that allows us to infer the magni-
tude of the frictions and presents our baseline results. Section 5 performs our counterfactual
exercises of suppressing frictions for migrants, and equating them to those of native workers.
We also evaluate some departures from the baseline model. Finally, section 6 concludes.

2        Empirical motivation and data
The roots of the “Venezuelan exodus” lay in the country’s economic and political turmoil that
began at the end of the presidency of Hugo Chávez and was exacerbated during the pres-
idency of Nicolás Maduro. Both governments were characterized by the implementation of
a series of socialist reforms that included economic policies such as land expropriations, na-
tionalizations, price and currency controls and systematic restrictions on private businesses
(Vera, 2015; Gutiérrez S., 2017). These policies, coupled with political mismanagement and
an international outlook in 2014 with a downfall in oil prices (Venezuela’s main export com-
modity), led the country to suffer by 2015 the worst economic crisis in its history.5 The crisis
was marked by hyperinflation and shortages of food and medicine and looting; that led to
an escalation of starvation, disease, crime and mortality rates; a combination of factors that
triggered Venezuelan migration (Mauricia, 2019; O’Neil, 2019).
        According to the UN Refugee Agency (UNHCR) from 2015 to 2019 an estimated of 4.5
    5
    And the worst facing a country that is not experiencing war since the mid-20th century (Kurmanaev,
2019).

                                                  5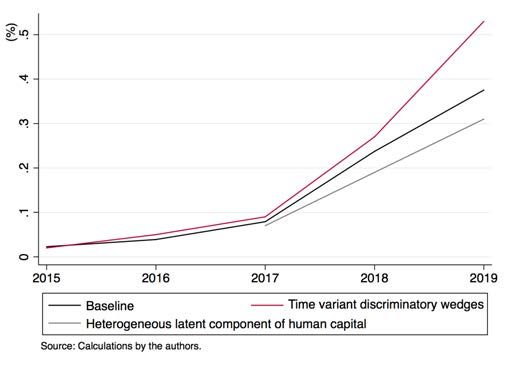
million people fled Venezuela.6 Colombia, Venezuela’s main neighbor, was by far the main
receptor of Venezuelan migrants. According to the Colombian household survey, where our
data comes from (for a detailed description of our database see Appendix A.1), by 2019 the
country hosted around 2 millions of Venezuelan immigrants.7 For the Colombian labor market,
with a size of around 23.6 million economically active population before the migration started,
this massive inflow of migrants implied a significant expansion of the workforce. Figure 1
shows the inflow of Venezuelan immigrants and their participation in the workforce. Since
2015 immigrants’ share in the workforce have steadily risen up, to reach 4.6% in 2019.
       On average, Venezuelan migrants report more years of education than non-migrants, a
pattern that was accentuated since 2017. Table A.1 in the Appendix displays some demo-
graphic characteristics (shares of males and average age and years of schooling) for migrants
and non-migrants, both in the whole household survey and in our restricted sample, which
includes only employees. Differences in average schooling years are evident in those two those
samples but are even present only for adults 25 years and older (see Panel A of Figure 2), a
comparison that aims to control for the age composition of the migrant population, which is
more biased towards people in productive ages.
       In spite of their higher educational attainment, Venezuelan migrants tend to work in oc-
cupations with lower requirements of skills relative to non-migrants. We consider the 30 most
representative occupations in the survey (for a description of the occupations see Appendix
A.2). Broadly speaking, the average years of education of workers in each occupation tends to
decrease with the value of the occupation code: the first quintile of codes is related to high-
skilled or “cognitive” occupations, whereas the fifth quintile is related to low-skill or “manual”
occupations. Migrants have higher levels of education than no-migrants across most occupa-
tions (see Panel B of Figure 2 ), but, compared to non-migrants, their occupational allocation
is more concentrated in the middle and the right side of the distribution, i.e. into occupations
other than those with high skills requirements (Figure 3).
       We also find there are important and significant residual (controlling for observables) in-
come gaps for migrants. These gaps are estimated by using Mincerian regressions with the
following general form:

                                lnYislt = Xit + Ii + Dl + Dt + "islt                                     (1)

where Yislt denotes a measure of labor income of individual i in occupation s, province l, and
quarter t; Xit refers to a series of individual controls that include gender, work experience,
   6
    Relative to other major migration waves seen in recent history, the magnitude of Venezuela’s migration is
only smaller than the originated by the Syrian war (5.6 million).
   7
     It is worth to say that given the large amount of irregular migrant inflows, (i.e. immigrants without
legal documentation), household surveys would offer a more accurate picture about the dimension of the
phenomenon than records of the migration authorities. Nevertheless, a comparison of the estimates between
both sources, in which migration authorities compute the amount of irregulars by imputation procedures, show
similar magnitudes for the total migrants flows (Tribin-Uribe, 2020).

                                                     6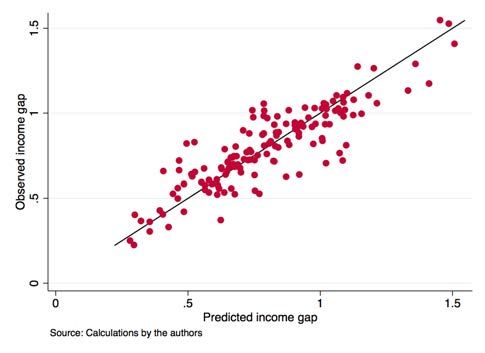
work experience squared and in most specifications years of education, plus an indicator of
whether the household is in a rural area; Dl and Dt are province and time fixed effects; and
Ii is an indicator of whether individual i is migrant, so            captures the migrant premium of
interest. Robust standard errors are clustered at the municipality level. Our preferred measure
of labor income is one that includes both wages and fringe benefits for salaried workers, and
net-profits from personal business in the case of non-salaried or self-employees.8
       Columns (1)-(3) of Table 1 report the results from estimating equation (1) using our
preferred measure of labor income. Before factoring out differences in educational attainment,
column (1) shows that migrants on average perceive a residual labor income 39.8 log points
[lp.] (or 49%) lower than non-migrants. Once we compare workers with similar years of
education, column (2) shows that the premium decreases to 33.6 lp. (or 40%), a magnitude
still considerable.9
       A natural question is whether the latter premium is explained only by the different alloca-
tion of migrants across occupations, or whether non-migrants are also paid more in the same
occupations. For this, column (3) of Table 1, reports the premium controlling for occupation
fixed-effects. On average, the within-occupation premium is 21.7 lp., decreasing 12 lp. with
respect to the premium without controlling for occupation fixed-effects. The fact that the
within-occupation premium exists, but it is significatively lower than the premium in column
(2), suggest us that both explanations play a role. Hence the income-gap for migrants is con-
sequence not only of the composition effect of more migrants with similar observables working
in occupations with lower remunerations relative to non-migrants, but also of the presence
of within-occupations premia. Table 2 shows that these within-occupation premia, which are
going to play a key role in identifying the magnitude of both frictions in our structural model,
are heterogeneous across occupations and statistically significant (at 5% level or lower) in the
case of 26 of our 30 occupations.
       Two additional facts are worth noting. First, the reported income-gaps are not only the
result of a different allocation of immigrants between the formal (salaried) and the informal
(non-salaried) sector,10 but also of the existence of intra-sectoral premia. For example, consider
only the formal sector, where the labor income measure might be more accurate. Columns (4)-
(6) of Table 1 use only salaried workers and shows that the reported premia remain and their
magnitudes are even magnified in the formal sector. This result is not surprising since, in light
   8
    Fringe benefits include extra-legal premiums, overtime pay, transportation subsidies, etc. Appendix A.3
depicts a brief summary of the different possible measures of labor income that can be obtained from the
survey.
   9
    Notice that although immigrants have on average more years of education, the premium in the residual
income decreases when we control for education. This outcome is due to the composition of the migrants
population across observables, effect that is absorbed by the whole set of controls. Without any control, the
premium for migrants in total income is 27 lp., while controlling only for education is 5 lp. higher.
  10
    In Colombia, in spite of the fact that the rate of informal work has decreased (at least until the end of
2019), informal workers still account in 2019 for almost half of the labor force.

                                                     7
of our findings, part of the income gaps are due to the additional frictions that immigrants
face. Such barriers might be more pronounced in the formal sector, for example, in the case
of the recognition of educational degrees, or the difficulties to obtain permits to work legally.
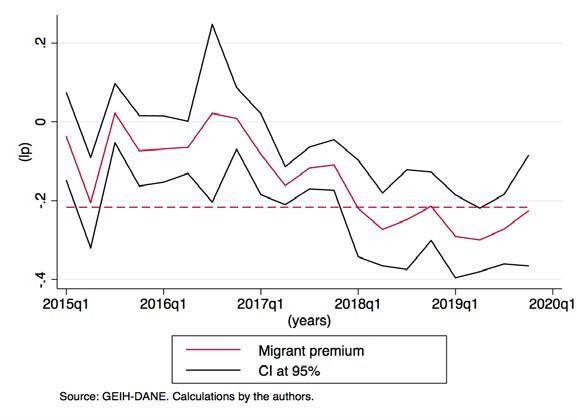
Second, the residual income-gaps are time-variant and are correlated with the magnitude of
migration. Figure 4 shows the evolution of the migrant premium for each cross section in our
data, and its 95% confidence interval. The residual income-gap is not statistically significant
until the end of 2016. Starting in early 2017, and coinciding with the sudden increase in the
migration inflows (Figure 1), the migrant premium becomes statistically significant and its
magnitude begins to increase over time, to start to stabilize around 0.21 lp. in 2019. This
temporal evolution suggests some correlation between the immigrants and the magnitude of
their residual income-gaps.
Taken together, our findings point to the possibility that immigrants, relative to natives,
might have been facing more barriers preventing them from working in their preferred occupa-
tions during our period of study. However, in a context with self-selection across occupations,
the documented residual income-gaps by themselves do not provide enough evidence about the
existence and the magnitude of the frictions. Consider for example the case of discrimination
for immigrants in a given occupation, where the discrimination takes the form of a wedge be-
tween immigrant wages and their marginal productivities. Under self-selection, discrimination
could deter migrant workers with low unobservable abilities to enter such occupation. Only
immigrants with high enough abilities to overcome the discrimination hurdle will accept to
work; a smaller fraction of the immigrant workforce relative to what would be without dis-
crimination. Since the average quality of immigrants skills will be higher in this small fraction
of their workforce, this composition effect could offset the direct effect of the discrimination
wedge on the observed migrant premium. Therefore, we need to carefully consider the implica-
tions of self-selection for both immigrants’ occupational allocations and their earnings gaps, in
order to identify the existence and the nature of the frictions immigrants might face. The next
section presents a Roy’s (1951) type of model which purports to accomplish this objective.
3 Theoretical model
What can our reduced-form findings tell us about the extent of frictions that immigrants
face? To answer this question we introduce in this section a simple discrete-time Roy model of
occupational choice with two groups of workers (immigrants and natives11 ) and two types of
frictions: discrimination and involuntary choices. We first present our model with no frictions.
The frictionless economy resembles a particular case of Hsieh et al.’s (2019) general equilibrium
model,12 so we try to keep a similar notation for comparison. Next, we show how to generalize
11
The word “natives” will refer to the group of non-migrants, but it is worth to mention that in the earlier
years a significant proportion of immigrants from Venezuela were return migrants (born in Colombia).
12
The case of a frictionless economy for a single-cohort with no heterogeneity in preferences.
8this basic framework to introduce each type of our frictions.
3.1 Frictionless Economy
A continuum of workers choose an occupation i at each time t from a set of M available
occupations, to maximize their contemporaneous utility.13 There are two groups of workers:
immigrants and natives, indexed by g 2 G = {I, N }. Hence, workers can be characterized
by the occupational choice i they make and the group g they belong. Workers are endowed
by unobservable heterogeneous abilities ✏i over occupations, and possess an amount of human
capital higt at time t that is given by:
higt = hig aigt sigi (2)
where hig represents permanent differences in human capital or “talent” common to the group
g in a given occupation i; captures the return to experience, aigt , that we assume is simply
the age of individual at time t minus 15 years; sig are the years of education, which we assume
are fixed for all individuals prior to the migration period; and finally we let the returns to
education to vary across occupations, with magnitude given by i. Since both ages and years
of education are observables, we collapse both variables in xigt ⌘ aigt sigi , a term that we refer
as the “returns” of observables.
For analytical tractability we borrow from Eaton and Kortum’s (2002) model of trade and
assume abilities draws ✏i are drown from a multivariate Fréchet distribution:
" M #
X
F (✏1 , ..., ✏M ) = exp ✏i ✓ (3)
i
The parameter ✓ measures the dispersion of abilities of workers, with a higher value of
✓ corresponding to a smaller dispersion. The mean parameter of the Fréchet distribution is
normalized to 1, but this parameter is isomorphic to hig .
Denote yigt the income that a worker receives for her labor supply at time t, equal to the
value of her efficiency units of labor. This value is the product of the price per efficiency unit
of labor in occupation i at time t, wit , and the amount of efficiency units of labor, which in
turn is the product of the worker’s human capital, given by equation (2), and the worker’s
idiosyncratic talent ✏ in her chosen occupation i:
yigt = wit ✏i hig xigt (4)
For the formulation of workers’ utility we allow for general societal preferences for specific
occupations, similar to compensating differentials. Thus, workers contemporaneous utility
Uigt is simply the product of their consumption at time t, cigt , and a parameter zigt that
13
We abstract here from modeling inter-temporal choices given the short period of time we analyze and the
lack of panel data to make inference. Turning the model into a dynamic one could greatly complicate the
analysis without affecting our main insights.
9measures the common utility benefit of all members of society from working in occupation i.
For identification we normalize the value of this parameter to 1 in a given occupation so the
values of zigt are compensating differentials relative to the reference occupation. The worker’s
problem is thus to choose her occupation at the beginning of period t that maximizes her
contemporaneous utility:
Vigt = max {Uigt } = max {zigt cigt } , (5)
i i
where in our static formulation consumption is simply equal to income, given by equation (4).
Finally, since our main interest is to study the effects of frictions for the allocation of
heterogeneous workers across multiple occupations, we abstract from firm heterogeneity and
instead assume that a representative firm produces final output Y from workers in M multiple
occupations according to a CES technology:
8 " # 1 9 13.3 Type II of frictions: Involuntary occupation choices
The second type of frictions can be thought as barriers for immigrants that force some of
them to work in occupations different to their preferred ones, even after taking into account
the presence of discrimination that wedges imply. These frictions might reflect additional
obstacles that immigrants face to find a job in their desired occupations, including lack of
professional connections or networks, issues with the recognition of educational degrees or
difficulties to obtain permits to work legally. We want to capture the idea that immigrants,
relative to natives, have larger probabilities of not getting to work in the occupation they
would like even if they have a strong comparative advantage in the occupation. In a richer
setting, such type frictions could be rationalized by, for example, more unfavorable job search
conditions for immigrants or higher search costs (Liu, 2010; Chassamboulli and Peri, 2015).
Following Pulido and Święcki (2020) we model the extent of these barriers indirectly by
assuming that a fraction of workers are forced to make involuntary occupational choices, and
by allowing this fraction to be possibly different between immigrants and natives. So we simply
assume that at the beginning of each period every worker gets a random draw, such that a
worker will be able to choose the occupation they desire with probability 1 ↵g , and they
will be forced to work in any other occupation, selected randomly, with probability ↵g . We
allow for ↵g to be time-variant for immigrants (so we will refer ↵g as ↵gt , keeping in mind
↵N t = ↵N 8 t) to reflect the fact that this type of frictions could depend, for instance, on how
sluggish their labor market is, which in turn would depend on the size of the immigration rate;
or on the introduction of reforms that help to regularize immigrants.14 The implications of
↵gt for the allocations of immigrants across occupations and their income gaps over time are
outlined in the next section.
4 Inference procedure
In this section we describe how the presence of both types of frictions for immigrants distort
their occupational allocations and lead to income gaps, and hence how we can identify the
extent of these frictions given data on income gaps and occupational shares for immigrants
relative to natives. First, we present the implications of both types frictions for both occu-
pational allocations and wage premia under our framework. Next, we describe our inference
procedure to quantify the extent of frictions from data and comment on our baseline results.
4.1 Occupational shares and wage premia
Denote w
eigt ⌘ (1 ⌧i ) wit hig xigt zi the overall “reward” that someone from group g with the
mean ability obtains by working in occupation i at time t, so the worker’s problem at each
14
For example, in August 2018 the Colombian Government introduced the PEP program, a large scale reform
that regularized approximately half a million immigrants (Bahar, Ibañez and Rozo, 2020).
11time t is to choose the occupation with the largest value of w
eigt ✏i . Further, denote peigt the
share of workers of group g at time t that without forced choices, would choose occupation
i. Proposition 1 refers to the occupational shares and the average ability of workers in each
occupation.
Proposition 1. The share of workers of group g who work in occupation i pigt is given by:
1
pigt = (1 ↵gt ) peigt + ↵gt M (8)
e✓
w
where peigt = P igt✓
esgt
. Further, the geometric average of abilities of the group g in an occupation
sw
i at time t is given by:
✓ ◆ 1 (1 igt )
1 ✓
✏=e
b (9)
peigt
↵gt
where x b ⌘ expE(log x) ;
b denotes the geometric average, x is the share of workers
igt = M pigt
em
within an occupation i who do not voluntary chose such occupation; and e ⌘ e ✓ , with em
the Euler–Mascheroni constant.
Proof. See Appendix B.2.
Occupational shares of a group given in (8) are a weighted average between the random
allocation of the fraction ↵gt of workers who cannot make voluntary choices, and the allocation
of the fraction (1 ↵gt ) of workers that can work in their preferred occupations, given by peigt .
In turn, this latter allocation depends on the average reward w eigt relative to their power mean
P ✓
over all occupations ( s w esgt ). Thus, in the case in which all desired occupational choices were
feasible (↵gt = 0 8t), occupational allocations would depend only on the relative returns of
occupations, so the differences across allocations between natives and immigrants would come
only from group-occupation specific factors. That is, the price per efficiency unit of labor in
a given occupation (wit ), which is common between groups for each occupation, would not
cause differences between immigrants’ occupational shares relative to natives in a world with all
desired choices are feasible. Only discrimination wedges, group-specific permanent differences
in human capital and group-specific preferences for a given occupation, would cause differences
in the allocations of immigrants. These forces as determinants of occupational allocations start
to be distorted once involuntary choices are introduced, and lose explanatory power the larger
is the extent of forced choices.
Self-selection induced by voluntary choices affects the average quality of workers in an
occupation. To see this, notice that equation (9) implies that the geometric average of abilities
in a given occupation is inversely related to the share of the group working in such occupation,
pigt (of which peigt is direct function). Thus, in occupations where a group has low participation,
for instance, because workers are discriminated against, workers will have higher abilities on
average (in our example, because they are the ones who can overcome the discrimination
12hurdle). The presence of this sorting effect is stronger the larger are the allocations due to
voluntary choices. In the extreme scenario where all choices were involuntary, ↵gt = 1 8 g, t,
this selection effect would not be present and their average ability would be the unconditional
mean of the draws of abilities, given by e in the case of the Fréchet distribution.
The results for both occupational shares and average abilities in Proposition 1 lead to a
direct implication in terms of the within-occupation income gaps for immigrants:
Corollary 1. The income gap for immigrants in occupation i at time t (IGit ), defined as
the ratio of the geometric average of earnings of immigrants relative to the same average for
natives, is given by:
1
ybiIt piIt ) ✓ (
biIt (e
hiI x iIt 1)
IGit ⌘ = (1 ⌧iI ) 1 (10)
ybiN t piN t ) ✓ (
biN t (e
hiN x iN t 1)
Proof. Straightforward from expE(yigt ) = (1 ⌧ig ) wit hig expE[xigt log(✏i )] and equations (8) and
(9).
Corollary 1 shows that occupational income gaps for immigrants are a combination of the
effects of occupation-specific wedges, which reflect discriminatory frictions; gaps in returns
on observables and in the permanent components of talent, reflecting the effect of differences
in the composition of human capital across groups; and on the relative desired occupational
allocations. These allocations are the result of sorting across occupations but are in turn
distorted by the extent of frictions that force involuntary choices. Corollary 1 also implies
that with information of within-occupations income gaps, occupational allocations, gaps in
the “returns” of observables and an assumption about the latent permanent component of
talent across groups for each occupation, it is possible to pin down the magnitudes of wedges
(1 ⌧ig ) and probabilities of forced choices ↵gt from the system of equations that (10) implies.
This is the basic idea of our inference procedure, which is described below.
4.2 Inference procedure and results
Our procedure to quantify the extent of occupational misallocation for immigrants relies on
finding the magnitudes of the frictions for which the system of equations (10) fits best the data.
With an assumption about the innate differences of talent across groups in each occupation,
hiI
hiN
, a value for the parameter ✓, and the definition of peigt in equation (8), it is possible to
find M wedges (1 ⌧iI ) and T + 1 probability of forced choices ↵It and ↵N for which the
system of M ⇥ T equations (10) fits best our set of information {IGit , pigt , xigt }.15 Similar to
15
Formally, defining the set of M + T + 1 variables x = {(1 ⌧iI ) , ↵It , ↵N } and the function g (x) from
RM +T +1
to RM ⇥T given by g (x) = IGit zit (x) where zit (x) is the RHS of equation (10), since M ⇥ T >
M + T + 1 is not possible to find a exact solution of the overdetermined system of equations g (x) = 0. Instead,
we solve the minimization problem minx k g (x) k, where k · k is a vector norm on RM +T +1 (we employ the
Euclidean norm, i.e. least squares).
13Hsieh et al. (2019), for our baseline results we assume that the levels of the latent permanent
components are the same across groups and normalize them to 1 (hig = 1 8 i, g), so migrants
have on average the same permanent components of talent than natives in each occupation,16
but in our robustness checks we present alternatives to this assumption, modifying our model
hiI
specification to infer values of hiN
for each i.
We use data of immigrant and native workers between the ages of 25 and 70 for the
period 2015 to 2019, so our inference focuses on workers after they finish schooling but prior
to their retirement. In our baseline results we use our preferred measure of labor income
converted to constant Colombian pesos of 2015. The occupational income gaps are defined
as in equation (10), that is, in terms of geometric averages, but our results are similar if we
use instead medians to avoid the influence of outliers. To measure the returns on observables
xigt , we need also values for the parameters and i, the returns of experience and education
respectively. For these values, we use the Mincerian returns in our pooled data from regressions
of log income on years of schooling and age controlling for other observables.17 For ✓, the
dispersion of abilities draws, similar to Hsieh et al. (2019) and Bryan and Morten (2019),
we use the model’s implication for the relative dispersion of wages within occupation-groups.
Particularly, those wages should follow a Fréchet distribution with shape parameter equal to
✓, and hence a ratio variance to mean equal to:
2
⇥ 1
⇤2
V ariance (✓) 1 ✓ 1 ✓
= 1 (11)
M ean (✓) 1 ✓
for values of ✓ > 2, where (·) is the gamma function. So for each year, we compute the ratio
variance to mean of the exponent of the residuals from cross-sectional regressions of log income
on the 30⇥2 occupation-group dummies, and then solve equation (11) for the value of ✓. The
ratios variance to mean fluctuate between 2.43 and 2.55, so the resulting estimates of ✓ are on
average 2.35. We use this value for ✓ in our baseline results, but we will explore robustness
to setting it as low as 1.5 or as high as 3.5 in the next section. With this parametrization, we
solve the system of equations resulting from inserting (8) in (10) using global solvers.18
Panel A of Table 3 shows our baseline results for both the variance of the estimated wedges
and the probabilities of forced occupational choices, along with the values of the parameters
used in the inference procedure. First, regarding wedges, it is worth to say that we focus on the
16
In other words, we are assuming that there are no innate talent differences between natives and immigrants.
Remember that hig is isomorphic to the mean parameter of the Fréchet distribution, so in our baseline both
groups draw from the same distribution of abilities, a reasonable assumption.
17
We use the same set of controls than in equation (1). For estimating , homogenous across occupations,
we control also for occupation-group fixed effects. For estimating i , heterogenous across occupations, we run
the Mincerian regressions for each occupation.
18
Particularly, we use the genetic algorithm with a population size of 2000 individuals, 10 times larger than
the suggested by default in Matlab, for example. We verified that independently the initial population chosen,
we get always the same solution.
14variance of wedges because their dispersion is what really matters for workers misallocation;19
their mean simply reflects the normalization used for the latent permanent component of
talent across groups. We obtain a variance of 0.10, which implies a considerable dispersion
of our estimated wedges: their values fluctuate between 0.3 times the median wedge (in the
case of teaching professionals and scientists) and 1.7 times the median wedge (in the case of
health professionals). Panel A of Figure 5 displays the estimated wedges in each occupation.
The substantial heterogeneity of those values across occupations suggests that the gains from
removing discrimination could be sizable.
Second, regarding the fractions of immigrants in each period who are forced to make
involuntary choices, ↵It , we find these fractions tend to grow over time, coinciding with the
increase of the immigration rate, rising from 5.1% in 2015 to 9.2% in 2019. Panel B of Figure
5 displays these shares compared to the obtained value for native workers (↵N , equal to 4.7%).
With exception of 2016, in all years of the Venezuelan exodus the proportions of immigrants
making involuntary occupation choices are larger than the obtained for natives. By 2019,
year of the largest migration inflows, this proportion is about twice as large as the one found
for natives. Finally, Figure 6 plots the observed occupational income gaps compared to the
predicted by our two set of estimated frictions using the RHS of equation (10), as a graphic
representation of the fit of the model. For the relatively small number of parameters inferred,
there is a strong positive association between the observed and predicted income gaps, with a
relatively high correlation coefficient (0.73).
The magnitudes found for both types of frictions point in the direction that reallocating
workers across occupations according to their frictionless choices could imply non-negligible
gains on aggregate productivity. To quantify these gains, we first need to solve for the values
of the remaining unobservable variables compatible with general equilibrium, and use those
values to obtain the responses of the endogenous outcomes (allocations, prices and output)
in the counterfactual equilibria. The next section develops a procedure in this direction and
presents a series of robustness checks of the results.
5 Counterfactuals and robustness
In this section we show how aggregate productivity and occupational allocations would change
when implementing two types of reforms: i) Removing entirely each type of frictions for
immigrants; ii) Equalizing immigrants’ frictions to those found for natives. We first describe
the procedure to obtain those counterfactual equilibria and report its results. Next, we examine
how sensitive are our results to the values of the calibrated parameters during the procedure,
particularly to ✓ and . Finally, we explore robustness when we change the specification of
19
If wedges were distributed log-normal along productivities, there would be a perfect correlation between
the magnitude of the variance of wedges and the gains of reallocate workers across occupations; see Hsieh et al.
(2019) for a proof, or in the context of firm-level misallocation, Chen and Irarrazabal (2015).
15the model in order to infer differences in innate talent across occupations and to allow for
time-variant discriminatory wedges.
5.1 Counterfactual exercises
To quantify the aggregate implications of our estimated frictions, we need first to solve for the
remaining exogenous variables of the model: group-specific preferences for a given occupation,
zigt , and the productivities for the representative firm of each occupation i, Ait . These variables
are kept constant when our counterfactual exercises are performed. Appendix B.3 depicts the
procedure to solve for these values in the observed economy jointly with the equilibrium
values of the endogenous efficiency wages (wit ) and the total output of the economy (Yt ),
following several implications of the model. The procedure needs a value of , the elasticity of
substitution among occupations, a parameter that we make equal to 3 in our baseline results
(a common value in the literature). Nevertheless, we explore robustness to setting it as low
as 2 or as high as 5 in the next subsection. Figure C.3 in Appendix C displays the resulting
average values over years of group-specific preferences and productivities for each occupation.
Preferences among occupations do not vary importantly between natives and immigrants, and,
as expected, occupations with higher requirements of educational attainment are inferred as
more productive for the representative firm.
Once this set of values are found for the observed equilibrium, two counterfactual equilibria
can be computed. The first is to remove entirely each set of frictions for immigrants. In terms
of our model, it involves to set ⌧iI and ↵It equal to zero, and derive the endogenous response
of allocations, efficiency wages and total output in the new equilibria. This is a drastic reform
in which all immigrants choose occupations according to the efficient allocation. Even though
this counterfactual is extreme by nature, and hence perhaps unrealistic as policy reform, by
removing jointly and separately each set of frictions we get a clear understanding of the relative
importance of each one. The second counterfactual is equalizing immigrants’ frictions to those
found for natives. In spite of our inference procedure is able to tell us the extent of type
II frictions for natives (↵N ), one of its identification assumptions is that natives do not face
“taxes” in their income. Hence, from our baseline results we cannot directly assess to which
counterfactual value of wedges’ variance we should reduce our estimated variance. So for this
case, we propose a measure of the counterfactual variance of wedges based on estimating a
restricted version of the model for different sub-groups of natives.
The procedure to obtain the endogenous variables in the counterfactuals once we have the
intended values of frictions for each reform is described in detail in Appendix B.4. Basically, we
use a fixed-point algorithm to find total output, occupational allocations and efficiency wages
that clear each occupational labor market in each year given the values of the exogenous
variables and the intended frictions in the proposed counterfactuals. The annual aggregate
gains from the reforms are computed as the percentage change in total output for each year of
16the counterfactual economy relative to total output in the actual economy. In what follows,
we describe our findings for each proposed reform.
Reform I: Removing frictions for immigrants
We first evaluate the counterfactual of removing entirely both types of frictions for immigrants
(⌧iI = ↵I,t = 0 8 i, t). First rows of Panel B in Table 3 display the results for our baseline
parametrization in each year of the studied period. By considering the results for the most
recent year (2019), when the participation of immigrants in the Colombian workforce reaches
its peak, removing all frictions for immigrants would permanently increase total output by as
much as 0.9%. Since in both the counterfactual and the actual economy the amount of workers
is the same, the rise in output is the result of the increase in aggregate labor productivity
(where labor is measured in efficiency units) due to the improvement in the allocative efficiency
of labor among occupations. An inspection of the counterfactual occupational allocation
reveals that around 30% of immigrants in each year would reallocate as a consequence of
the reform. This magnitude is a lower bound, since we are not able to quantify transitions
that do not alter occupational shares.20 The average counterfactual occupational allocation
of immigrants compared to the observed one is displayed in Panel A of Figure 7, where it
is evident that immigrants gain participation in occupations with higher skill requirements.
Since the reallocation of immigrants workers has general equilibrium implications for efficiency
wages, there is also a small response in terms of reallocation of natives: up to 0.4% of their
workforce in 2019.21
Which type of friction is more important for these results? We next evaluate the counter-
factuals of removing each type of frictions separately. By 2019, removing only discriminatory
wedges (⌧iI = 0 8 i) leads 28% of immigrants and 0.4% of natives to reallocate, increasing
aggregate productivity by 0.6%. So discriminatory wedges account for around two-thirds of
the total gains from the reform of eliminating all frictions. Instead, removing only involuntary
occupational choices (↵It = 0 8 t) leads only to 4% of immigrants to reallocate and increases
aggregate productivity around 0.2%. As opposite to discriminatory wedges, immigrants who
are misallocated by forced choices are randomly assigned among all occupations. Thus, their
reallocation does not importantly affect efficiency wages, generating almost no changes in the
allocation of natives. To sum up, discriminatory wedges have larger implications in terms of
allocative efficiency and involve additional general equilibrium effects, a channel that has a
second-round effect in the occupational allocation of the native workforce.
20
The estimated reallocation and the following ones, are computed adding up the total amount of workers in
occupations with positive variations in their participation in the total. So we are omitting possible reallocations
that do not alter occupational shares (for example, a worker transitioning from sector s and s0 , whereas another
worker makes the opposite transition) which we cannot identify.
21
Panel B of Figure 7 shows for natives their counterfactual occupational allocation compared to the observed
one, but the changes are very small.
17Reform II: Equalizing immigrants’ frictions to those found for natives
The aim of our second reform is to reduce frictions for immigrants to a similar level to that
for natives. From the point of view of policy analysis, this counterfactual is perhaps more
interesting because it provides a calculation of the aggregate productivity gains when immi-
grants are completely assimilated by the labor market of the host country and face the same
frictions as natives. It also provides a crude quantification of the macroeconomic benefits of
different programs that help to regularize and to reduce barriers for immigrants, allowing them
to compete in the labor market under the same conditions than native workers.
For this counterfactual, we first equalize the values of the fractions of immigrants that are
forced to make involuntary choices to the value estimated for natives, i.e. ↵It = ↵N 8 t. Second,
we reduce the variance of our discriminatory wedges to a level that reflects the prevalent
discrimination in the labor market of natives. Here we face the difficulty that one of our
identification assumptions was that natives does not face “taxes” in their income, so their
wages reflect their marginal productivities, and thus, from our results we do not have a direct
measure of the prevalent discrimination in the labor market for natives.22 In order to gauge
the extent of this discrimination, we re-estimate our model for sub-groups of natives for which
one could presumably argue there would be discrimination against them, constraining ↵gt to
our intended value ↵N . This out-of-the model inference, although not perfect, will offer us an
approximate value of the variance of the wedges for our counterfactual.
For this exercise, we choose as the possible groups facing discrimination women and rural
workers. So we re-estimate the constrained model only for native workers using the follow-
ing four subpopulations: urban-men (UM), rural-men (RM), urban-women (UW), and rural-
women (RW). For identification, we assume UM do not face discrimination. With our baseline
parametrization, we obtain a variance of wedges equal to 0.03 for RM, 0.08 for UW and 0.10
for WR; a ranking that seems reasonable. Using the average shares of the four groups in
the total native population, our computed variances imply a pooled variance of 0.047. This
value is close to the obtained in the case of estimating the restricted model only for men and
women with women facing discrimination (0.044), or only for urban and rural workers with
rural workers facing discrimination (0.040).23 Therefore, in our counterfactual we shrink im-
migrants wedges until they exhibit a variance equal to 0.047, which corresponds to 47% of our
estimated value of 0.100.
Panel C in Table 3 displays the results for our baseline parametrization. By 2019, reducing
immigrants frictions to a similar level to the inferred for natives would lead 9.1% of immigrants
and 0.1% of natives to reallocate. Figure 8 shows for each group the average counterfactual
22
This assumption was needed because from the system of equations (10) , (1 ⌧iI ) would be indistinguish-
(1 ⌧iI )
able from (1 ⌧iN )
if we would have assumed wedges for natives too.
23
We also estimate a placebo test in which we divide the natives’ population into two random groups, to
verify that our inference was effectively capturing some type of discrimination instead of measurement error,
for instance. In this case, we estimate a variance equal to 0.001.
18You can also read