The impact of centralized bargaining on spillovers and the wage structure in monopsonistic labour markets - WIDER Working Paper 2021/132
←
→
Page content transcription
If your browser does not render page correctly, please read the page content below
WIDER Working Paper 2021/132

The impact of centralized bargaining on
spillovers and the wage structure in
monopsonistic labour markets

Ihsaan Bassier*

August 2021
Abstract: How does centralized bargaining affect the broader wage structure? And what does this
tell us about the (non-)competitive dynamics of such labour markets? I study large contracted wage
increases negotiated by centralized bargaining councils in South Africa, using matched employer–
employee tax panel data from 2008 to 2018. First, my stacked event-study of bargaining council
firms shows sharp wage increases in bargaining councils, concentrated in mid-wage and mid-size
firms. Second, I observe spillovers on firms competing in the same labour market as the bargaining
council, as estimated by worker flows, such that more connected firms increase wages more—a
prediction of monopsonistic models that contrasts with competitive models. Third, I discuss
evidence that the effects of contract changes on bargaining council firms differ by the firm’s
average wage, decreasing the size of low-wage firms but having neutral or positive effects on the
size of higher-wage firms. Altogether, these bargained wage increases compress the overall wage
and job structure upwards, highlighting an interplay between institutional regulation,
monopsonistic competition, and firm heterogeneity which reaches far beyond the direct impact of
bargaining council firms.
Key words: wage structure, centralized bargaining, monopsony, spillovers, stacked event-study
JEL classification: C50, J31, J42, J52
Acknowledgements: Many thanks to the SA-TIED programme for data access and financial
support, and in particular to the data team at the SARS-NT Secure Data Facility. I am grateful for
ongoing guidance from Arindrajit Dube and Suresh Naidu, as well as comments from Joshua
Budlender, Deepankar Basu, Leila Gautham, Jasmine Kerrissey, Murray Leibbrandt, and many
others.

* University of Massachusetts, Amherst, USA, and Southern Africa Labour and Development Research Unit (SALDRU), Cape
Town, South Africa; ibassier@umass.edu
This study has been prepared within the UNU-WIDER project Southern Africa—Towards Inclusive Economic Development
(SA-TIED).
Copyright © UNU-WIDER 2021
UNU-WIDER employs a fair use policy for reasonable reproduction of UNU-WIDER copyrighted content—such as the
reproduction of a table or a figure, and/or text not exceeding 400 words—with due acknowledgement of the original source,
without requiring explicit permission from the copyright holder.
Information and requests: publications@wider.unu.edu
ISSN 1798-7237 ISBN 978-92-9267-072-6
https://doi.org/10.35188/UNU-WIDER/2021/072-6
Typescript prepared by Gary Smith.
United Nations University World Institute for Development Economics Research provides economic analysis and policy advice
with the aim of promoting sustainable and equitable development. The Institute began operations in 1985 in Helsinki, Finland, as
the first research and training centre of the United Nations University. Today it is a unique blend of think tank, research institute,
and UN agency—providing a range of services from policy advice to governments as well as freely available original research.
The Institute is funded through income from an endowment fund with additional contributions to its work programme from
Finland, Sweden, and the United Kingdom as well as earmarked contributions for specific projects from a variety of donors.
Katajanokanlaituri 6 B, 00160 Helsinki, Finland
The views expressed in this paper are those of the author(s), and do not necessarily reflect the views of the Institute or the United
Nations University, nor the programme/project donors.

1       Introduction

What are the institutions that govern the wages and flows of workers in the South African labour market?
While competition is a powerful force, centralized bargaining is estimated to govern the employment
contracts of 30 per cent of South Africa’s workers. By compiling bargaining council agreements between
2008 and 2018, then matching them with workers and firms using tax data, I demonstrate that the effects
of bargaining councils extend to the majority of workers. In particular, I show that large negotiated
wage increases result in observable wage gains for workers in both contractually bound firms and firms
connected to them through worker flows. These results show more generally how regulation influences
the wage structure by propagating through interconnected local labour markets.

One way to think about the broader effects of bargaining councils is in terms of employer power. Though
once considered limited to company towns, monopsony power—one form of employer power—is in-
creasingly recognized as pervasive (Dube et al. 2019; Sokolova and Sorensen 2021). The relevance
of monopsony power extends to regulatory policies in developing countries such as Brazil and India
(Lagos 2019; Muralidharan et al. 2017), substantially altering the effects predicted under a competitive
framework. Firms have monopsony power when they can mark down wages from marginal productivity
without many workers quitting in response: they can pay workers less with limited effect on production.
Such lower quit responses can arise, for example, from search friction or job differentiation (Burdett
and Mortensen 1998; Card et al. 2018). One way to constrain such monopsony power is through mini-
mum wages, which may be set through unions of organized workers (Manning 2003a). While there is a
large literature on collective bargaining, the underlying model of the labour market reverses its likely ef-
fect, from introducing wedges into the market (competitive case) to countering existing employer power
(monopsonistic models).

There are also particular predictions from models of monopsonistic competition for the labour market
structure more broadly. First, when minimum wages cover part of the labour market, as in the case of
local bargaining councils, wage spillovers onto nearby firms are predicted. Nearby firms paying just
above the relevant minimum wage are no longer as attractive as before relative to the next best covered
firm, meaning they have to increase wages to retain workers (Manning 2003b). Second, the effect of
the minimum wage on firm size depends on the firm’s productivity: low-productivity firms are priced
out by the minimum wage and are forced to downsize, mid-productivity firms may increase in size as
the cost of the marginal worker decreases, and high-productivity firms paying higher wages may be
largely unaffected (Dickens et al. 1999). The net employment effect can vary, but the structure of jobs
concentrates more towards higher-wage, more productive firms. Third, even with such reallocation, the
net effect on the share of workers in such high-productivity jobs will depend on the level of the minimum
wage, the level of local wages, and the amount of monopsony power—factors a local bargaining council
may take into account.

I investigate these predictions relating collective bargaining to broader monopsonistic labour markets.
Does centralized bargaining actually affect wage setting, thereby constraining the markdowns associated
with employer power? Do these constraints spill over onto nearby firms, as predicted by monopsonistic
models? And how do these constraints influence the structure of jobs in the broader labour market? In
particular, I study sharp changes in bargained contracts, tracing their effect on wages, worker flows, firm
size, and firm profits for bargaining council firms and nearby firms. I measure nearby firms as firms
that are not contractually bound by bargaining councils, but draw from the same local labour market as
measured by the network of worker flows.

This study contributes to several literatures. First, I provide evidence on firms covered by collective
bargaining. I provide one of the first comprehensive firm profiles of South Africa’s bargaining council
system, since previous studies have relied on household survey data (Bhorat et al. 2012; Budlender and

                                                     1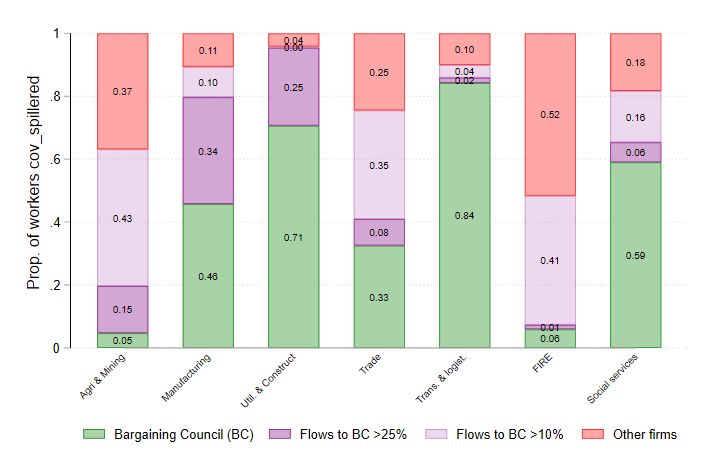
Sadeck 2007; Magruder 2012). Bargaining council workers are mostly in the upper-middle parts of the
firm earnings distribution, with higher firm wage premia (largely accounted for by minimum wages),
but also higher log value added per worker. South Africa’s bargaining council firms have a much lower
proportion of women, 30 per cent compared to 50 per cent in other firms, and consequently bargaining
council minimum wages explain over one-thirdof the overall gender wage gap in formal sector wages. I
also provide estimates of the effects of wage contract changes on these firms. There remains ambiguity
in the literature as to whether unions have a measurable impact on wages, a ‘first stage’ for which I find
strong evidence (Blandhol et al. 2020; DiNardo and Lee 2004). These sharp wage increases following
contracted wage increases are concentrated in mid-wage (40th to 80th percentile) and mid-size (15–100
workers) firms, consistent with most bargaining council workers being in the upper-middle parts of the
distribution.

Second, I approach the labour market as a network of firm dependencies by providing causal evidence
on spillovers in wage setting (Derenoncourt et al. 2021; Fortin et al. 2021; Staiger et al. 2010). I find that
workers frequently switch to firms across industrial and geographic boundaries, creating dependencies
between firms in seemingly disparate industry-by-location cells. While bargaining councils cover about
40 per cent of formal sector workers in South Africa, firms that are closely connected through overlap-
ping local labour markets account for at least another 30 per cent. A key advantage of my study is that
my matched employer–employee data allow me to trace the spillovers through these worker transitions
between bargaining council, spillover, and other firms. I observe wage spillovers from bargaining coun-
cil contract changes that are similar in magnitude to the observed wage changes in bargaining council
firms. In addition, I find that profit margins decrease by a magnitude that plausibly indicates a wage–
profit trade-off for these firms, as found elsewhere (Draca et al. 2011). In terms of the aggregate wage
structure, these spillover wage effects have a comparable additional effect on the middle tercile of the
firm average wage distribution as bargaining council wage changes, and a much larger effect in the
bottom tercile due to the more even distribution of spillover firms.

Third, I discuss how the mass of workers reallocate away from low-wage firms and towards higher-
wage firms. The combination of effects on bargaining council and spillover firms therefore alters the
labour market structure substantially. A key developmental consequence is an ambiguous effect on
the net job opportunities and firm productivity in a country of high unemployment. I discuss how these
effects themselves depend on the local wage structure, for example by considering heterogeneity by local
average wages (Kaitz index). I develop the analysis of wage structure and aggregate effects, among other
aspects, in ongoing work.

In Section 2 I review the literature on South Africa’s bargaining councils, and then proceed to profile
these labour market institutions using the merged data set of bargaining council agreements and tax
data that I have compiled. I evaluate the effects of large contract changes on bargaining council firms
in Section 3, and on spillover firms in Section 4. I discuss evidence on reallocation, robustness, and
heterogeneity in Section 5, and conclude with my plan for further analysis in this paper.

2       Description of South African bargaining councils

2.1     Brief review of the South African bargaining council literature

Bargaining councils have perhaps been the central institutional feature of the South African labour mar-
ket since the early 1980s, when apartheid restrictions on Black worker unionization were largely re-
pealed. Today, South Africa operates on a multi-tiered workplace legislative structure, constituted by
overlapping organizational structures.

                                                      2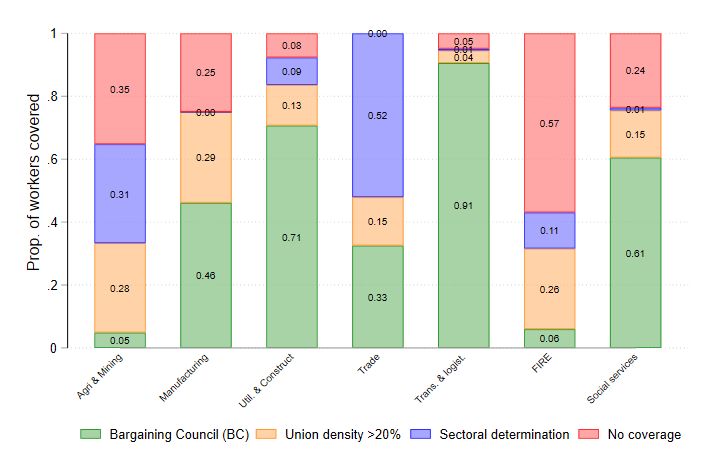
We may broadly think of regulation in the labour market in the following way, from least organized
to most (Levy et al. 2014). First, about one-third of all workers are informally employed, typically
without adhering to minimum conditions such as a written contract (Bassier et al. 2020). Second, the
Basic Conditions of Employment Act (BCEA) and Labour Relations Act form the minimum conditions
of employment and are applicable to all employment relationships—in reality, covering formal sector
workers. These regulations are most relevant to uncovered formal sector workers, who include both low-
wage workers who are completely unrepresented and high-wage workers who negotiate bilaterally with
their employers.1 Third, ‘sectoral determinations’ are set unilaterally by the government for selected
industries, mostly made up of low-wage workers.2 Fourth, any workers can become union members,
and workers can seek a union recognition agreement if at least 30 per cent of the workplace belongs to
the union. Fifth, when unions collectively cover 30 per cent of workers in an industry-location (idiosyn-
cratically defined), they can apply with employers to be recognized by the government as a centralized
bargaining council. There are currently 39 legally recognized private sector bargaining councils in South
Africa, each covering a specific industry-region (DoL 2018).

These regimes overlap: for example, the wholesale and retail industry is covered by a sectoral deter-
mination, with subsets of the industry unionized, with workplace bargaining, and other subsets covered
under bargaining council agreements. The precedence of organizational structures is not straightfor-
ward; for example, bargaining council agreements can vary some conditions below the BCEA. This is
actually common practice: I find that nearly half of bargaining council agreements increase the number
of overtime hours beyond the maximum set in the BCEA, or decrease the period of notice required for
termination.

Over the last three decades, there have been over a dozen studies of union and collective bargaining
premia in South Africa, including Moll (1993, 1996), Schultz and Mwabu (1998), Butcher and Rouse
(1999), Bhorat et al. (2012), Flowerday et al. (2017), and von Fintel (2017). Wittenberg and Kerr
(2019) provide an excellent review of the union premium literature, focusing on union wage premia
and providing updated estimates. Recall that there is an overlapping relationship between bargaining
councils and unionization: a large portion of bargaining councils are unionized, but many bargaining
council workers are not unionized and many union workers are outside of bargaining councils. They
document a unionization rate of about 30 per cent in the South African labour market, and estimate a
union wage premium of 25–30 per cent, which aligns with much of the literature and is generally higher
than other countries. In a related paper, Kerr and Wittenberg (2021) argue that while unions tend to
increase wages more for lower-wage union members, most union members are in the upper-middle parts
of the wage distribution and this results in an inequality-increasing effect from union wage premia. As I
discuss below, I find a very similar pattern for bargaining council workers.

The literature focused on bargaining councils has been more limited than the union literature in that
there is no clean identifier for bargaining councils. A contribution of this paper is to compile a publicly
available data set classifying industries and regions into each bargaining council, with wages for each
bargaining council separately by year. In addition, the existing papers use household survey data, which
are limited by non-representativeness at the bargaining council level (as opposed to the tax data, where I
observe the full population of firms). Bhorat et al. (2012) combine survey data from 2005 with gazetted
bargaining council documents to estimate a bargaining council premium of about 9 per cent above the
union premium. They instrument union membership here by union membership of others in the house-
hold, which Wittenberg (2014) notes requires a logically inconsistent data-generating process. While I

1A national minimum wage was introduced in 2019, and is applicable to all workers. My period of analysis is from 2008 to
2018, so I do not focus on this.
2 There are 11 sectoral determinations, and 8 of them set formal sector minimum wages: contract cleaning, civil engineering,
learnerships, private security, wholesale and retail, forestry, farm workers, and hospitality.

                                                             3
do not focus on the level of the bargaining council wage premium, I do provide an estimate below of 15
per cent in addition to the union premium. Flowerday et al. (2017) consider three bargaining councils,
the Metals and Engineering Industry, Clothing, and Textiles Bargaining Councils, similarly matching
agreements into household survey data between 2010 and 2014. They find a negative employment ef-
fect of 8 per cent. These results are difficult to assess without indications of the quality of the control,
pre-trends, or the first-stage wage effect. For example, they note the largest negative effects are for the
Clothing Bargaining Council, a sector in decline.
A major study in this literature on South African bargaining councils is that by Magruder (2012), who
finds negative employment effects, which are concentrated among smaller firms. He uses a spatial re-
gression discontinuity design, identifying the employment effects from either side of the boundaries of
bargaining councils. There are a few concerns with this approach, such as the quality of household
survey data used3 and the endogeneity of boundaries defined by the bargaining councils.4 On aggregate
I do not detect these decreases in firm size, and indeed many of Magruder’s specifications (including
the preferred ones) do not detect negative firm size effects for larger firms. However, I do discuss real-
location effects, where I find decreases in firm size for the low-wage subgroup of firms, in addition to
neutral or positive effects for larger firms. The policy conclusions from such a reallocation are unclear;
for example, if workers are mostly reallocating to more productive firms this would increase total pro-
duction as well as wages. The extent to which this is countered by employment losses in small firms is
an empirical question.
To date, it is my understanding that no paper in the South African literature has considered the spillover
effects of bargaining councils, or discussed their overall impact on the labour market structure. My
analysis on spillovers also contributes more generally to the literature on regulatory policies in South
Africa, such as state-set minimum wage effects, where spillovers have only been considered in passing
(Bhorat et al. 2013; Dinkelman and Ranchhod 2012; Piek et al. 2020). This may be particularly salient
for studies evaluating the effects of the recent national minimum wage.
2.2 Description of the matched panel
I provide detail on how I construct my main matched firm panel in Appendix Section D3. I provide a
brief summary of the data construction here, and then describe the matched firm panel.
I collect bargaining council agreements from 2008 to 2018, record the industry, location, and wage by
year for each bargaining council, and match these to firms as demarcated by industry and location in the
tax data. Regions are defined at different levels, where 21 councils are national in scope, 5 are provincial,
and 13 are based on districts. In terms of industry, most bargaining councils are defined at the three-digit
industry level, though some are defined at the two- or four-digit levels. I record the annual wages in
these contracts using the actual bargaining council wage agreements published in official government
gazettes, and also cross-check these wages against a tabulation of wages by bargaining council and year
provided to me by the Labour Research Service. I then match these industry-by-location wages to a
matched employer–employee data set I have constructed from worker and firm tax records (National
Treasury and UNU-WIDER 2020a,b). The matching between the tax data and the bargaining council
agreements is imperfect since there is no direct correspondence between industry and location codes in
the two sources. Another source of measurement error is that the tax data lack occupational classification
(wages are bargained by occupation), meaning that only one wage can be used for each year in the
3 The location of households is measured, not firms; and the industry is only measured at the two-digit level, whereas many
bargaining councils are more accurately defined at the three- or four-digit level. Household data are also not representative at
the unit of analysis used (magisterial district by industry), with very few observations in some of the cells.
4Magruder does consider this, but finds some puzzling results when performing robustness tests—for example, that firms
bunch on both side of the border (i.e. on the bargaining council side too).
4bargaining council. I choose the occupation that corresponds to the ‘general’ worker. As will be shown
later in an event-study setup, observed wages track large, sharp changes in the contracted bargaining
council wages, which gives confidence that the identification of bargaining council firms as described
above is not too noisy.
I use my constructed data set to profile the South African formal labour market into its constituent
regulatory regimes as described above. Bargaining council firms cover 40 per cent of formal sector
workers. While I do not see union membership in these data, I merge in union density at the municipality
by industry level using the Quarterly Labour Force Survey (QLFS) for the corresponding years.5 About
20 per cent of workers are part of high-union- density industry-locations but are not part of bargaining
councils. A further 15 per cent of formal sector workers are neither in bargaining councils nor in high-
union-density cells, and the balance—about 25 per cent—are uncovered. We can also factor in the 33
per cent of workers in the informal sector in order to have a profile of the entire labour market, and in this
case approximately 30 per cent of workers are part of bargaining councils, 15 per cent are in the union
category, 10 per cent are only covered by sectoral determinations, and 20 per cent are uncovered.6
What are the characteristics of firms in these different regulatory regimes, and in particular bargaining
council firms? Table A1 presents some comparisons between bargaining council firms, sectoral deter-
mination firms, and uncovered firms (as the omitted category). I begin by comparing the firm effects
following Abowd et al. (1999) or AKM, which isolates the wage premium associated with the firm, in-
cluding bargaining council or union effects.7 On average, bargaining council firms are high-wage firms,
and sectoral determination firms pay low wages. Accounting for industry and location fixed effects,
however, firms covered by sectoral determinations pay slightly higher, highlighting that sectoral deter-
minations tend to be in low-wage industries. As explained above, I do not observe union membership
directly, but can control for it using a proxy of union density of the industry-location from the QLFS.
Controlling for unionization, the bargaining council specific premium is about 15 per cent (column 3).
Bargaining council firms have much less within-firm wage inequality than uncovered firms (columns
4 and 5), a characteristic which I show later is causally linked to responses to wage contract changes.
Interestingly, bargaining council firms do not have conditionally different value added per worker than
uncovered firms (column 6). This seems to be entirely accounted for by industry, since bargaining coun-
cils do have unconditionally higher value added per worker, but this difference disappears as soon as
industry fixed effects are introduced into the cross-sectional regression.
Figure A1 shows that in addition to these differences in firm wage premia, the sorting of workers by firm
wage premia differs for bargaining council versus other firms. For the same AKM firm effect percentiles
(i.e. the values of wage premia are comparable), I plot the mean AKM worker effect. This is a proxy
for worker quality, and shows the steep profile of increasing worker quality with firm wage premia in
5 The QLFS is a representative survey of households focusing on labour market information, and is collected by the national
statistics agency, Statistics South Africa (StatsSA 2020). Approximately 20,000 households and 70,000 individuals are sur-
veyed on a quarterly basis. This is a primary source of data for national labour market statistics, such as the employment
rate.
6 One alternative source is the QLFS. Using the 2019 quarter 4 release, 30 per cent of workers say they are a member of a
trade union. In response to the question, ‘Who sets your salary?’, only 8 per cent say their wage is set by a bargaining council,
a further 22 per cent say their wage is negotiated between their union and employer, 10 per cent say bilateral negotiations,
55 per cent say it is unilaterally set by their employer, and 5 per cent say they do not have a regular wage increment. These
proportions are lower than implied by my constructed data set, but not necessarily inconsistent: a worker may not know they
are part of a bargaining council, and many workers are not part of a union but are part of a bargaining council. Budlender
and Sadeck (2007) investigate what proportion of workers are part of bargaining councils using survey data on industry and
location, and find a similar figure to me of 30 per cent.
7 This follows Abowd et al. (1999), where the firm wage premium is the firm component of a two-way fixed effects regression
of log wages on firm and worker fixed effects. See Bassier (2019) for more details and an application in the context of these
South African tax data.
5non-bargaining council firms. This sorting of high-wage workers to high-wage firms is observed in
several countries (Engbom and Moser 2018; Song et al. 2018). However, such sorting is substantially
flatter for bargaining council firms, particularly above the median of AKM firm effects, suggesting that
the higher firm wage premia are driven by the regulatory differences rather than, for example, firm
production choices. Despite these differences, the figure also shows that there is considerable overlap in
the distributions of firm wage premia between bargaining council and other firms. These cross-sectional
differences highlight the potential effects of bargaining councils, but also emphasize the possibilities for
adequate matching in a credible research design.
Where are bargaining councils located? Figure A2 shows the proportion of bargaining council workers
by industry and earnings decile. Bargaining councils are concentrated mainly in the manufacturing,
construction, trade, and transport industries, in addition to covering the public sector (the major part of
social services). Bargaining council workers are mostly in the upper-middle areas of the firm earnings
distribution, increasing in proportion from about 20 per cent in the lowest decile up to 70 per cent in
the 8th decile, and then dropping off to 30 per cent in the uppermost decile. Part of this is endogenous:
bargaining council firms are higher in the firm earnings distribution because they are bargaining council
firms—that is, wages are higher from negotiated contracts. But part of this is also the types of firms,
as the unconditional value added for bargaining council firms is higher. Either way, this figure shows
that marginal changes in the wage premium are likely to affect upper-middle parts of the firm earnings
distribution more.
Table E3 in the Data Appendix (Section D3) provides a detailed breakdown of the characteristics of each
bargaining council used in my analysis. The largest is the Metals and Engineering Industry Bargaining
Council, with nearly one million workers, and there are several smaller bargaining councils with only a
few thousand workers. There is substantial variation across most characteristics, with minimum wages
as low as ZAR2,500 per month or as high as ZAR10,000 per month. In general, higher value added bar-
gaining councils appear to have higher minimum wages, though profits are not strongly related.
In Figure A3 I follow Card and Cardoso (2021) in decomposing log wages into the sum of a baseline
wage (I set this as the value of the first percentile of wages), the gap between the baseline and the relevant
firm’s minimum wage (‘minimum wage gap’), the gap between the firm’s minimum wage and the firm’s
average wage (‘firm wage cushion’), and the gap between the firm’s average wage and the worker’s wage
(‘own-wage gap’). I restrict firms to the private sector. The first panel shows that the minimum wage
gap accounts for the majority of the firm average wage in bargaining council firms, ranging from the full
average wage for the lowest value added firms to about half the firm wage for the highest value added
firms. Note that this minimum wage gap is constant across the deciles of value added on average, despite
the strong association between minimum wages and value added between each bargaining council, as
noted in Table E3.
The second panel of Figure A3 displays the cross-sectional profile of workers as they age. There is a
steep initial slope in the firm wage cushion and own-wage gap for youth, approximately until age 35,
before levelling off. The minimum wage gap, however, has a much flatter incline across the age cohorts,
suggesting perhaps more limited upward mobility in these bargaining council minima even if they do
constitute a substantial component of the wage.
One stark characteristic common to private sector bargaining councils is the low proportion of women:
on average, 30 per cent compared to over 50 per cent for the rest of the labour market. I estimate here that
nearly half of the gender wage gap is accounted for by net differences in firm average wages as opposed
to net differences in the own-wage gap. This is consistent with my previous analysis in Bassier (2019),
where I similarly estimated that nearly half of the gender wage gap is accounted for by differences in
the types of firms women are at compared to men (as measured by AKM firm wage premia).
6Using the decomposition as in Figure A3, I further estimate that over 80 per cent of the gender gap in
firm average wages is accounted for by differences in minimum wage gaps. Thus the minimum wage
gaps explain over one-third of the overall gender wage gap for formal sector workers, and this is a result
of the combination of bargaining council firms being high on the firm earnings distribution, along with
bargaining councils having such a disproportionately low number of women.
There are also differences even within bargaining council firms, as shown in the bottom panel of Figure
A3. Women tend to be towards the lower minimum wage of bargaining councils: 20 per cent of the
gender wage gap for bargaining council workers (or half of the gap in firm average wages for these
workers) is accounted for by differences in minimum wage gaps. Finally, the public sector bargaining
council has a completely different gender impact to the private sector: there are more women than men
in the public sector, and minimum wages actually favour women here. I explore these decompositions
further in ongoing analysis for this paper, including the substantial gender-equalizing effect of the public
sector.
Overall, the matching of agreements into the tax data reveals a profile of bargaining councils that shows
higher firm wages and lower within-firm inequality, though with wide variation across value added, min-
imum wages, and other characteristics. Two common features, namely the lower proportion of women
and the location of the mass of workers towards the higher parts of the firm earnings distribution, high-
light the potential for marginal gains of bargaining council workers to increase gender and wage inequal-
ity among workers. On the other hand, the high value of profit per worker observed within bargaining
councils highlights the potential for gains of these workers to reduce overall income inequality.
3 Treatment effects of contracted wage increases
3.1 Empirical design
Bargaining council agreements are generally formed by core members, then extended to the rest of the
industry-location, idiosyncratically defined. Though each agreement typically specifies wages by ad hoc
region-by-occupation cells, wage increases are often ‘across the board’; for example, the Road Passenger
agreements for the years 2012–16 each stipulate general percentage increases to the existing minimum
wages, even though minimum wages are defined by occupation. Wage agreements are typically indexed
to inflation, and set for three years ahead.
I identify events as large real minimum wage increases in the equivalent of a ‘general labour’ occu-
pational category (usually the lowest), where ‘large’ is defined as greater than 3 per cent. I exclude
similarly large increases in the preceding two years (to ensure a clean pre-period). I combine approx-
imately 50 of these increases across different bargaining councils in a stacked event-study design like
Cengiz et al. (2019).8 Figure B1 shows the distribution of all real bargained wage increases, concentrated
just above 0, as well as the selected event-wage increases.
The control sample contains all non-bargaining council firms from the same calendar years that are in the
larger region and industry of the bargaining council. For example, the restaurant bargaining council firms
located in district councils in Gauteng province are compared to all firms in both Gauteng province and
the trade industry. Given that spillovers may increase wages in the non-treated firms (see next section),
I exclude connected non-treated firms from the regression sample, where connected is defined as firms
8 There are 47 different events, defined as a large wage increase within a separately bargained bargaining council industry-
region. Note that some bargaining councils have multiple separately bargained industry-regions. There are 33 unique wage
increases across these 47 events.
7with more than 1 per cent of worker flows to bargaining councils. Figure B4 shows how much the wage effect is attenuated when including contaminated controls, from about 4 per cent to 3 per cent, highlighting the importance of choosing clean controls for the event-study. I also restrict the sample of bargaining council and control firms to be balanced across the event years, and for firms to have at least ten workers. My main specification below includes fixed effects for each firm (φ j ), event by calendar year (τt ), lo- cation by year (θlocation×t ), pre-event firm size and wage by year (γ f irmsize×t and αwage×t ), as well as pre-event changes in log firm size (β∆ln f irmsizet
wage contracts for smaller firms, and due to the institutional enforcement of these wages—inspectors
are more likely to be called by unionized firms, and small firms are less unionized.

I show other firm responses to bargained wage increases in Figure B3. Average separations decrease
by about 2 per cent at the event year (statistically significant in event years 0 and 1), after flat pre-
trends. Interpreted directly, this implies a firm labour supply elasticity of about 1.5, which suggests
considerable monopsony power in line with Bassier (2019).10 However, this is very likely biased as an
estimate of a reduction in turnover since I cannot differentiate between voluntary quits and involuntary
fires. Indeed, firm size does not show detectable changes, with a confidence interval between –0.02 and
0.01. Unemployment insurance payments respond strongly, with flat pre-trends and an increase of about
1.5 per cent—implying a positive co-variance between wages and amenities in these contracts. As we
noted in Figure B2, wages increase most at the bottom of each firm, and this figure shows the resulting
decrease in within-firm wage inequality. Finally, there do not seem to be any systematic pre-trends
in value added or the profit margin per worker, which is reassurance that these estimates do not carry
substantial bias from possible endogeneity of bargaining contracts to prior firm performance.

The main specification given by Equation 1 includes pre-period controls of wages and firm size in both
levels and trends. Figure B4 shows that these controls are not necessary for the wage effects, where
using only firm and location by time fixed effects still results in flat pre-trends and a 4 per cent increase
in wages, as in the main results above. However, using this sparser specification, firm size exhibits a
pre-trend that disappears with the additional controls. Figure B4 also shows what happens when we fail
to exclude potentially ‘contaminated’ controls: the wage effect is about 3 per cent instead of 4 per cent.
This hints strongly at the spillover results presented in the following section.11

Although these results show a sharp impact of the contracted wages, the level of contracted wages can
be below (due to firm wage setting) or above (due to weak enforcement) the actual level of wages. As
a bounding exercise for the direct effect of contracted wages, I consider a counterfactual simulation of
perfect compliance where I set a worker’s wage equal to the relevant legal wage if below it, or leave the
wage as is otherwise. Using the primary specification above with this simulated outcome, the post-period
effect on median within-firm wages is only slightly higher (3.5 per cent) than when using observed wages
(3 per cent). While the level of wages may exhibit substantial non-compliance across these firms, this
implies that the dynamic changes in wages follow the contracted wages quite closely.

4        Spillover effects of contracted wage increases

4.1      Empirical design

In a monopsonistic market, firms compete with each other for workers by setting higher wages. An
increase in a treated firm’s wage will elicit a response from ‘closely connected’ firms—that is, firms
that compete over the same pool of workers. Workers may leave connected untreated firms and move
towards the treated firms. The connected untreated firms may also increase wages to incentivize workers
against leaving towards the treated firms.

10 Using the 3 per cent wage effect, yielding a separations elasticity of –0.75, and the formula in Manning (2003a) that the firm
labour supply elasticity is –2 times the separations elasticity.
11 We can actually use these estimates to back out a rough indirect estimate of spillovers. Noting that there are about 20,000
bargaining council firms, and a further 25,000 high-spillover firms, the decrease in wage effect from 4 per cent to 3 per cent
implies a spillover wage effect of about 2.2 per cent. This is very close to several of the direct estimates of wage spillovers in
the next section.

                                                                9
To quantify these wage responses, or spillovers, from connected untreated firms, a key question is how
the treatment dosage is defined. I measure the average proportion of worker flows between each industry-
location of non-treated firms with firms in the bargaining council in the event-study pre-period. The idea
is that if the same workers are employable at different firms, this set of firms defines a fluid labour mar-
ket. Labour-constrained firms are competing over this same labour pool, meaning that wage spillovers
operating through the labour market should transmit through this channel of worker flows. This average
flow measure is used to measure spillovers in the product market space by Bloom et al. (2013).
My flow measure is also very close to one used by Arnold (2020) in defining labour markets. In deriving
a measure of labour market concentration (akin to the Herfindahl–Hirschman Index, or HHI) that is not
dependent on discontinuous industry and location boundaries, Arnold (2020) defines the value of a job
in industry-location A relative to a job in industry-location B as the flow of workers from B to A divided
by the total number of workers in A. In my case, industry-location A can be considered the bargaining
council. The major difference is then dividing by the size of A, which I show does not change the results
substantially.12 In my data, the coefficient in a regression of log wages on log value of the firm, defined
following Arnold (2020), is 0.1.
In terms of specification, I follow much of Equation 1 used for bargaining council effects, except I
replace the main variable of interest (previously the event-year treatment indicators) by the average flow
measure for every firm j(c), where c is the local labour market cell. This flow measure represents a
treatment dosage. I exclude non-treated firms within the same industry-location as bargaining councils
in case these are purely errors in the treatment identification. Identification now arises from variation
in pre-event connectivity: comparing non-treated firms of varying degrees of connectivity to bargaining
councils but within the same location and of similar firm size. That is, do untreated firms that are more
strongly connected to treated firms exhibit outcome responses to the contracted wage events?
−2 2
y j,t = ∑ δt (τt × f low j(c) ) + ∑ δt (τt × f low j(c) ) + φ j + θevent×loc.×t
t=−3 t=0
+γ f irmsizet=−2 ×t + αwaget=−2 ×t + β∆ln f irmsizetA quick comment on the constructed regressor, the flow variable. Why not simply compare firms in
the same industry-location as bargaining council firms? First, industry and location are in fact not good
indicators of whether firms draw from the same labour market. One way to see this is to compare the
flow of employment–employment firm switches across the full sample of workers. Only 30 per cent of
switches are within the same SIC (Standard Industrial Classification) one-digit industry! Fully one-third
of switches are to a different province entirely. Using industry and location is a weak proxy for flows,
which we can rather directly observe through worker transitions as I have done. A second reason is more
practical: since the bargaining council identification is fuzzy, choosing spillover firms only in the same
industry-location may pick up actually treated bargaining council firms, thereby estimating spurious
spillover effects.
4.2 Descriptives of spillover firms
What do these spillover firms look like? Table C1 shows the characteristics of firms by the proportion of
their flows to bargaining council firms (as explained above). I categorize firms into bargaining council
firms, and then firms with high, medium, low, and negligible flows to these bargaining council firms.13
In this stacked event firm data set used in the main specification (restricted to event-year –1 and firms
with more than ten workers), nearly one-third of bargaining council firm flows are to other firms in the
same bargaining council. The high and medium categories together have close to the number of firms in
the relevant bargaining councils (25,000 compared to 19,000), but fewer workers (four million compared
to five million). The firm size is considerably larger in bargaining council firms than in spillover or other
firms (270 compared to 170); the proportion of women is much lower in bargaining council firms; and
the AKM firm wage effect is 10–15 per cent higher in bargaining council firms. In general, the other
characteristics such as wages, churn, AKM worker fixed effects (as a proxy for worker quality), and
profit per worker are similar.
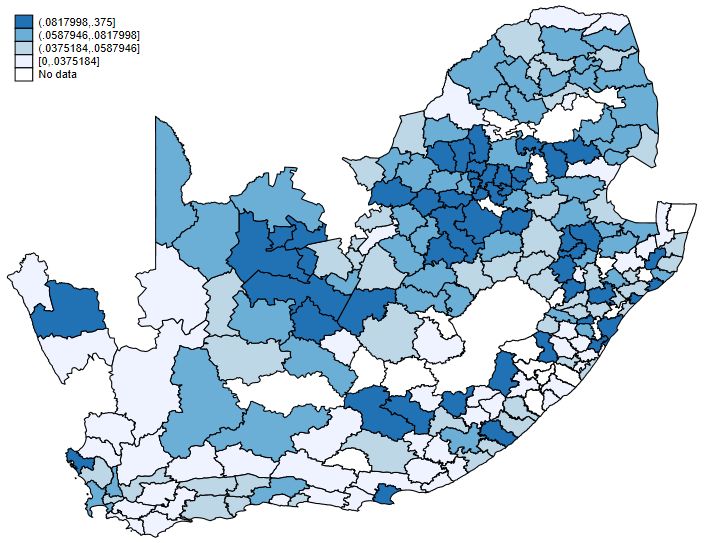
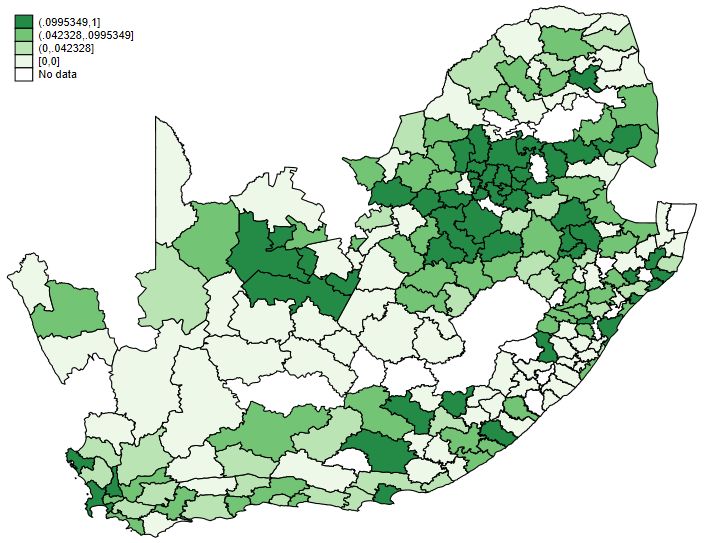
Where are the high-spillover firms located compared to the bargaining council firms? Figure C1 shows
the geographic location of Metals and Engineering Industry Bargaining Council firms as an example.
Bargaining council firms are located in the urban centres (Gauteng region features most prominently),
and this is replicated in the map of spillover firms. Even the region straddling the Northern Cape and
North West, which is not a major urban centre, also shows spillover firms in the same area. Indeed,
it would be strange otherwise, if workers were switching between firms that were geographically dis-
tant.
Figure C2 compares the proportions of bargaining council, spillover, and other firms by industry and
earnings decile. Spillover firms are distributed much more evenly across both industries and earnings
deciles than are bargaining council firms. The implications are that there is a lot of movement across
industries, as well as firm earnings classes. The spillovers observed below therefore propagate diffusely
through the economy.
4.3 Results
Figure C3 shows the spillover effects on firm wages. For an indication of magnitude, I scale the outcomes
by the average flow in approximately the top 24,000 firms.14 To interpret this, the figure shows that
average wages in industry-locations with greater than 5 per cent of pre-event worker flows to the relevant
bargaining council experienced an increase of nearly 4 per cent at the 25th percentile of within-firm
13The categories are arbitrarily divided as follows: high is above 0.1, medium is between 0.05 and 0.1, low is between 0.01
and 0.05, and negligible is below 0.01.
14 This is an arbitrary scaling, since every firm in the entire economy has a measure of flows, even if most were 0. The value
24,000 is chosen because it is the number of firms with more than 5 per cent of their flows towards bargaining councils. It is
also a comparable figure to the number of firms in bargaining councils.
11wages and 3.5 per cent at the 50th percentile of within-firm wages. This is as large as the comparable
wage effects on directly treated firms. There is a substantial and significant effect across the distribution
of within-firm wages, ranging from about 2 to 4 per cent. There are also substantial effects for spillover
firms across quantiles of the between-firm wage distribution, with similar patterns to what I found for
bargaining council firms: the effects are not statistically significant for the lowest- or highest-wage firms,
but the wage effects reach as high as 5 per cent in the middle-waged firms. Recall that I am careful to
exclude potential bargaining council firms in these regressions, by excluding all firms from the spillover
regression that are in a similar industry to the bargaining council.15
Figure C4 shows other firm outcomes. Separations decrease strongly in the post-period, equal to about
a 4 per cent decrease in separations and implying a firm labour supply elasticity of about 2.16 Firm size
may decrease, with a point estimate of –2 per cent, but not statistically significant. As for bargaining
council firms, unemployment insurance payments increase strongly, up to 2 per cent by the final event
year. For each of these outcomes, including the wages, the effect appears strongest in the final event
year. This implies some kind of lagged response, as wages increase by the first year after the event in
bargaining council firms, and may take a year to propagate outwards through worker flows.
Once again, profit margins per worker do not exhibit pre-trends, which is reassurance against differential
prior firm performance driving these results. The post-period decline in profits for these firms highlights
a potentially sharper trade-off between profits and wages for spillover firms than for bargaining council
firms. Such a trade-off between profits and wages is consistent with contracted wage increases, which
tend to be about splitting rent rather than choosing a point on a wage–employment locus (Draca et al.
2011). How plausible is this trade-off in terms of the observed reduction in profit and increase in wages?
I perform a counterfactual simulation in which I increase each firm’s wage bill by 3 per cent, and then
reduce firm profits by that amount in absolute terms. While this exercise omits several dynamic consid-
erations such as adjustments in firm size, changes in composition, effort effects, or the non-linearity of
the marginal profit per worker, it is reassuring that the average reduction in profit per worker implied is
3.3 per cent. This is not far from the decrease in profit per worker estimated for spillover firms, which
ranges from 3 to 7 per cent.
In Table C2 I provide the point estimates for the final period as well as for alternative specifications of
these spillover regressions. Column 1 shows the responses for the 25th and 50th percentiles of within-
firm wages, as well as firm size and profit margin.17 Column 2 shows the estimates using ordinary
least squares (OLS), demonstrating that there is substantial attenuation associated with the generated
flow regressor and corrected by the IV split-sample strategy. However, as expected relative to an IV
regression, the OLS standard errors are much smaller. Column 3 presents the results when using a binary
indicator for treatment, as opposed to a continuous flow treatment regressor. Column 4 adds industry
by time fixed effects, to account for any trends in industries that may be shared with the bargaining
council and driving the results—for example, a booming export industry that enabled the contracted
wage increases to begin with. Column 5 controls for the churn of a firm, interacted with time, to address
concerns that these spillover effects are simply picking up wage growth in firms with high churn. Column
15 For example, if a bargaining council is defined by the three-digit industry code, I exclude all firms in the same two-digit
industry code. This means that adjacent three-digit industry codes that may be included in bargaining contracts do not enter the
regression. This also means that the spillovers are potentially underestimated, since these firms that are excluded are high-flow
firms (depending on the linearity of the relationship of spillovers to the flow measure).
16 The firm labour supply elasticity is the elasticity of firm size to wages, which is equal to –2 times the separations response
(Manning 2003a). The spillover shock is plausibly exogenous to the firm, identifying movements along the firm labour sup-
ply curve. However, this separations elasticity is likely biased, especially if the wage increases are a response to changing
separations towards bargaining council firms.
17 The
event-year 2 effect is not statistically significant for the profit margin, but as shown in Figure C4, it is significant with
comparable magnitude in event-year 1. It is also significant in the final year for several alternative specifications.
126 estimates the flows directly between industry-locations (rather than between firms, which are then
aggregated to industry-locations). Finally, column 7 divides the regressor by the churn in the firm as in
the value measure used by Arnold (2020). The results are similar across these specifications, ranging
from 1 to 4 per cent for the wage spillovers (all strongly significant with relatively flat pre-trends), and
from 0 to –2 per cent for the firm size effects (some significant, some not).
As in the case of bargaining council firms, there is a lower wage effect for higher percentiles of within-
firm wages, and this results in a decrease in within-firm wage inequality. The increase in wages for
spillover firms also comes out when looking at individual-level workers, especially when considering
low-wage workers as well as stayers. That is, the wage effects on spillovers are not purely about worker
composition or differential wages for new hires.
Figure C5 provides an indication of the importance of the spillover effects relative to the direct effects on
bargaining council firms. I use the full firm by year panel in the tax data, and estimate a cross-sectional
bargaining council firm wage premium as in Table A1, except by tercile of firm wages. The figure shows
in green the effect of subtracting this estimated bargaining council premium from bargaining council
firms, as an indication of the effect of removing the wage effect from bargaining councils. Average firm
wages across the economy decrease most in the middle tercile, by about 7 per cent. I then estimate the
flows from each firm to bargaining councils, and multiply this flow by my estimate of spillovers above.
This simulation shows that further subtracting out the plausible spillover effect of bargaining councils
changes the wage distribution by a comparable magnitude to the direct effect of bargaining councils, and
that it has a much larger effect at the bottom tercile. This is driven by the relative location of bargain-
ing council and spillover firms along the firm wage distribution, as shown in Figure C2. Overall, this
simulation suggests that the firm wage distribution would shift down substantially without bargaining
council wage premia when taking into account their direct and indirect effects. However, due to the mix
in locations of bargaining council and spillover firms along the firm earnings distribution, the effects on
inequality are negligible in this simulation.
5 Discussion
In my analysis of the impact of bargaining council wage contracts, I presented evidence of large effects
on bargaining council firms, including increases in wages and negligible effects on firm size. Impor-
tantly, I show that firms that are not part of bargaining councils, but that are strongly connected to them
via worker flow and substitution patterns as observed in the data, also increase their wages after the
bargaining contract wage increase in what I interpret as a spillover effect. I discuss these results further
below, showing suggestive evidence of reallocation, considering robustness of these results to various
specification concerns, and highlighting important aspects of heterogeneity.
5.1 Reallocation
Although the aggregate effect on bargaining council firm size is negligible, I show that there are signifi-
cant decreases in employment for low-wage firms in conjunction with suggestive evidence of increases
in firm size for higher-wage firms. Theoretically, reallocation of workers from low-wage to higher-wage
firms can occur when firms are labour constrained, a minimum wage forces low-wage firms to downsize,
and those workers transfer or reallocate towards the higher-wage firms. Even in a high-unemployment
environment such as South Africa, bargaining council firms could plausibly be labour constrained if the
jobs require skills and experience that are not easily found at the prevailing wage and if workers do not
easily switch firms. Alternatively, monopsonistic wage setting by higher-wage firms may mean that the
minimum wage increase results in an increase in firm size for larger firms as in standard monopsony
models (Dickens et al. 1999). On the other hand, if firms are marking down wages for other reasons,
13a minimum wage could still force out the lower-wage firms while raising wages without affecting em-
ployment in higher-wage firms.
In Figure D1, I show the coefficients of the main bargaining council firm specification 1, with additional
interacted indicators for the tercile of the bargaining council wage distribution. As before, I show the
outcomes of firm median wage, firm separations, and firm size. The bottom tercile shows a statisti-
cally significant decrease in firm size, along with very little change in separations despite the increase
in wages.18 In contrast, the middle tercile shows a positive but not statistically detectable change in
firm size, as well as a marginally significant decrease in separations. Adjusting for the different wage
increases by dividing these firm size changes by the wage coefficient, the own-wage elasticity for the
bottom tercile is large and negative at –0.7, compared to the middle tercile which is positive at 0.3. As
another indication, Figure D2 shows the results from a similar regression, this time considering deciles
of value added per worker. The figure shows that the lowest value added firms decrease in firm size
relative to the highest value added firms.
As explained above, these results should be interpreted with caution. A key question is whether there
was an increase in firm size for higher-wage firms. Here, the firm size effect is not significant, but as
I show in Table D2 the coefficient is positive and significant using other measures such as for higher
AKM firm fixed effects. Ultimately, this question relates to what the aggregate effect on employment
was: the mean point estimates are negative but neither statistically significant nor robust. In the case
of neutral aggregate employment effects, there could be substantial churn effects if the workers who
lost jobs are not the same as workers who gained jobs, even if this does mean the mass of workers in
bargaining councils moved towards higher-wage firms. Lastly, there is the question of the productivity
effects, as workers move towards higher value added firms. In ongoing work for this paper, I explore
these questions further.
5.2 Robustness
My main results are robust to a number of concerns, with alternative specification results shown in Table
D1. Column 1 shows the main OLS regression results for bargaining council firms (top panel) and for
spillover firms (bottom panel). I show the cross-wage elasticity (CWE) as the log wage effect on median
firm wages for spillover firms relative to bargaining council firms.
Column 2 presents the results from a specification that includes firm-specific linear pre-trends, con-
structed over the pre-period. This renders the pre-trend test meaningless (since there is no pre-trend by
construction), but partials out any pre-trend if that was a concern in any of the previous event-studies.
The estimates are extremely similar, as expected.
One weakness of the bargaining council event-study is that the number of years before the event is
chosen arbitrarily, in my case as a balance between having enough years to judge a pre-trend while
retaining enough events. Bargaining councils generally renegotiate wages annually, with major rounds
at three-year intervals. In column 2, I therefore exclude major events across event years –4 to –3, which
is just outside the primary event-study period, but would adjust for the previous bargaining round. For
example, a concern is that lagged dynamic effects of the contract changes in the previous round would
show up as pre-trends in my pre-period. While about half of the number of events are lost in this cut, the
results for bargaining council and spillover firms are very similar. Figure D3 shows the event-studies,
notably a flatter pre-trend for the wage spillovers.
18 Note these bottom-tercile firms are not the same as the low-wage firms shown in Figure B2. The former, discussed here, are
the bottom tercile of bargaining council firms, which are actually in the middle part of the overall distribution.
14You can also read


