LOCAL LABOUR MARKET PLAN 2020-2021 - WINDSOR-ESSEX - Workforce WindsorEssex
←
→
Page content transcription
If your browser does not render page correctly, please read the page content below

2020-2021

                                 LOCAL
                                LABOUR
                                MARKET
                                  PLAN
                                W I N DSOR - E S S E X

www.workforcewindsoressex.com
ACKNOWLEDGMENTS
Workforce WindsorEssex would like to thank the various stakeholders who contributed their time,
              ideas, and expertise to the 2020-2021 Local Labour Market Plan.

 Workforce WindsorEssex would also like to thank Samantha Dalo, Sarah Fram, Nikolas Prsa,
  Corey Shenken, and Tashlyn Teskey for their work in developing and authoring this report.

Thanks are also due to the Ministry of Labour, Training and Skills Development for their support.

                                HOW DID WE DO?
      We invite your feedback on all publications produced by Workforce WindsorEssex:
                             www.workforcewindsoressex.com

                     880 North Service Road #201, Windsor, ON, N8X 3J5
                                   Phone: (226) 674-3220

                               info@workforcewindsoressex.com

   This document may be freely quoted and reproduced without permission from Workforce
    WindsorEssex provided that the content remains the same and that the organization is
                      acknowledged as the author of this document.

  Workforce WindsorEssex is committed to ongoing research to enhance local labour market
                          planning in the Windsor-Essex region.

 Workforce WindsorEssex assumes no responsibility for its use or for the consequences of any
                                 errors or omissions.

 The views expressed in this document do not necessarily reflect those of the Government of
                           Ontario or the Government of Canada.
EXECUTIVE SUMMARY

T
         The Community Labour Market                      number of clients identifying as a newcomer and
         Plan provides an update on the                   an internationally trained professional continues to
         local labour market, including                   increase dramatically over the last four years. As
         information on demographics,                     the majority of clients exit services after becoming
the labour force, Employment Ontario                      employed, many clients exit to participate in
services, and industry in Windsor-Essex.                  education/training.
This information is supported by data and                 The alignment of the skills of the labour force
feedback from local stakeholders, and the                 with in-demand occupations remains a concern,
plan outlines challenges and opportunities                becoming exaggerated throughout the ongoing
related to local labour market conditions.                pandemic. Apprenticeship registrations have
                                                          remained consistently low since 2016-17, despite
Changes in the age demographics of local                  the ever-present demand for skilled tradespeople in
residents are likely to affect long-term workforce        multiple industries, particularly manufacturing and
development strategies, with an 11% increase in           construction. While the agriculture and transportation
those aged 65-74 and a 0.2% decrease for those            sectors are facing higher demand for workers during
in the prime working age of 25-54. Windsor-Essex          these times, both sectors continue to incorporate
saw a population increase, due to both international      further technological advancements to increase
permanent residents and interprovincial migration.        automation in their operations. The Information
Current restrictions on mobility may be leading           Communications Technology sector is highly in-
local jobseekers to continue their job search locally,    demand as the ongoing pandemic continues to move
                                                          employment and social activities online. However, a
limiting the talent loss to other regions. As many
                                                          shortage of qualified workers continues to impact the
new residents are coming from the Toronto region,
                                                          growth of the sector locally.
and population losses to rural regions, an increase
in remote work opportunities may lead to increased        Workforce WindsorEssex has undertaken many
migration to and from our region continuing.              projects during 2020-21 and developed numerous
                                                          resources to assist in local workforce planning and
The labour force will continue to be negatively           development. The community has demonstrated
impacted as the pandemic continues to affect local        great strength and commitment to supporting
businesses, with changing restrictions causing            the workforce in Windsor-Essex and has come
fluctuations in demand for workers throughout             together to collaborate on many initiatives to support
various sectors. While Windsor-Essex employers            jobseekers, employers, and employees. Together,
posted thousands of jobs throughout 2020 in a range       we will continue to create and sustain initiatives that
of sectors, the pandemic has created additional           support the stability and longevity of the Windsor-
barriers to employment, including safety of the           Essex workforce.
workplace, caregiving responsibilities, and lockdown
restrictions on non-essential businesses. These
barriers can make it difficult for employers to recruit
workers for in-demand occupations, particularly in
the manufacturing, agriculture, healthcare, and retail
industries.

Employment Ontario service providers continue to
support jobseekers in the region, though the number
of clients has been subtly declining since 2016. The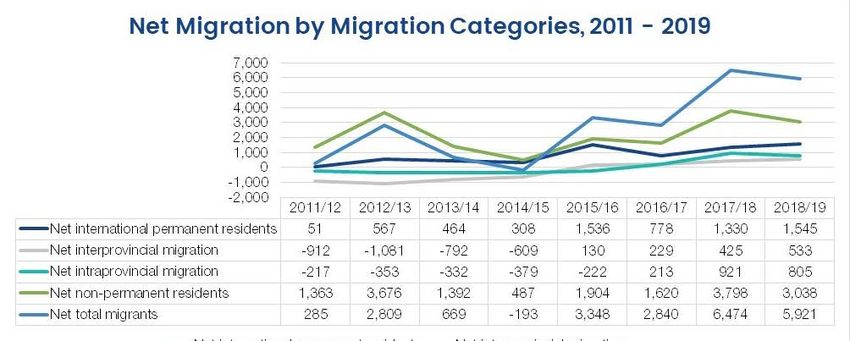
TABLE OF
CONTENTS
 1. INTRODUCTION.................................................................................................... 1
 2. METHODOLOGY................................................................................................... 2
 3. OUR COMMUNITY................................................................................................ 2
 		     a. Population.................................................................................................. 3
 		     b. Income........................................................................................................ 4
 		     c. Educational Attainment............................................................................. 5
 		     d. Immigration................................................................................................ 6
 		     e. Languages.................................................................................................. 7
 		     f. Migration.................................................................................................... 8
 4. OUR LABOUR FORCE....................................................................................... 10
 		     a. Labour Force Survey................................................................................11
 		     b. In-Demand and Hard-to-Fill Positions.................................................... 12
 		     c. The Labour Force by Occupation........................................................... 16
 		     d. Promising Sectors and Occupations..................................................... 16
 5. EMPLOYMENT ONTARIO DATA......................................................................... 18
 		     a. Demographic Information of Clients Served......................................... 18
             – Employment Services
 		     b. Literacy and Basic Skills......................................................................... 23
 		     c. Apprenticeship......................................................................................... 24
 6. OUR LOCAL INDUSTRIES................................................................................. 25
 		     a. Business Counts..................................................................................... 25
 		     b. Industry Updates..................................................................................... 26
 			        i. Agriculture............................................................................................ 26
 			 ii. Construction........................................................................................ 27
 			 iii. Educational Services......................................................................... 28
 			 iv. Healthcare and Social Assistance..................................................... 29
 			 v. Information and Communication Technology................................... 30
 			 vi. Manufacturing..................................................................................... 31
 			 vii. Tourism and Hospitality.................................................................... 32
 			 viii. Transportation and Warehousing.................................................... 33
 7. COVID-19 IMPACTS ON THE LOCAL LABOUR MARKET................................ 34
 8. CONCLUSION..................................................................................................... 37
 9. BIBLIOGRAPHY.................................................................................................. 38
 10. APPENDIX: “Challenges and Reccomendations”........................................... 40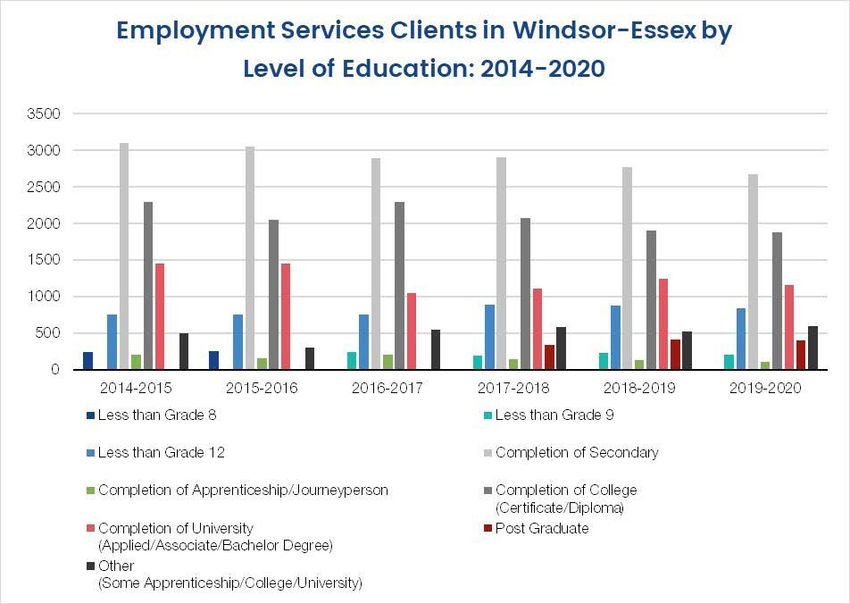
INTRODUCTION

INTRODUCTION
Workforce WindsorEssex is a workforce and community development board whose mission
is to lead regional employment and community planning for the development of a strong
and sustainable workforce. The local labour market has witnessed a large supply of workers
and a small demand for jobs over the last decade; this has contributed to the increase in
unemployment in the region. This document acknowledges the effort of industries represented
in Windsor-Essex and the commitment to building strong sectors and creating employment
opportunities in our growing community.
Unlike previous Workforce WindsorEssex local labour market reports, this project provides the
current COVID-19 epidemiological influence on sectoral growth, employment opportunity, and
education for industry-related skill development. COVID-19 impacts on industry data analytics
are acknowledged throughout this document and demonstrate the difficulties faced by sectors,
employers, and current and prospective employees. The global pandemic will have long-term
effects on the local labour market. This disruptive change has stimulated and accelerated the
growth of the automation industry. An in-depth analysis of industry updates will provide insight
into employment trends and the shift in skills needed following the emergence of the automation
sector.
Finally, this report provides the Windsor-Essex workforce with insight into labour force
characteristics such as in-demand and hard-to-fill occupations, hard and soft skills necessary
for the workplace, promising sectors and occupations, and employer trends. To successfully
provide this, Workforce WindsorEssex conducted community consultations with industry
representatives across different sectors to identify the challenges employers are facing with
the operation, sustainability, recruitment, retention, work-based learning, and growth of their
business. Additionally, labour force surveys and employer surveys were used in collaboration
with community consultation and administered to gather evidence on the highest-ranked
occupations. With this available qualitative and quantitative data, this report intends to act as a
guideline for employers and employees with attention to job prospects, skill development, and
knowledge of Windsor-Essex’s growing sectors.

                                                                                                      1
METHODOLOGY

    METHODOLOGY
    The Local Labour Market Plan was written by examining data from a variety of sources,
    including data from Statistics Canada, Employment Ontario, Emsi Analyst, online job postings,
    and surveys and consultations conducted by Workforce WindsorEssex. Employer consultations
    referenced in this report took place in the summer of 2020 with 65 employers and 22 community
    organizations, including educational institutions, municipal government, and employment
    and settlement service providers. By examining this data, we were able to paint a picture of
    the current labour market in Windsor-Essex, detailing trends, challenges, and opportunities
    related to the labour market in our region. Additionally, Workforce WindsorEssex conducted
    consultations with various stakeholders to confirm our findings, including members of our
    Workforce Advisory Committee. The membership of this group represent industry, employment
    services, government, and community organizations, ensuring the Local Labour Market Plan
    considers the perspective of the many stakeholders in our community.

                                                                                       In the report, there may be reference made to
                                                                                       the geographies of “Windsor CMA”, “Leamington
                                                                                       CA”, and “Essex CD”. Each of these is defined as
                                                                                       follows:
                    SOR
          WIND
                                 H
                               SE
                            UM                  LAKESHORE
    LASALLE            TE
                          C                                                             LEGEND:

                                                                                         Windsor CMA (Census Metropolitan Area):
                  RG                                                                     Includes the municipalities of Windsor,
                U
            STB                                                                          Tecumseh, Lakeshore, Amherstburg, and
      H  ER                              KINGSVILLE
                                                                                         LaSalle.
                              ESSEX                          LEAMINGTON
    AM
                                                                                              L eamington CA (Census Agglomeration):
                                                                                               Includes the municipalities of Leamington
                                                                                               and Kingsville.
                                                     PELEE

                                                                                               ssex CD (Census Division): Includes the
                                                                                              E
                                                                                              municipalitiesofWindsor,Tecumseh,Lakeshore,
                                                                                              Amherstburg, LaSalle, Essex, Leamington,
                                                                                              Kingsville, and Pelee, essentially making up the
                                                                                              entirety of “Windsor-Essex”.

2    15
          Statistics Canada, 2016 Census of Population, Statistics Canada Catalogue no. 98-316-X2016001.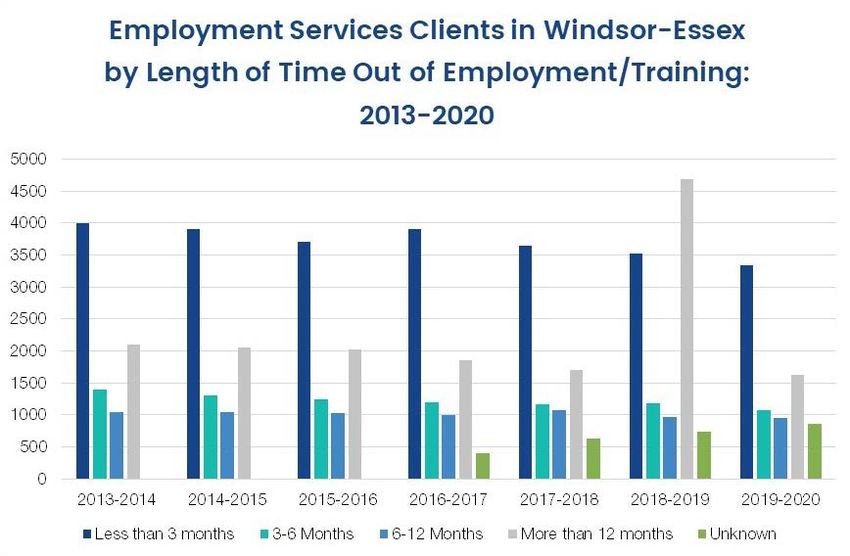
OUR COMMUNITY

POPULATION
From 2013 to 2019, the population of Windsor-Essex has changed in size as well as age distribution.

                           POPULATION CHANGE BY AGE GROUP (2016-2019) 1
                       0-14        15-24       25-34        35-44       45-54        55-64        65-74        75-84    85+     TOTAL
        2016         67,560       54,451       48,735      52,148       61,329      57,112       39,980       21,021   9,714    412,050
        2019         67,927       62,081       54,439      49,334       57,075      59,924       44,376       23,176   10,224   428,556
         %
                      +0.54       +14.01       +11.70       -5.40        -6.94       +4.92       +11.00       +10.25   +5.25    +4.01%
       change

 From 2016-2019, the population of Windsor-Essex grew from 412,050 to 428,556, which
 indicates a 4.01% change in population and an increase of 16,506 people. Age groups over the
 age of 55 saw the greatest percentage increase in their groups between 2016 and 2019, with
 ages 65-74 experiencing the largest increase of 11.0%. The prime working age population of 25-
 54 saw an average decrease in population by 0.2%.1

                                                                                                                         1

   1
       Statistics Canada, “Population estimates by census division, 2016 boundaries, annual”, Table 17-10-0139-01.                        3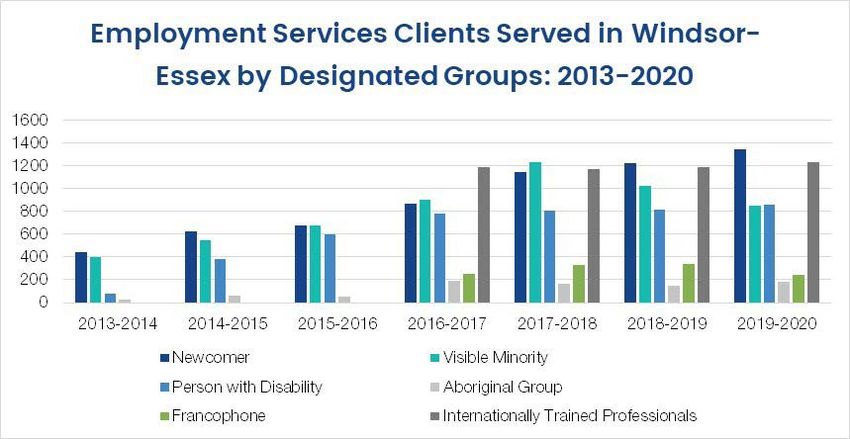
INCOME

                      TOTAL INCOME BY TAX FILERS FOR WINDSOR CMA 2014-2018 2

    The consistent rise in personal income for tax filers in Windsor CMA since 2014 is promising for the
    community. The number of those with an income of $150,000 and over saw the largest increase,
    40%, while the number of those earning under $5,000 decreased by 18% since 2014. While this
    data is from 2018, it is telling of the ascent that our community was on with rising income levels.
    The income data for 2020 will likely tell a different story, with unemployment, wage subsidies, and
    essential business restrictions all impacting local earnings.

       2
           Statistics Canada, “Tax filers and dependants with income by total income, sex and age”, Table 11-10-0008-01.
4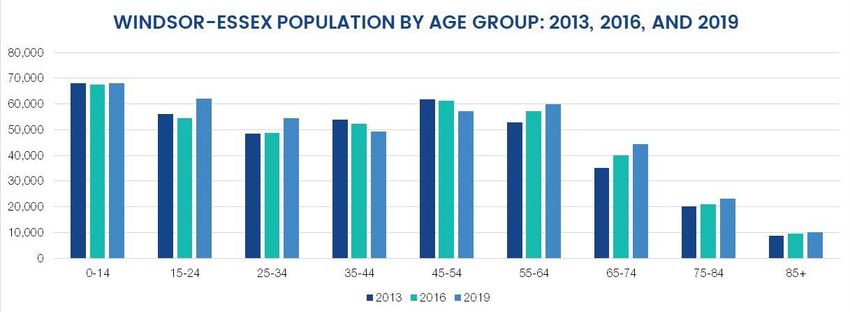
EDUCATIONAL ATTAINMENT

                    HIGHEST EDUCATIONAL ATTAINMENT OF THE POPULATION
                     AGED 25 TO 64 IN 2016 WINDSOR-ESSEX VS. ONTARIO 3

In 2016, it was reported that 40% of local residents had a secondary school diploma or less.
While this percentage may have improved over the last few years with new programs being run by
local education institutions, there will likely be a decrease following the pandemic as the pressure
to begin and/or complete a degree or diploma completely virtual may be too much for new
students. Some students may find that they would rather wait to complete their post-secondary
education until they can do so in-person, leading to a drop in our local educational attainment.

With new funding model changes coming for provincial colleges and universities, the local
educational attainment rates may change as well. With a new performance-based funding model,
tying a portion of government funding to student and economic outcomes, educational institutions
will place a greater focus on ensuring that students have access to on-the-job experiences and
that graduates are career-ready4. Educational institutions will need to adjust curriculum and
course requirements to guarantee that students are developing the knowledge and skills needed
for employment in their field, not only theoretical concepts of study.

 3
   Statistics Canada, 2016 Census of Population, Statistics Canada Catalogue no. 98-316-X2016001.
 4
  Ministry of Colleges and Universities, “Promoting Excellence: Ontario Implements Performance Based Funding for Postsecondary Institutions”,
 November 26 2020, (news.ontario.ca/en/release/59368/promoting-excellence-ontario-implements-performance-based-funding-for-postsecondary-       5
 institutions).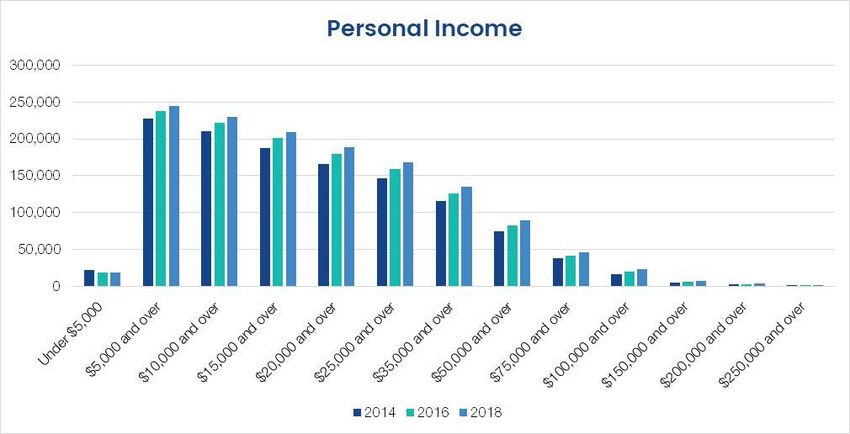
CHALLENGE:
          With the consistently low unemployment rates prior to the pandemic, local employers have
          found it difficult to staff positions. In the 2020 Employer Survey, 42% of employers indicated
          that the top reason for having hard-to-fill positions was candidates not having the required
          technical skills for the job.

              OPPORTUNITY:
              PROMOTE CO-OP, INTERNSHIP, AND EXPERIENTIAL LEARNING IN SECONDARY AND
              POST-SECONDARY SCHOOLS.

              Employers believe youth between the ages of 16-24 can be encouraged to enter in-
              demand jobs in growing industries if secondary and post-secondary schools stressed the
              opportunities for growth in the skilled trades. The new provincial funding model for post-
              secondary institutions further promotes experiential learning opportunities for students,
              which should lead to more skilled and qualified graduates.

    IMMIGRATION
    The current COVID-19 pandemic has greatly affected the agriculture sector as they continue to try
    to employ Temporary Foreign Workers.

    There are new challenges present with employing staff that arrive from outside the country,
    including testing requirements, travel restrictions, and increasing needs for adequate housing.
    Increased stakeholder engagement has been taking place to support both local employers and the
    workers they employ to bring attention to the challenges that are present and the supports that are
    needed from decisionmakers locally and outside the region.

    To coordinate local efforts, the Windsor Essex Local Immigration Partnership has been hosting
    discussions on the issues, including a Community Conversation that included municipal and
    federal government representatives5. Additionally, a positive messaging campaign is being created
    to share with the public on the benefits that having migrant and Temporary Foreign Workers in our
    region provides, for both the economic and social wellbeing of our community.

                                                                    “         BY THE SHEER SCALE OF OUR MIGRANT
                                                                              WORKFORCE HERE, AND BY THE SCALE OF
                                                                              THE OUTBREAKS THAT WE EXPERIENCED,
                                                                              WE HAVE AN INCREDIBLY IMPORTANT
                                                                              LEADERSHIP ROLE TO PLAY IN WHAT                             “
                                                                              IS NOW A NATIONAL CONVERSATION
                                                                              ABOUT TEMPORARY FOREIGN WORKERS.6
                                                                                             -MP, IREK KUSMIERCZYK

6     5
          Workforce WindsorEssex, “Windsor Essex Local Immigration Partnership”, (www.workforcewindsoressex.com/welip-september-2020/).
      6
          Irek Kusmierczyk, Community Conversation: The Economic and Social Impact of Temporary Foreign Workers, November 12, 2020.
LANGUAGES
As there are many languages spoken throughout Windsor-Essex, there is currently a language
barrier for many when attempting to access local services. This barrier has been exacerbated by
the ongoing pandemic as the need for additional supports and clearly explained safety information
continues to increase. Surveys conducted by the Windsor-Essex County Health Unit identified
language barriers present in the case of accessing food, mental health supports, and explanations
of proper PPE requirements and usage.7
THE TOP 5 NON-OFFICIAL LANGUAGES
THE POPULATION HAVE A KNOWLEDGE
OF IN WINDSOR-ESSEX ARE8:
NUMBER OF PEOPLE WITH
LANGUAGE KNOWLEDGE OF LANGUAGE
ARABIC 20,540
ITALIAN 12,535
GERMAN 9,640
SPANISH 7,230
MANDARIN 5,035
As more information is being provided online, there are more opportunities for translation. However,
information that is not shared or kept up-to-date online poses a challenge for those requiring
translation software.
To better serve those who require health care services with interpretation, We Speak, a language
access initiative, is now being used throughout the region by local health care providers to schedule
or have on-demand professional interpretation services through in-person, phone, or video calls.9
This initiative has been used by primary care providers during general appointments and by local
hospitals during COVID-19 assessments. The initiative was created as a result of a partnership
between the Windsor Essex Local Immigration Partnership and the Erie-St. Clair Local Health
Integration Network.
7
Windsor-Essex County Health Unit, “COVID-19 Surveys for Community Organizations Report”, 2020. 7
8
Statistics Canada, 2016 Census of Population, Statistics Canada Catalogue no. 98-316-X2016001.
9
Workforce WindsorEssex, “We Speak”, (https://www.workforcewindsoressex.com/wespeak).MIGRATION
TOP REGIONS FOR NET MIGRATION TOP REGION FOR NET MIGRATION
INTO THE WINDSOR CMA, 2017- OUT OF WINDSOR CMA, 2017-2018:11
2018:10
NET-LOSS
REGION #
REGION NET-GAIN #
Area outside CMAs and CAs, Ontario -104
Toronto +754
London, Ontario -97
Greater Vancouver +97
Ottawa - Gatineau -61
Saskatoon +68
Kingston, Ontario -36
Winnipeg +62
Area outside CMAs and CAs, British -26
Columbia
Between 2016 and 2019, Windsor-Essex saw a net migration of 8,456 people.12 The region has
seen a steady incline in Net International Permanent Residents since 2016, in addition to its overall
population increase. Furthermore, the Net Interprovincial Migration is also seeing an incline since
2016, possibly implying that growing sectors in our region are attracting potential employees to our
workforce.
8 Statistics Canada, Taxfiler.
10
11
Statistics Canada, Taxfiler.
12
Statistics Canada, “Components of population change by census division, 2016 boundaries, annual”, Table 17-10-0140-01.13
Permanent residents and individuals moving to Windsor-Essex from other provinces are likely
looking for employment opportunities. Additionally, with the population rising in age demographics
0 to 34, there is a potential for employers in our growing industries to retain this available labour
force now and into the future.
It is evident that the unemployment rate in Windsor-Essex is on average higher compared to
provincial and federal rates.14 After slowly recovering from the 2008 financial crisis and 2009
recession, Windsor-Essex experienced another dent in its employment efforts amid the global
COVID-19 pandemic in 2020, which has continued into 2021. Socio-economic mobility has come
to a stand-still as a result of physical distancing restrictions. Instead of causing out-migration due
to unemployment, restrictions on migration has lead workers and potential workers to re-evaluate
their skills utilized in one sector that can be transitioned into another for gainful employment.
Statistics Canada, “Components of population change by census division, 2016 boundaries, annual”, Table 17-10-0140-01. 9
13
14
Statistics Canada, “Labour force characteristics by census metropolitan area, three-month moving average, seasonally adjusted and unadjusted, last
5 months”, Table 14-10-0294-01.OUR LABOUR FORCE
LABOUR FORCE CHARACTERISTICS
The following section is an overview of the labour force in Windsor-Essex. This data is useful in
determining the availability and stability of our workforce.
JANUARY 2020 LABOUR FORCE SURVEY: WINDSOR CMA 15
15 YEARS 15-24 25-54 55-64
LABOUR FORCE INDICATOR MALE FEMALE
AND OVER YEARS YEARS YEARS
Population aged 15 & over 297,700 146,800 150,900 46,500 135,200 47,300
In the labour force 178,000 91,700 86,300 26,000 114,400 26,700
Employed 164,000 83,100 80,900 21,800 106,200 25,100
Full-Time 126,400 68,700 57,700 8,600 92,300 19,800
Part-Time 37,600 14,400 23,200 13,200 14,000 5,300
Unemployed 14,000 8,600 5,400 4,100 8,200 1,600
Not in the labour force 119,600 55,100 64,600 20,600 20,700 20,600
Participation rate (%) 7.9 9.4 6.3 15.8 7.2 6.0
Employment rate (%) 59.8 62.5 57.2 55.9 84.6 56.4
Unemployment rate (%) 55.1 56.6 53.6 46.9 78.6 53.1
x: Indicates data is suppressed to meet the confidentiality requirements of the Statistics Act
NOVEMBER 2020 LABOUR FORCE SURVEY: WINDSOR CMA 16
15 YEARS 15-24 25-54 55-64
LABOUR FORCE INDICATOR MALE FEMALE
AND OVER YEARS YEARS YEARS
Population aged 15 & over 300,300 147,600 152,700 43,300 135,500 50,600
In the labour force 170,300 89,000 81,300 23,300 112,700 26,700
Employed 153,800 80,700 73,100 27,700 105,600 23,100
Full-Time 124,300 73,700 50,600 7,500 92,600 20,200
Part-Time 29,500 7,000 22,500 10,300 13,000 2,900
Unemployed 16,500 8,300 8,200 5,600 7,100 3,600
Not in the labour force 130,100 58,600 71,400 19,900 22,800 23,800
Participation rate (%) 9.7 9.3 10.1 24.0 6.3 13.5
Employment rate (%) 56.7 60.3 53.2 53.8 83.2 52.8
Unemployment rate (%) 51.2 54.7 47.9 40.9 77.9 45.7
x: Indicates data is suppressed to meet the confidentiality requirements of the Statistics Act
15
Statistics Canada, “Labour Force Survey”, Table 14-10-00950-01
16
Statistics Canada, “Labour Force Survey”, Table 14-10-00950-01.
10The charts show labour force survey data for the Windsor CMA from January 2020, with a
comparison to numbers reported in November 2020. It is obvious that COVID-19 had many negative
effects on the labour force in the Windsor CMA, but these numbers have improved slightly since
the onset of the pandemic. In January 2020, the Windsor CMA unemployment rate (7.9%) was high
compared to the Ontario rate (5.2%). As of November 2020, the unemployment rate in the Windsor
CMA (9.7%) was still higher than the provincial rate (8.3%).17
It is evident that youth and women unemployment have been affected more in the long-term by the
impacts of COVID-19. Youth unemployment in the region climbed from 15.8% in January to 24%
in November. This is after the youth unemployment rate improved over the past few months in the
region, as it reached levels of 30%+ unemployment in May, June, and July. The unemployment rate
for women over the same period increased from 6.3% to 10.1%, reaching a peak rate of 14.7%
unemployment in May. Interestingly, the unemployment rate for men has re-stabilized over the course
of the pandemic, going from 9.4% in January to 9.3% in November. While male unemployment in
the region did reach a peak of 18.1% in May, male unemployment has recovered better than other
groups to date.18
The participation rate numbers are also a bit concerning, as the number in November (56.7%) is
the lowest the region has seen since 2001. This number is also worse for both women (53.2%) and
youth (53.8%). Again, this is most likely because of the COVID-19 pandemic and the unforeseen
circumstances it has caused.19
The total labour force in Windsor-Essex has decreased from 174,400 in November 2016 to 170,300
as of November 2020. The unemployment rate has also climbed from 5.1% in November 2016
to 9.7% as of November 2020. Obviously, much of this decline is due to the recent COVID-19
pandemic. We are currently in an unprecedented time where labour markets around the globe have
all suffered as a result of the pandemic.20
CHALLENGE:
Youth and women’s unemployment have been impacted the most
during the pandemic.
OPPORTUNITY:
As youth and women have historically worked in the sectors hit
hardest by the pandemic, including retail, tourism, and food services,
there is a local need for retraining programs in more in-demand
sectors. Training programs that offer opportunities for jobseekers to
use their transferable skills will best support those unable to retrain
through formal education programs. Short-term training opportunities
will best support those looking to re-enter the workforce quickly.
17
Statistics Canada, “Labour Force Survey”, Table 14-10-0017-01.
Statistics Canada, “Labour Force Survey”, Table 14-10-00950-01.
11
18
19
Ibid.
20
Ibid.IN-DEMAND AND
HARD-TO-FILL POSITIONS
In order to collect data about in-demand and hard-to-fill
occupations in Windsor-Essex, Workforce WindsorEssex
conducted a total of 50 consultations from July – August
2020 with local employers from various sectors, and
conducted an employer survey which was open from
September – October 2020 and collected 80 total
responses. In-demand and hard-to-fill occupations are
also tracked using Emsi Analyst, an online labour market
information database.
First, we should define the difference between in-
demand and hard-to-fill occupations. Occupations can
be in-demand, hard-to-fill, or even both. A position that
is in-demand is one that employers are currently hiring
many workers for. A position that is hard-to-fill is one that
employers are having difficulty filling, whether that is due
to a lack of qualified candidates or other reasons. In the
region of Windsor-Essex, truck drivers are a highly in-
demand job. They are constantly being looked for because
of the geography of our region. However, truck drivers
are also a hard-to-fill job, as there is a massive shortage
of trained drivers in the region and there are plenty of
positions to be filled.
Employer consultations included questions about in-
demand and hard-to-fill occupations, workforce challenges
employers are facing (such as recruitment and retention
issues), thoughts on educational programs in the region,
and how the COVID-19 pandemic has affected their
business. The employer survey also asked some similar
questions about the workforce in Windsor-Essex, but
allowed employers to go into more detail than in the
consultations. The employer consultation design was aimed
to collect qualitative data and asked 10 key questions
throughout the conversation. The employer survey was
designed to collect more detailed quantitative data, with
“59%
118 optional questions for employers to answer, taking an
average of 17 minutes to complete.
Through surveying local employers, we learned that the top
six most hired occupations, and therefore most in-demand,
from March – August 2020 were as follows:
1.
2.
3.
TRUCK DRIVER
GENERAL LABOURER – MANUFACTURING
RETAIL SALESPERSON
OF
“
EMPLOYERS
INDICATED THEY HAVE
POSITIONS THAT ARE
4. MANUFACTURING MANAGER HARD TO FILL.
5. WELDER
6. MACHINE OPERATOR
12These hires tell the tale of Windsor-Essex’s industry landscape. Truck drivers are often the
top in-demand job in the region due to the proximity to the U.S. border and the amount of
truck trade that crosses the border daily. Manufacturing in Windsor-Essex is the largest sector
by employment, so it makes sense that four out of six of the top hired occupations would be
considered part of the manufacturing industry. Retail salespersons are often near the top of
in-demand job lists mainly due to the high turnover rate and constant hiring of new employees.
Another explanation for the high need for manufacturing occupations and retail salespersons may
be that the COVID-19 pandemic was more impactful in terms of layoffs for both the manufacturing
and retail sector. The survey was conducted during months that may be considered a “recovery”
period for both sectors after the designated “first wave”, aligning with the need to hire or re-hire
employees during this timeframe.
The top barrier for growth indicated by employers was “recovering from the impacts of the
COVID-19 pandemic”. This response was expected as we are still enduring the pandemic and
many businesses are still experiencing economic hardships as a result.21
Top HARD SKILLS that employers were searching for:
1. COMPUTER LITERACY
2. BLUEPRINT READING
3. MECHANICAL APTITUDE/ASSEMBLY
4. CUSTOMER SERVICE
5. WRITTEN COMMUNICATION
Top SOFT SKILLS that employers were searching for:
1. WORK ETHIC
2. COMMUNICATION
3. GOOD ATTITUDE
4. TEAMWORK
5. EMPATHY
21
Workforce WindsorEssex, “2020 Employer Survey,” Workforce WindsorEssex 2020, (www.workforcewindsoressex.com/employer-survey-results/). 13When asked about hard-to-fill occupations, 42% of employers indicated they have positions that
are hard-to-fill. The top reason for having hard-to-fill positions was candidates not having the re-
quired technical skills for the job. This aligns with the belief by many local employers that second-
ary and post-secondary schools are not doing enough to train individuals for the jobs our region
has. Many employers stressed the need for more students to be provided co-op, internships, and
other experiential learning opportunities.
Top HARD-TO FILL JOBS:
1. WELDER
2. PROJECT MANAGER – MANUFACTURING
3. MILLWRIGHT
4. CNC OPERATOR
5. HVAC TECHNICIAN
6. TOOL AND DIE MAKERS
These hard-to-fill jobs show that there is a continuing skilled trades shortage in Windsor-Essex.
Five of the six jobs on this list are apprenticeable positions, and all five could potentially lead into
the Project Manager – Manufacturing position as a potential career path. This list may also be
attributed to the manufacturing sector having difficulty recruiting workers due to the health and
safety implications of COVID-19 when working in close proximity at a manufacturing facility, which
is often the case for workers in the sector.22
The most commonly used form of recruitment for employers in the region, according to the em-
ployer survey, is the use of online job boards. This method is followed by word of mouth/personal
contacts/referrals/informal networks and then by social media rounding out the top three methods
for recruitment.23
THROUGH THE EMPLOYER SURVEY, 46% OF
EMPLOYERS INDICATED THEY FACE CHALLENGES
WITH THE RETENTION OF EMPLOYEES.
Most commonly used methods to combat retention issues:
1. RECOGNITION FOR SERVICE AND/OR OUTSTANDING WORK
2. PROVIDING TRAINING OPPORTUNITIES TO EMPLOYEES
3. REGULAR INCREASES IN SALARY/RAISES
4. OFFERING JOB FLEXIBILITY
Some other specific examples given by employers in consultations to combat employee retention
issues included providing a good work environment, good benefits packages, and making sure
employees enjoy they work they are doing.24
22
Workforce WindsorEssex, “2020 Employer Survey,” Workforce WindsorEssex 2020, (www.workforcewindsoressex.com/employer-survey-results/).
23
Ibid.
14 24
Ibid.Examining online job postings captured ONLINE JOB POSTINGS BY
internally in 2020 helps to further
MUNICIPALITY IN 2020 25
demonstrate demand for an available 68%
and skilled workforce in Windsor-Essex.
SOR
This list reflects the number of times WIND
H
occupations were posted for in 2020, SE
5% UM 2%
not the occupations that have been LASALLE C LAKESHORE
TE 5%
hired. Therefore, the results will differ
slightly from the in-demand occupations
3% RG
list developed from the employer U
TB
consultations seen on page 12 of this RS KINGSVILLE LEAMINGTON
HE ESSEX
report. AM
5% 9%
3%
In 2020, there were 24,393 unique
PELEE
job postings in the region of Windsor-
Essex.25
THE TOP 10 POSTED FOR CHALLENGE:
OCCUPATIONS WERE: 25 Some local employers believe that secondary and
post-secondary institutions are not doing enough
1. RETAIL SALESPERSONS to prepare individuals for the jobs the region has
2. TRANSPORT TRUCK DRIVERS
available.
3. HOME SUPPORT WORKERS,
HOUSEKEEPERS AND RELATED OPPORTUNITY:
OCCUPATIONS Secondary and post-secondary institutions should
4. OTHER CUSTOMER AND INFORMATION
collaborate on efforts to better align curriculum with
SERVICES REPRESENTATIVES industry needs, using labour market information
and industry contacts to inform curriculum changes.
5. MATERIAL HANDLERS
From 2020-2025, the Ontario government will begin
6. DELIVERY AND COURIER SERVICE
DRIVERS to unroll a new program that measures institutions’
graduation rates, employment rates, and the
7. NURSERY AND GREENHOUSE WORKERS institution’s engagement with the community, as
well as research funding, experiential learning
8. ADMINISTRATIVE ASSISTANTS
opportunities and graduate earnings, among
9. RETAIL AND WHOLESALE TRADE others.
MANAGERS
By 2025, up to 60% of government funding for
10. COOKS
post-secondary institutions will be dependent on
performance measures. While this change will
encourage educational institutions in the region
to adopt LMI to create more industry-based
curriculums, further collaboration with industry
is needed to ensure that program offerings are
reflective of the jobs that are available in Windsor-
Essex.26
25
Workforce WindsorEssex, Online Job Postings by Sector, 2020.
26
Ontario, “Promoting Excellence: Ontario Implements Performance Based Funding for Postsecondary Institutions”, November 26 2020, (https://news.
ontario.ca/en/release/59368/promoting-excellence-ontario-implements-performance-based-funding-for-postsecondary-institutions)
15THE LABOUR FORCE BY OCCUPATION AND INDUSTRY
There is a range of occupations within different industries in Windsor-Essex. Here is a breakdown of
the regional labour force by its top ten industries ranked by employment and as a percentage of the
total labour force in the Windsor CMA as of November 2020 and compared to November 2019:27
INDUSTRY NOVEMBER 2019 NOVEMBER 2020
Manufacturing 37,700 (22%) 39,100 (25%)
Healthcare and Social Assistance 20,900 (12%) 17,400 (11%)
Wholesale and Retail Trade 22,000 (13%) 14,900 (10%)
Construction 12,500 (7%) 14,500 (9%)
Educational Services 10,100 (6%) 11,700 (8%)
Accommodation and Food Services 11,600 (7%) 8,900 (6%)
Transportation and Warehousing 5,900 (4%) 8,500 (6%)
Professional, Scientific, and Technical Services 6,700 (4%) 8,100 (5%)
Other services (except public administration) 5,800 (3%) 7,300 (5%)
Finance, Insurance, Real Estate, and Leasing 10,900 (6%) 6,900 (4%)
PROMISING SECTORS AND OCCUPATIONS
This section of the LLMP predicts growth in certain occupations from 2019-2024. These results were
found using Emsi Analyst:
PREDICTED TOP 10 GROWTH OCCUPATIONS IN WINDSOR-ESSEX: 2019-2024 28
2019-
2019 2024 2019-2024
NOC Occupation Jobs Jobs
2024
% Change:
Change:
3012 Registered nurses and registered psychiatric nurses 4,182 4,772 590 +1.41%
3413 Nurse aides, orderlies and patient service associates 3,880 4,345 465 +11.98%
7231 Machinists and machining and tooling inspectors 2,041 2,454 413 +20.24%
9418 Other metal products machine operators 2,378 2,710 332 +13.96%
6641 Cashiers 4,547 4,847 300 +6.60%
9416 Metalworking and forging machine operators 1,867 2,120 253 +13.55%
6552 Other customer and information services representatives 2,203 2,442 239 +10.85%
2132 Mechanical engineers 1,410 1,634 224 +15.89%
9522 Motor vehicle assemblers, inspectors and testers 4,486 4,671 185 +4.12%
6622 Store shelf stockers, clerks and order fillers 2,307 2,489 182 +7.89%
27
Statistics Canada, “Labour Force Survey”, Table 14-10-0097-01.
16 28
Emsi Analyst, 2020.3NOC: The National Occupational Classification is Canada’s
national system of organizing and describing occupations. Every
occupation is identified by a four-digit code, called the NOC code.
NAICS: The North American Industry Classification System is a
classification of business establishments used in North America.
Each establishment is classified to an industry (with a 6 digit code)
according to the primary business activity taking place there.
PREDICTED TOP 10 GROWTH INDUSTRIES IN WINDSOR-ESSEX: 2016-2021 29
2016-
2016 2021 2019-2024
NAICS Industry Description Jobs Jobs
2021
% Change:
Change:
62 Health care and social assistance 23,758 26,263 2,505 +2.61%
31-33 Manufacturing 38,938 39,956 1,018 +2.61%
Administrative and support, waste management and
56 remediation services 9,796 10,565 769 +7.85%
72 Accommodation and food services 14,545 15,197 652 +4.48%
54 Professional, scientific and technical service 5,605 6,127 522 +9.31%
44-45 Retail trade 19,376 19,845 469 +2.42%
41 Wholesale trade 7,054 7,474 420 +5.95%
48-49 Transportation and warehousing 7,274 7,595 321 +4.41%
52 Finance and insurance 4,709 4,989 280 +5.95%
23 Construction 8,765 9,039 274 +3.13%
Although the region is predicted to have strong growth into 2024, there must be some skepticism applied
to the above results. These projections were made before the beginning of the COVID-19 pandemic, and
may only hold true if we are to emerge from the pandemic in the very near future and are able to recover
in a comparable or positive position.
It is unlikely that Windsor-Essex will see this type of growth in the next five years at the rate the economy
is recovering during the COVID-19 pandemic. Although regional unemployment rates have been generally
improving since the onset of the pandemic, the number of new cases have spiked throughout subsequent
waves. This will surely lead to more closures and lockdown guidelines from the government of Ontario,
leading to more potential layoffs and less hiring taking place. As stated earlier, these projections were
made pre-COVID-19. It is still expected that projected employment numbers will rise by 2024 from where
they currently stand, but the actual growth may not be as generous as these current projections.
29
Emsi Analyst, 2020.3 17EMPLOYMENT ONTARIO DATA
Workforce WindsorEssex was provided with client data for those accessing Employment Ontario
services during the reporting period of 2019-2020. The scope of Employment Ontario services
includes Employment Services (ES), Second Career, Literacy and Basic Skills, and Apprenticeships.
All programs are maintained under the Ministry of Labour, Training and Skills Development and have
been developed to connect clients with opportunities to engage in the local workforce. Analysis of
this data set provides some of the year-over-year trends and outcomes of individuals accessing
Employment Ontario services. The data reported and presented reflects closed cases for the given
fiscal year, which runs from April 1 to March 31. A closed case refers to a client’s service plan closure.
DEMOGRAPHIC INFORMATION OF CLIENTS SERVED -
EMPLOYMENT SERVICES
The number of clients served in Windsor-Essex during the reporting period was 7,862.30 This was a
decrease of 232 clients from 2018-2019, a consistent decrease continuing from 2016-2017.
31
The adjacent graph shows the breakdown of clients, year-over-year and by age range. As has been
the case since 2014, the highest served group were those aged 25-44. A total of 46% of clients
served are those in these prime working years, the same share as reported in 2018-2019. While
the total number of clients decreased, there was a slight increase in clients over the age of 65 with
16 additional persons served compared to the previous period. As the age range reported is quite
large, clients accessing services can include students who have recently completed post-secondary
education and are looking to enter the workforce, individuals looking to change their career paths,
those who have experienced a layoff, or those looking to take advantage of specific programming
offered through Employment Services Service Providers (ESSP).
18 30
Ministry of Labour, Training and Skills Development, Local Board Report, 2020.
31
Ibid.32
In 2019-2020, 54% of employment service clients in Windsor Essex identified as male and 46%
identified as female. Those identifying as other gender identities represented 0.2% of clients. Wind-
sor-Essex’s population as a whole identifies as 51% female and 49% male as per the 2016 census;
moving forward in the context of the COVID-19 pandemic, gender disparities continue to be reflected
Canada-wide. While male labour force participation in Canada has exceeded its pre-pandemic lev-
els, female labour force participation remains lower as of December 2020.
CHALLENGE:
The continued disparity between male and female labour force participation is likely
attributed to a disproportionate reliance on women for childcare. Nationally, the employment
rate of women with young children fell 7%, while men with young children fell 4%. The
employment rate of single women with young children decreased 12%, 5% more than their
male counterparts.33 While this is not a new issue locally, it has been exasperated by the
pandemic, as the sectors most-prevalent to employ women have been negatively affected,
including retail and tourism.
OPPORTUNITY:
This same research suggests that increased childcare subsidies are a globally-tested
policy choice that may enable this gap to be narrowed. When provided with public childcare
support, women have found themselves more able to seek a sufficient level of employment
while ensuring their children are supervised, fed, and engaged. Such measures have the
potential to bring Windsor-Essex closer to gender parity in the labour force. Both short-term
and long-term solutions are needed to ensure that women’s participation in the labour force
improves in a sustainable and meaningful way.
Ministry of Labour, Training and Skills Development, Local Board Report, 2020.
32
Simeon Djakov, Tea Trumbic, and Eva (Yiwen) Zhang. “COVID-19 and the Gender Gap in Advanced Economies.” VOX, CEPR Policy Portal.
33 19
December 14, 2020. (voxeu.org/article/covid-19-and-gender-gap-advanced-economies).CLIENTS SERVED BY GENDER IN
Clients Served by Gender in 34
WINDSOR-ESSEX: 2019-2020
Windsor-Essex: 2016-201746
54% 46%
Male
Female
The largest served client population in a designated group
in 2019-2020 were newcomers; there were 1,342 served in
the most recent fiscal year, an increase of 124 from 2018-
2019. The number of internationally trained professional
clients followed closely behind at 1,229. While the number
of clients identifying as Francophone and as visible
minorities decreased from the previous year, those
identifying as persons with disabilities and as Aboriginal
continued to grow.
CHALLENGE:
The consistent increase in clients who identify as
newcomers re-emphasizes the necessity of adequate
opportunities for those arriving in Canada who may
not have a professional background. Newcomers are
generally more disconnected from local industry and
professional networks, resulting in less opportunities to
earn Canadian work experience.
OPPORTUNITY:
Local employers may benefit from the knowledge of this
reliably increasing pool of new workers that are seeking
employment when they arrive in Windsor-Essex. This
could benefit newcomers through new job opportunities.
Existing partnerships like the Windsor Essex Local
Immigration Partnership (WE LIP) should continue to
have the opportunity to connect those immigrating to the
region with services they need to become acclimated
to Canada. Through this, newcomer clients can find
themselves able to enter the local labour force with a
greater chance of success.
20 34
Ministry of Labour, Training and Skills Development, Local Board Report, 2020.35
A total of 53% of clients have completed a post-secondary program, including an apprenticeship
certificate, college diploma, or university degree. This represents a 1% increase from 2018-2019.
These figures may reinforce the perceived necessity of post-secondary education as a baseline
for achieving employment in the contemporary labour climate. Clients that have a high school
diploma as their highest level of certification remained the largest individual demographic at 34%,
a figure identical to the previous year.
36
A total of 43% of new clients working with ESSPs had been out of work for less than three
months. There was a modest decrease for those who had been out of work from 0-12 months
since 2018-19. The share of clients that had been unemployed for more than 12 months saw a
more significant decline of nearly two-thirds compared to 2018-2019. However, the data reported
since 2014 suggests that 2018-2019 had an uncharacteristically high number of clients in this
demographic.
35
Ministry of Labour, Training and Skills Development, Local Board Report, 2020. 21
36
Ibid.37
As clients complete programming specific to employment services, there are five reasons their files
can be closed: Employed, In Training/Education, Unemployed, Other, and Unknown. The outcome
of Other no longer includes Unknown client outcomes, but can include clients who have chosen to
not pursue employment/training, those who are volunteering, those unable to work, those who may
have a health impairment limiting their engagement with employment/training, and other factors. In
70% of cases accessing Employment Services in Windsor-Essex in 2019-2020, clients were reported
as being Employed at their exit. This represented the largest share of outcomes by a wide margin,
followed by those In Training/Education at 11%.
38
22 37
Ministry of Labour, Training and Skills Development, Local Board Report, 2020.
38
Ibid.LITERACY AND BASIC SKILLS
The Literacy and Basic Skills (LBS) program provides free training in reading, writing, math, and
basic work skills. Clients accessing LBS will typically have reading, writing, math, and essential
skills levels below a grade nine level. Programs are created with each client to achieve specific
goals, allowing clients to engage in the workforce, continue their education, undertake training, or
achieve greater independence in their everyday lives.
There were 1,351 clients served through LBS in 2019-2020, an increase of 113 from 2018-2019.39
Clients aged 25-44 were the most-served demographic at 44%, followed by clients aged 15-24 at
32%. Of the 807 clients who exited the program in 2020, 14% of learners were in further education
and 14% of learners had obtained employment. It is important to note the aforementioned wide
spectrum of individual needs and goals amongst LBS clients and that not all clients enter the
program with the same employment or education goals.
40
39
Ministry of Labour, Training and Skills Development, Local Board Report, 2020. 23
40
Ibid.APPRENTICESHIP
The number of new apprenticeship registrations for 2019-2020 was 1,076, a slight decrease from
2018-2019.41 However, the number of active apprentices increased slightly to 2,810. The most com-
mon trades for new apprentices were Construction and Maintenance Electrician (143 registrants),
General Machinist (143 registrants), and Automotive Service Technician (112 registrants). The aver-
age age of an apprentice remained 25, leading more credence to the suggestion that apprenticeship
is often a choice made after entering the workforce or completing other educational programs. While
the number of new apprentices did not continue the increase seen in previous years, the new Group
Sponsorship Grant program may assist in reversing this trend positively. Announced by the Ministry
of Labour, Training and Skills Development in December 2020, the program will allocate $20 million
in apprentice training and sponsorship funding to small-and medium-sized employers.42 Employers
that were previously unable to sponsor an apprentice due to limited work demands, limited paid
work opportunities, or limited exposure to required training practices, will now have the opportunity
to co-sponsor an apprentice with multiple employers to ensure that the apprentice is properly trained
while providing the employers with more flexibility when hiring and training apprentices.
43
44
41
Ministry of Labour, Training and Skills Development, Local Board Report, 2020.
42
Andrew Graham, “Ontario Government Announces $20 Million To Spur Apprenticeships in Skilled Trades”, December 4 2020, (https://globalnews.ca/
24 news/7502593/ontario-20-million-apprenticeships-skilled-trades/).
43
Ministry of Labour, Training and Skills Development, Local Board Report, 2020.
44
Ibid.OUR LOCAL INDUSTRIES
BUSINESS COUNTS
Windsor-Essex has a diversity of industries, with hundreds of businesses in the largest sectors.
The tables below provide information on the industries (NAICS) with the most businesses by
business size in Windsor-Essex, with and without employees. The business size classifications
are micro (1-4 employees), small (5-99 employees), medium (100-499 employees), large (500+
employees), and without employees.
TOP 5 INDUSTRIES WITH THE MOST MICRO BUSINESSES IN WINDSOR-ESSEX: JUNE 202045
Industry Total # of Businesses
484 - Truck transportation 676
621 - Ambulatory health care services 589
541 - Professional, scientific and technical services 579
238 - Specialty trade contractors 491
531 - Real estate 331
TOP 5 INDUSTRIES WITH THE MOST SMALL BUSINESSES IN WINDSOR-ESSEX: JUNE 202045
Industry Total # of Businesses
621 - Ambulatory health care services 950
238 - Specialty trade contractors 908
541 - Professional, scientific and technical services 850
722 - Food services and drinking places 835
484 - Truck transportation 780
TOP 5 INDUSTRIES WITH THE MOST MEDIUM-SIZED BUSINESSES IN WINDSOR-ESSEX: JUNE 202045
Industry Total # of Businesses
333 - Machinery manufacturing 24
336 - Transportation equipment manufacturing 22
722 - Food services and drinking places 19
111 - Crop production 16
623 – Nursing and residential care facilities 16
TOP 5 INDUSTRIES WITH THE MOST LARGE BUSINESSES IN WINDSOR-ESSEX: JUNE 202045
Industry Total # of Businesses
336 - Transportation equipment manufacturing 8
611 - Educational services 5
622 - Hospitals 4
111 - Crop production 3
561 - Administrative and support services 3
TOP 5 INDUSTRIES IN WINDSOR-ESSEX BY NUMBER OF BUSINESSES WITHOUT EMPLOYEES: JUNE 202062
Industry Total # of Businesses
531 - Real estate 5,441
541 - Professional, scientific and technical services 1,907
484 - Truck transportation 1,387
523 - Securities, commodity contracts, and other financial investment and related activities 1,253
111 - Crop production 1,085
45
Statistics Canada, Canadian Business Counts, June 2020. 25INDUSTRY UPDATES
This section provides updates for Windsor-Essex’s largest and/or most promising industries. This data was
compiled using Statistics Canada’s Canadian Business Counts46 data to determine number of businesses and
employee size range, Emsi Analyst47 data for industry and occupation statistics and projections, internal job
posting data for the number of online job postings by sector48, and consultations with community stakeholders
for trends and highlights.
AGRICULTURE:
WINDSOR-ESSEX AGRICULTURE INDUSTRY
BY NUMBER OF BUSINESSES AND EMPLOYEE
• NAICS CODE: 11 SIZE RANGE: JUNE 2020
• JUNE 2020 TOTAL BUSINESSES: 1,683
• JUNE 2018 TOTAL BUSINESSES: 1,656
• CHANGE IN NUMBER OF BUSINESSES JUNE 2018 –
JUNE 2020: +27
• 2019 NUMBER OF EMPLOYEES: 3,466
• JOB POSTINGS IN 2020: 1700
• PROJECTED INDUSTRY EMPLOYMENT GROWTH
(2019 – 2024): -3.0%
• AVERAGE YEARLY WAGE (2019): $35,489
• PROJECTED GROWTH OCCUPATIONS:
1. 8431 – General farm workers
2. 8432 – Nursery and greenhouse workers
3. 8613 – Aquaculture and marine harvest labourers
4. 7231 – Machinists and machining and tooling
inspectors
5. 7384 – Other trades related occupations, n.e.c.
INDUSTRY TRENDS & HIGHLIGHTS:
• The majority of agricultural companies in Windsor-Essex are located in the Kingsville-Leamington area, specifically
companies located in the greenhouse sector. The majority of these companies are engaged in classic crop growing
operations, such as tomatoes, cucumbers, and bell peppers. Many companies in the industry have also made recent
ventures into cannabis growing operations, a quickly growing segment of the agricultural industry.
• As most of these greenhouse operations are located in Kingsville and Leamington, transportation is often identified as a
barrier by employers attempting to attract talent from neighbouring communities.
• The rapid growth of greenhouses in the Kingsville and Leamington area has allowed for more year-round farming
opportunities, leading to more employment opportunities and more security for employees in the fall and winter seasons.
However, the majority of labour positions are still filled by Temporary Foreign Workers, and the industry would be crippled
without access to these workers. As the agriculture sector reported $2.9 billion in lost sales due to unfilled positions in
2019,49 this rate is likely to increase due to the many disruptions in the sector throughout the ongoing pandemic.
• Companies in this industry offer a wide array of employment opportunities, some of which might not seem traditional to
the agriculture sector. For example, larger companies like Mucci Farms, Nature Fresh, Bonduelle, and Dainty Foods offer
employment for occupations in marketing, logistics, graphic design, IT and automation, and skilled trades/maintenance.
• The 3% projected decline in the next five years in this industry could be due to various reasons. It is most likely due to
farm and greenhouse employers investing in technology to increase productivity, including automated machinery and
other technology that replaces the need for lower-skilled and lower-paid labour. A lot of agricultural positions are also
located in rural settings, and growing populations have the tendency to relocate in larger cities, limiting the pool of talent
that agricultural employers have access to.
46
Statistics Canada, Canadian Business Counts, June 2020.
26 47
Emsi Analyst, 2020
48
Workforce WindsorEssex, Online Job Postings by Sector, 2020.
49
UFCW Canada and the Agriculture Workers Alliance, “The Status of Migrant Farm Workers in Canada”, 2020.You can also read