TWENTY QUESTIONS AND ANSWERS ABOUT THE OZONE LAYER - WMO
←
→
Page content transcription
If your browser does not render page correctly, please read the page content below
TWENTY QUESTIONS AND ANSWERS
         ABOUT THE OZONE LAYER

                                                                                                        Lead Author:
                                                                                                          D.W. Fahey

A draft of this component of the Assessment was reviewed and discussed by the 74 scientists who attended the Panel
Review Meeting for the 2002 ozone assessment (Les Diablerets, Switzerland, 24-28 June 2002). In addition, subsequent
contributions, reviews, or comments were provided by the following individuals: A.-L.N. Ajavon, D.L. Albritton, S.O.
Andersen, P.J. Aucamp, G. Bernhard, M.P. Chipperfield, J.S. Daniel, S.B. Diaz, E.S. Dutton, C.A. Ennis, P.J. Fraser, R.-S.
Gao, R.R. Garcia, M.A. Geller, S. Godin-Beekmann, M. Graber, J.B. Kerr, M.K.W. Ko, M.J. Kurylo, G.L. Manney, K.
Mauersberger, M. McFarland, G. Mégie, S.A. Montzka, R. Müller, E.R. Nash, P.A. Newman, S.J. Oltmans, M.
Oppenheimer, L.R. Poole, G. Poulet, M.H. Proffitt, W.J. Randel, A.R. Ravishankara, C.E. Reeves, R.J. Salawitch, M.L.
Santee, G. Seckmeyer, D.J. Siedel, K.P. Shine, C.C. Sweet, A.F. Tuck, G.J.M. Velders, R.T. Watson, and R.J. Zander.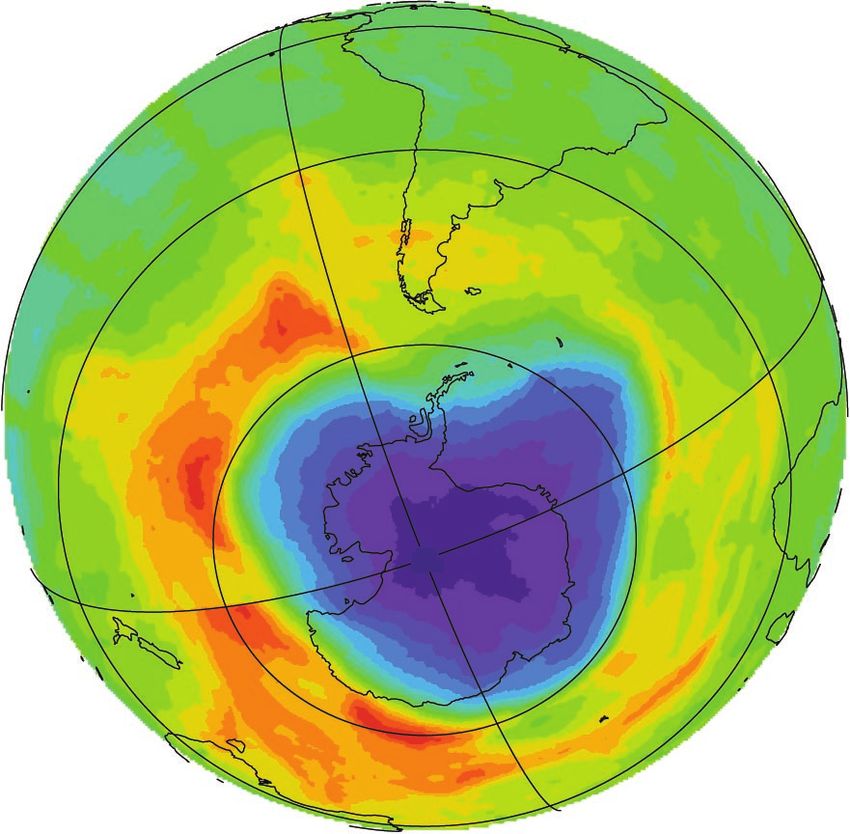
TWENTY QUESTIONS AND ANSWERS ABOUT THE OZONE LAYER

                                                                             Contents
                                                                                                                                                                     page
INTRODUCTION . . . . . . . . . . . . . . . . . . . . . . . . . . . . . . . . . . . . . . . . . . . . . . . . . . . . . . . . . . . . . . . . . . . . . . . . . . . . . Q.1

I.    OZONE IN OUR ATMOSPHERE
       Q1.  What is ozone and where is it in the atmosphere? . . . . . . . . . . . . . . . . . . . . . . . . . . . . . . . . . . . . . . . . . . Q.3
       Q2.  How is ozone formed in the atmosphere? . . . . . . . . . . . . . . . . . . . . . . . . . . . . . . . . . . . . . . . . . . . . . . . . Q.4
       Q3.  Why do we care about atmospheric ozone? . . . . . . . . . . . . . . . . . . . . . . . . . . . . . . . . . . . . . . . . . . . . . . . Q.5
       Q4.  Is total ozone uniform over the globe? . . . . . . . . . . . . . . . . . . . . . . . . . . . . . . . . . . . . . . . . . . . . . . . . . . . Q.6
       Q5.  How is ozone measured in the atmosphere? . . . . . . . . . . . . . . . . . . . . . . . . . . . . . . . . . . . . . . . . . . . . . . Q.7

II. THE OZONE DEPLETION PROCESS
     Q6.  What are the principal steps in stratospheric ozone depletion caused by
          human activities? . . . . . . . . . . . . . . . . . . . . . . . . . . . . . . . . . . . . . . . . . . . . . . . . . . . . . . . . . . . . . . . . . . . Q.8
     Q7.  What emissions from human activities lead to ozone depletion? . . . . . . . . . . . . . . . . . . . . . . . . . . . . . Q.10
     Q8.  What are the reactive halogen gases that destroy stratospheric ozone? . . . . . . . . . . . . . . . . . . . . . . . . . Q.13
     Q9.  What are the chlorine and bromine reactions that destroy stratospheric ozone? . . . . . . . . . . . . . . . . . . Q.16
     Q10. Why has an “ozone hole” appeared over Antarctica when ozone-depleting gases are present
          throughout the stratosphere? . . . . . . . . . . . . . . . . . . . . . . . . . . . . . . . . . . . . . . . . . . . . . . . . . . . . . . . . . Q.18

III. STRATOSPHERIC OZONE DEPLETION
      Q11. How severe is the depletion of the Antarctic ozone layer? . . . . . . . . . . . . . . . . . . . . . . . . . . . . . . . . . . Q.21
      Q12. Is there depletion of the Arctic ozone layer? . . . . . . . . . . . . . . . . . . . . . . . . . . . . . . . . . . . . . . . . . . . . . Q.23
      Q13. How large is the depletion of the global ozone layer? . . . . . . . . . . . . . . . . . . . . . . . . . . . . . . . . . . . . . . Q.25
      Q14. Do changes in the Sun and volcanic eruptions affect the ozone layer? . . . . . . . . . . . . . . . . . . . . . . . . . Q.26

IV. CONTROLLING OZONE-DEPLETING GASES
     Q15. Are there regulations on production of ozone-depleting gases? . . . . . . . . . . . . . . . . . . . . . . . . . . . . . . Q.28
     Q16. Has the Montreal Protocol been successful in reducing ozone-depleting gases
          in the atmosphere? . . . . . . . . . . . . . . . . . . . . . . . . . . . . . . . . . . . . . . . . . . . . . . . . . . . . . . . . . . . . . . . . . Q.30

V. IMPLICATIONS OF OZONE DEPLETION
    Q17. Does depletion of the ozone layer increase ground-level ultraviolet radiation? . . . . . . . . . . . . . . . . . . Q.32
    Q18. Is depletion of the ozone layer the principal cause of climate change? . . . . . . . . . . . . . . . . . . . . . . . . . Q.34

VI. STRATOSPHERIC OZONE IN THE FUTURE
     Q19. How will recovery of the ozone layer be detected? . . . . . . . . . . . . . . . . . . . . . . . . . . . . . . . . . . . . . . . . Q.36
     Q20. When is the ozone layer expected to recover? . . . . . . . . . . . . . . . . . . . . . . . . . . . . . . . . . . . . . . . . . . . . Q.37

ADDITIONAL TOPICS
    • Understanding Stratospheric Ozone Depletion . . . . . . . . . . . . . . . . . . . . . . . . . . . . . . . . . . . . . . . . . . . . . . . . Q.9
    • Heavier-Than-Air CFCs . . . . . . . . . . . . . . . . . . . . . . . . . . . . . . . . . . . . . . . . . . . . . . . . . . . . . . . . . . . . . . . . Q.12
    • Global Ozone Dobson Network . . . . . . . . . . . . . . . . . . . . . . . . . . . . . . . . . . . . . . . . . . . . . . . . . . . . . . . . . . Q.15
    • The Discovery of the Antarctic Ozone Hole . . . . . . . . . . . . . . . . . . . . . . . . . . . . . . . . . . . . . . . . . . . . . . . . . Q.20
    • Replacing the Loss of “Good” Ozone in the Stratosphere . . . . . . . . . . . . . . . . . . . . . . . . . . . . . . . . . . . . . . Q.24
TWENTY QUESTIONS

INTRODUCTION

      Ozone is a very small part of our atmosphere, but its                    this understanding, we know that ozone depletion is occur-
presence is nevertheless vital to human well-being.                            ring and why. And, most important, it has become clear
      Most ozone resides in the upper part of the atmos-                       that, if ozone-depleting gases were to continue to accu-
phere. This region, called the stratosphere, is more than                      mulate in the atmosphere, the result would be more ozone
10 kilometers (6 miles) above Earth’s surface. There,                          layer depletion.
about 90% of atmospheric ozone is contained in the                                  In response to the prospect of increasing ozone deple-
“ozone layer,” which shields us from harmful ultraviolet                       tion, the governments of the world crafted the 1987 United
light from the Sun.                                                            Nations Montreal Protocol as a global means to address a
      However, it was discovered in the mid-1970s that                         global issue. As a result of the broad compliance with the
some human-produced chemicals could destroy ozone and                          Protocol and its Amendments and Adjustments and,
deplete the ozone layer. The resulting increase in ultravi-                    importantly, the industrial development of more “ozone-
olet radiation at Earth’s surface can increase the incidences                  friendly” substitutes for the now-controlled chemicals,
of skin cancer and eye cataracts.                                              the total global accumulation of ozone-depleting gases
      Following the discovery of this environmental issue,                     has slowed and begun to decrease. This has reduced the
researchers focused on a better understanding of this threat                   risk of further ozone depletion. Now, with continued com-
to the ozone layer. Monitoring stations showed that the                        pliance, we expect recovery of the ozone layer in the late
abundances of the ozone-depleting chemicals were                               21st century. International Day for the Preservation of the
steadily increasing in the atmosphere. These trends were                       Ozone Layer, 16 September, is now celebrated on the day
linked to growing production and use of chemicals like                         the Montreal Protocol was agreed upon.
chlorofluorocarbons (CFCs) for refrigeration and air                                This is a story of notable achievements: discovery,
conditioning, foam blowing, and industrial cleaning.                           understanding, decisions, and actions. It is a story written
Measurements in the laboratory and the atmosphere char-                        by many: scientists, technologists, economists, legal
acterized the chemical reactions that were involved in                         experts, and policymakers. And, dialogue has been a key
ozone destruction. Computer models employing this                              ingredient.
information could then predict how much ozone deple-                                To help foster a continued interaction, this compo-
tion was occurring and how much more could occur in the                        nent of the Scientific Assessment of Ozone Depletion:
future.                                                                        2002 presents 20 questions and answers about the often-
      Observations of the ozone layer itself showed that                       complex science of ozone depletion. The questions
depletion was indeed occurring. The most severe and                            address the nature of atmospheric ozone, the chemicals
most surprising ozone loss was discovered to be over                           that cause ozone depletion, how global and polar ozone
Antarctica. It is commonly called the “ozone hole”                             depletion occur, and what could lie ahead for the ozone
because the ozone depletion is so large and localized. A                       layer. A brief answer to each question is first given in
thinning of the ozone layer also has been observed over                        italics; an expanded answer then follows. The answers
other regions of the globe, such as the Arctic and northern                    are based on the information presented in the 2002 and
middle latitudes.                                                              earlier Assessment reports. These reports and the answers
      The work of many scientists throughout the world                         provided here were all prepared and reviewed by a large
has provided a basis for building a broad and solid scien-                     international group of scientists. 1
tific understanding of the ozone depletion process. With

1
    A draft of this component of the Assessment was reviewed and discussed by the 74 scientists who attended the Panel Review Meeting for the 2002
    ozone assessment (Les Diablerets, Switzerland, 24-28 June 2002). In addition, subsequent contributions, reviews, or comments were provided by the
    following individuals: A.-L.N. Ajavon, D.L. Albritton, S.O. Andersen, P.J. Aucamp, G. Bernhard, M.P. Chipperfield, J.S. Daniel, S.B. Diaz, E.S.
    Dutton, C.A. Ennis, P.J. Fraser, R.-S. Gao, R.R. Garcia, M.A. Geller, S. Godin-Beekmann, M. Graber, J.B. Kerr, M.K.W. Ko, M.J. Kurylo, M.
    McFarland, G.L. Manney, K. Mauersberger, G. Mégie, S.A. Montzka, R. Müller, E.R. Nash, P.A. Newman, S.J. Oltmans, M. Oppenheimer, L.R.
    Poole, G. Poulet, M.H. Proffitt, W.J. Randel, A.R. Ravishankara, C.E. Reeves, R.J. Salawitch, M.L. Santee, G. Seckmeyer, D.J. Siedel, K.P. Shine,
    C.C. Sweet, A.F. Tuck, G.J.M. Velders, R.T. Watson, and R.J. Zander.

                                                                         Q.1
TWENTY QUESTIONS

I. OZONE IN OUR ATMOSPHERE

Q1: What is ozone and where is it in the atmosphere?
    Ozone is a gas that is naturally present in our atmosphere. Each ozone molecule contains three atoms of oxygen and
    is denoted chemically as O3. Ozone is found primarily in two regions of the atmosphere. About 10% of atmospheric
    ozone is in the troposphere, the region closest to Earth (from the surface to about 10-16 kilometers (6-10 miles)). The
    remaining ozone (90%) resides in the stratosphere, primarily between the top of the troposphere and about 50 kilo-
    meters (31 miles) altitude. The large amount of ozone in the stratosphere is often referred to as the “ozone layer.”

     Ozone is a gas that is naturally present in our atmos-         sphere near the peak of the ozone layer, there are up to
phere. Because an ozone molecule contains three oxygen              12,000 ozone molecules for every billion air molecules
atoms (see Figure Q1-1), it has a chemical formula of O3.           (1 billion = 1000 million). Most air molecules are either
Ozone was discovered in laboratory experiments in the               oxygen (O 2) or nitrogen (N2) molecules. In the tropo-
mid-1800s. Ozone’s presence in the atmosphere was later             sphere near Earth’s surface, ozone is even less abundant,
discovered using chemical and optical measurement                   with a typical range of 20 to 100 ozone molecules for
methods. The word ozone is derived from the Greek word              each billion air molecules. The highest surface values
ozein, meaning “to smell.” Ozone has a pungent odor that            are a result of ozone formed in air polluted by human
allows ozone to be detected even in very low amounts.               activities.
Ozone will rapidly react with many chemical compounds                    As an illustration of the low relative abundance of
and is explosive in concentrated amounts. Electrical dis-           ozone in our atmosphere, one can consider bringing all the
charges are generally used to make ozone for industrial             ozone molecules in the troposphere and stratosphere down
processes including air and water purification and                  to Earth’s surface and uniformly distributing these mole-
bleaching of textiles and food products.                            cules into a gas layer over the globe. The resulting layer
     Ozone location. Most ozone (about 90%) is found                of pure ozone would have a thickness of less than one-
in the stratosphere, a region that begins about 10-16 kilo-         half centimeter (about one-quarter inch).
meters (6-10 miles) above Earth’s surface and extends
up to about 50 kilometers (31 miles) altitude (see Figure
Q1-2). The stratosphere begins at higher altitudes (16
kilometers) in the tropics than in the polar regions (10                                           Ozone in the Atmosphere
kilometers). Most ozone resides in the stratosphere in
                                                                                            35
what is commonly known as the “ozone layer.” The
                                                                                                                                     20
remaining ozone, about 10%, is found in the troposphere,
                                                                                            30
which is the lowest region of the atmosphere between
Earth’s surface and the stratosphere.                                                                                   Stratospheric
                                                                    Altitude (kilometers)

                                                                                            25                          Ozone

                                                                                                                                           Altitude (miles)
                                                                                                  Ozone Layer                         15
     Ozone abundance. Ozone molecules have a rela-
tively low abundance in the atmosphere. In the strato-                                      20
                                                                                                                                     10
                                                                                            15
                Ozone and Oxygen
                                                                                            10       Ozone
   Oxygen              Oxygen                 Ozone                                                increases            Tropospheric
                                                                                                                        Ozone        5
   Atom (O)          Molecule (O2 )        Molecule (O3 )                                        from pollution
                                                                                            5

                                                                                            0
                                                                                                 Ozone concentration

                                                                      Figure Q1-2. Atmospheric ozone. Ozone is present
 Figure Q1-1. Ozone and oxygen. A molecule of ozone                   throughout the lower atmosphere. Most ozone resides
 (O3) contains three oxygen (O) atoms bound together.                 in the stratospheric “ozone layer” above Earth’s surface.
 Oxygen molecules (O2), which constitute 21% of Earth’s               Increases in ozone occur near the surface as a result of
 atmosphere, contain two oxygen atoms bound together.                 pollution from human activities.

                                                              Q.3
TWENTY QUESTIONS
Q2: How is ozone formed in the atmosphere?
Ozone is formed throughout the atmosphere in multistep chemical processes that require sunlight. In the strat-
osphere, the process begins with the breaking apart of an oxygen molecule (O2 ) by ultraviolet radiation from
the Sun. In the lower atmosphere (troposphere), ozone is formed in a different set of chemical reactions involv-
ing hydrocarbons and nitrogen-containing gases.
Stratospheric ozone. Stratospheric ozone is natu- tinually with a wide variety of natural and human-
rally formed in chemical reactions involving ultraviolet produced chemicals in the stratosphere. In each reaction,
sunlight and oxygen molecules, which make up 21% of an ozone molecule is lost and other chemical compounds
the atmosphere. In the first step, sunlight breaks apart one are produced. Important reactive gases that destroy ozone
oxygen molecule (O2) to produce two oxygen atoms are those containing chlorine and bromine (see Q8).
(2 O) (see Figure Q2-1). In the second step, each atom Some stratospheric ozone is transported down into
combines with an oxygen molecule to produce an ozone the troposphere and can influence ozone amounts at
molecule (O3). These reactions occur continually wher- Earth’s surface, particularly in remote unpolluted regions
ever ultraviolet sunlight is present in the stratosphere. As of the globe.
a result, the greatest ozone production occurs in the trop- Tropospheric ozone. Near Earth’s surface, ozone is
ical stratosphere. produced in chemical reactions involving naturally occur-
The production of stratospheric ozone is balanced by ring gases and gases from pollution sources. Production
its destruction in chemical reactions. Ozone reacts con- reactions primarily involve hydrocarbon and nitrogen
oxide gases and require sunlight. Fossil fuel combustion
is a primary pollution source for tropospheric ozone pro-
duction. The surface production of ozone does not signif-
Stratospheric Ozone Production icantly contribute to the abundance of stratospheric ozone.
The amount of surface ozone is too small and the trans-
port of surface air to the stratosphere is not effective
Step Ultraviolet
1 Sunlight + enough. As in the stratosphere, ozone in the troposphere
is destroyed in naturally occurring chemical reactions and
in reactions involving human-produced chemicals.
Tropospheric ozone can also be destroyed when ozone
reacts with a variety of surfaces such as those of soils and
plants.
Balance of chemical processes. Ozone abundances
Step in the stratosphere and troposphere are determined by the
2 balance between chemical processes that produce and
destroy ozone. The balance is determined by the amounts
of reacting gases and by how the rate or effectiveness of
the various reactions varies with sunlight intensity, loca-
tion in the atmosphere, temperature, and other factors. As
Overall reaction: 3 O2 sunlight 2O3 atmospheric conditions change to favor ozone-production
Figure Q2-1. Stratospheric ozone production. Ozone reactions in a certain location, ozone abundances will
is naturally produced in the stratosphere in a two-step increase. Similarly, if conditions change to favor reac-
process. In the first step, ultraviolet sunlight breaks apart tions that destroy ozone, its abundances will decrease.
an oxygen molecule to form two separate oxygen atoms. The balance of production and loss reactions combined
In the second step, these atoms then undergo a binding with atmospheric air motions determines the global dis-
collision with other oxygen molecules to form two ozone tribution of ozone on time scales of days to many months.
molecules. In the overall process, three oxygen mole- Global ozone has decreased in the last decades because
cules react to form two ozone molecules. the amounts of reactive gases containing chlorine and
bromine have increased in the stratosphere (see Q13).
Q.4TWENTY QUESTIONS
Q3: Why do we care about atmospheric ozone?
Ozone in the stratosphere absorbs some of the Sun’s biologically harmful ultraviolet radiation. Because of this
beneficial role, stratospheric ozone is considered “good ozone.” In contrast, ozone at Earth’s surface that is
formed from pollutants is considered “bad ozone” because it can be harmful to humans and plant and animal
life. Some ozone occurs naturally in the lower atmosphere where it is beneficial because ozone helps remove
pollutants from the atmosphere.
All ozone molecules are chemically identical, with lutants can reduce “bad” ozone in the air surrounding
each containing three oxygen atoms. However, ozone in humans, plants, and animals. Major sources of pollutants
the stratosphere has very different environmental conse- include large cities where fossil fuel consumption and indus-
quences for humans and other life forms than ozone in the trial activities are greatest. Many programs around the globe
troposphere near Earth’s surface. have already been successful in reducing the emission of
Good ozone. Stratospheric ozone is considered pollutants that cause near-surface ozone production.
“good” for humans and other life forms because it absorbs Natural ozone. Ozone is a natural component of the
ultraviolet (UV)-B radiation from the Sun (see Figure Q3- clean atmosphere. In the absence of human activities on
1). If not absorbed, UV-B would reach Earth’s surface in Earth’s surface, ozone would still be present near the surface
amounts that are harmful to a variety of life forms. In and throughout the troposphere and stratosphere. Ozone’s
humans, as their exposure to UV-B increases, so does their chemical role in the atmosphere includes helping to remove
risk of skin cancer (see Q17), cataracts, and a suppressed other gases, both those occurring naturally and those emitted
immune system. The UV-B exposure before adulthood by human activities. If all the ozone were to be removed from
and cumulative exposure are both important factors in the the lower atmosphere, other gases such as methane, carbon
risk. Excessive UV-B exposure also can damage terres- monoxide, and nitrogen oxides would increase in abundance.
trial plant life, single-cell organisms, and aquatic ecosys-
tems. Other UV radiation, UV-A, which is not absorbed
significantly by ozone, causes premature aging of the skin. UV Protection by the Ozone Layer
The absorption of UV-B radiation by ozone is a source
of heat in the stratosphere. This helps to maintain the strato-
sphere as a stable region of the atmosphere with temperatures
increasing with altitude. As a result, ozone plays a key role in r
controlling the temperature structure of Earth’s atmosphere. aye
eL
on
Protecting good ozone. In the mid-1970s, it was dis- Oz
covered that some human-produced gases could cause strato-
spheric ozone depletion (see Q6). Ozone depletion increases
harmful UV-B amounts at Earth’s surface. Global efforts have
been undertaken to protect the ozone layer through the regu-
lation of ozone-depleting gases (see Q15 and Q16).
Bad ozone. Ozone is also formed near Earth’s surface r th
Ea
in natural chemical reactions and in reactions caused by the
presence of human-made pollutant gases. Ozone produced
by pollutants is “bad” because more ozone comes in direct
contact with humans, plants, and animals. Increased levels Figure Q3-1. UV-B protection by the ozone layer.
of ozone are generally harmful to living systems because The ozone layer resides in the stratosphere and sur-
ozone reacts strongly to destroy or alter many other mole- rounds the entire Earth. UV-B radiation (280- to 315-
cules. Excessive ozone exposure reduces crop yields and nanometer (nm) wavelength) from the Sun is partially
forest growth. In humans, ozone exposure can reduce lung absorbed in this layer. As a result, the amount reaching
capacity; cause chest pains, throat irritation, and coughing; Earth’s surface is greatly reduced. UV-A (315- to 400-
and worsen pre-existing health conditions related to the nm wavelength) and other solar radiation are not
heart and lungs. In addition, increases in tropospheric
strongly absorbed by the ozone layer. Human expo-
ozone lead to a warming of Earth’s surface (see Q18). The
sure to UV-B increases the risk of skin cancer,
negative effects of increasing tropospheric ozone contrast
cataracts, and a suppressed immune system. UV-B
sharply with the positive effects of stratospheric ozone as
exposure can also damage terrestrial plant life, single-
an absorber of harmful UV-B radiation from the Sun.
cell organisms, and aquatic ecosystems.
Reducing bad ozone. Reducing the emission of pol-
Q.5TWENTY QUESTIONS
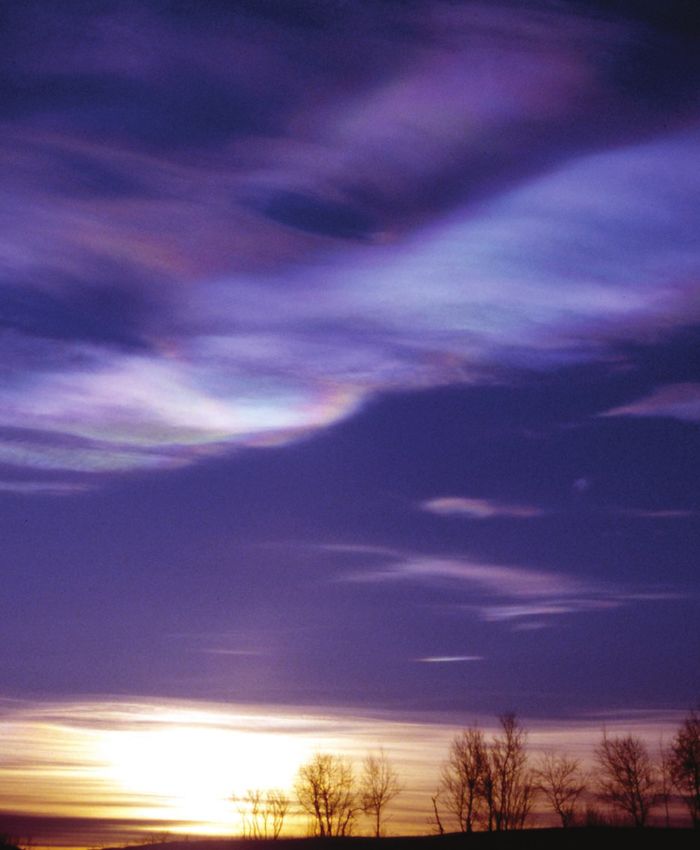
Q4: Is total ozone uniform over the globe?
No, the total amount of ozone above the surface of Earth varies with location on time scales that range from
daily to seasonal. The variations are caused by stratospheric winds and the chemical production and destruc-
tion of ozone. Total ozone is generally lowest at the equator and highest near the poles because of the season-
al wind patterns in the stratosphere.
Total ozone. Total ozone at any location on the tions helps scientists to estimate the contribution of
globe is found by measuring all the ozone in the atmos- human activities to ozone depletion.
phere directly above that location. Total ozone includes
that present in the stratospheric ozone layer and that pres-
ent throughout the troposphere (see Figure Q1-2). The Global Satellite Maps of T
Total Ozone
contribution from the troposphere is generally only about
10% of total ozone. Total ozone values are often report-
ed in Dobson units, denoted “DU.” Typical values vary
between 200 and 500 DU over the globe (see Figure Q4-
1). A total ozone value of 500 DU, for example, is equiv-
alent to a layer of pure ozone gas on Earth’s surface hav-
ing a thickness of only 0.5 centimeters (0.2 inches).
Global distribution. Total ozone varies strongly
with latitude over the globe, with the largest values occur-
ring at middle and high latitudes (see Figure Q4-1). This
22 June 1999
is a result of winds that circulate air in the stratosphere,
moving tropical air rich in ozone toward the poles in fall
and winter. Regions of low total ozone occur at polar lat-
itudes in winter and spring as a result of the chemical
destruction of ozone by chlorine and bromine gases (see
Q11 and Q12). The smallest values of total ozone (other
than in the Antarctic in spring) occur in the tropics in all
seasons, in part because the thickness of the ozone layer
is smallest in the tropics.
Natural variations. The variations of total ozone
with latitude and longitude come about for two reasons.
22 December 1999
First, natural air motions mix air between regions of the
stratosphere that have high ozone values and those that
have low ozone values. Air motions also increase the ver- 200 250 300 350 400 450 500
tical thickness of the ozone layer near the poles, which Total Ozone (Dobson units)
T
increases the value of total ozone in those regions.
Figure Q4-1. Total ozone. A total ozone value is
Tropospheric weather systems can temporarily reduce the
obtained by measuring all the ozone that resides in the
thickness of the stratospheric ozone layer in a region,
atmosphere over a given location on Earth’s surface.
lowering total ozone at the same time. Second, variations
Total ozone values shown here are reported in
occur as a result of changes in the balance of chemical
“Dobson units” as measured by a satellite instrument
production and loss processes as air moves to new loca-
from space. Total ozone varies with latitude, longitude,
tions over the globe. Reductions in solar ultraviolet radi-
and season, with the largest values at high latitudes
ation exposure, for example, will reduce the production of
and the lowest values in tropical regions. Total ozone
ozone.
at most locations varies with time on a daily to season-
Scientists have a good understanding of how chem-
al basis as ozone-rich air is moved about the globe by
istry and air motion work together to cause the observed
stratospheric winds. Low total ozone values over
large-scale features in total ozone such as those seen in
Antarctica in the 22 December image represent the
Figure Q4-1. Ozone changes are carefully monitored by
remainder of the “ozone hole” from the 1999 Antarctic
a large group of investigators using satellite, airborne, and
winter/spring season (see Q11).
ground-based instruments. The analysis of these observa-
Q.6TWENTY QUESTIONS
Q5: How is ozone measured in the atmosphere?
The amount of ozone in the atmosphere is measured by instruments on the ground and carried aloft in balloons,
aircraft, and satellites. Some measurements involve drawing air into an instrument that contains a system for
detecting ozone. Other measurements are based on ozone’s unique absorption of light in the atmosphere. In
that case, sunlight or laser light is carefully measured after passing through a portion of the atmosphere con-
taining ozone.
The abundance of ozone in the atmosphere is meas- its absorption of infrared or visible radiation or its emis-
ured by a variety of techniques (see Figure Q5-1). The sion of microwave or infrared radiation. Total ozone
techniques make use of ozone’s unique optical and chem- amounts and the altitude distribution of ozone can be
ical properties. There are two principal categories of obtained with remote measurement techniques. Lasers
measurement techniques: direct and remote. Ozone are routinely deployed at ground sites or on board aircraft
measurements by these techniques have been essential in to detect ozone over a distance of many kilometers along
monitoring changes in the ozone layer and in developing the laser light path.
our understanding of the processes that control ozone
abundances.
Direct measurements. Direct measurements of
Measuring Ozone in the Atmosphere
atmospheric ozone abundance are those that require air to
be drawn directly into an instrument. Once inside an
instrument, ozone can be measured by its absorption of
ultraviolet (UV) light or by the electrical current produced High-altitude
aircraft
in an ozone chemical reaction. The latter approach is used
in the construction of “ozonesondes,” which are light- Satellites
weight ozone-measuring modules suitable for launching
on small balloons. Small balloons ascend far enough in Large
the atmosphere to measure ozone in the stratospheric aircraft
ozone layer. Ozonesondes are launched weekly at many
locations around the world. Direct ozone-measuring
instruments using optical or chemical detection schemes
are also used routinely on board research aircraft to
measure the distribution of ozone in the troposphere and Laser
lower stratosphere. High-altitude research aircraft can beams
Balloon
reach the ozone layer at most locations over the globe and sondes
can reach farthest into the layer at high latitudes in polar Ground-based
regions. Ozone measurements are also being made on systems
some commercial aircraft.
Remote measurements. Remote measurements of
ozone abundance are obtained by detecting the presence
Figure Q5-1. Ozone measurements. Ozone is meas-
of ozone at large distances away from the instrument.
ured throughout the atmosphere with instruments on the
Most remote measurements of ozone rely on its unique
ground and on board aircraft, high-altitude balloons, and
absorption of UV radiation. Sources of UV radiation that
satellites. Some instruments measure ozone directly in
can be used are the Sun and lasers. For example, satel-
sampled air and others measure ozone remotely some
lites use the absorption of UV sunlight by the atmosphere
distance away from the instrument. Instruments use
or the absorption of sunlight scattered from the surface
optical techniques with the Sun and lasers as light
of Earth to measure ozone over the globe on a near-daily
sources or use chemical reactions that are unique to
basis. A network of ground-based detectors measures
ozone. Measurements at many locations over the globe
ozone by the amount of the Sun’s UV light that reaches
are made weekly to monitor total ozone amounts.
Earth’s surface. Other instruments measure ozone using
Q.7TWENTY QUESTIONS
II. THE OZONE DEPLETION PROCESS
Q6: What are the principal steps in stratospheric ozone depletion caused by human activities?
The initial step in the depletion of stratospheric ozone by human activities is the emission of ozone-depleting
gases containing chlorine and bromine at Earth’s surface. Most of these gases accumulate in the lower atmos-
phere because they are unreactive and do not dissolve readily in rain or snow. Eventually, the emitted gases
are transported to the stratosphere where they are converted to more reactive gases containing chlorine and
bromine. These more reactive gases then participate in reactions that destroy ozone. Finally, when air returns
to the lower atmosphere, these reactive chlorine and bromine gases are removed from Earth’s atmosphere by
rain and snow.
Emission, accumulation, and transport. The prin-
cipal steps in stratospheric ozone depletion caused by Principal Steps in the Depletion
human activities are shown in Figure Q6-1. The process of Stratospheric Ozone
begins with the emission of halogen source gases at Emissions
Earth’s surface (see Q7). Halogen source gases include Halogen source gases are emitted at Earth's
manufactured gases containing chlorine or bromine that surface by human activities and natural processes.
are released to the atmosphere by a variety of human
activities. Chlorofluorocarbons (CFCs), for example, are
important chlorine-containing gases. These source gases Accumulation
accumulate in the lower atmosphere (troposphere) and Halogen source gases accumulate in the
are eventually transported to the stratosphere. The accu- atmosphere and are distributed throughout the
lower atmosphere by winds and other air motions.
mulation occurs because most source gases are unreactive
in the lower atmosphere (troposphere). Small amounts of
these gases dissolve in ocean waters.
Transport
Some emissions of halogen gases come from natural
Halogen source gases are transported to the
sources (see Q7). These emissions also accumulate in the stratosphere by air motions.
troposphere and are transported to the stratosphere.
Conversion, reaction, and removal. Halogen
source gases do not react directly with ozone. Once in the Conversion
stratosphere, halogen source gases are chemically con- Most halogen source gases are converted in the
verted to reactive halogen gases by ultraviolet radiation stratosphere to reactive halogen gases in chemical
from the Sun (see Q8). These reactive gases chemically reactions involving ultraviolet radiation from the Sun.
destroy ozone in the stratosphere (see Q9). The average
depletion of total ozone attributed to reactive gases is esti-
mated to be small in the tropics and up to about 10% at Chemical reaction
middle latitudes (see Q13). In polar regions, the presence Reactive halogen gases cause chemical
depletion of stratospheric total ozone over the
of polar stratospheric clouds greatly increases the abun-
globe except at tropical latitudes.
dance of the most reactive halogen gases (see Q10). This
results in ozone destruction in polar regions in winter and
Polar stratospheric clouds increase ozone
depletion by reactive halogen gases,
Figure Q6-1. Principal steps in stratospheric ozone causing severe ozone loss in polar regions
depletion. The stratospheric ozone depletion process in winter and spring.
begins with the emission of halogen source gases at
Earth’s surface and ends when reactive halogen gases
Removal
are removed by rain and snow in the troposphere and
Air containing reactive halogen gases returns
deposited on Earth’s surface. In the stratosphere, the to the troposphere and these gases are removed
reactive halogen gases, namely chlorine monoxide from the air by moisture in clouds and rain.
(ClO) and bromine monoxide (BrO), destroy ozone.
Q.8TWENTY QUESTIONS
spring (see Q11 and Q12). After a few years, air in the halogen gases and other compounds. Source gas mole-
stratosphere returns to the troposphere, bringing along cules that are not converted accumulate in the troposphere
reactive halogen gases. These gases are then removed and are transported to the stratosphere. Because of
from the atmosphere by rain and other precipitation and removal by precipitation, only small portions of the reac-
deposited on Earth’s surface. This removal brings to an tive halogen gases produced in the troposphere are also
end the destruction of ozone by chlorine and bromine transported to the stratosphere. Important examples of
atoms that were first released to the atmosphere as com- gases that undergo some tropospheric removal are the
ponents of halogen source gas molecules. HCFCs, which are used as substitute gases for other halo-
Tropospheric conversion. Halogen source gases gen source gases (see Q15 and Q16), bromoform, and
with short lifetimes (see Q7) undergo significant chemi- gases containing iodine (see Q7).
cal conversion in the troposphere, producing reactive
Understanding Stratospheric Ozone Depletion
Scientists learn about ozone destruction through a combination of laboratory studies, computer
models, and stratospheric observations. In laboratory studies scientists are able to discover and evaluate
individual chemical reactions that also occur in the stratosphere. Chemical reactions between two gases
follow well-defined physical rules. Some of these reactions occur on the surfaces of particles formed in the
stratosphere. Reactions have been studied that involve a wide variety of molecules containing chlorine,
bromine, fluorine, and iodine and other atmospheric constituents such as oxygen, nitrogen, and hydrogen.
These studies show that there exist several reactions involving chlorine and bromine that can directly or
indirectly cause ozone destruction in the atmosphere.
With computer models, scientists can examine the overall effect of a large group of known reactions
under the chemical and physical conditions found in the stratosphere. These models include winds, air
temperatures, and the daily and seasonal changes in sunlight. With such analyses, scientists have shown
that chlorine and bromine can react in catalytic cycles in which one chlorine or bromine atom can destroy
many ozone molecules. Scientists use model results to compare with past observations as a test of our
understanding of the atmosphere and to evaluate the importance of new reactions found in the laboratory.
Computer models also enable scientists to explore the future by changing atmospheric conditions and other
model parameters.
Scientists make stratospheric observations to find out what gases are present in the stratosphere and
at what concentrations. Observations have shown that halogen source gases and reactive halogen gases
are present in the stratosphere at expected amounts. Ozone and chlorine monoxide (ClO), for example,
have been observed extensively with a variety of instruments. Instruments on the ground and on board
satellites, balloons, and aircraft detect ozone and ClO at a distance using optical and microwave signals.
High-altitude aircraft and balloon instruments detect both gases directly in the stratosphere. For example,
these observations show that ClO is present at elevated amounts in the Antarctic and Arctic stratospheres
in the winter/spring season, when the most severe ozone depletion occurs.
Q.9TWENTY QUESTIONS
Q7: What emissions from human activities lead to ozone depletion?
Certain industrial processes and consumer products result in the atmospheric emission of “halogen source
gases.” These gases contain chlorine and bromine atoms, which are known to be harmful to the ozone layer.
For example, the chlorofluorocarbons (CFCs) and hydrochlorofluorocarbons (HCFCs), once used in almost all
refrigeration and air conditioning systems, eventually reach the stratosphere where they are broken apart to
release ozone-depleting chlorine atoms. Other examples of human-produced ozone-depleting gases are the
“halons,” which are used in fire extinguishers and which contain ozone-depleting bromine atoms. The produc-
tion and consumption of all principal halogen source gases by human activities are regulated worldwide under
the Montreal Protocol.
Human-produced chlorine and bromine gases. carbon, chlorine, and fluorine are called “chlorofluorocar-
Human activities cause the emission of halogen source bons,” usually abbreviated as CFCs. CFCs, along with car-
gases that contain chlorine and bromine atoms. These bon tetrachloride (CCl4) and methyl chloroform (CH3CCl3),
emissions into the atmosphere ultimately lead to strato- are the most important chlorine-containing gases that are
spheric ozone depletion. The source gases that contain only emitted by human activities and destroy stratospheric ozone
Primary Sources of Chlorine and Bromine
for the Stratosphere in 1999
Chlorine source gases
Other gases
Methyl chloroform (CH3CCl3)
3400 1% HCFCs (e.g., HCFC-22 = CHClF2)
Total chlorine amount (parts per trillion)
4% CFC-113 (CCl2FCClF2)
5%
3000 7% Carbon tetrachloride (CCl4)
Human-made sources
12%
CFC-11 (CCl3F)
2000
23%
Figure Q7-1. Stratospheric source gases. A variety
CFC-12 (CCl2F2) of gases transport chlorine and bromine into the strato-
1000 sphere. These gases, called halogen source gases, are
emitted from natural sources and human activities. For
32%
Methyl chloride (CH3Cl) chlorine, human activities account for most that reaches
Natural
sources the stratosphere. The CFCs are the most abundant of
16%
0 the chlorine-containing gases released in human activi-
Bromine source gases
ties. Methyl chloride is the most important natural
Other halons source of chlorine. For bromine that reaches the strato-
4%
Total bromine amount (parts per trillion)
20
Human-made sources
Halon-1301 (CBrF3) sphere, halons and methyl bromide are the largest
sources. Both gases are released in human activities.
14%
Halon-1211 (CBrCIF2) Methyl bromide has an additional natural source.
15 Natural sources are a larger fraction of the total for
20% bromine than for chlorine. HCFCs, which are substitute
5-20% gases for CFCs and also are regulated under the
10 Methyl bromide (CH3Br) Montreal Protocol, are a small but growing fraction of
chlorine-containing gases. The abundance scale shows
Natural sources
that the amount of chlorine in the stratosphere is greater
5
than that of bromine by about 170 times. (The unit “parts
27-42% Very-short lived gases per trillion” is a measure of the relative abundance of
(e.g., bromoform = CHBr3) a gas: 1 part per trillion indicates the presence of one
15% molecule of a gas per trillion other molecules.)
0
Q.10TWENTY QUESTIONS
Table Q7-1. Atmospheric lifetimes, emissions, Natural sources of chlorine and bromine. There
and Ozone Depletion Potentials of halogen are two halogen source gases present in the stratosphere
source gases. a that have large natural sources. These are methyl chloride
(CH3Cl) and methyl bromide (CH3Br), both of which are
Halogen Lifetime Global Ozone emitted by oceanic and terrestrial ecosystems. Natural
Source (years) Emissions Depletion sources of these two gases contribute about 16% of the
Gas in 2000 Potential chlorine currently in the stratosphere, and about 27-42%
(gigagrams (ODP) of the bromine (see Figure Q7-1). Very short-lived gases
per year) b containing bromine, such as bromoform (CHBr3), are also
released to the atmosphere by the oceans. The estimated
Chlorine contribution of these gases to stratospheric bromine
CFC-12 100 130-160 1 (about 15%) is uncertain at this time. Changes in the nat-
CFC-113 85 10-25 1 ural sources of chlorine and bromine since the middle of
CFC-11 45 70-110 1 the 20th century are not the cause of observed ozone
Carbon 26 70-90 0.73 depletion.
tetrachloride Lifetimes and emissions. After emission, halogen
HCFCs 1-26 340-370 0.02-0.12 source gases are either removed from the atmosphere or
Methyl chloroform 5 ~20 0.12 undergo chemical conversion. The time to remove or con-
Methyl chloride 1.3 3000-4000 0.02 vert about 60% of a gas is often called its atmospheric
Bromine “lifetime”. Lifetimes vary from less than 1 year to 100
Halon-1301 65 ~3 12 years for the principal chlorine- and bromine-containing
Halon-1211 16 ~10 6 gases (see Table Q7-1). Gases with the shortest lifetimes
Methyl bromide 0.7 160-200 0.38 (e.g., the HCFCs, methyl bromide, methyl chloride, and
c c
Very short-lived Less the very short-lived gases) are significantly destroyed in
gases than 1 the troposphere, and therefore only a fraction of the emit-
a Includes both human activities and natural sources. ted gas contributes to ozone depletion in the stratosphere.
b 1 gigagram = 109 grams = 1000 metric tons. The amount of a halogen source gas present in the
c No reliable estimate available. atmosphere depends on the lifetime of the gas and the
amount emitted to the atmosphere. Emissions vary great-
ly for the principal source gases, as indicated in Table
(see Figure Q7-1). Chlorine-containing gases have been Q7-1. Emissions of most gases regulated by the
used in many applications including refrigeration, air con- Montreal Protocol have decreased since 1990, and emis-
ditioning, foam blowing, aerosol propellants, and cleaning sions from all regulated gases are expected to decrease in
of metals and electronic components. These activities have the coming decades (see Q16).
typically caused the emission of halogen-containing gases Ozone Depletion Potential. The halogen source
to the atmosphere. gases in Figure Q7-1 are also known as “ozone-depleting
Another category of halogen source gases contains substances” because they are converted in the strato-
bromine. The most important of these are the “halons” sphere to reactive gases containing chlorine and bromine
and methyl bromide (CH3Br). Halons are halogenated (see Q8). Some of these reactive gases participate in
hydrocarbon gases originally developed to extinguish reactions that destroy ozone (see Q9). Ozone-depleting
fires. Halons are widely used to protect large computers, substances are compared in their effectiveness to destroy
military hardware, and commercial aircraft engines. stratospheric ozone using the “Ozone Depletion
Because of these uses, halons are often directly released Potential” (ODP), as listed in Table Q7-1. A gas with a
into the atmosphere. Halon-1211 and Halon-1301 are the larger ODP has a greater potential to destroy ozone over
most abundant halons emitted by human activities (see its lifetime in the atmosphere. The ODP is calculated on
Figure Q7-1). Methyl bromide, used primarily as an a “per mass” basis for each gas relative to CFC-11, which
agricultural fumigant, is also a significant source of has an ODP defined to be 1. Halon-1211 and Halon-1301
bromine to the atmosphere. have ODPs significantly larger than CFC-11 and most
Human emissions of chlorine- and bromine-containing other emitted gases. This results because bromine is
gases have increased substantially since the middle of the much more effective overall (about 45 times) on a per-
20th century (see Q16). The result has been global ozone atom basis than chlorine in chemical reactions that
depletion with the greatest losses occurring in polar regions destroy ozone in the stratosphere. The gases with small
(see Q11 to Q13).
Q.11TWENTY QUESTIONS
ODP values generally have short atmospheric lifetimes. gases are largely removed in the troposphere by natural
The production and consumption of all principal halogen processes before the gases can reach the stratosphere.
source gases by humans are regulated under the provi- Other gases. Other gases that influence strato-
sions of the Montreal Protocol (see Q15). spheric ozone abundances also have increased in the
Fluorine and iodine. Fluorine and iodine are also stratosphere as a result of human activities. Important
halogen atoms. Most of the source gases in Figure Q7-1 examples are methane (CH4) and nitrous oxide (N2O),
also contain fluorine atoms in addition to chlorine or which react to form water vapor and reactive hydrogen
bromine. After the source gases undergo conversion in and nitrogen oxides, respectively, in the stratosphere.
the stratosphere (see Q6), the fluorine content of these These reactive products also participate in the production
gases is left in chemical forms that do not destroy ozone. and loss balance of stratospheric ozone (see Q2). The
Iodine is a component of several gases that are naturally overall affect of these other gases on ozone is much
emitted from the oceans. Although iodine will participate smaller than that caused by increases in chlorine- and
in ozone destruction reactions, these iodine-containing bromine-containing gases from human activities.
Heavier-Than-Air CFCs
CFCs and other halogen source gases reach the stratosphere despite the fact they are “heavier than
air.” All the principal source gases are emitted and accumulate in the lower atmosphere (troposphere). Air
containing the emitted halogen gases is in continual motion as a result of winds and convection. Air motions
ensure that the source gases are horizontally and vertically well mixed throughout the troposphere in a
matter of months. It is this well-mixed air that enters the lower stratosphere from upward air motions in
tropical regions, bringing with it source gas molecules emitted from a wide variety of locations on Earth’s
surface.
Atmospheric measurements confirm that halogen source gases with long atmospheric lifetimes are
well mixed in the troposphere and are present in the stratosphere (see Figure Q8-2). The amounts found in
these regions are consistent with the emissions estimates reported by industry and government.
Measurements also show that gases that are “lighter than air,” such as hydrogen (H2) and methane (CH4),
are also well mixed in the troposphere, as expected. Only at altitudes well above the troposphere and
stratosphere (above 85 kilometers (53 miles)), where much less air is present, do heavy gases begin to
separate from lighter gases as a result of gravity.
Q.12TWENTY QUESTIONS
Q8: What are the reactive halogen gases that destroy stratospheric ozone?
Emissions from human activities and natural processes are large sources of chlorine- and bromine-containing
gases for the stratosphere. When exposed to ultraviolet radiation from the Sun, these halogen source gases are
converted to more reactive gases also containing chlorine and bromine. Important examples of the reactive
gases that destroy stratospheric ozone are chlorine monoxide (ClO) and bromine monoxide (BrO). These and
other reactive gases participate in “catalytic” reaction cycles that efficiently destroy ozone. Volcanoes can emit
some chlorine-containing gases, but these gases are ones that readily dissolve in rainwater and ice and are
usually “washed out” of the atmosphere before they can reach the stratosphere.
Reactive gases containing the halogens chlorine and gases because they do not react directly with ozone but
bromine lead to the chemical destruction of stratospheric can be converted to the most reactive forms that do chem-
ozone. Halogen-containing gases present in the strato- ically destroy ozone. The most reactive forms are chlo-
sphere can be divided into two groups: halogen source rine monoxide (ClO) and bromine monoxide (BrO), and
gases and reactive halogen gases. The source gases are chlorine and bromine atoms (Cl and Br). A large fraction
emitted at Earth’s surface by natural processes and by of available stratospheric bromine is generally in the form
human activities (see Q7). Once they reach the strato- of BrO whereas usually only a small fraction of strato-
sphere, the halogen source gases chemically convert to spheric chlorine is in the form of ClO. In polar regions,
form the reactive halogen gases. the reservoirs ClONO2 and HCl undergo a further conver-
Reactive halogen gases. The chemical conversion sion on polar stratospheric clouds (see Q10) to form ClO.
of halogen source gases, which involves ultraviolet sun- In that case, ClO becomes a large fraction of available
light and other chemical reactions, produces a number of reactive chlorine.
reactive halogen gases. These reactive gases contain all Reactive chlorine observations. Reactive chlorine
of the chlorine and bromine atoms originally present in gases have been observed extensively in the stratosphere
the source gases. with both direct and remote measurement techniques. The
The most important reactive chlorine- and bromine- measurements from space at middle latitudes displayed in
containing gases that form in the stratosphere are shown Figure Q8-2 are representative of how chlorine-containing
in Figure Q8-1. Away from polar regions, the most abun- gases change between the surface and the upper strato-
dant are hydrogen chloride (HCl) and chlorine nitrate sphere. Available chlorine (see red line in Figure Q8-2) is
(ClONO2). These two gases are considered reservoir the sum of chlorine contained in halogen source gases and
Stratospheric Halogen Gases
ource gas
o g en s ct iv e h
a lo g e n g a
H al es
Re a
ses
CFC-12
Hydrogen bromide (HBr)
Very short-lived Methyl Chemical
bromine gases chloroform Bromine nitrate (BrONO2 )
Ultraviolet (UV) Hydrogen chloride (HCl) largest
Methyl Halon-1301 reservoirs
Carbon chloride sunlight & Chlorine nitrate (ClONO2 )
tetrachloride other chemical
HCFCs Chlorine monoxide (ClO)
CFC-113 reactions
most Bromine monoxide (BrO)
CFC-11 Halon-1211 Conversion reactive Bromine atoms (Br)
Chlorine atoms (Cl)
Methyl bromide
Oz
on e es
- d e p le a nc
ti n g s u b s t
Figure Q8-1. Conversion of halogen source gases. Halogen source gases (also known as ozone-depleting sub-
stances) are chemically converted to reactive halogen gases primarily in the stratosphere. The conversion requires ultra-
violet sunlight and a few other chemical reactions. The short-lived gases undergo some conversion in the troposphere.
The reactive halogen gases contain all the chlorine and bromine originally present in the source gases. Some reactive
gases serve as reservoirs of chlorine and bromine whereas others participate in ozone destruction cycles.
Q.13TWENTY QUESTIONS
the reactive gases HCl, ClONO2, ClO, and other minor most reactive gas in ozone depletion, is a small fraction of
gases. Available chlorine is constant within a few percent available chlorine. This small value limits the amount of
from the surface to 47 kilometers (31 miles) altitude. In ozone destruction that occurs outside of polar regions.
the troposphere, available chlorine is contained almost Reactive chlorine in polar regions. Reactive chlo-
entirely in the source gases described in Figure Q7-1. At rine gases in polar regions in summer look similar to the
higher altitudes, the source gases become a smaller frac- altitude profiles shown in Figure Q8-2. In winter, how-
tion of available chlorine as they are converted to reactive ever, the presence of polar stratospheric clouds (PSCs)
chlorine gases. At the highest altitudes, available chlorine causes further chemical changes (see Q10). PSCs convert
is all in the form of reactive chlorine gases. HCl and ClONO2 to ClO when temperatures are near
In the altitude range of the ozone layer, as shown in minimum values in the winter Arctic and Antarctic strat-
Figure Q8-2, the reactive chlorine gases HCl and osphere. In that case, ClO becomes the principal reactive
ClONO2 account for most of available chlorine. ClO, the chlorine species in sunlit regions and ozone loss becomes
very rapid. An example of the late-winter ClO and ozone
distributions is shown in Figure Q8-3 for the Antarctic
stratosphere. These space-based measurements show that
Measurements of Chlorine Gases from Space ClO abundances are high in the lower stratosphere over a
November 1994 (35°-49°N) region that exceeds the size of the Antarctic continent
(greater than 13 million square kilometers or 5 million
Chlorine Chlorine Other gases square miles). The peak abundance of ClO exceeds 1500
nitrate (ClONO2) monoxide (ClO) parts per trillion, which is much larger than typical mid-
latitude values shown in Figure Q8-2 and represents a
40 25 large fraction of reactive chlorine in that altitude region.
Because high ClO amounts cause rapid ozone loss (see
Hydrogen
Q9), ozone depletion is found in regions of elevated ClO
Altitude (kilometers)
chloride (HCl)
Stratosphere
20
Altitude (miles)
30 (see Figure Q8-3).
Ozone Layer
Reactive bromine observations. Fewer measure-
15 ments are available for reactive bromine gases than for
20 reactive chlorine, in part because of the low abundance of
10 bromine in the stratosphere. The most widely observed
Chlorine source gases
(CFCs, HCFCs, carbon bromine gas is bromine monoxide (BrO). The measured
10 tetrachloride, etc.) abundances are consistent with values expected from the
Troposphere
Available 5
chlorine conversion of the bromine-containing source gases such
0 0
as the halons and methyl bromide.
0 1000 2000 3000 4000 Other sources. Some reactive halogen gases are
Chlorine abundance (parts per trillion) also produced at Earth’s surface by natural processes and
Figure Q8-2. Reactive chlorine gas observations. by human activities. However, because reactive halogen
Reactive chlorine gases and chlorine source gases can gases are soluble in water, almost all become trapped in
be measured from space. These abundance measure- the lower atmosphere by dissolving in rainwater and ice,
ments made over midlatitudes, for example, show that and ultimately are returned to Earth’s surface before they
chlorine-containing source gases are present in the tro- can reach the stratosphere. For example, reactive chlo-
posphere and that reactive chlorine gases are present rine is present in the atmosphere as sea salt (sodium chlo-
in the stratosphere. In the stratosphere, reactive chlo- ride) produced by evaporation of ocean spray. Because
rine gases increase with altitude and chlorine source sea salt dissolves in water, this chlorine is removed and
gases decrease with altitude. This results because the does not reach the stratosphere in appreciable quantities.
source gases are converted to reactive gases in chem- Another ground-level source is emission of chlorine gases
ical reactions involving ultraviolet sunlight. The principal from swimming pools, household bleach, and other uses.
reactive gases formed are HCl, ClONO2, and ClO. The When released to the atmosphere, this chlorine is rapidly
sum of reactive gases and source gases gives available converted to forms that are soluble in water and removed.
chlorine, which is nearly constant with altitude up to 47 The Space Shuttle and other rocket motors release reac-
km. In the ozone layer, HCl and ClONO2 are the most tive chlorine gases directly in the stratosphere. In that
abundant reactive chlorine gases. (The unit “parts per case the quantities are very small in comparison with
trillion” is defined in the caption of Figure Q7-1.) other stratospheric sources.
Q.14TWENTY QUESTIONS
Satellite Observations in the Lower Stratosphere Figure Q8-3. Antarctic chlorine monoxide and
30 August 1996 ozone. Satellite instruments monitor ozone and reactive
chlorine gases in the global stratosphere. Results are
shown here for Antarctic winter for a narrow altitude
region within the ozone layer. In winter, chlorine monox-
Depleted ozone
ide (ClO) reaches high values (1500 parts per trillion) in
the ozone layer, much higher than observed anywhere
else in the stratosphere because ClO is produced by
reactions on polar stratospheric clouds. These high ClO
values in the lower stratosphere last for 1 to 2 months,
cover an area that at times exceeds that of the Antarctic
continent, and efficiently destroy ozone in sunlit regions.
Elevated chlorine Ozone values measured simultaneously within the
monoxide (ClO) ozone layer show very depleted values.
Volcanoes. Volcanic plumes generally contain large result, most of the HCl in the plume does not enter the
quantities of chlorine in the form of hydrogen chloride stratosphere. After large recent eruptions, the increase in
(HCl). Because the plumes also contain a considerable HCl in the stratosphere has been small compared with the
amount of water vapor, the HCl is efficiently scavenged by total amount of chlorine in the stratosphere from other
rainwater and ice and removed from the atmosphere. As a sources.
Global Ozone Dobson Network
The first instrument for routine monitoring of total ozone was developed by Gordon M. B. Dobson in
the 1920s. The instrument measures the intensity of sunlight at two ultraviolet wavelengths: one that is
strongly absorbed by ozone and one that is weakly absorbed. The difference in light intensity at the two
wavelengths is used to provide a measurement of total ozone above the instrument location.
A global network of ground-based, total ozone observing stations was established in 1957 as part of
the International Geophysical Year. Today, there are about 100 sites distributed throughout the world (from
South Pole, Antarctica (90°S) to Ellesmere Island, Canada (83°N)), many of which routinely measure total
ozone with Dobson instruments. The accuracy of these observations is maintained by regular calibrations
and intercomparisons. Data from the network have been essential for understanding the effects of chloro-
fluorocarbons (CFCs) and other ozone-depleting gases on the global ozone layer, starting before the launch
of space-based ozone-measuring instruments and continuing to the present day. Because of their stability
and accuracy, the Dobson instruments are now routinely used to help calibrate space-based observations
of total ozone.
Pioneering scientists have traditionally been honored by having units of measure named after them.
Accordingly, the unit of measure for total ozone is called the “Dobson unit” (see Q4).
Q.15You can also read