Low-NO atmospheric oxidation pathways in a polluted megacity - Recent
←
→
Page content transcription
If your browser does not render page correctly, please read the page content below
Atmos. Chem. Phys., 21, 1613–1625, 2021
https://doi.org/10.5194/acp-21-1613-2021
© Author(s) 2021. This work is distributed under
the Creative Commons Attribution 4.0 License.

Low-NO atmospheric oxidation pathways in a polluted megacity
Mike J. Newland1 , Daniel J. Bryant1 , Rachel E. Dunmore1 , Thomas J. Bannan2 , W. Joe F. Acton3 , Ben Langford4 ,
James R. Hopkins1,5 , Freya A. Squires1 , William Dixon1 , William S. Drysdale1 , Peter D. Ivatt1 , Mathew J. Evans1 ,
Peter M. Edwards1 , Lisa K. Whalley6,7 , Dwayne E. Heard6,7 , Eloise J. Slater6 , Robert Woodward-Massey8 ,
Chunxiang Ye8 , Archit Mehra2 , Stephen D. Worrall2,a , Asan Bacak2 , Hugh Coe2 , Carl J. Percival2,b ,
C. Nicholas Hewitt3 , James D. Lee1,5 , Tianqu Cui9 , Jason D. Surratt9 , Xinming Wang10 , Alastair C. Lewis1,5 ,
Andrew R. Rickard1,5 , and Jacqueline F. Hamilton1
1 Wolfson  Atmospheric Chemistry Laboratories, Department of Chemistry, University of York, York, YO10 5DD, UK
2 School of Earth and Environmental Sciences, The University of Manchester, Manchester, M13 9PL, UK
3 Lancaster Environment Centre, Lancaster University, Lancaster, LA1 4YQ, UK
4 Centre for Ecology and Hydrology, Edinburgh, EH26 0QB, UK
5 National Centre for Atmospheric Science (NCAS), University of York, York, YO10 5DD, UK
6 School of Chemistry, University of Leeds, Leeds, LS2 9JT, UK
7 National Centre for Atmospheric Science, School of Chemistry, University of Leeds, Leeds, LS2 9JT, UK
8 Beijing Innovation Center for Engineering Science and Advanced Technology, State Key Joint Laboratory for Environmental

Simulation and Pollution Control, Center for Environment and Health, College of Environmental Sciences and Engineering,
Peking University, Beijing, 100871, China
9 Department of Environmental Sciences and Engineering, Gillings School of Global Public Health,

University of North Carolina, Chapel Hill, NC 27599, USA
10 Guangzhou Institute of Geochemistry, Chinese Academy of Sciences, Guangzhou, GD 510640, China
a now at: Chemical Engineering and Applied Chemistry, School of Engineering and Applied Science,

Aston University, Birmingham, B4 7ET, UK
b now at: Jet Propulsion Laboratory, California Institute of Technology, 4800 Oak Grove Drive, Pasadena, CA 91109, USA

Correspondence: Mike J. Newland (mike.newland@york.ac.uk) and Jacqueline F. Hamilton (jacqui.hamilton@york.ac.uk)

Received: 14 January 2020 – Discussion started: 13 February 2020
Revised: 26 October 2020 – Accepted: 1 December 2020 – Published: 8 February 2021

Abstract. The impact of emissions of volatile organic com-     suggest that during the morning high-NO chemistry predom-
pounds (VOCs) to the atmosphere on the production of           inates (95 %) but in the afternoon low-NO chemistry plays a
secondary pollutants, such as ozone and secondary organic      greater role (30 %). Current emissions inventories are applied
aerosol (SOA), is mediated by the concentration of nitric      in the GEOS-Chem model which shows that such models,
oxide (NO). Polluted urban atmospheres are typically con-      when run at the regional scale, fail to accurately predict such
sidered to be “high-NO” environments, while remote re-         an extreme diurnal cycle in the NO concentration. With in-
gions such as rainforests, with minimal anthropogenic influ-   creasing global emphasis on reducing air pollution, it is cru-
ences, are considered to be “low NO”. However, our obser-      cial for the modelling tools used to develop urban air quality
vations from central Beijing show that this simplistic sep-    policy to be able to accurately represent such extreme diur-
aration of regimes is flawed. Despite being in one of the      nal variations in NO to accurately predict the formation of
largest megacities in the world, we observe formation of       pollutants such as SOA and ozone.
gas- and aerosol-phase oxidation products usually associated
with low-NO “rainforest-like” atmospheric oxidation path-
ways during the afternoon, caused by extreme suppression
of NO concentrations at this time. Box model calculations

Published by Copernicus Publications on behalf of the European Geosciences Union.
1614                                M. J. Newland et al.: Low-NO atmospheric oxidation pathways in a polluted megacity

1   Introduction                                                   been found only in remote environments removed from an-
                                                                   thropogenic influence.
The atmosphere in polluted urban areas has a markedly dif-            Surface ozone in Beijing has increased through the 1990s
ferent chemical composition to that in remote regions (e.g.        and 2000s (Tang et al., 2009). The city regularly experiences
rainforests). This can lead to changes in the chemical oxida-      daily peaks in the summertime of over 100 ppb (e.g. Wang et
tion pathways for volatile organic compounds (VOCs), giv-          al., 2015). Such high-ozone episodes are a function of both
ing rise to the formation of different secondary pollutants.       chemistry and meteorology, with air masses coming from
Oxidation by hydroxyl radicals (OH) is the dominant day-           the mountainous regions to the northwest tending to bring
time sink for VOCs, leading to the formation of highly reac-       in clean air low in ozone, while air masses coming from
tive peroxy radicals (RO2 ). In atmospheres with high concen-      the densely populated regions to the south and west bring
trations of nitric oxide (NO), emitted by combustion sources       processed polluted air high in ozone (Wang et al., 2017). A
such as vehicles, cooking, and energy generation, RO2 rad-         number of modelling studies have concluded that the sources
icals react predominantly with NO (Orlando and Tyndall,            of the ozone during high-ozone episodes are a combination
2012). This tends to break the initial VOC down to smaller,        of both local production and regional transport (Wang et
more oxidised VOCs and can also produce organic nitrates           al., 2017; Liu et al., 2019).
(RONO2 ). This pathway also produces NO2 , the photolysis             Biogenic sources dominate global emissions of VOCs to
of which leads to ozone production. In contrast, in low-NO         the atmosphere, with the highly reactive VOC isoprene (2-
atmospheres RO2 react with other RO2 , including hydroper-         methyl-1,3-butadiene) contributing ∼ 70 % by mass (Sinde-
oxyl radicals (HO2 ), or can isomerise or auto-oxidise to form     larova et al., 2014). The gas- and aerosol-phase products
different multi-functionalised oxygenated RO2 (Crounse et          of isoprene oxidation have been extensively characterised
al., 2013). These low-NO pathways tend to maintain the orig-       in the laboratory (Wennberg et al., 2018, and references
inal carbon skeleton. The large highly oxidised molecules          therein). For isoprene, the low-NO oxidation pathway leads
formed can efficiently partition to the aerosol phase to yield     to low-volatility products, such as isoprene hydroperoxides
secondary organic aerosol (SOA) (Bianchi et al., 2019),            (ISOPOOH), that can go on to form significant quantities of
which often comprises a large fraction of submicron atmo-          SOA via formation of isoprene epoxides (IEPOX) (Fig. 1)
spheric particulate matter (PM) in many regions (Jimenez et        (Paulot et al., 2009; Surratt et al., 2010; Lin et al., 2012). The
al., 2009).                                                        high-NO pathway can also form SOA via the formation of
   In the past 20 years, emissions, and hence atmospheric          methacrolein (MACR), which can react further to form SOA
concentrations, of nitrogen oxides (NOx ) have decreased in        constituents such as 2-methylglyceric acid (2-MGA) and cor-
urban areas throughout the majority of the developed world.        responding oligomers (Kroll et al., 2006; Surratt et al., 2006,
In urban areas this has been due to the following: improve-        2010; Nguyen et al., 2015a) (Fig. 1). Other significant con-
ments in vehicle emissions technologies; changes to residen-       tributors to isoprene SOA formed via the high-NO pathway
tial heating; and, in many major European cities, restrictions     include nitrates (e.g. ISOPONO2 ) and dinitrates (Schwantes
on the types of vehicles that are allowed in certain areas at      et al., 2019). In this work, a suite of isoprene oxidation prod-
certain times of the day. In China, through the introduction       ucts, in both the gas and particle phases, are used as tracers of
of the Air Pollution Prevention and Control Action Plan in         the changing atmospheric chemical environment throughout
2013 (Zhang et al., 2019) there has been a concerted effort        the daytime in Beijing.
to reduce pollutant emissions. Numerous pollution control
measures have been introduced, including improved indus-
trial emissions standards, the promotion of clean fuels in-        2   Methods
stead of coal within the residential sector, improving vehicle
emissions standards, and taking older vehicles off the road. In    The site was located at the Institute of Atmospheric Physics
Beijing, 900 000 households have converted from using coal         (IAP), between the 3rd Ring Road and 4th Ring Road. Mea-
to cleaner technologies such as gas or electricity since 2013.     surements took place between 17 May and 24 June 2017.
These actions have led to a 32 % decrease in NO2 emissions         The site is typical of central Beijing, surrounded by residen-
since 2012 (Liu et al., 2016; Krotkov et al., 2016; Miyazaki       tial and commercial properties and is near several busy roads.
et al., 2017). Most significant for NOx emissions however          It is also close to several green spaces, including a tree-lined
is the stringent vehicle control measures introduced within        canal to the south and the Olympic Forest Park to the north-
the last decade, accounting for 47 % of the total reduction in     east. Isoprene mixing ratios were measured by dual-channel
emissions for the city (Cheng et al., 2019). Such reductions       gas chromatography with flame ionisation detection (DC-
in NOx emissions are expected to lead to an increased impor-       GC-FID). IEPOX + ISOPOOH were observed using iodide
tance of low-NO oxidation pathways for VOCs in urban and           chemical ionisation mass spectrometry. The sum of MACR
suburban areas (e.g. Praske et al., 2018). This will lead to the   + methyl vinyl ketone (MVK) (m/z 71.05) was measured us-
production of a range of low-volatility multi-functionalised       ing proton transfer mass spectrometry. Particle samples were
products, efficient at producing SOA, which have previously        collected onto filter papers at either 3-hourly or 1-hourly

Atmos. Chem. Phys., 21, 1613–1625, 2021                                              https://doi.org/10.5194/acp-21-1613-2021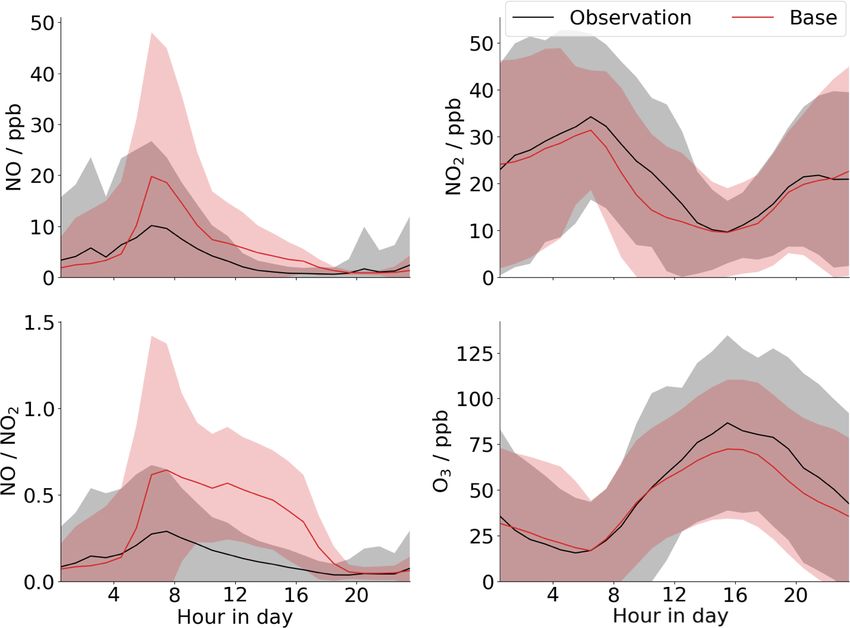
M. J. Newland et al.: Low-NO atmospheric oxidation pathways in a polluted megacity 1615
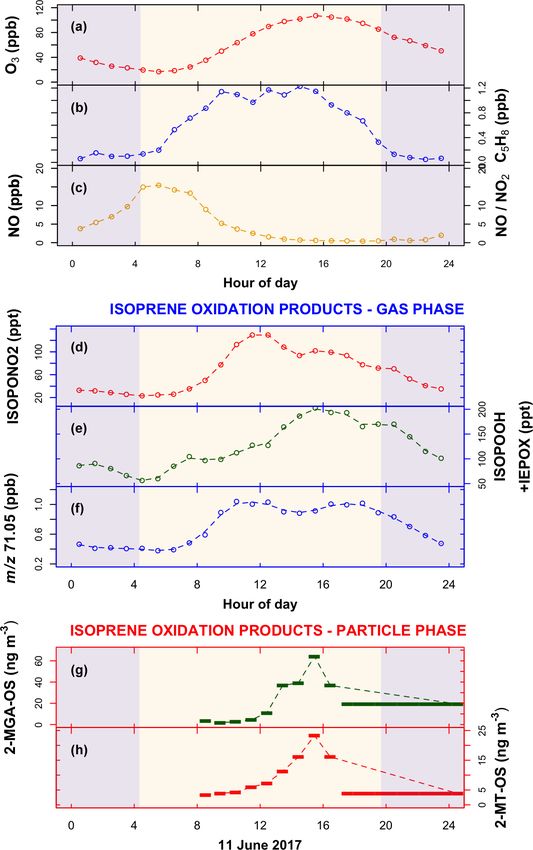
Figure 1. Formation pathways of isoprene oxidation products used as tracers of high- and low-NO chemistry in this work. Following reaction
of the primary VOC, isoprene, with OH, a peroxy radical intermediate (ISOPOO) is formed. At low NO concentrations, ISOPOO reacts with
HO2 (or other RO2 ), to yield hydroperoxide (ISOPOOH) isomers ((4,3)-ISOPOOH isomer is shown), which can be rapidly oxidised to
isoprene epoxydiol (IEPOX) isomers. At high NO concentrations, ISOPOO reacts with NO, a minor product of which is an isoprene nitrate
(ISOPONO2). One of the major products of the ISOPOO reaction with NO is methacrolein (MACR), the subsequent oxidation of which, in
the presence of NO2 , can lead to 2-methylglyceric acid (2-MGA) and its corresponding oligomers and organosulfates in the aerosol phase.
Measurements of these products in the gas or aerosol phase can be used as tracers for the chemical environment in which they were formed.
time periods, depending on pollution levels. Filters were ex- paign, gas-phase backgrounds were established by regularly
tracted and analysed with a high-throughput method using overflowing the inlet with dry N2 for 5 continuous minutes
ultrahigh-pressure liquid chromatography (LC) coupled to a every 45 min and were applied consecutively. The overflow-
Q Exactive Orbitrap mass spectrometer. Nitric oxide, NO, ing of dry N2 will have a small effect on the sensitivity of
was measured by chemiluminescence with a Thermo Scien- the instrument to those compounds whose detection is water
tific Model 42i NOx analyser. Nitrogen dioxide, NO2 , was dependent. Here we find that due to the very low instrumen-
measured using a Teledyne Model T500U cavity attenuated tal background for C5 H10 O3 and C5 H9 NO4 , the absolute er-
phase shift (CAPS) spectrometer. Ozone, O3 , was measured ror remains small from this effect (< 10 ppt in both reported
using a Thermo Scientific Model 49i UV photometer. measurements).
Field calibrations were regularly carried out using known-
2.1 Instrumentation concentration formic acid gas mixtures made in a custom-
made gas-phase manifold. A range of other species were cal-
2.1.1 DC-GC-FID ibrated for after the campaign, and relative calibration factors
were derived using the measured formic acid sensitivity dur-
Observations of VOCs were made using dual-channel gas ing these calibrations, as has been performed previously (Le
chromatography with flame ionisation detection (DC-GC- Breton et al., 2018; Bannan et al., 2015). In addition to this,
FID). Air was sampled at 30 L min−1 at a height of 5 m, offline calibrations, prior to and after the fieldwork project,
through a stainless-steel manifold (0.5 in. internal diameter). of a wide range of organic acids, HNO3 , and Cl2 were
Subsamples of 500 mL were taken, dried using a glass con- performed to assess possible large-scale sensitivity changes
densation finger held at −40 ◦ C, and then pre-concentrated over the measurement period. No significant changes were
using a Markes Unity 2 pre-concentrator on a multi-bed observed. Offline calibrations after the fieldwork campaign
ozone precursor adsorbent trap (Markes International Ltd). were performed specific to the isoprene oxidation species
These samples were then transferred to the gas chromatogra- observed here. IEPOX (C5 H10 O3 ) synthesised by the Depart-
phy (GC) oven for analysis following methods described by ment of Environmental Sciences and Engineering, University
Hopkins et al. (2011). of North Carolina, was specifically calibrated for. Aliquots of
known concentrations of IEPOX (C5 H10 O3 ) were thermally
2.1.2 CIMS desorbed into a known continuous flow of nitrogen. For
C5 H9 NO4 there was no direct calibration source available
A time-of-flight chemical ionisation mass spectrometer and concentrations using the calibration factor of C5 H10 O3
(ToF-CIMS) (Lee et al., 2014; Priestley et al., 2018) using are presented here. Absolute measurement uncertainties are
an iodide ionisation system was deployed. The experimental estimated at 50 % for the presented IEPOX + ISOPOOH and
set-up of the University of Manchester ToF-CIMS has been ISOPONO2 (C5 H9 NO4 ) signals.
previously described in Zhou et al. (2018). During the cam-
https://doi.org/10.5194/acp-21-1613-2021 Atmos. Chem. Phys., 21, 1613–1625, 2021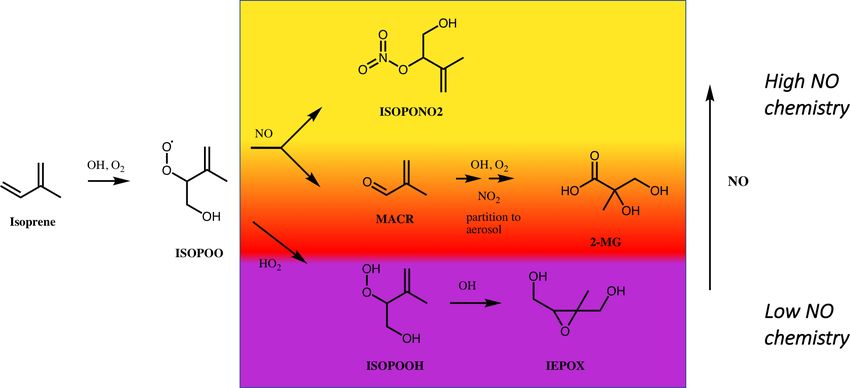
1616                                M. J. Newland et al.: Low-NO atmospheric oxidation pathways in a polluted megacity

2.1.3   PTR-MS                                                     then pushed through a 0.22 µm filter (Millipore) into another
                                                                   sample vial. An additional 1 mL of water was added to the
A proton transfer reaction time-of-flight mass spectrometer        filter sample and then extracted through the filter, to give a
(PTR-ToF-MS 2000, Ionicon Analytik GmBH, Innsbruck)                combined aqueous extract. This extract was then reduced to
was deployed at the base of the 325 m meteorological tower         dryness using a vacuum solvent evaporator (Biotage, Swe-
at the IAP field site. This instrument has been described in       den). The dry sample was then reconstituted in 1 mL 50 : 50
detail by Jordan et al. (2009). The PTR-ToF-MS was oper-           MeOH : H2 O solution, ready for analysis.
ated at a measurement frequency of 5 Hz and an E/N ra-                 The extracted filter samples and standards were anal-
tio (where E represents the electric field strength and N the      ysed using ultra performance liquid chromatography–tandem
buffer gas density) in the drift tube of 130 Td. To enable ac-     mass spectrometry (UPLC–MS2 ), using an UltiMate 3000
curate calibration of the mass scale, trichlorobenzene was in-     UPLC instrument (Thermo Scientific, USA) coupled to a
troduced by diffusion into the inlet stream.                       Q Exactive Orbitrap MS (Thermo Fisher Scientific, USA)
   The instrument was switched between two inlet systems in        with heated electrospray ionisation (HESI). The UPLC
an hourly cycle. For the first 20 min of each hour the proton      method uses a reverse-phase, 5 µm, 4.6 × 100 mm, Accu-
transfer reaction mass spectrometer (PTR-MS) sampled from          core column (Thermo Scientific, UK) held at 40 ◦ C. The
a gradient-switching manifold, and for the next 40 min the in-     mobile phase consists of LC–MS-grade water and 100 %
strument subsampled a common flux inlet line running from          MeOH (Fisher Chemical, USA). The water was acidified us-
the 102 m platform on the tower to the container in which          ing 0.1 % formic acid to improve peak resolution. The in-
the PTR-ToF-MS was housed. Gradient measurements were              jection volume was 2 µL. The solvent gradient was held for
made from 3, 15, 32, 64, and 102 m with air sampled down           a minute at 90 : 10 H2 O : MeOH; the gradient then changed
0.25 in. o.d. PFA lines and split between a 3 L min−1 bypass       linearly to 10 : 90 H2 O : MeOH over 9 min; it was then held
and 300 mL min−1 sample drawn to a 10 L stainless-steel            for 2 min at this gradient before returning to 90 : 10 H2 O :
container. During the gradient sampling period, the PTR-           MeOH over 2 min and then held at 90 : 10 for the remaining
ToF-MS subsampled for 2 min from each container giving             2 min, with a flow rate of 300 µL min−1 . The mass spectrom-
an hourly average concentration at each height. In this work,      eter was operated in negative mode using full-scan MS2 . The
only data from the 3 m gradient height are discussed.              electrospray voltage was 4.00 kV, with capillary and aux-
   Zero air was generated using a platinum catalyst heated to      iliary gas temperatures of 320 ◦ C. The scan range was set
260 ◦ C and was sampled hourly in the gradient-switching cy-       between 50–750 m/z. Organosulfates were quantified using
cle. During the field campaign, the instrument was calibrated      an authentic standard of 2-MGA-OS obtained from the co-
twice weekly using a 15-component 1 ppmv VOC standard              author Jason D. Surratt using the method described in Bryant
(National Physical Laboratory, Teddington). The calibration        et al. (2020).
gas flow was dynamically diluted into zero air to give a six-
point calibration. The sensitivity for each mass was then cal-     2.1.5   OH measurements
culated using a transmission curve. The maximum relative
error for PTR-MS calibration using a relative transmission         The OH radical measurements were made from the roof of
curve has been estimated to be 21 % (Taipale et al., 2008).        the University of Leeds Fluorescence Assay by Gas Expan-
Data were analysed using PTR-MS Viewer 3.                          sion (FAGE) instrument container at the IAP field site. Two
                                                                   FAGE detection cells were housed in a weatherproof enclo-
2.1.4   PM2.5 filter sampling and analysis                         sure at a sampling height of approximately 4 m. OH and HO2
                                                                   radicals were detected sequentially in the first cell (the HOx
                                                                                     q
PM2.5 filter samples were collected using an Ecotech HiVol         cell), whilst HO2 and total RO2 radical observations were
3000 (Ecotech, Australia) high-volume air sampler with a se-       made using the second FAGE cell (the ROx cell), which
lective PM2.5 inlet, with a flow rate of 1.33 m3 min−1 . Filters   was coupled with a flow reactor to facilitate RO2 detec-
were baked at 500 ◦ C for 5 h before use. After collection,        tion (Whalley et al., 2018). A Nd:YAG pumped Ti:Sapphire
samples were wrapped in foil and then stored at −20 ◦ C and        laser was used to generate 5 kHz pulsed tunable UV light
shipped to the laboratory. Samples were collected at a height      at 308 nm and to excite OH via the Q1(1) transition of the
of 8 m, on top of a building in the IAP complex. Hourly sam-       A2 6 + , v 0 = 0 ← X 2 5i , v 00 = 0 band. On-resonance fluores-
ples were taken on 11 June 2017 between 08:00 and 17:00            cence was detected using a gated-microchannel-plate photo-
local time (LT), with one further sample taken overnight.          multiplier and photon counting. A background signal from
The extraction of the organic aerosol from the filter sam-         laser and solar scatter and detector noise was determined by
ples was based on the method of Hamilton et al. (2008). Ini-       scanning the laser wavelength away from the OH transition
tially, roughly an eighth of the filter was cut up into 1 cm2      (OHWAVE−BKD ). For the entire campaign the HOx cell was
pieces. Then added to the sample was 4 mL of LC–MS-grade           equipped with an inlet pre-injector (IPI) which chemically
H2 O, and it was left for 2 h. The samples were then soni-         scavenged ambient OH by periodically injecting propane into
cated for 30 min. Using a 2 mL syringe, the water extract was      the airstream just above the FAGE inlet. The removal of am-

Atmos. Chem. Phys., 21, 1613–1625, 2021                                              https://doi.org/10.5194/acp-21-1613-2021
M. J. Newland et al.: Low-NO atmospheric oxidation pathways in a polluted megacity 1617
bient OH by chemical reaction provided an alternative means (Emmerson and Evans, 2009), together with the isoprene
to determine the background signal (OHCHEM−BKD ) without scheme and the relevant inorganic chemistry, from the near-
the need to tune the laser wavelength. By comparison with explicit chemical mechanism the Master Chemical Mecha-
OHWAVE−BKD , OHCHEM−BKD was used to identify if any nism (MCM) v3.3.1 (Jenkin et al., 1997, 2015). The com-
OH was generated internally within the FAGE cell, acting as plete isoprene degradation mechanism in MCM v3.3.1 con-
an interference signal. In general, good agreement between sists of 1926 reactions of 602 closed-shell and free-radical
OHCHEM−BKD and OHWAVE−BKD was observed, with a ratio species, which treat the chemistry initiated by reaction with
of 1.07 for the whole campaign (Woodward-Massey, 2018). OH radicals, NO3 radicals, and ozone. It contains much of
In this paper, the OHCHEM observations are used. The instru- the isoprene HOx recycling chemistry identified as impor-
ment was calibrated every few days by overflowing the de- tant in recent years under “low-NO” conditions, including
tection cell inlet with a turbulent flow of high-purity humid the peroxy radical 1,4 and 1,6 H-shift chemistry described in
air containing a known concentration of OH (and HO2 ) radi- the LIM1 mechanism (Peeters et al., 2009, 2014), as sum-
cals generated by photolysing a known concentration of H2 O marised in Wennberg et al. (2018). Model photolysis rates
vapour at 185 nm. The product of the photon flux at 185 nm were calculated using the Tropospheric Ultraviolet and Visi-
and the time spent in the photolysis region were measured ble Radiation Model (TUV v5.2) (Madronich, 1993).
before and after the campaign using N2 O actinometry (Com- The box model was initialised with a range of differ-
mane et al., 2010). ent concentrations of isoprene (1.7, 3.4, 5.0, 6.7 ppb), and
OH (0.25 × 10⁶ , 0.5 × 10⁶ , 1.0 × 10⁶ , 3.0 × 10⁶ , 10 × 106 ,
2.1.6 OH reactivity measurements 20 × 106 cm−3 ). [CH4 ] was fixed at 1.85 ppmv and [CO] at
110 ppbv; T = 298 K, and [H2 O] = 2.55 × 1017 cm−3 . En-
OH reactivity measurements were made using a laser flash trainment loss rates for all model species were set to 1 ×
photolysis pump-probe technique (Stone et al., 2016). Am- 10−5 cm−3 s−1 . For the box model, a column average value
bient air, sampled from the roof of the FAGE container, was for deposition velocity, Vd , was calculated according to the
drawn into a reaction cell at a flow rate of 15 SLM. A 1 SLM functionalities of each species (Table S2 in the Supplement).
flow of high-purity, humidified air which had passed by a Hg These terms prevent the build-up of secondary products. The
lamp, generating ∼ 50 ppbv of ozone, was mixed with the values are based on reported deposition rates in Nguyen et
ambient air at the entrance to the reaction cell. The ozone al. (2015b). A boundary layer height (BLH) of 1.5 km was
present was photolysed by 266 nm laser light at a pulse repe- assumed. Loss rates (Ld ) for each species to dry deposition
tition frequency of 1 Hz along the central axis of the reaction are then Ld = Vd /BLH. Photolysis rates were fixed to mean
cell, leading to the generation of a uniform profile of OH rates for the daytime period 09:00–17:00 LT calculated for
radicals following the reaction of O(1 D) with H2 O vapour. 1 July 2017. The model was then run to steady state for a
The decay in the OH radical concentration by reaction with range of fixed NO mixing ratios from 0–16 000 pptv.
species present in the ambient air was monitored by sam-
pling a portion of the air in to a FAGE cell positioned at
2.3 GEOS-Chem modelling
the end of the reaction cell. A fraction of the 5 kHz, 308 nm
radiation generated by the Ti:Sapphire laser passed through
the OH reactivity FAGE cell perpendicular to the airstream, GEOS-Chem version 11-01 (http://wiki.seas.harvard.edu/
electronically exciting the OH radicals, and the subsequent geos-chem/index.php/GEOS-Chem_v11-01, last access:
laser-induced fluorescence signal was detected with a gated- 15 January 2021) with the inclusion of the aromatic
channel photomultiplier tube. The 1 Hz OH decay profiles component of RACM2 (regional atmospheric chemistry
were integrated for 5 min and fitted to a first-order rate equa- mechanism 2) was run nested at 0.25 × 0.3125◦ resolution,
tion to determine the observed loss rate of OH (kobs ). The with 4 × 5◦ boundary conditions using GEOS-FP meteo-
total OH reactivity, k(OH), was calculated by subtracting the rology. The NO emissions were added via the default MIX
rate coefficient associated with physical losses of OH (kphys ) emissions inventory, which required a 0.9 multiplier applied
from kobs . kphys was determined by monitoring the decay of to the total daily emissions to match observations from the
OH when the ambient air was replaced with a flow of 15 SLM Atmospheric Pollution and Human Health (APHH) summer
high-purity air. A small correction to account for dilution of campaign. The diurnal scale factor was considerably steeper
the ambient air by the 1 SLM flow of ozone-containing syn- than the default GEOS-Chem NO diurnal one, with a day-
thetic air was also applied. time scale factor on the order of a 1.7× and a 0.25 nighttime
multiplier. Isoprene emissions calculated by the MEGAN
2.2 Box modelling v2.1 (http://wiki.seas.harvard.edu/geos-chem/index.php/
MEGAN_v2.1_plus_Guenther_2012_biogenic_emissions,
The box modelling that feeds into Fig. 3 was performed us- last access: 15 January 2015; Guenther et al., 2012) biogenic
ing the Dynamically Simple Model of Atmospheric Chemi- emissions extension were scaled by 2.5 in the Beijing
cal Complexity (DSMACC), a zero-dimensional box model metropolitan region (Jing–Jin–Ji).
https://doi.org/10.5194/acp-21-1613-2021 Atmos. Chem. Phys., 21, 1613–1625, 20211618 M. J. Newland et al.: Low-NO atmospheric oxidation pathways in a polluted megacity
3 Results
Beijing is a megacity (population of 21.4 million) with an
atmospheric reactive VOC mix with both biogenic and an-
thropogenic influences (e.g. Li et al., 2020). Mean diur-
nal cycles of ozone, NO, and isoprene and a range of gas-
and aerosol-phase isoprene oxidation products measured at a
city-centre site in summer 2017 (Shi et al., 2019) are shown
in Fig. 2. Data are filtered to only include “typical” chem-
istry days, which are considered to be when the ozone mix-
ing ratio increases through the morning to an afternoon peak
of > 70 ppb. Such typical days account for 25 of the to-
tal of 34 measurement days. Further details of the data fil-
tering is given in Sect. S1 of the Supplement. Ozone in-
creases throughout the day to a mid-afternoon peak (Fig. 2a),
driven by the photolysis of NO2 , which is rapidly regen-
erated through the reactions of ozone, RO2 , and HO2 with
NO. The high level of ozone acts to suppress NO concentra-
tions. Such a diurnal cycle is typical of urban environments
(Ren et al., 2003; Whalley et al., 2018). However, ozone is
so high in Beijing, with mixing ratios regularly > 100 ppbv
in the afternoon, that on many days NO concentrations fall to
< 0.5 ppbv in the afternoon and on some days to < 0.1 ppbv
(see Figs. S4 and S5 in the Supplement).
The observed diurnal cycles of low-NO and high-NO iso-
prene oxidation products (Fig. 1) in both the gas and the
aerosol phases can be explained by the observed diurnal cy-
cle of NO (Fig. 2c). The high-NO product isoprene nitrate
(ISOPONO2 ), measured using a chemical ionisation mass
spectrometer (CIMS) – see Sect. 2.1.2 for further details,
is produced throughout the morning from reaction of iso-
prene peroxy radicals (ISOPOO) with NO (Fig. 2d). Dur-
ing the afternoon, an increasing fraction of ISOPOO begins
to react with HO2 or RO2 as the NO concentration drops.
This leads to the observed decrease in ISOPONO2 and an
increase in the low-NO products IEPOX + ISOPOOH (also
measured by CIMS) through the afternoon (Fig. 2e). The
profile of the signal at m/z 71.05 is assumed to be domi- Figure 2. Mean diurnal variation in measured organic and inor-
ganic species in the gas and aerosol phase during the Beijing sum-
nated by the high-NO products MACR+MVK, measured by
mer observations (data are filtered to only include typical chemistry
a proton transfer reaction time-of-flight mass spectrometer
days – see text for details; the standard deviation of the mean is
(PTR-ToF-MS) – see Sect. 2.1.2 for further details. This sig- shown in Fig. S3). Blue-shaded areas are nighttime. (a) Ozone (O3 );
nal is very similar to that of ISOPONO2 until about 15:00 LT, (b) isoprene (C5 H8 ); (c) nitric oxide (NO) and the ratio NO/NO2 ;
when it begins to increase, with a second peak observed at (d) the gas-phase isoprene high-NO oxidation product, isoprene
around 17:00 LT (Fig. 2f). This latter peak may be an obser- nitrate (ISOPONO2); (e) the isoprene low-NO oxidation products
vational artefact as a result of the conversion of ISOPOOH ISOPOOH + IEPOX; (f) m/z 71.05, assumed to be predominantly
to either MVK (via 1,2-ISOPOOH – the dominant isomer; the gas-phase isoprene high-NO oxidation products methacrolein
Reeves et al., 2020) or MACR (via 4,3-ISOPOOH) on metal (MACR) (precursor to 2-MGA) + methyl vinyl ketone (MVK), sig-
surfaces within the inlet of the PTR instrument (Rivera-Rios nal calibrated with MACR and MVK – see text for further details.
et al., 2014). Isoprene oxidation products can also parti- (g, h) SOA components: 2-methyltetrol-organosulfate (2-MT-OS)
and 2-methylglyceric acid-organosulfate (2-MGA-OS), both mea-
tion into the particle phase and undergo heterogeneous reac-
sured on 11 and 12 June 2017; the last filter sample was taken from
tions to form organosulfates, with concentrations driven by a
17:30 LT on 11 June–08:30 LT on 12 June 2017.
number of additional factors such as particulate sulfate and
water vapour concentrations. Isoprene organosulfate trac-
ers, 2-MGA-OS (Fig. 2g) and 2-methyltetrol-OS (Fig. 2h),
were measured on 11 June 2017, with low concentrations
Atmos. Chem. Phys., 21, 1613–1625, 2021 https://doi.org/10.5194/acp-21-1613-2021M. J. Newland et al.: Low-NO atmospheric oxidation pathways in a polluted megacity 1619
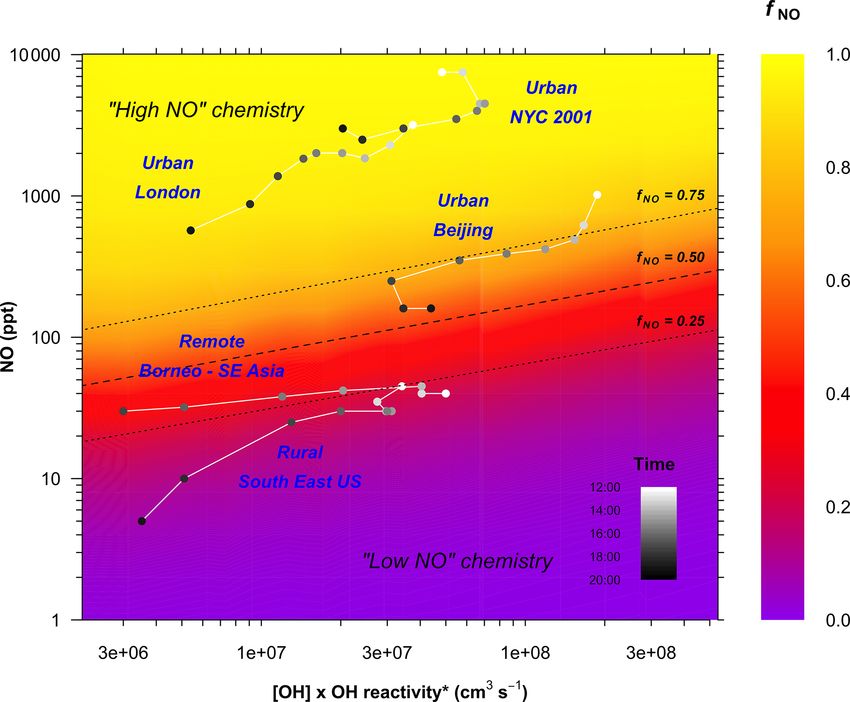
through the morning, increasing during the afternoon to a As expected, fNO increases with increasing NO concentra-
peak at around 15:00–16:00 LT. Both are tracers for non-NO- tion. It also shows that fNO is not a fixed value for a given
driven chemistry. While 2-methyltetrol-OS is formed via the concentration of NO but decreases with the increasing reac-
ISOPOO + HO2 IEPOX pathway (Paulot et al., 2009; Surratt tivity of the system (the x axis in Fig. 3). The reactivity varies
et al., 2010; Lin et al., 2012), 2-MGA-OS (Lin et al., 2013) as a function of the VOC mixing ratios, the reactivity of the
is formed from the OH-initiated oxidation of MPAN (per- VOCs, and the OH concentration, i.e. [OH]×k(OH)∗ (Eq. 1).
oxymethacrylic nitric anhydride) (Kjaergaard et al., 2012; Higher reactivity and higher OH concentrations both P lead to
Nguyen et al., 2015a), with further oxidation leading to 2- a higher concentration of peroxy radicals ([HO2 ]+ [RO2 ]),
MGA (Surratt et al., 2010; Chan et al., 2010; Nguyen et reducing fNO . Average measurements of [OH]×k(OH)∗ and
al., 2015a). MPAN is a product of the OH-initiated oxida- [NO] for the afternoon (12:00–20:00 LT) from a range of dif-
tion of MACR in an environment with a high NO2 /NO ra- ferent environments are shown in Fig. 3 (see also Table S1
tio. So the observation of 2-MGA-OS formation reflects the in the Supplement). The RO2 chemistry in the rural south-
observed diurnal NO cycle in Beijing. MACR is formed in eastern USA and the Borneo rainforest lies in the low-NO
the morning through the OH oxidation of isoprene in a high- regime (i.e. fNO < 0.5) for the whole afternoon. In the ur-
NO environment, followed by OH oxidation of MACR in a ban areas of London and New York the chemistry remains in
high-NO2 /NO environment in the afternoon to form MPAN, the high-NO regime throughout the whole afternoon. How-
which reacts further with OH to yield 2-MGA. ever, in Beijing, the extreme suppression of NO concentra-
The observed temporal profiles of the isoprene tracer prod- tions in the afternoon drives the chemistry from a regime in
ucts suggest a chemical cycle switching from a high-NO which > 95 % of the RO2 is reacting with NO during the
chemical regime in the morning to a regime with a signif- morning to one in which less than 70 % is reacting with NO
icant contribution from low-NO chemistry in the afternoon by the mid-afternoon. HO2 concentrations were measured by
in Beijing. First, isoprene nitrates, formed predominantly FAGE during the campaign (Whalley et al., 2020). Concen-
during the morning (Fig. 2d), are characteristic of high-NO trations peaked in the mid-afternoon (i.e. when NO is at its
chemistry. Second, isoprene hydroperoxides (ISOPOOH) lowest), regularly exceeding 5 × 108 cm−3 and reaching up
and epoxydiols (IEPOX) (Fig. 2e), formed predominantly to 1 × 109 cm−3 on some days. Based on the relative reaction
during the afternoon, are characteristic of low-NO chemistry, rates of RO2 with NO and HO2 , for [HO2 ] = 5 × 108 cm−3
where the reaction of ISOPOO with HO2 dominates over the contribution of low-NO pathways to RO2 removal would
the reaction with NO. The formation of highly oxygenated be expected to be roughly 50 % at [NO] = 100 ppt and 10 %
molecules (HOMs), characteristic of RO2 isomerisation and at [NO] = 1 ppb.
auto-oxidation in low-NO environments, has also been ob-
served during the afternoon at this site (Brean et al., 2019).
Third, the observation of large amounts of 2-methylglyceric 5 Discussion and conclusions
acid (2-MGA-OS) (Fig. 2g) in the aerosol is suggestive of
both high- and low-NO chemistry having occurred. Modelling was performed with the global chemical transport
model GEOS-Chem, with a nested grid at a 0.25 × 0.3125◦
resolution over China (see Sect. 2.3 – “GEOS-Chem mod-
4 Box modelling elling”), to investigate the modelled diurnal cycle of NO for
Beijing. The results are compared to the measurements for
The chemical box model DSMACC (Emmerson and Evans,
the entire campaign (note not the filtered measurements pre-
2009), coupled with the near-explicit oxidation mechanism
sented in Fig. 2) (Fig. 4). These show that while the model
for isoprene from the Master Chemical Mechanism (MCM
does a good job of recreating the measured ozone and NO2
v3.3.1) (Jenkin et al., 1997, 2015), was used to assess the sen-
diurnal profiles for the campaign period, it cannot match
sitivity of the fraction of ISOPOO reacting with NO (fNO ) to
the observed diurnal profiles of [NO] or the NO-to-NO2 ra-
varying NO concentrations and OH reactivities (Eq. 1)
X tio, particularly at sub-ppb levels typically observed during
k(OH) = kOH+VOC [VOC]. (1) the afternoon. Thus the model will not capture the forma-
The model was run to steady state at a range of different fixed tion of low-NO products from isoprene and other VOCs in
concentrations of [OH], [NO], and [isoprene], using fixed Beijing. The major driver of the low-NO concentrations in
photolysis rates typical of the Beijing daytime (see Sects. 2 the model is the high level of ozone, which titrates out the
and S5). Figure 3 plots [OH] × k(OH)∗ against [NO], where NO. The mean afternoon ozone peak is underpredicted by
k(OH)∗ is the OH reactivity less the contribution from OH the model by about 10 %. However, this has little impact
reactions with NOx and NOy species (Eq. 2), since these re- on the modelled NO concentrations which the model over-
actions do not produce RO2 . predicts by a factor of 3–5 throughout the afternoon. As
such, with the chemistry currently in the model there is very
k(OH)∗ = k(OH) − kOH+NO2 [NO2 ] little flexibility available to appreciably change this ratio;
+ kOH+NO [NO] + kOH+HNO3 [HNO3 ]. . . (2) i.e. changes to other NO sinks in the model, such as RO2 ,
https://doi.org/10.5194/acp-21-1613-2021 Atmos. Chem. Phys., 21, 1613–1625, 20211620 M. J. Newland et al.: Low-NO atmospheric oxidation pathways in a polluted megacity
Figure 4. Comparison of GEOS-Chem model output (red) to mean
diurnal measurements for the entire campaign (black) for NO, NO2 ,
Figure 3. Variation in the fraction of ISOPOO reacting with NO O3 , and the NO/NO2 ratio. Shaded regions are 2 standard devia-
as a function of NO concentration and the reactivity of the system. tions of the mean.
The plot is derived from a series of zero-dimensional box model
runs performed as a function of fixed concentrations of [NO], [OH],
and [isoprene]. Photolysis is fixed to an average of 09:00-17:00 LT species (not currently included in the chemical scheme) that
conditions. k(OH)∗ is the total OH reactivity less the contribution can rapidly convert NO to NO2 , e.g. halogen oxides.
from OH reactions with NOx and NOy species (Eq. 2), since these Similar mixed NO regimes to those observed here for Bei-
reactions do not produce RO2 . The dashed line shows the frac- jing have been observed previously at a suburban site in the
tion of ISOPOO reacting with NOfNO = 0.50; dotted lines show
Pearl River Delta (Tan et al., 2019), and in the semi-rural
fNO = 0.25 and 0.75. Points are average diurnal hourly measure-
ments of NO, OH, and k(OH)∗ for the period 12:00–20:00 LT from
southeastern USA (Xiong et al., 2015), albeit with lower
a range of different environments: the rural sites, Borneo (Whalley morning NO peaks. Such a mixed regime will lead to a
et al., 2011) (only shown for 12:00–18:00 LT) and the southeastern range of low-volatility multi-functional products (Xiong et
USA (Sanchez et al., 2018) and the urban sites London (Whalley al., 2015; Lee et al., 2016), some of which are only acces-
et al., 2016), New York City (Ren et al., 2003), and Beijing (this sible through this regime, which can efficiently partition to
work). See the Supplement for full details. the particle phase to contribute to SOA. With the rates of
RO2 + NO and RO2 + HO2 similar for most peroxy radicals
(Orlando and Tyndall, 2012), the chemical regime reported
through changes to VOC emissions, will have little effect on herein is not just relevant to isoprene but to all VOCs (see a
[NO]. The fact that the GEOS-Chem modelling cannot recre- comparison for butane and toluene in Fig. S11).
ate the extremely low NO levels observed in the afternoon Our observations from Beijing challenge the commonly
suggests that there may be additional sinks for NO beyond accepted view of polluted urban areas as high-NO atmo-
those currently included in the chemical mechanism. One spheric environments in two ways. First, very high ozone
explanation may be the occurrence of RO2 + NO oxidation (and other sinks) regularly reduces afternoon NO to < 1 ppbv
pathways that lead to the formation of a second RO2 species and on some days to < 0.1 ppbv. This leads to the formation
before forming a stable species, effectively increasing the ef- of low-NO products in the gas and aerosol phase. Second,
ficiency of NO-to-NO2 conversion per initial oxidation step the level of NO that is required for low-NO chemistry to oc-
(e.g. Whalley et al., 2020). Such reactions are expected to be cur is not a fixed value but is dependent on the concentration
particularly important for larger and more complex VOCs, and reactivity of the VOCs present and the concentration of
for which the detailed oxidation processes have been less OH. Hence NO concentrations that represent low-NO con-
studied and which are heavily parameterised in global mod- ditions in a tropical rainforest, for example, are different to
els. Auto-oxidation processes that regenerate OH, leading to those that represent low-NO conditions in a highly polluted
the formation of further RO2 , have also been proposed previ- urban environment with elevated OH and OH reactivity.
ously for the high-VOC–low-NO (< 1 ppbv) conditions seen Under the conditions observed in Beijing, the produc-
in Beijing and other cities (Hofzumahaus et al., 2009; Whal- tion of low-NO SOA and the associated increase in PM is
ley et al., 2018; Tan et al., 2019). Inclusion of such RO2 ox- shown to be closely linked to photochemical ozone produc-
idation processes is one of the main foci of the next gener- tion. Policies that reduce the afternoon ozone peak might also
ation of atmospheric chemical mechanisms. Another expla- be expected to reduce the production of these aerosol-phase
nation may be the presence of high concentrations of other products. However, such policies must also take account of
Atmos. Chem. Phys., 21, 1613–1625, 2021 https://doi.org/10.5194/acp-21-1613-2021M. J. Newland et al.: Low-NO atmospheric oxidation pathways in a polluted megacity 1621
the complex interactions between NOx , VOCs, ozone, and fate aerosol measurements. LKW, DEH, EJS, RW-M, and CY pro-
PM. For example, reducing NOx emissions can counter- vided the OH and HO2 data. MN, PME, and ARR provided the
intuitively lead to increases in ozone, as has occurred in other MCM box modelling. PDI and MJE provided the GEOS-Chem
major cities (Air Quality Expert Group, 2009), and a recent model run. ACL is the principal investigator of the APHH-Beijing
modelling study (Li et al., 2019) has suggested that reducing project. MJN, JFH, and ARR conceived and wrote the manuscript
with input and discussion from all co-authors.
PM has led to increases in ozone in China, although a re-
cent experimental study (Tan et al., 2020) in the North China
Plain could not observe this effect. With many existing and
Competing interests. The authors declare that they have no conflict
developing megacities being located in subtropical regions
of interest.
with high emissions of reactive biogenic VOCs, the control
of which is very difficult, and with continuing reductions in
NOx emissions, such extreme chemical environments as that Special issue statement. This article is part of the special issue
observed in Beijing can be expected to proliferate. The fail- “In-depth study of air pollution sources and processes within Bei-
ure of regional and global models to accurately replicate this jing and its surrounding region (APHH-Beijing) (ACP/AMT inter-
chemical regime has wider implications for the prediction of journal SI)”. It is not associated with a conference.
secondary pollutants and hence for determining policies to
control air pollution episodes.
Acknowledgements. We acknowledge the support from Pingqing
Fu, Zifa Wang, Jie Li, and Yele Sun from the IAP for hosting the
Code availability. The GEOS-Chem model code is available APHH-Beijing campaign at the IAP. We thank Zongbo Shi, Roy
from https://github.com/geoschem/geos-chem (last access: Harrison, Tuan Vu, and Bill Bloss from the University of Birming-
2 February 2021, International GEOS-Chem User Commu- ham; Siyao Yue, Liangfang Wei, Hong Ren, Qiaorong Xie, Wanyu
nity, 2017). The DSMACC model (Emmerson and Evans, Zhao, Linjie Li, Ping Li, Shengjie Hou, and Qingqing Wang from
2009, https://doi.org/10.5194/acp-9-1831-2009) is available at the IAP; Kebin He and Xiaoting Cheng from Tsinghua University;
http://wiki.seas.harvard.edu/geos-chem/index.php/DSMACC_ and James Allan from the University of Manchester for providing
chemical_box_model (last access: 28 January 2021), and logistic and scientific support for the field campaigns. Peter Ivatt
the MCMv3.3.1 chemical mechanism (Jenkin et al., 1997: acknowledges funding from NCAS through one of its Air Pollution
https://doi.org/10.1016/S1352-2310(96)00105-7, Jenkin et al., and Human Health studentships. Daniel Bryant, William Dixon,
2015: https://doi.org/10.5194/acp-15-11433-2015), is available at William Drysdale, Freya Squires, and Eloise Slater acknowledge
http://mcm.york.ac.uk (last access: 28 January 2021). the NERC SPHERES Doctoral Training Partnership (DTP) for stu-
dentships.
Data availability. Data are available at http://catalogue.ceda.
ac.uk/uuid/7ed9d8a288814b8b85433b0d3fec0300 (last ac- Financial support. This research has been supported by the Nat-
cess: 19 January 2021): Isoprene (Nelson et al., 2020, https:// ural Environment Research Council and the Newton Fund and
catalogue.ceda.ac.uk/uuid/fae65a63910a44b28a3d91268417b7c3); Medical Research Council in the UK and by the National Natu-
NO, NO2 , O3 (Drysdale, 2020, https://catalogue.ceda.ac. ral Science Foundation of China (grant nos. NE/N007190/1 and
uk/uuid/33ba929e3bcd4c08b69871e45a8660aa); m/z 71.05 NE/N006917/1).
(Acton et al., 2018, https://catalogue.ceda.ac.uk/uuid/
de37c54e59a548ccb9f168ee724f3769; Acton et al., 2020, https://
catalogue.ceda.ac.uk/uuid/9e11d5cb819a45068921db5ae296fb57); Review statement. This paper was edited by Frank Keutsch and re-
OH concentrations (Slater and Whalley, 2018, https://catalogue. viewed by two anonymous referees.
ceda.ac.uk/uuid/bb339ff791814fc6a8b9a93d339f5bc1); OH reac-
tivity (Whalley and Slater, 2018, https://catalogue.ceda.ac.uk/uuid/
8ed84f3c770544c49329df9b068ab662). Specific data are available
from the authors on request (jacqui.hamilton@york.ac.uk). References
Acton, J., Hewitt, N., Huang, Z., and Wang, X.: APHH: Volatile
Supplement. The supplement related to this article is available on- organic compound (VOC) mixing ratios made at the IAP-
line at: https://doi.org/10.5194/acp-21-1613-2021-supplement. Beijing site during the summer and winter campaigns, Centre
for Environmental Data Analysis, available at: https://catalogue.
ceda.ac.uk/uuid/de37c54e59a548ccb9f168ee724f3769 (last ac-
Author contributions. JRH, RED, JFH, WJFA, CNH, BL, and XW cess: 19 January 2021), 2018.
provided the VOC measurements. FAS, WSD, and JDL provided Acton, J., Hewitt, N., Huang, Z., and Wang, X.: APHH:
the NOx and O3 measurements. TJB, AM, SDW, AB, CJP, and HC Volatile organic compound (VOC) flux measurements
collected and analysed the CIMS data. TQ and JDS provided the made during the APHH-Beijing field campaigns 11-
organosulfate standards. DB, WD, and JFH provided the organosul- 12/2016 and 05-06/2017, Centre for Environmental Data
Analysis, available at: https://catalogue.ceda.ac.uk/uuid/
https://doi.org/10.5194/acp-21-1613-2021 Atmos. Chem. Phys., 21, 1613–1625, 20211622 M. J. Newland et al.: Low-NO atmospheric oxidation pathways in a polluted megacity 9e11d5cb819a45068921db5ae296fb57 (last access: 19 January Women (IGDTUW) site during the pre and post monsoon periods 2021), 2020. for the DelhiFlux field campaign 2018, Centre for Environmen- Air Quality Expert Group: Ozone in the United Kingdom, tal Data Analysis, available at: https://catalogue.ceda.ac.uk/uuid/ Department for the Environment, Food and Rural Affairs, 33ba929e3bcd4c08b69871e45a8660aa (last access: 19 January UK, available at: https://uk-air.defra.gov.uk/assets/documents/ 2021), 2020. reports/aqeg/aqeg-ozone-report.pdf (last access: 15 January Emmerson, K. M. and Evans, M. J.: Comparison of tropospheric 2021), 2009. gas-phase chemistry schemes for use within global models, At- Bannan, T. J., Booth, A. M., Bacak, A., Muller, J. B. A., Leather, mos. Chem. Phys., 9, 1831–1845, https://doi.org/10.5194/acp-9- K. E., Le Breton, M., Jones, B., Young, D., Coe, H., Allan, J., 1831-2009, 2009 (data available at: http://wiki.seas.harvard.edu/ Visser, S., Slowik, J. G., Furger, M., Prevot, A. S. H., Lee, J. geos-chem/index.php/DSMACC_chemical_box_model, last ac- Dunmore, R. E., Hopkins, J. R., Hamilton, J. F., Lewis, A. C., cess: 28 January 2021). Whalley, L. K., Sharp, T., Stone, D., Heard, D. E., Fleming, Z. Guenther, A. B., Jiang, X., Heald, C. L., Sakulyanontvittaya, L., Leigh, R., Shallcross, D. E., and Percival, C. J.: The first U.K. T., Duhl, T., Emmons, L. K., and Wang, X.: The Model of measurements of nitryl chloride using a chemical ionisation mass Emissions of Gases and Aerosols from Nature version 2.1 spectrometer in London, ClearfLo Summer, 2012, and an inves- (MEGAN2.1): an extended and updated framework for mod- tigation of the role of Cl atom oxidation, J. Geophys. Res., 120, eling biogenic emissions, Geosci. Model Dev., 5, 1471–1492, 5638–5657, 2015. https://doi.org/10.5194/gmd-5-1471-2012, 2012. Bianchi F., Kurtén, T., Riva, M., Mohr, C., Rissanen, M. P., Roldin, Hamilton, J. F., Lewis, A.C., Carey, T. J., and Wenger, J. C.: Charac- P., Berndt, T., Crounse, J. D., Wennberg, P. O., Mentel, T. F., terization of Polar Compounds and Oligomers in Secondary Or- Wildt, J., Junninen, H., Jokinen, T., Kulmala, M., Worsnop, D. ganic Aerosol Using Liquid Chromatography Coupled to Mass R., Thornton, J. A., Donahue, N., Kjaergaard, H. G., and Ehn, M.: Spectrometry, Anal. Chem., 80, 474–480, 2008. Highly Oxygenated Organic Molecules (HOM) from Gas-Phase Hofzumahaus, A., Rohrer, F., Lu, K., Bohn, B., Brauers, T., Chang, Autoxidation Involving Peroxy Radicals: A Key Contributor to C.-C., Fuchs, H., Holland, F., Kita, K., Kondo, Y., Li, X., Lou, Atmospheric Aerosol, Chem. Rev., 119, 3472–3509, 2019. S., Shao, M., Zeng, L., Wahner, A., and Zhang, Y.: Amplified Brean, J., Harrison, R. M., Shi, Z., Beddows, D. C. S., Acton, W. Trace Gas Removal in the Troposphere, Science, 324, 1702– J. F., Hewitt, C. N., Squires, F. A., and Lee, J.: Observations 1704, 2009. of highly oxidized molecules and particle nucleation in the at- Hopkins, J. R., Jones, C. E., and Lewis, A. C.: A dual channel gas mosphere of Beijing, Atmos. Chem. Phys., 19, 14933–14947, chromatograph for atmospheric analysis of volatile organic com- https://doi.org/10.5194/acp-19-14933-2019, 2019. pounds including oxygenated and monoterpene compounds, J. Bryant, D. J., Dixon, W. J., Hopkins, J. R., Dunmore, R. E., Pereira, Environ. Monit., 13, 2268–2276, 2011. K. L., Shaw, M., Squires, F. A., Bannan, T. J., Mehra, A., Wor- International GEOS-Chem User Community: geoschem/geos- rall, S. D., Bacak, A., Coe, H., Percival, C. J., Whalley, L. chem: GEOS-Chem 11.1, Version 11.1.0, GitHub, available at: K., Heard, D. E., Slater, E. J., Ouyang, B., Cui, T., Surratt, https://github.com/geoschem/geos-chem (last access: 2 February J. D., Liu, D., Shi, Z., Harrison, R., Sun, Y., Xu, W., Lewis, 2021), 2017. A. C., Lee, J. D., Rickard, A. R., and Hamilton, J. F.: Strong Jenkin, M. E., Saunders, S. M., and Pilling, M. J.: The anthropogenic control of secondary organic aerosol formation tropospheric degradation of volatile organic compounds: a from isoprene in Beijing, Atmos. Chem. Phys., 20, 7531–7552, protocol for mechanism development, Atmos. Environ., 31, https://doi.org/10.5194/acp-20-7531-2020, 2020. 81–104, https://doi.org/10.1016/S1352-2310(96)00105-7, 1997 Chan, A. W. H., Chan, M. N., Surratt, J. D., Chhabra, P. S., Loza, (data available at: http://mcm.york.ac.uk, last access: 28 January C. L., Crounse, J. D., Yee, L. D., Flagan, R. C., Wennberg, 2021). P. O., and Seinfeld, J. H.: Role of aldehyde chemistry and Jenkin, M. E., Young, J. C., and Rickard, A. R.: The MCM v3.3.1 NOx concentrations in secondary organic aerosol formation, At- degradation scheme for isoprene, Atmos. Chem. Phys., 15, mos. Chem. Phys., 10, 7169–7188, https://doi.org/10.5194/acp- 11433–11459, https://doi.org/10.5194/acp-15-11433-2015, 2015 10-7169-2010, 2010. (data available at: http://mcm.york.ac.uk, last access: 28 January Cheng, J., Su, J., Cui, T., Li, X., Dong, X., Sun, F., Yang, Y., 2021). Tong, D., Zheng, Y., Li, Y., Li, J., Zhang, Q., and He, K.: Jimenez, J. L., Canagaratna, M. R., Donahue, Prevot, A. S. H., Dominant role of emission reduction in PM2.5 air quality im- Zhang, Q., Kroll, J. H. DeCarlo, P. F., Allan, J. D., Coe, H., Ng, provement in Beijing during 2013–2017: a model-based de- N. L., Aiken, A. C., Docherty, K. S., Ulbrich, I. M., Grieshop, composition analysis, Atmos. Chem. Phys., 19, 6125–6146, A. P., Robinson, A. L., Duplissy, J., Smith, J. D., Wilson, K. https://doi.org/10.5194/acp-19-6125-2019, 2019. R., Lanz, V. A., Hueglin, C., Sun, Y. L., Tian, J., Laaksonen, Commane, R., Floquet, C. F. A., Ingham, T., Stone, D., Evans, A., Raatikainen, T., Rautiainen, J., Vaattovaara, P., Ehn, M., Kul- M. J., and Heard, D. E.: Observations of OH and HO2 rad- mala, M., Tomlinson, J. M., Collins, D. R., Cubison, M. J., Dun- icals over West Africa, Atmos. Chem. Phys., 10, 8783–8801, lea, E. J., Huffman, J. A., Onasch, T. B., Alfarra, M. R., Williams, https://doi.org/10.5194/acp-10-8783-2010, 2010. P. I., Bower, K., Kondo, Y., Schneider, J., Drewnick, F., Bor- Crounse, J. D., Nielsen, L. B., Jørgensen, S., Kjaergaard, H. G., rmann, S., Weimer, S., Demerjian, K., Salcedo, D., Cottrell, L., and Wennberg, P.: Autooxidation of Organic Compounds in the Griffin, R., Takami, A., Miyoshi, T., Hatakeyama, S., Shimono, Atmosphere, J. Phys. Chem. Lett., 4, 3513–3520, 2013. A., Sun, J. Y., Zhang, Y. M., Dzepina, K., Kimmel, J. R., Sueper, Drysdale, W.: APHH: O3, CO, NO, NO2, NOy and SO2 measure- D., Jayne, J. T., Herndon, S. C., Trimborn, A. M., Williams, L. ments made at the Indira Gandhi Delhi Technical University for R., Wood, E. C.. Middlebrook, A. M., Kolb, C. E., Baltensperger, Atmos. Chem. Phys., 21, 1613–1625, 2021 https://doi.org/10.5194/acp-21-1613-2021
M. J. Newland et al.: Low-NO atmospheric oxidation pathways in a polluted megacity                                                          1623

   U., and Worsnop, D. R.: Evolution of Organic Aerosols in the At-       Lin, Y.-H., Zhang, H., Pye, H. O. T., Zhang, Z., Marth, W. J.,
   mosphere, Science, 326, 1525–1529, 2009.                                 Park, S., Arashiro, M., Cui, T., Budisulistiorini, S. H., Sex-
Jordan, A., Haidacher, S., Hanel, G., Hartungen, E., Märk, L., See-         ton, K. G., Vizuete, W., Xie, Y., Luecken, D. J., Piletic, I.
   hauser, H., Schottkowsky, R., Sulzer, P., and Märk, T. D.: A high        R., Edney, E. O., Bartolotti, L.J., Gold, A., and Surratt, J.
   resolution and high sensitivity proton-transfer-reaction time-of-        D.: Epoxide as a precursor to secondary organic aerosol for-
   flight mass spectrometer (PTR-TOF-MS), Int. J. Mass Spec-                mation from isoprene photooxidation in the presence of ni-
   trom., 286, 122–128, 2009.                                               trogen oxides, P. Natl. Acad. Sci. USA, 110, 6718–6723,
Kjaergaard, H. G., Knap, H. C., Ørnsø, K. B., Jørgensen, S.,                https://doi.org/10.1073/pnas.1221150110, 2013.
   Crounse, J. D., Paulot, F., and Wennberg, P. O.: Atmospheric Fate      Liu, F., Zhang, Q., van der A, R. J., Zheng, B., Tong,
   of Methacrolein. 2. Formation of Lactone and Implications for            D., Yan, L., Zheng, Y., and He, K.: Recent reduction in
   Organic Aerosol Production, J. Phys. Chem. A, 116, 5763–5768,            NOx emissions over China: synthesis of satellite observations
   2012.                                                                    and emission inventories, Environ. Res. Lett., 11, 114002,
Kroll, J. H., Ng, N. L., Murphy, S. M., Flagan, R. C., and Sein-            https://doi.org/10.1088/1748-9326/11/11/114002, 2016.
   feld, J. H.: Secondary organic aerosol formation from isoprene         Liu, H., Zhang, M., Han, X., Li, J., and Chen, L.: Episode analysis
   photooxidation, Environ. Sci. Technol., 40, 1869–1877, 2006.             of regional contributions to tropospheric ozone in Beijing using a
Krotkov, N. A., McLinden, C. A., Li, C., Lamsal, L. N., Celarier,           regional air quality model, Atmos. Environ., 199, 299–312, 2019.
   E. A., Marchenko, S. V., Swartz, W. H., Bucsela, E. J., Joiner,        Madronich, S.: The Atmosphere and UV-B Radiation at Ground
   J., Duncan, B. N., Boersma, K. F., Veefkind, J. P., Levelt, P. F.,       Level, in: Environmental UV Photobiology, edited by: Young,
   Fioletov, V. E., Dickerson, R. R., He, H., Lu, Z., and Streets,          A. R., Moan, J., Björn, L. O., and Nultsch, W., Boston, MA,
   D. G.: Aura OMI observations of regional SO2 and NO2 pollu-              Springer US, 1–39, 1993.
   tion changes from 2005 to 2015, Atmos. Chem. Phys., 16, 4605–          Miyazaki, K., Eskes, H., Sudo, K., Boersma, K. F., Bowman, K.,
   4629, https://doi.org/10.5194/acp-16-4605-2016, 2016.                    and Kanaya, Y.: Decadal changes in global surface NOx emis-
Le Breton, M., Wang, Y., Hallquist, Å. M., Pathak, R. K., Zheng, J.,        sions from multi-constituent satellite data assimilation, Atmos.
   Yang, Y., Shang, D., Glasius, M., Bannan, T. J., Liu, Q., Chan,          Chem. Phys., 17, 807–837, https://doi.org/10.5194/acp-17-807-
   C. K., Percival, C. J., Zhu, W., Lou, S., Topping, D., Wang, Y.,         2017, 2017.
   Yu, J., Lu, K., Guo, S., Hu, M., and Hallquist, M.: Online gas-        Nelson, B., Hopkins, J. R., Stewart, G., Dunmore, R., and
   and particle-phase measurements of organosulfates, organosul-            Hamilton, J. F.: APHH: Online measurements of VOC mix-
   fonates and nitrooxy organosulfates in Beijing utilizing a FI-           ing ratios using Gas Chromatography with Flame Ioni-
   GAERO ToF-CIMS, Atmos. Chem. Phys., 18, 10355–10371,                     sation Detector (GC-FID) at Indira Gandhi Delhi Tech-
   https://doi.org/10.5194/acp-18-10355-2018, 2018.                         nical University for Women (IGDTUW) field site during
Lee, B. H., Lopez-Hilfiker, F. D., Mohr, C., Kurtén, T., Worsnop,           the DelhiFlux field campaign, Centre for Environmental
   D. R., and Thornton, J. A.: An iodide-adduct high-resolution             Data Analysis, available at: https://catalogue.ceda.ac.uk/uuid/
   time-of-flight chemical-ionization mass spectrometer: Applica-           fae65a63910a44b28a3d91268417b7c3 (last access: 19 January
   tion to atmospheric inorganic and organic compounds, Environ.            2021), 2020.
   Sci. Technol., 48, 6309–6317, 2014.                                    Nguyen, T. B., Bates, K. H., Crounse, J. D., Schwantes, R. H.,
Lee, B. H., Mohr, C., Lopez-Hilfiker, F. D., Lutz, A., Hallquist, M.,       Zhang, X., Kjaergaard, H. G., Surratt, J. D., Lin, P., Laskin,
   Lee, L., Romer, P., Cohen, R. C., Iyer, S., Kurten, T., Hu, W., Day,     A., Seinfeld, J. H., and Wennberg, P. O.: Mechanism of the hy-
   D. A., Campuzano-Jost, P., Jimenez, J. L., Xu, L., Ng, N. L., Guo,       droxyl radical oxidation of methacryloyl peroxynitrate (MPAN)
   H., Weber, R. J., Wild, R. J., Brown, S. S., Koss, A., de Gouw,          and its pathway toward secondary organic aerosol formation in
   J., Olson, K., Goldstein, A. H., Seco, R., Kim, S., McAvery, K.,         the atmosphere, Phys. Chem. Chem. Phys., 17, 17914–17926,
   Shepson, P. B., Baumann, K., Edgerton, E., Liu, J., Shilling, J.         https://doi.org/10.1039/C5CP02001H, 2015a.
   E., Miller, D. O., Brune, W. H., D’Ambro, E. L., and Thornton, J.      Nguyen, T. B., Crounse, J. D., Teng, A. P., Clair, J. M. S., Paulot, F.,
   A.: Highly functionalized organic nitrates in the southeast United       Wolfe, G. M., and Wennberg, P. O.: Rapid deposition of oxidized
   States: Contribution to secondary organic aerosol and reactive           biogenic compounds to a temperate forest, P. Natl. Acad. Sci.
   nitrogen budgets, P. Natl. Acad. Sci., 113, 1516–1521, 2016.             USA, 112, E392–E401, 2015b.
Li, K., Jacob, D. J., Liao, H., Shen, L., Zhang, Q., and Bates, K. H.:    Orlando, J. J. and Tyndall, G. S.: Laboratory studies of organic per-
   Anthropogenic drivers of 2013–2017 trends in summer surface              oxy radical chemistry: an overview with emphasis on recent is-
   ozone in China, P. Natl. Acad. Sci. USA, 116, 422–427, 2019.             sues of atmospheric significance, Chem. Soc. Rev., 41, 6294–
Li, Q., Su, G., Li, C., Liu, P., Zhao, X., Zhang, C., Sun,                  6317, 2012.
   X., Mu, Y., Wu, M., Wang, Q., and Sun, B.: An investi-                 Paulot, F., Crounse, J. D., Kjaergaard, H. G., Kürten, A., St. Clair,
   gation into the role of VOCs in SOA and ozone produc-                    J. M., Seinfeld, J. H., and Wennberg, P. O.: Unexpected epoxide
   tion in Beijing, China, Sci. Total Environ., 720, 137536,                formation in the gas-phase photooxidation of isoprene, Science,
   https://doi.org/10.1016/j.scitotenv.2020.137536, 2020.                   325, 730–733, 2009.
Lin, Y.-H., Zhang, Z., Docherty, K. S., Zhang, H., Budisulistiorini,      Peeters, J., Nguyen, T. L., and Vereecken, L.: HOx radical regener-
   S. H., Rubitschin, C. L., Shaw, S. L., Knipping, E. M., Edger-           ation in the oxidation of isoprene, Phys. Chem. Chem. Phys., 11,
   ton, E. S., Kleindienst, T. E., Gold, A., and Surratt, J. D.: Iso-       5935–5939, 2009.
   prene Epoxydiols as Precursors to Secondary Organic Aerosol            Peeters, J., Müller, J.-F., Stavrakou, T., and Nguyen, V. S.: Hydroxyl
   Formation: Acid-Catalyzed Reactive Uptake Studies with Au-               Radical Recycling in Isoprene Oxidation Driven by Hydrogen
   thentic Compounds, Environ. Sci. Technol., 46, 250–258, 2012.

https://doi.org/10.5194/acp-21-1613-2021                                                     Atmos. Chem. Phys., 21, 1613–1625, 2021
You can also read