Who cleans my house if the government pays? Refugees, low-educated workers, and long-term unemployed in tax-subsidized domestic service firms
←
→
Page content transcription
If your browser does not render page correctly, please read the page content below
Rickne. IZA Journal of Labor Policy (2021) 11:1
Johanna Rickne*
Who cleans my house if the government
pays? Refugees, low-educated workers, and
long-term unemployed in tax-subsidized
domestic service firms
Abstract
Many European countries have implemented policies to revive their domestic service sectors.
A common goal of these reforms has been to create employment for disadvantaged groups on
the domestic labor market. I evaluate a Swedish policy where domestic service firms receive a
50% tax deduction on labor costs. Detailed data from tax records identify all formal workers
and owners of firms that receive deductions. I describe the composition of workers and owners
in these firms with respect to three groups targeted by Swedish policymakers: refugees, people
with low education, and people who enter the workforce from long-term unemployment. I find
that the shares of refugees and long-term unemployed in the subsidized sector barely exceed
the shares in the full private labor force, and fall far below the shares in industrial sectors with
a predominance of elementary jobs. The share of people with low education is higher than in
the full private sector and on par with other low-skilled sectors. I conclude that the tax subsidy
largely failed to improve employment opportunities among the target groups. An extended
analysis suggests that labor immigration from other EU countries may be a partial explanation
for this. EU immigrants operate half of all subsidized firms in Sweden’s largest cities and nearly
exclusively employ other EU immigrants.
Current version: February 07, 2021
Keywords: Domestic Services, Tax Deduction, Employment, Refugee Immigrants
JEL codes: H2, J21, J23, J61
Corresponding author: Johanna Rickne
Johanna.rickne@sofi.su.se.
Swedish Institute for Social Research (SOFI), Stockholm University and Nottingham University, SE-106 91 Stockholm,
Sweden
© The Author(s). 2021 Open Access This article is distributed under the terms of the Creative Commons Attribution 4.0 International License
(http://creativecommons.org/licenses/by/4.0/), which permits unrestricted use, distribution, and reproduction in any medium, provided you give
appropriate credit to the original author(s) and the source, provide a link to the Creative Commons license, and indicate if changes were made.
Cite as: Rickne. IZA Journal of Labor Policy (2021) 11:1.
https://doi.org/10.2478/izajolp-2021-0001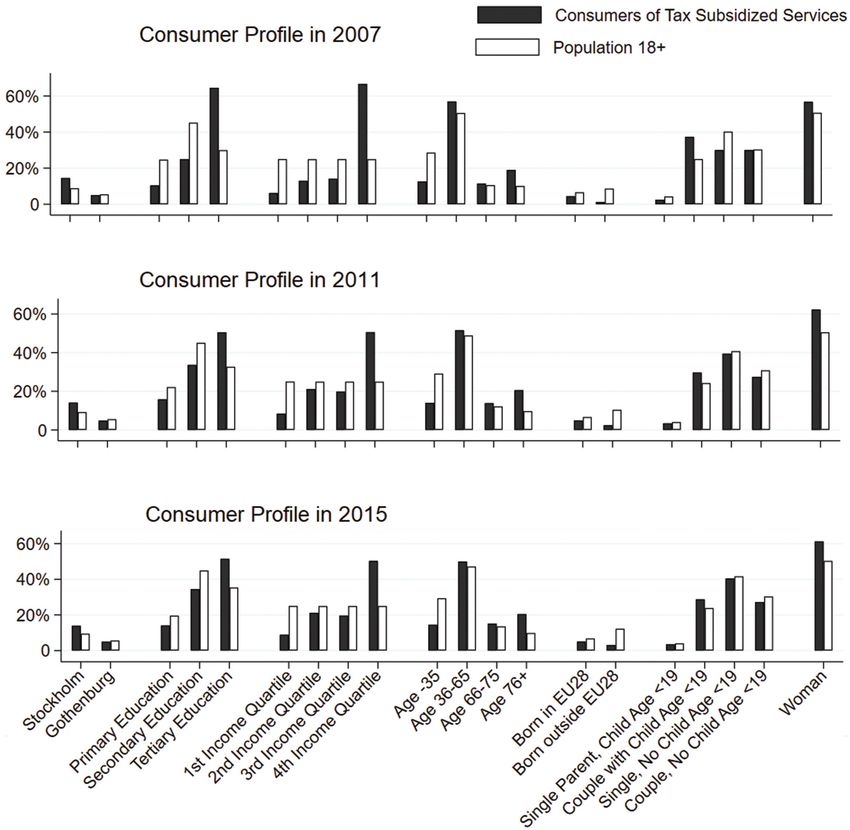
Page 2 of 37                                                                        Rickne. IZA Journal of Labor Policy (2021) 11:1

                1 Introduction
                Many European countries have introduced policies to revive their domestic service sectors.
                A common motivation behind these reforms is to create employment for people with low quali-
                fications. Such employment has been declining in the labor markets of high-income coun-
                tries. Globalization has moved jobs abroad, structural transformation has shrunk the size of
                the agricultural and industrial sectors, and digitization and automation have replaced routine
                jobs with machines. While elementary service jobs have been harder to globalize or automate,
                demand for these services has declined because of reductions in income inequality. A case in
                point is the domestic service sector, which declined to the point of near extinction in Western
                European economies over the course of the 20th century.
                     The idea to create employment for disadvantaged groups by reviving domestic service sec-
                tors took hold in Western Europe in the 1990s. Encouraged by the EU Commission and national
                lobby groups, many countries introduced policies that invested public money to lower the price
                of these services (Carbonnier and Morel 2015, Morel 2015). Variations in policy designs include
                service checks (France, Belgium, Germany, and Austria), cuts to social security premiums
                (The Netherlands, Germany), and tax deductions for labor costs (Sweden, Denmark, and
                Finland). But despite the ubiquity of these policies, few studies have assessed the degree to
                which disadvantaged groups are actually employed in the subsidized sector. The available
                evidence also suggests some cause for concern. Raz-Yurovich and Marx (2018) document a
                national-level increase in the employment rate for women with low education that coincides
                with the reform, but also note a growing inflow to the subsidized sector of workers from
                Eastern Europe, and reduced inflows from domestic unemployment.
                     This paper evaluates Sweden’s reform to subsidize domestic services. As in other countries
                with similar policies, policymakers expected this reform to expand the employment opportu-
                nities for workers with low qualifications. I use detailed employer-employee data to evaluate
                whether employment opportunities expanded for three groups of workers targeted by Swedish
                policymakers: 1) refugee immigrants, 2) people with a low level of education, and 3) the
                long-term unemployed.
                     My analysis relies on population-wide employer-employee data in 2010—2015. Compa-
                nies claim the tax deduction from the Swedish Tax Authority, which gives a complete record of
                these firms. I then use individual- and business tax records to identify any person who receives
                wages or business income from these firms, as well as all other private firms in each calendar
                year. Administrative records provides high-quality data for the socio-demographic traits of
                these persons, and the panel dimension of this data lets me identify the entry to a firm from
                long-term unemployment.
                     I use the straightforward empirical method of comparing the shares of the disadvantaged
                groups in subsidized firms and other firms. The first comparison is with all firms in the private
                sector. If the subsidization policy was successful at expanding the employment opportunities
                for the disadvantaged groups, subsidized firms should have higher shares than the full private
                sector. A second comparison considers two industrial sectors: the commercial cleaning sector
                and the restaurant sector. These sectors provide the largest number of elementary jobs in the
                Swedish labor market. This makes them a useful benchmark to analyze if the subsidized sec-
                tor employs more or less of the disadvantaged groups compared to Sweden’s pre-existing large
                sectors of elementary jobs.
Page 3 of 37                                                                                          Rickne. IZA Journal of Labor Policy (2021) 11:1

                      Overall, the results show that subsidized firms have low shares of people from the disad-
                vantaged groups, both among their wage-earners and business owners. The share of refugees
                and long-term unemployed is barely higher in the subsidized firms than in the full private
                sector. The disadvantaged groups are also small in an absolute sense. Refugees make up 6%
                of the employed, and 1% are non-European women refugee with low education, a group
                heavily featured in the policy debate. And while subsidized firms are more likely than the
                average private firm to employ people with a low level of education, they are still less likely
                to do so than firms in the commercial cleaning and restaurant sectors. Taken together, these
                findings show an employment structure in subsidized firms that is barely more favorable to
                disadvantaged groups than that of the full private sector. It is also substantially less favor-
                able to these groups than the employment structure in other sectors with a predominance of
                elementary jobs.
                      The analysis suggests a possible explanation for the low shares of disadvantaged
                workers. I find that EU immigrants account for 35–45% of the workers in subsidized firms,
                nearly five times their share in the overall Swedish working-age population. I extend this analy-
                sis to discuss two mechanisms whereby the dominance of EU immigrants may have directly
                affected the employment opportunities of disadvantaged workers. I document a high level of
                co-ethnic recruitment: firms operated by EU immigrants tend to employ 80% EU immigrants,
                while employing smaller shares of refugees and low-educated workers than other subsidized
                firms. Firms managed by EU immigrants are also concentrated in Sweden’s largest cities. EU
                immigrants manage nearly half of the subsidized firms in the country’s three largest cities,
                where refugee immigrants are also more likely to live.
                      I conclude that the Swedish policy largely failed to produce expanded employment oppor-
                tunities for the three targeted groups. Policy makers may need to look elsewhere, or at least be
                mindful of the potential pitfalls. As in other countries with similar policies, the Swedish policy
                does not regulate who is employed to carry out the subsidized services in people’s households.a
                This situation creates the opportunity for an inflow of EU immigrants to the subsidized sector,
                which seems closely linked to the policy’s failure to favor the disadvantaged groups. If a coun-
                try is part of a larger administrative area with the free movement of labor, such as Sweden’s
                membership in the European Economic Area (EEA), workers and entrepreneurs can cross bor-
                ders to take advantage of the labor demand created by policies in other countries. Co-ethnic
                hiring in these firms may then directly crowd out the employment opportunities of incumbent
                immigrant groups, a problem that seems acute for refugee immigrants. These results make a
                broader academic point about refugee integration: competition for elementary jobs between
                refugees and EU immigrants in specific industries may help explain refugees’ weak outcomes
                in Western European labor markets (e.g. Åslund et al. 2017, Fasani et al. 2018; reviewed by Brell
                et al. 2020).
                      A second conclusion relates to the policy’s broader impacts on inequality. In Section 5,
                I describe the socioeconomic profile of the consumers of subsidized domestic services using
                administrative data. Consumers have higher-than-average incomes and education levels, a pat-
                tern also observed in other countries (Flipo et al. 2007, Marx and Vandelannoote 2015). These
                well-off households can also increase their earnings when the outsourced domestic services

                a   Such restrictions are common for payroll tax cuts, for example by restricting the target population by age (see, e.g.,
                    Huttunen et al. 2013).
Page 4 of 37                                                                                             Rickne. IZA Journal of Labor Policy (2021) 11:1

                free up their time for paid labor (Halldén and Stenberg 2014, Raz-Yurovich and Marx 2019).
                Positive impacts on the employment opportunities of disadvantaged workers could have coun-
                terbalanced the positive income effect on already well-off households. But because those results
                have largely failed to materialize, I conclude that the policy likely expanded inequality.

                2 The policy
                In 2007, a center-right Swedish government introduced a tax deduction for domestic services
                (RUT-avdrag). The policy entitles buyers to a 50% tax deduction on the labor cost when they
                buy a domestic service covered by the policy.b The tax deduction applies to the wage and social
                contributions for the service worker, as well as the company’s profits and Value-Added Tax
                (VAT), but not to costs for materials, equipment, or commuting. The policy quickly became
                near-synonymous with household cleaning services, which accounted for more than 90% of the
                total subsidies in 2010 and 83% in 2016 (Swedish Tax Agency 2011, skatteverket.se). Gardening
                became the second most popular service. While other services like laundry and cooking were
                eligible for tax deductions under the policy, few households claimed them for these services.c
                      Like in other countries with similar policies, the Swedish reform aimed to create jobs for
                people with short education and in long-term unemployment (Prop. 2006/07:94). It also sought
                to regularize the informal sector and to expand the labor supply of professional women. Refu-
                gee immigrants were not specified in the original legislative text but were, from the start, part
                of the narrative about expected beneficiaries (Kvist and Petersson 2010, Gavanas and Mattsson
                2011). This group also played an increasingly central role in the policy debate over the subse-
                quent years (Peterson 2011:205, Nyberg 2015). Refugee immigration stood at a relatively high
                rate in Sweden throughout the 2010s, and refugees’ pace of entry into the paid labor force was
                relatively slow. This observation generated a vivid debate about the need for more “elementary
                jobs”. A lack of low-wage, elementary jobs was said to be a key barrier to refugees’ economic
                integration. The tax deduction for household services became a poster child for the growing
                policy push to tax-subsidize the creation of new “elementary jobs” that would fit refugees’ (per-
                ceived) skill profile.d Expanding the RUT-avdrag became a centerpiece of the center-right coali-
                tion’s agenda for refugee integration, and politicians and pundits commonly referred to the
                policy as an “engine of labor market integration” for refugee immigrants.e Within the group of

                b   Total annual deductions per person were capped at 50,000 SEK (5,300 euros), which applied jointly to the RUT-avdrag
                    and another tax deduction for heavier renovation work.
                c   The exact services included in 2007 were household cleaning, laundering clothes and other home textiles, cooking,
                    snow removal, hedge and lawn cutting, weeding, and child care. Tutoring was added in 2013 and removed in 2015,
                    and cooking services were removed in 2016. More recently (after the study period of this paper), repair of household
                    appliances, IT services and moving services were also included in the scheme.
                d   This debate generally defined an “elementary job” as occupations requiring only a primary level of education,
                    corresponding to group 9 in the first-digit occupation code (in the Swedish SSYK codification as well as in the ISCO-08
                    codification). Cleaning services is the largest elementary job on the Swedish labor market.
                e   Examples include the Center Party’s 2019 budget proposal explaining how the subsidy creates employment and business
                    opportunities for refugee immigrants who otherwise have a hard time “getting a foot in the door” in the Swedish
                    labor market (https://www.riksdagen.se/sv/dokument-lagar/dokument/motion/centerpartiets-budgetmotion-2019_
                    H6022610/html); op-eds by the Conservative Party arguing that an “increased tax subsidy for domestic services improves
                    the labor market integration” https://www.na.se/artikel/moderaterna-hojt-rutavdrag-underlattar-integrationen (July
                    15, 2019); and policy statements from the Swedish Enterprise Board (https://www.svensktnaringsliv.se/fragor/enkla-
                    jobb/). In more recent policy developments, an expansion of the RUT-avdrag played a prominent role in the grand
                    bargaining between Swedish political parties to address the 2015 refugee crisis (Migrationsöverenskommelsen). After
                    the 2018 election, coalition bargaining resulted in an agreement to raise the cap and extend the list of services included
                    in the scheme, once again motivated by a desire to improve refugee immigrants’ labor market integration.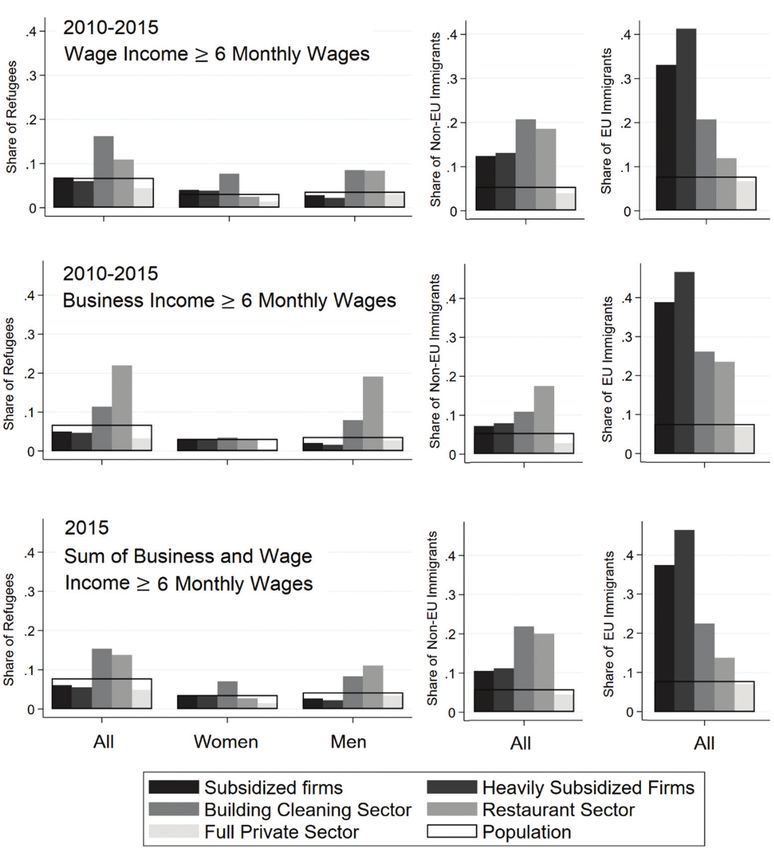
Page 5 of 37                                                                                         Rickne. IZA Journal of Labor Policy (2021) 11:1

                refugees, the emphasis lay on improved employment chances for women refugees from outside
                of Europe and with low education levels.
                      All taxpayers aged 18 or over are eligible for the tax deduction as long as the amount of
                income taxes they paid exceed the deductions claimed during the calendar year. In the original
                version of the policy, the consumer would buy the service from a company, save the receipt,
                and claim the deduction as part of their annual tax returns. A regulatory change in July 2009
                significantly reduced this administrative burden by shifting the filing responsibility from the
                consumer to the company. After selling the service, the firm now reports the number of service
                hours, labor costs, and the consumer’s personal ID code to the Tax Agency. All firms that are
                registered to pay corporate taxes, including small home-service companies and people who
                are self-employed, are eligible to report in this way.f Notably, the Swedish scheme does not
                regulate who the firm hires to perform the household services, the wages of these workers, or
                what type of labor contract they have. Unlike some countries that have implemented service
                vouchers, Sweden does not regulate the price of the services on the market.

                3 Expected employment opportunities of disadvantaged groups
                European policies to revive domestic service sectors have shared the goal of providing jobs for
                disadvantaged groups (Carbonnier and Morel, 2015). As with other labor market policy, these
                goals are national rather than international. Countries envision employment benefits for their
                national, domestic labor market, rather than employment creation for disadvantaged groups
                outside of the country’s borders.
                      Domestic services like cleaning or laundry are quintessential elementary occupation. In
                Figures 1 and 2, I use data from the O*NET database for occupational traits to document
                the low requirements on formal education and language skills of such jobs.g In Figure 1, the
                black squares denote the demands for language skills for “Maids and Housekeeping Cleaners”
                relative to all other jobs in the database (N=965). As seen from the placement of these dots, the
                demands are clearly lower than for the average job. Figure 2 uses the same comparison to show
                the low demands on formal education. Domestic service jobs also require low levels of previous
                labor market experience, and the capital requirements for starting a business are smaller than
                in most other sectors.
                      Given the skill profile of domestic service jobs, it is straightforward to assume that this
                sector offers relatively more employment opportunities for the disadvantaged groups identified
                by Swedish policymakers as expected policy beneficiaries. Low-educated people are likely to
                hold these jobs since they require less formal education. Similarly, refugee immigrants have
                both lower-than-average education levels and weaker qualifications in terms of language skills
                and work experience in the domestic labor market. People in long-term unemployment also
                have less work experience because of their time out of the workforce, and all three groups could
                be assumed to benefit from the relatively low capital requirements for starting a small business
                in the sector.

                f   For direct employment in a household, which is highly unusual in Sweden, the tax deduction is just 15% of the cost of
                    wages and social contributions.
                g   The O*NET database is sponsored by the U.S. Department of Labor, Employment & Training Administration and
                    updated annually based on data collected by the non-profit organization RTI International. It contains data on skill
                    requirements across occupations, which is based on assessments by experts and employee surveys.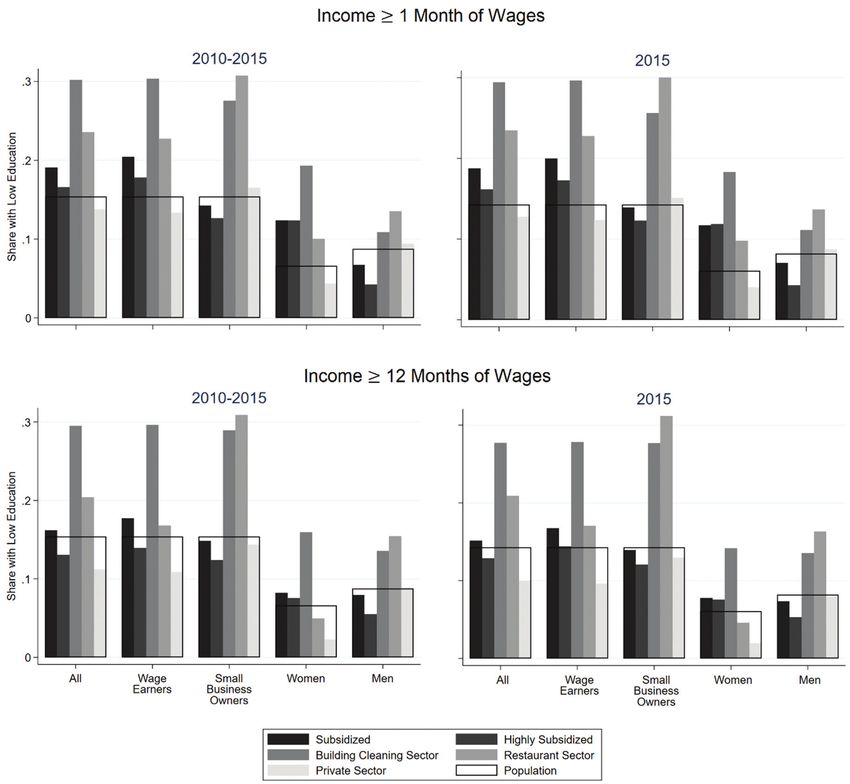
Page 6 of 37                                                                         Rickne. IZA Journal of Labor Policy (2021) 11:1

                Figure 1 Expert judgments for skills needed among maids and housekeeping cleaners
                           (black squares) relative to all jobs (box plots).

                Notes: The figure compares the skill requirements for maids and household cleaners
                (marked as black squares) to the distribution of skill requirements for other jobs in data
                from the O*NET database. The gray boxes represent 50% of the values of each variable,
                from the first to the third quartiles, and the horizontal line in the box shows the median.
                The whiskers mark the mini and maxi of the variable, and outliers are marked with
                black dots.

                Figure 2 Distribution of educational requirements for maids and housekeeping cleaners
                           compared to all other jobs in the U.S. labor market.

                Note: The figure shows the distribution of educational requirements as reported in the
                O*NET database (www.onet.com).

                     There are also several factors that make it less likely that disadvantaged groups will benefit
                from the RUT-avdrag policy. One is the hands-off approach regarding who is employed in the
                subsidized jobs. The Swedish reform allows companies to hire freely for the service jobs. Unlike
                policies that provide subsidized employment for specific socio-economic groups, this policy
                design allows employers and customers to make discriminatory decisions on who they employ
                (Becker 1971, Bohnet 2016). In Sweden, households frequently request that service providers
                send workers with a Caucasian appearance to clean their homes (Kvist 2013, authors’ inter-
                views with domestic service providers).
                     A second factor is immigration. In a sector that requires relatively low language skills and
                labor market experience, immigrants from other European countries may be better positioned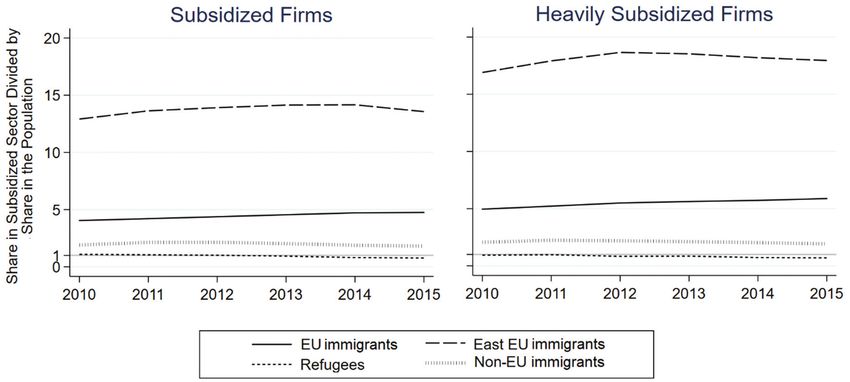
Page 7 of 37                                                                                      Rickne. IZA Journal of Labor Policy (2021) 11:1

                to exploit these opportunities than the intended beneficiaries on the domestic labor market.
                In the domestic cleaning sector, EU immigrants benefit from an infrastructure of community
                or language-based recruitment networks with bilingual brokers (Kvist 2013, Gavanas 2013,
                Kommunalarbetaren 2019). These networks help people immigrate and offer an alternative to
                formal labor market institutions (following the broader discussion in Gavanas 2013).
                      Network-based hiring across borders may be easier in the domestic service sector than in
                some other sectors. The sector is dominated by small firms and self-employment, which makes
                it easier for immigrants to establish firms and make their own hiring decisions. In turn, this
                opens for co-ethnic hiring that advantages EU immigrants who share ethnicities with firm
                managers (so-called recruitment homophily). Co-ethnics may benefit in the recruitment pro-
                cess because of advantages in communication, information, and a shared culture that estab-
                lishes a mutual trust (e.g., McPherson et al. 2001, Edo et al. 2019). Indeed, qualitative research
                on the Swedish domestic cleaning sector has documented strong patterns of co-ethnic hiring
                (Gavanas and Mattsson 2011, Gavanas 2013).
                      Preferences to enter the domestic service sector may also differ between EU immigrants,
                refugee immigrants, and low-educated or un-employed natives. The domestic service sector
                has low wages, but also poor work conditions. Researchers have observed how a high degree
                of competition and low unionization push work conditions downward, especially in small
                firms (Calleman 2011, Thörnquist 2015). Employment is often fluid, unstable, and with one
                person holding several part-time jobs simultaneously and interspersed with intervals of unem-
                ployment (Calleman 2011, 2015, Thörnqvist 2015). For EU immigrants, these jobs may still
                be attractive because of wage differences between countries. This attractiveness is absent for
                workers on the domestic labor market, who may also have access to social insurances or gov-
                ernment training programs. Specific groups of expected beneficiaries might also find the work
                conditions in the domestic service sector particularly unattractive. For example, domestic
                workers are often alone in a customer’s household which may conflict with religious and social
                norms among refugee women with a Muslim background.h
                      Finally, the dominance of self-employment in the domestic service sector may directly
                disadvantage some groups of workers. Even if capital requirements for starting a business in
                the sector are relatively small, it requires some level of education interpret the tax law and orga-
                nize invoices and periodic tax reporting. This could put people with short education at a rela-
                tive disadvantage. Language skills also help navigate the formality of starting up and operating
                the firm, which could raise barriers toward refugee immigrants.
                      Before continuing to the data section, it is worth emphasizing that this paper is interested
                in the composition of employment in the subsidized sector rather than the number of jobs cre-
                ated. Economists have argued that subsidies directed at the domestic service sector should be
                more likely to create jobs than subsidies to other sectors (Kleven et al. 2000, Flipo et al. 2007).
                As I show below, there are strong indications that the Swedish policy led to a meaningful num-
                ber of new firms and jobs. It caused a large drop in the price of household cleaning services,
                and a significant number of households started buying these services rather than cleaning their
                own homes. In addition, many of the subsidized firms that operated in 2010–2015 did not exist

                h   Notably, this group already faces significant barriers to entering the labor market, such as weaker networks and
                    traditional gender norms that disincentivize employment (Akerlof and Kranton 2000, Grönkvist and Niknami 2012,
                    Brell et al. 2020).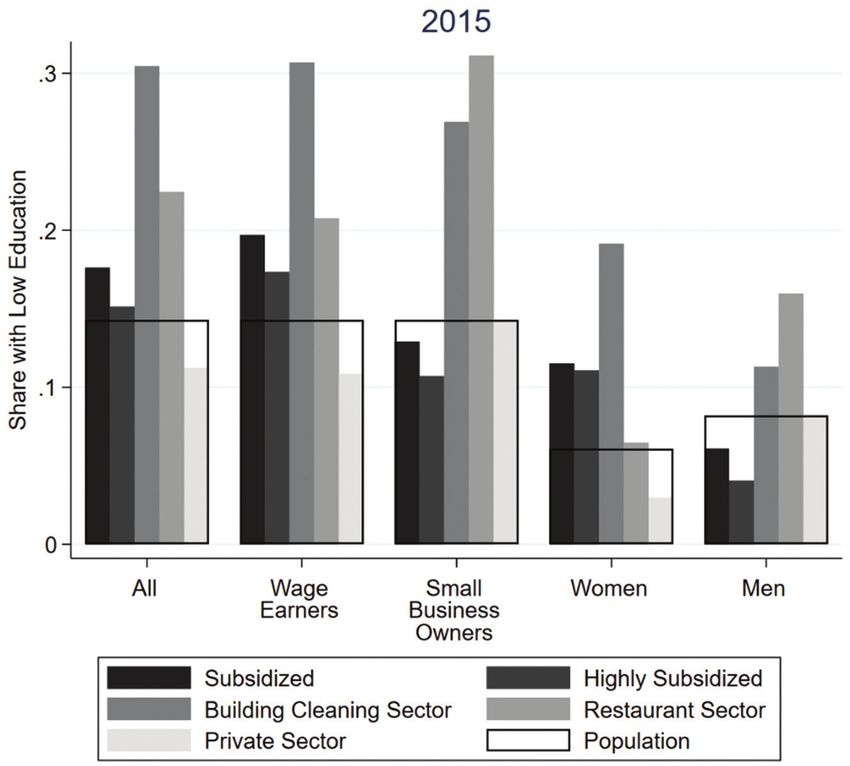
Page 8 of 37                                                                                           Rickne. IZA Journal of Labor Policy (2021) 11:1

                prior to the reform. A detailed analysis of the number of new jobs, or of the average cost of
                those jobs to taxpayers is, however, beyond the scope of this paper.i

                4 Data and methods
                Defining the subsidized sector. Since July 2009, Swedish companies have been able to claim
                the tax deduction by submitting information to the Swedish Tax Authority. Statistics Sweden
                aggregates these data to the firm-year level, which gives me a complete list of the organiza-
                tional ID codes for all firms that received some nonzero deduction in each year, as well the
                total amount of annual deductions. The first full calendar year for which this information is
                available is 2010, and my dataset ends in 2015. There are 96,968 firm-year observations during
                this period.
                      I define the subsidized sector as firms for which total tax deductions in a year comprise a
                relatively large share of their total sales of goods and services.j To measure sales, I use the vari-
                able Net Sales, which captures the firm’s total annual sales minus rebates and VAT. Statistics
                Sweden cleans the data used to calculate this variable before making it available for research,
                but faulty reporting by firms still results in some missing or erroneous values, especially for
                small companies (authors’ conversations with Statistics Sweden). Net Sales data are available
                for 86% of my sample (83,431 of 96,968). For the remaining firms, I use the annual sum of
                wages and business income as an alternative variable for total sales (I describe the source of
                these income data below). After adding this second measurement, only 8,540 firm-year obser-
                vations remain with missing data, and they account for only 1.3% of the total tax deductions
                in 2010–2015.
                      I use thresholds of the ratio of tax deductions to total sales to define two groups of subsi-
                dized firms. I define a firm as subsidized if the tax deduction was applied to at least 20% of its
                total yearly output, and highly subsidized if it was applied to more than 50%.k Methodological
                details for this calculation are available in Section W1 of the Web Appendix. Since this clas-
                sification is performed at the firm-year level, it is possible (but unlikely) for a firm to belong to
                different groups in different years.
                      The group of firms that I classify as subsidized account for 80% of the total amount of tax
                deductions in 2010–2015. Highly subsidized firms, which are a subset of the previous group,
                account for 61%. We should think of these firms as specializing in domestic services, most
                commonly household cleaning. Firms that receive non-zero subsidies but which I do not define
                as subsidized are mostly selling other services (or goods), such as a construction company that
                sometimes cleans apartments or households. The average share of economic activity in the
                firms covered by the tax deductions is low, at 4.6%.
                Comparison sectors. I compare the employment composition in the subsidized sector to three
                other groups of firms: all private firms, the commercial cleaning industry, and the restaurant
                industry. Private ownership is defined by a firm’s Ownership Code, an administrative variable
                based on tax records. The restaurant and commercial cleaning industries are defined by their

                i   For discussions of the issue of jobs in Swedish-language reports, see Tillväxtanalys (2019), and Riksrevisionen (2020).
                j   Since subsidized firms register under a variety of industry codes, this variable cannot be used to define the sector.
                k   This method draws on previous policy evaluations by the Swedish Tax Authority (Skatteverket 2011) and the Danish
                    Ministry of Industry, Business, and Financial Affairs (Erhvervsministeriet 2001).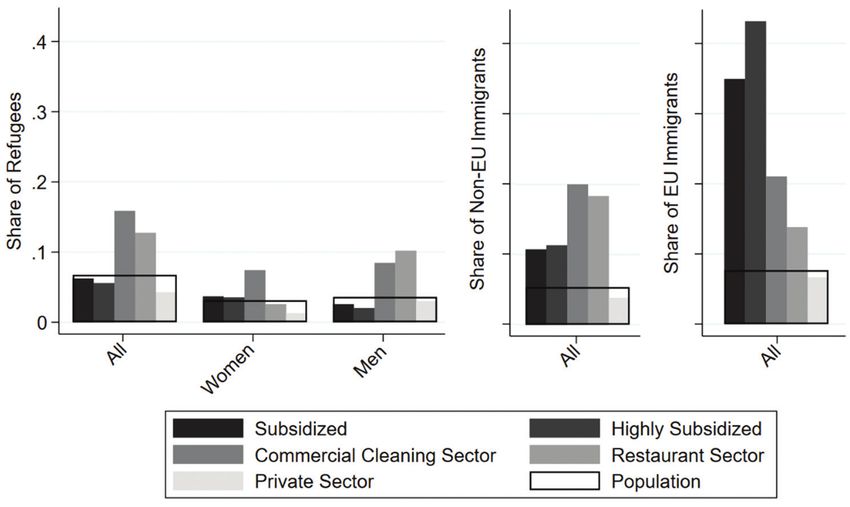
Page 9 of 37                                                                                           Rickne. IZA Journal of Labor Policy (2021) 11:1

                5-digit industry codes.l About half of the firms in the subsidized sector have commercial clean-
                ing as their industry code. I keep these firms in the category of subsidized firms. This means
                that the commercial cleaning sector is defined as all firms that have the industry code for com-
                mercial cleaning, minus the firms that belong to the subsidized sector.
                      To answer the paper’s research question, I use the straightforward method of compar-
                ing the presence of disadvantaged groups among people who receive either wage income or
                business income from the subsidized sector and the comparison sectors. If the presence of the
                groups is similar in the subsidized sector as full private sector, the policy has clearly failed to
                favor these groups on the labor market. As the commercial cleaning and restaurant sectors pro-
                vide the most elementary jobs in the Swedish labor market,m their employment composition
                is another useful benchmark for the performance of subsidized firms. If the subsidized sector
                has the same probability of employing disadvantaged groups as these industries, the policy has
                created an equally favorable employment structure for these groups as a typical sector with a
                predominance of elementary jobs in the Swedish labor market. If the subsidized sector outper-
                forms these sectors, perhaps by having even lower demands for formal education, training or
                language skills, this would be a particularly positive finding for the policy.
                Defining employment by income threshold. I define employment in a sector as having a
                total amount of annual wages and business income from that sector that exceeds a threshold
                amount. Income data come from the Job Register (Jobbregistret), which is based on tax records
                and lists all payments of wages and business income that exceed 99 SEK in a calendar year
                (~11 USD). I use the organizational ID code for the source of each payment to match it to the
                subsidized sector and the comparison sectors. This way of measuring employment offers a
                significant advantage when studying the domestic service sector. Work in this sector is often
                characterized by the same worker holding several small jobs, either simultaneously of in
                sequence, and some people being both self-employed and wage-earners at another firm. Under
                these circumstances, summing up incomes from all subsidized firms over each year gives a
                more accurate description of who is employed in the sector than counting only the largest
                income source in a year or measuring where a person works at one specific point in time.
                      My income data include all people with a Swedish ID code as well as all temporary work-
                ers with temporary ID codes (samordningsnummer). These codes are used for people who work
                in Sweden temporarily as posted workers, await their permanent ID code, or have pending
                asylum claims.
                      In the main analysis, I define employment as having a total annual income of at least 6
                monthly wages for the median cleaner in the private sector.n I use two other cutoffs, a lower one
                at 1 monthly wage and a higher one at 12 monthly wages, throughout the paper as a sensitivity

                l 8129 (General cleaning of buildings) and 56100 (Restaurants and mobile food service activities) in the Swedish system
                  of industry codes, which corresponds to the Nomenclature of Economic Activities (NACE), Revision 2.
                m Calculated by the author, using the definition of elementary jobs in endnote d for the 2010–2015 period. Table W2 in
                  the Web Appendix shows the distribution of 1-digit occupation codes in each sector. Because these codes are collected
                  in a survey that samples all large firms, most medium-size firms, but only a small proportion of small firms (2% of
                  firms with 1—9 employees), they should be interpreted with caution given the prevalence of small firms in the domestic
                  service sector.
                n Swedish occupation codes closely approximate the ISCO08 code 911 for “Domestic hotel and office cleaners and helpers”.
                  Wage data come from the Swedish Salary Statistics and cover all large private firms and a stratified random sample of
                  small and medium-sized firms. I compute the median wage for full-time workers in cleaning jobs in the private sector
                  in each year, and multiply this sum by 6 to get the threshold value. The median monthly wage for a cleaner in the private
                  sector was 19,536 SEK in 2010 and 22,869 in 2015.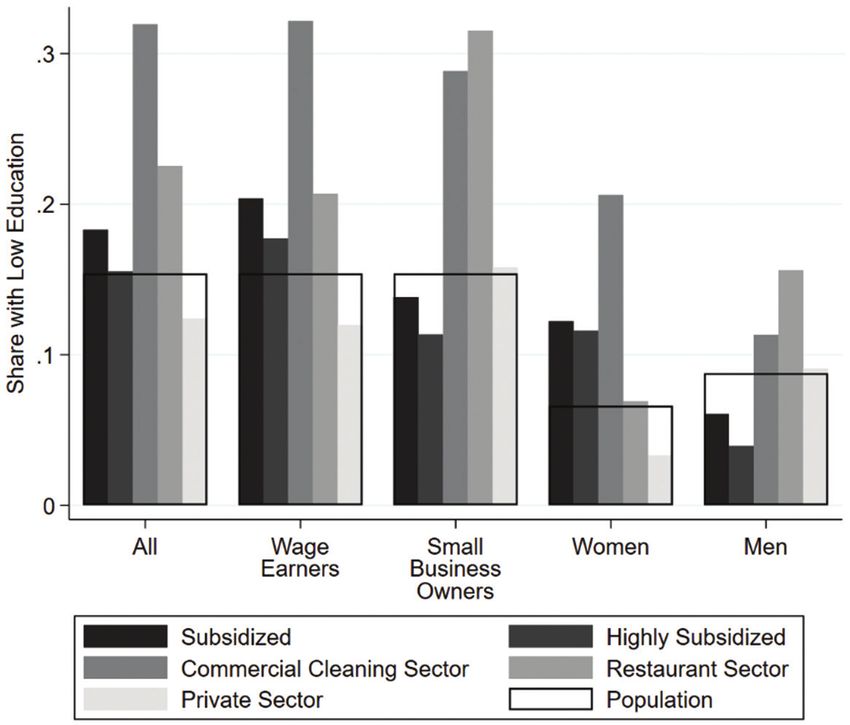
Page 10 of 37                                                                                Rickne. IZA Journal of Labor Policy (2021) 11:1

                 check. Because wage and business income have separate entries in the Job Register, I can also
                 define people as either wage earners or small business owners based on their total annual
                 income from either of these sources. Throughout the paper, I use “employment” to refer to
                 people whose combined total income from wages and business income exceeds the threshold.
                      My data are not precise enough to determine which individual workers in subsidized firms
                 carry out the subsidized services. Most of the firms are small and not sampled in Statistics
                 Sweden’s surveys on occupations. I sidestep this data problem by studying the composition of
                 all employment in the subsidized firms, conditional on being above the income threshold. One
                 potential drawback of this approach could be that the income threshold excludes precisely the
                 employment from disadvantaged groups that I am interested in. However, this does not appear
                 to be the case, since the descriptive results are robust to including people with very low annual
                 incomes (the 1 monthly wage threshold). Another potential critique is that I include employees
                 who hold higher-level jobs within the subsidized firms. Yet I argue that including these people
                 is appropriate, because the tax subsidy also contributes to employment more broadly within
                 firms, such as marketing jobs or low-level coordination jobs for domestic service workers in
                 the field.
                      A third critique concerns missing information on informal employment. This type of
                 employment is less common in Sweden than in most other countries, but is likely more preva-
                 lent in the domestic service sector than in other sectors. Research has shown that informal
                 work in domestic services is most common among undocumented immigrants (Swedish Tax
                 Authority 2011, Gavanas 2013, Hobson et al. 2018). Needless to say, these immigrants are a
                 severely marginalized group in the labor market. But they are not targeted by Swedish policy
                 makers as expected beneficiaries of policy to revive domestic services. As such, the exclusion
                 of informal work in my data means that I will likely over-estimate, rather than under-estimate,
                 the policy’s impacts on the employment opportunities of the targeted disadvantaged groups.
                 Disadvantaged groups: education, immigration, and labor market status. Socio-
                 demographic variables for sex at birth, region of birth, year of birth, education level, and latest
                 year of immigration come from the Longitudinal Integrated Database for Health Insurance and
                 Labour Market Studies (LISA, according to its Swedish acronym). Immigrants’ education level
                 is recorded as part of the immigration process, and Statistics Sweden also carries out regular
                 surveys to supplement missing data for this group. Among people with temporary ID codes,
                 approximately 30% have socioeconomic data on geographic region of citizenship, age, and sex
                 at birth. The main analysis considers each of the three groups separately. I also sub-divide the
                 analysis by sex at birth, and report results for some smaller groups of high policy relevance.
                 Refugees are identified from data on residence permits in the Longitudinal Database for Inte-
                 gration Studies (STATIV, according to its Swedish acronym). I count people as refugees if they
                 have held a residence permit with refugee status at any point since their arrival in Sweden.
                 Following standard practice, I count six types of residence permits as “refugee status”: refugees
                 according to the Geneva convention, quota refugees, humanitarian refugees, refugees accord-
                 ing to temporary legal frameworks, other refugee permits, and family reunification immigrants
                 to persons with refugee status.o The earliest year for which residence permit data are available
                 is 1985. Refugees whose permits were granted so long ago that they had expired by then, for

                 o   In Swedish: Konventionsflyktingar; Skyddsbehövande; Synnerligen ömmande omständigheter; Tillstånd enligt
                     tillfällig lag; Övriga tillstånd, flyktingar m.fl.; Flyktinganhöriga.
Page 11 of 37 Rickne. IZA Journal of Labor Policy (2021) 11:1
example by gaining Swedish citizenship, are (erroneously) not included in my definition.
EU and non-EU immigrants are defined based on being born either inside or outside EU28
countries. Notably, being defined as a refugee overrides these two categories. Of people born
outside of Sweden in another EU28 country, 18% are defined as refugees; and of people born
outside of EU28, 47% are defined as refugees.
Low education is defined as all people who have not completed upper secondary education,
following the international standard (OECD 2019).
Long-term unemployment, unemployment, and non-employment are measured using
data on income sources in each year (following work by Andersson and Brännström 2009).
A person is defined as unemployed if their largest source of income is from unemployment ben-
efits and/or active labor market programs. A little over 3% of the sample falls into this category,
a figure that is biased downward because people may be actively looking for work despite not
receiving benefits or participating in a program. Non-employment is defined as meeting one
of two conditions: 1) having a total labor income less than 1 monthly wage for a cleaner in the
private sector or 2) having a combined total income from sickness insurance, disability pen-
sion, worker injury insurance, rehabilitation insurance, and basic income support that makes
up the person’s largest source of income in that year. Long-term unemployment is defined as
being unemployed in the current year and either unemployed or non-employed in the previous
year. People currently enrolled in higher education and 18 year olds with zero labor income are
dropped from all three variables.
5 Descriptive statistics for firms, workers, and consumers
This section reports basic descriptive statistics for the number of firms, wage earners, and
small business owners in the subsidized firms and comparison sectors. I also report basic
descriptive statistics for the policy’s expansion over time, including the number of consum-
ers of subsidized services and the total deduction amount paid by the government. A natural
starting point for understanding these developments is the dramatic price drop for domestic
services that occurred immediately after the policy was introduced in 2007. The price of house-
hold cleaning services fell by nearly the size of the entire tax deduction (50%) and remained
at this lower level in the following years (see Web Appendix Figure W1). This indicates that
the policy had a maximal impact on service demand, which would not have been the case if
companies had instead pocketed part of the subsidy as profits and kept consumer prices at a
higher level. Figure 3 shows time trends in the total yearly deduction amount, the annual num-
ber of consumers who used the deduction, and the number of subsidized firms. In 2015, the
total amount reached 4.8 billion SEK (0.6 billion USD) and the number of people who
used the policy was 649,720 persons (8.3% of the eligible population). The number of firms
with non-zero subsidies was 17,000 and among these, 7,917 were specialized and 5,263
highly specialized in producing the subsidized services. Using additional variables from
the administrative business register, I observe that only 0.1% of the specialized firms are
foreign owned, compared to 2% of all private sector firms. Specialized firms are also less likely
to be stock corporations (17% vs. 32%) or limited liability partnerships (17% vs. 32%), and are
more likely to be sole proprietorships (75% vs. 62%).Page 12 of 37 Rickne. IZA Journal of Labor Policy (2021) 11:1
Figure 3 Total annual tax-deductions, number of consumers, and number of subsidized
firms.
Notes: The figure shows time trends in the total tax-deductions (left), the number of con-
sumers with non-zero deductions (center) and the number of firms in three categories of
specialization (as defined in Section 4).
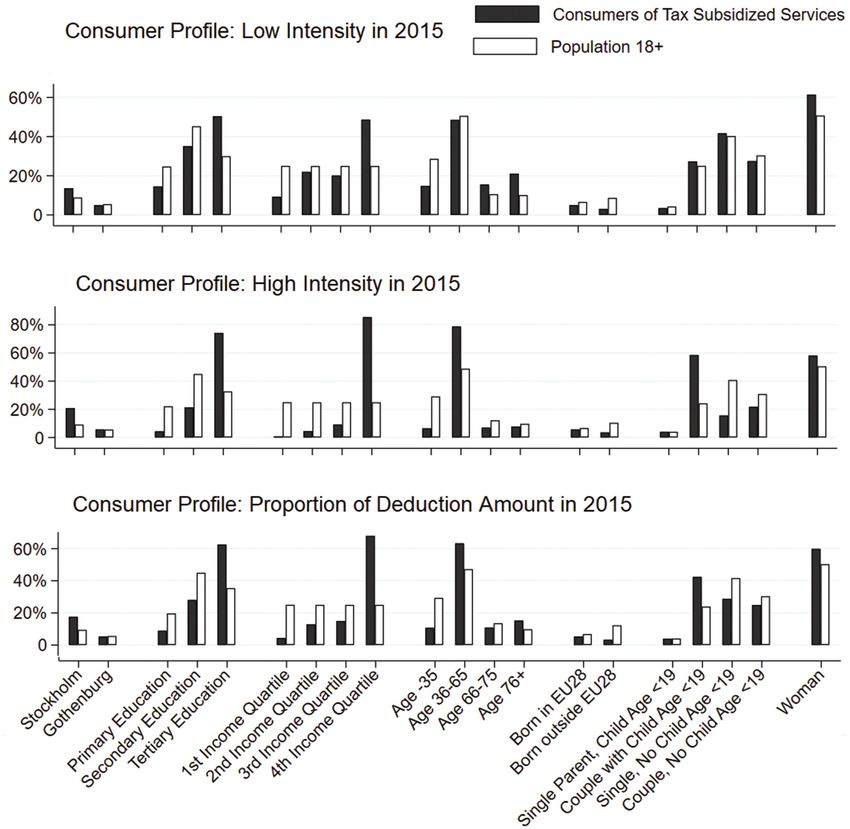
Web Appendix Figures W2 and W3 show the socio-demographic profiles of the con-
sumers of subsidized services. People with high incomes, high education, and couples with
children under 18 in the household are over-represented in this group compared to the Swedish
population. In 2015, almost two-thirds of all deductions went to households in the top quartile
of the income distribution. This skew toward richer households is even more prevalent among
high-intensity consumers, who I define as people who purchase at least one hour of domestic
cleaning services per week (6% of all consumers in 2015).
Number of employed. Figure 4 shows time trends for employment numbers in the sub-
sidized sector compared to the commercial cleaning and restaurant sectors. Trends
are shown separately for the three threshold values for employment in terms of annual
income from the sector (at least 1 monthly wage, 6 monthly wages, or 12 monthly wages for
a full-time cleaning job).
Employment in the subsidized sector grew consistently over the 2010–2015 period.
In 2015, the subsidized firms together employed 11,967 and the highly subsidized firms
employed 7,128 people according to my main definition. Splitting these groups according to
whether people have income from wages or business income shows a relatively high rate of
self-employment in the subsidized sector compared to the comparison sectors (Figures W4
and W5 in the Web Appendix). In subsidized and highly subsidized firms, 29% and 32% of
employees are self-employed, respectively, compared to 18% in the restaurant sector and 9%
in the commercial cleaning sector.
Figure 4 also contains an interesting observation about the income structure of subsidized
firms. Relative to the two comparison sectors, a larger proportion of employees and small busi-
ness owners have low yearly incomes. Section W2 in the Web Appendix explores this issue fur-
ther and briefly discusses job quality by computing rates of in-work poverty, defined as having a
total disposable income below 60% of the population median. The rate of in-work poverty in the
subsidized sector is higher than in the commercial cleaning and restaurant industries, and much
higher than in the full private sector.
Subsidized firms have a small proportion of temporary foreign workers, which means that
missing demographic data will not be an important source of measurement error in the analy-
sis. Of people with at least 6 months of wages, fewer than 1% are temporary foreign workers,Page 13 of 37 Rickne. IZA Journal of Labor Policy (2021) 11:1
Figure 4 Employment numbers.
Notes: The figure shows annual counts of people whose annual labor earnings from a
specific sector surpass three thresholds for total yearly labor earnings. Subsidized and
highly subsidized firms are defined in Section 4. All income data are from Swedish tax
records and cover all sources of annual earnings above 11 USD.
which is similar to the proportions in the commercial cleaning and restaurant sectors (1.4%
and 0.7%, respectively). This low number might partially reflect that posted workers are very
uncommon in the cleaning industry (Thörnquist 2015). It might also reflect the small cost, but
large benefits, of registering as a permanent citizen in Sweden. The process is quite simple for
people who have the right to work in the country, for example migrants from EEA countries
and their relatives. Having an ID code may be worthwhile even for shorter periods of work
since it facilitates access to medical care and financial services.
New jobs and firms? As previously described, this paper does not distinguish between new
employment created by the tax deduction and formal or informal jobs that existed before the
reform. Nevertheless, various statistics strongly indicate that a substantial share of the employ-
ment observed in the subsidized firms is mostly new jobs. In an anonymous survey of 5,000
users of the tax deduction in 2010, only 6% reported having previously purchased the services
on the informal market, while 65% had either done the chores themselves, not done them at all
(7%), or been helped by a relative (3%) (Swedish Tax Agency 2011). Based on interviews with
201 business owners in the domestic service sector, Kvist (2013) describes a rapidly expanding
market of consumers, firms and workers. In my data, the registration dates of the subsidized
firms show that many were created after the reform. Only one in three subsidized firms (32%)
and one in five highly subsidized firms (19%) exists in the 2006 business register, one year
before the policy was introduced.Page 14 of 37 Rickne. IZA Journal of Labor Policy (2021) 11:1
6 Disadvantaged groups in subsidized employment
Refugees and other immigrants. Refugee immigrants make up 7% of the Swedish working-
age population, and represent one of the most disadvantaged groups in the labor market.
One-fourth are non-employed (20%), 7% are unemployed, and 5% long-term unemployed.
All three shares exceed those of the full working-age population (11% non-employed,
3% unemployed, and 2% long-term unemployed). In contrast to refugees, the other two
immigrant groups—EU immigrants and non-EU immigrants—do not perform worse than
native-born on these measurements.p
The left side of Figure 5 compares the shares of refugees across sectors. The results
demonstrate that the subsidized sector has not stood out as a “motor of integration” for refugee
immigrants. The share of refugees in subsidized firms barely surpasses the share in the full pri-
vate sector, and it is only half as large as in the restaurant and commercial cleaning industries.
Despite offering jobs with low requirements for language skills and labor market experience,
subsidized firms have not been more likely to employ people with a refugee background than
the average private firm, and have been substantially less likely to do so than other sectors with
a predominance of elementary jobs. By comparing the shares in the sectors to the population
share (the large transparent box), it is striking that the subsidized sector barely employs the
same share of refugees that exists in the adult population, while the restaurant and commercial
cleaning sectors clearly outperform this number.
Non-EU immigrants have more positive employment prospects in the subsidized firms.
Their share of the employment of these firms is larger than in the private sector as a whole (10%
Figure 5 Shares of refugees, EU immigrants and non-EU immigrants across sectors.
Notes: The figure shows the shares of people with different immigration backgrounds
among people whose annual income from the sector exceeds 6 monthly wages for an aver-
age cleaner.
p EU immigrants have a 13% non-employment rate, a 4% unemployment rate, and a 2% long-term unemployment rate;
non-EU immigrants have a 12% non-employment rate, 5% unemployment rate, and a 3% long-term unemployment rate.Page 15 of 37 Rickne. IZA Journal of Labor Policy (2021) 11:1
vs. 4%) but lower compared to the two comparison industries where their proportion is close
to 20%.
I find the most striking results for EU immigrants. This group makes up more than
one-third of the employment in the subsidized firms, and nearly half of the employment in
highly subsidized firms. These high numbers correspond to more than five times the propor-
tion of EU immigrants’ employment in the private sector and about twice the proportion in
the two comparison industries. The commercial cleaning sector also has a higher share of EU
immigrants than refugee immigrants, but the gap is less dramatic. One possible interpretation
is that EU immigrants have not entered commercial cleaning to the same degree as domestic
cleaning because of its market structure with large incumbent firms and significantly more
unionization (Thörnqvist 2015). Section 7 extends the analysis of EU immigrants to discuss
how their dominance in the subsidized sector could be crowding out employment opportuni-
ties for disadvantaged groups.
Figure W6 in the Web Appendix replicates Figure 5 for the year 2015 and shows the results
separately for wage earners and small business owners. This description shows that the pro-
portion of EU immigrants is even higher among small business owners than employees in the
subsidized sector. They make up a third of all small business owners in the subsidized sector,
and nearly one half in the highly subsidized sector. In contrast, the share of refugee women is
smaller among business owners than among employees.
I calculate some additional descriptive statistics to comment on nonnative female entre-
preneurship in the subsidized sector compared to the private sector. One in four (39%) of the
owners of subsidized firms is a foreign-born woman, compared to three in one hundred (3.4%)
in the full private sector. This over-representation is especially notable for EU-immigrants.
Europe-born women without refugee status are 16 times more likely to operate a small business
in the subsidized sector than in the full private sector (32% compared to 2% of the business
owners). Refugee women are also more likely to operate businesses in the subsidized sector, but
by a smaller factor of 5 (3% vs. 0.6%). This means that while the subsidized sector clearly favors
entrepreneurship by nonnative women, this is first and foremost a phenomenon that benefits
female labor immigrants from the EU.
Figure W7 replicates Figure 5 for the lower and higher cutoff values for employment, at
least 1 monthly wage for a cleaning job, and at least 12 monthly wages. The conclusions from
Figure 5 are not sensitive to this variation in the employment definition. As such, they offer
some commentary on hierarchies in formal employment in the subsidized sector. Refugees or
EU immigrants are not over-represented among the lowest annual incomes from the sector,
echoing the observation in previous research that part-time employment and unstable employ-
ment is prevalent for both native and foreign workers (Abbasian and Hellgren 2012, Thörnqvist
2015).
Low education. In 2010–2015, people with a low level of education (defined as less than
upper-secondary education) made up about 15% of the Swedish working-age population.
Like in other Organization for Economic Co-operation and Development (OECD) countries,
they constitute a disadvantaged group in the labor market (OECD 2019). During the study
period their average non-employment rate was 27%, unemployment rate 5%, and long-term
unemployment rate 3%, compared to 11%, 3%, and 2%, respectively, in the full working-age
population.Page 16 of 37 Rickne. IZA Journal of Labor Policy (2021) 11:1
Figure 6 shows the shares of people with low education across sectors. Starting with total
employment, the subsidized sector employs a larger share of people from this group than the
private sector as a whole, but a smaller share than the two comparison industries. When we
break the sample down into wage earners and small business owners, we can see that the sub-
sidized sector is relatively successful at employing low-educated people as wage earners, but
less so for small business owners. For wage earners, subsidized firms employ a higher share
of low-educated people than the full private sector, a similar share as the restaurant indus-
try, and a smaller share than the commercial cleaning sector. For small business owners, the
share is lower than in all three comparison sectors. People with low education operate roughly
15% of small businesses in the subsidized sector, 10% of those in the highly subsidized sector,
but nearly 30% in the comparison sectors. This is remarkable given the relatively low capital
requirements for starting a business in the domestic service sector.
Why are low-educated people less common among the small businesses in the subsidized
sector? One reason might be that immigrants with secondary or tertiary education are pushed
into self-employment by difficulties in having their academic credentials recognized in the
labor market. Comparing the immigrant composition of the low-educated workers to those
with secondary or tertiary education gives some evidence of this. The small business owners
with low education are mostly native born (63%) while those with medium or higher education
levels are mostly foreign-born (51%). Splitting the sample by sex at birth shows that the revival
of the domestic service sector has provided employment primarily for women with low educa-
tion. Their share of the employed is nearly three times as large as in the full private sector, and
twice as large as in the restaurant industry. For men, the opposite is true: the subsidized sector
Figure 6 Share of employed with low education.
Notes: The figure shows the shares of people with a low level of education among those with
an annual income from the sector that exceeds 6 monthly wages for an average cleaner.Page 17 of 37 Rickne. IZA Journal of Labor Policy (2021) 11:1
employs just half the share of low-educated men compared to the private sector and the two
comparison industries.
The low-educated women deserve some additional commentary in terms of their immi-
gration status. In the Swedish policy debate, non-European women with a refugee background
and low education have been highlighted as a group that would benefits from expanded employ-
ment chances in the subsidized sector. Disaggregating the statistics for low-educated workers
provides negative news on this front. Refugee women with low education make up 1.4% in sub-
sidized firms. Adding the requirement that the refugee woman is born outside of Europe fur-
ther reduces the proportion to 0.9%. One way of interpreting this information is that created
by the policy for this marginalized group came at the cost of financing an additional 99 jobs.
In the Web Appendix, I show that the descriptive results for low-educated workers are not
sensitive to the income threshold for defining employment (Figure W8) or to restricting the
data to the last year in the study period (Figure W9).
Entry from non-employment, unemployment, and long-term unemployment. I now com-
pare the labor market statuses before job entry. An entrant is defined as a person with at least 6
months of wages from a specific sector in the current year, and zero income from that sector in
the previous year (Web Appendix Figure W10 repeats the analysis for the threshold of 1 month
of wages). I drop observations for people who enter a sector when they are 18 or 19 years old,
because they lack an observable labor market status in the two years prior to entry.
Among the entrants to different sectors, I compare the shares who were previously unem-
ployed, non-employed or long-term unemployed. As described in Section 4, these definitions
are based on the person’s income sources in the year before entry (for unemployment and
non-employment) and in the two previous years before entry (for long-term unemployment).
In addition to these three categories, I also measure entry shortly after immigration. This is
important because new immigrants represent a large share of the subsidized sector and may
create measurement error in the analysis. A person who arrives in the same year as they enter a
sector does not have observable income data in the Swedish administrative records in the two
years before entry. A person who arrives in one year and enters the sector in the next may also
erroneously be defined as previously non-employed simply because they were only present to
earn money in Sweden for part of the year prior to entry. To sidestep these concerns, I define
entrants as recent immigrants if they immigrated in either the same year as they entered the
sector or the year before. I also split recent immigrants by their region of birth or refugee status
(non-EU immigrants are not reported in the figure to save space). To be clear, this immigration
definition over-rides the three labor market statuses.
Figure 7 refutes the idea that the subsidized sector is a particularly efficient way for long-
term unemployed individuals to enter the Swedish labor market. The share of sector entrants
who come out of long-term unemployment is similar in the subsidized sector, the full pri-
vate sector, and the restaurant industry, but it is somewhat larger than in the commercial
cleaning industry. The same pattern holds for entrants who come out of unemployment. For
non-employment, the subsidized sector has a smaller share than the private sector and the
restaurant industry, and a similar share as the commercial cleaning sector. Figure W11 in the
Web Appendix splits this analysis by sex at birth. Because women are the large majority of
entrants, the pattern for women is close to those in Figure 7. Relative to these women, men inPage 18 of 37 Rickne. IZA Journal of Labor Policy (2021) 11:1
Figure 7 Profile of previous labor market statuses of sector entrants.
Notes: The figure shows the labor market and immigration statuses of entrants into sectors
in 2011–2015. Non-employment and unemployment are measured in the year prior to entry.
Long-term unemployment is defined as unemployment in the year prior to entry, and either
unemployment or non-employment before that. Recent immigration is defined as immigra-
tion in the two years before entry. The definition of recent immigration, i.e. within the last
two years, over-rides the labor market status.
the subsidized sector have been more likely to enter from both un-employment and long-term
unemployment.
The Xs in Figure 7 show which sectors act as entryways to the Swedish labor market for
newly arrived immigrants. All sectors have low shares of recent refugee immigrants among
their entrants, around 1.5% of the total entrants in all sectors except for the restaurant sector,
where the figure is 4.5%. There is no evidence that the domestic service sector has been more
successful than other sectors at providing an entryway into the Swedish labor market for recent
refugee immigrants.
The subsidized sector has a very large share of recent EU immigrants. One in five entrants
in subsidized firms, and more than one in four entrants in highly subsidized firms, immigrated
to Sweden from another EU country in the two years prior to entering this sector. These rates
are about three times as high as for the entrants into the private sector as a whole. Web Appen-
dix Figures W12 and W13 illustrate the exact number of years since immigration, where entry
is defined either as going from 0 to 6 monthly wages (W12) or 0 to 1 monthly wage (W13).
They show that most EU entrants in the subsidized sector arrived recently, while most refugee
entrants did not.
In sum, the subsidized sector is about equally likely as the comparison sectors to employ
people coming out of long-term unemployment or unemployment, and less likely to employ
people who were previously non-employed. The subsidized sector also has a substantially larger
share of recent EU immigrants among its entrants. This means that the large share of EU immi-
grants previously observed among the employed have likely immigrated with the explicit pur-
pose to work in the subsidized sector. Their moves also seem to be at least semi-permanent, as
the vast majority are permanent residents with Swedish ID codes.You can also read