Firms' Challenges and Social Responsibilities during Covid-19: a Twitter Analysis
←
→
Page content transcription
If your browser does not render page correctly, please read the page content below
Firms’ Challenges and Social Responsibilities during
                                                      Covid-19: a Twitter Analysis
                                                      Alessia Patuelli1,* , Guido Caldarelli2,3 , Nicola Lattanzi1 , Fabio Saracco4

                                                      1 AXES - Laboratory for the Analysis of Complex Economic Systems, IMT School for
                                                      Advanced Studies, Lucca, Italy
                                                      2 DSMN, Università Ca’ Foscari, Mestre (Ve), Italy
                                                      3 CNR- Institute of Complex Systems, Unit “Sapienza”, Rome, Italy
arXiv:2103.06705v1 [cs.SI] 11 Mar 2021

                                                      4 Networks Unit, IMT School for Advanced Studies, Lucca, Italy

                                                      * alessia.patuelli@imtlucca.it

                                                      Abstract
                                                      The Covid-19 pandemic caused disruptive effects for individuals, firms, and societies. In
                                                      this paper, we offer insights on the major issues and challenges firms are facing in the
                                                      Covid-19 pandemic, as well as their concerns for Corporate Social Responsibility (CSR)
                                                      themes. To do so, we investigate large Italian firms’ discussion on Twitter in the first
                                                      nine months of the pandemic. Specifically, we ask: How is firms’ Twitter discussion
                                                      developing during the Covid-19 pandemic? Which CSR dimensions and topics do firms
                                                      discuss? To what extent do they resonate with the public?
                                                          We downloaded all Twitter posts from 1st of March, 2020, to 17th of November, 2020
                                                      by the accounts of the largest Italian firms, i.e. those with 250 or more employees. We
                                                      then built the bipartite network of accounts and hashtags and, using an entropy-based
                                                      null model as a benchmark, we projected the information contained in the network into
                                                      the accounts layers, identifying a network of accounts, in which a link indicates a non
                                                      trivial similarity in terms of their usage of hashtags. We find that the conversation is
                                                      focused around 13 communities, 10 of which include Covid-19 themes. The core of the
                                                      network is formed of 5 communities, which deal with environmental sustainability,
                                                      digital innovation and safety. Firms’ ownership type does not seem to influence the
                                                      conversation. 10 communities out of 13 mention hashtags related to CSR, with the
                                                      environmental and social dimensions as the prevalent ones. Interestingly enough, the
                                                      social dimension seems more relevant in the communities dealing with digital innovation
                                                      and safety. However, the relevance of CSR hashtags is very small at the single message
                                                      level, but with some peculiarities arising in specific communities. Also, users engage
                                                      very little on CSR themes, with some differences showing in a few communities.
                                                          Overall, our paper highlights the role of network methods on Twitter data as a tool
                                                      which can support managers and policy makers to design their strategies and decision
                                                      making, capturing firms’ emerging issues and relevant themes. With the relevance of
                                                      CSR dimensions and stakeholder engagement varying depending on the community, we
                                                      also propose network methods as an effective way to capture the differences in firms’
                                                      and stakeholders’ CSR concerns.

                                                      1     Introduction
                                                      The Covid-19 pandemic impacted multiple business dimensions and forced firms to
                                                      rethink the way they do their businesses, coping with what has been called “the new

                                     March 12, 2021                                                                                       1/30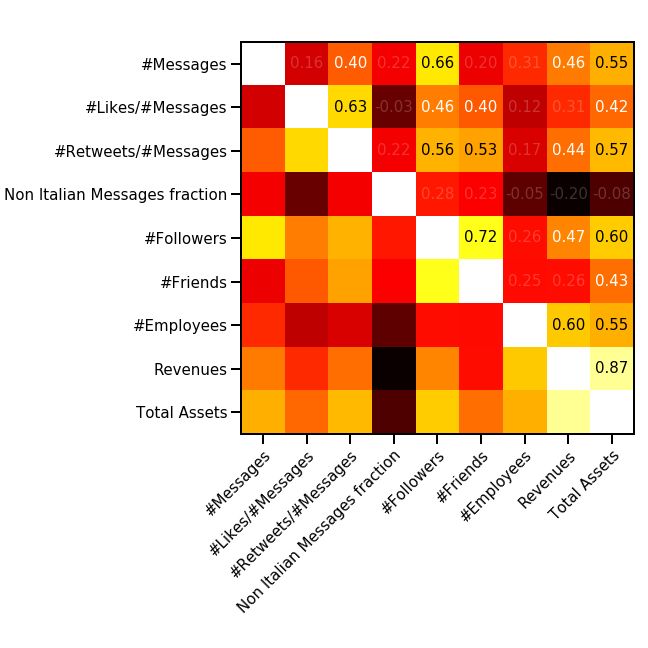
normal” [1]. While most research [2–7] explored Covid-19 effects on firms using
                 conceptual, survey or interview-based methods, only one paper, to the best of our
                 knowledge, examined firms’ challenges through social media, focusing on the effects on
                 supply chains [8]. Among others, the analysis of online social networks is a promising
                 tool to understand current issues, trends and challenges firms are facing [9].
                     In the last 15 years, social media revolutionized communication, making it cheaper
                 and faster than ever before and opening a new channel for firms to directly
                 communicate and interact with their stakeholders. An increasing number of firms
                 opened social media pages [10], which also allowed a new research stream to
                 develop [8, 11]. Management research focusing on social media mostly dealt with
                 Corporate Social Responsibility (CSR) and stakeholder engagement, with manual
                 collection [10] and labelling [12], and linear regressions [13–15]. These methods bring a
                 number of limitations. First, they are able to capture only a small number of firms,
                 which is generally less than a hundred [14–16]. Second, they follow a priori
                 approaches [16], that do not allow new insights to emerge from data. To the best of our
                 knowledge, few papers examined firms’ communication strategies adopting network
                 methods [17, 18], and none of them analyzed firms’ discussion during the pandemic. As
                 a data-driven approach could reveal complex patterns [19], we adopt a complex network
                 analysis to understand firms’ conversation on Twitter at the beginning of the Covid-19
                 pandemic. Doing so, we aim at understanding firms’ issues and challenges during the
                 Covid-19 crisis, as reflected in the Twitter discussion. Specifically, we aim at answering
                 three explorative research questions: How is firms’ Twitter discussion developing during
                 the Covid-19 pandemic? Which CSR dimensions and topics do firms discuss? To what
                 extent do they resonate with the public?
                     In order to detect similarities in the usage of hashtags, we represent the system as a
                 bipartite network between accounts and hashtags. We then project the information
                 contained in the network on the layer of accounts, to find users using similar hashtags.
                 The network is then validated via a comparison with a null model. In this sense, we opt
                 for the Bipartite Configuration Model (BiCM, [20]), i.e. an entropy-based networks
                 null-model, since it is unbiased by construction [21, 22]. The validation procedure is the
                 the one proposed in [23].
                     First, we find that firms’ discussion on Twitter form 13 communities of accounts, 10
                 of which touch upon Covid-19 themes. The core of the network is made of 5
                 communities, which focus on environmental sustainability, digital transformation,
                 remote working, digitalization and safety. This highlights that firm’s dialogue on
                 environmental, digital innovation and safety themes was central in Italian large firms’
                 discussion on Twitter at the beginning of the Covid-19 pandemic. Second, 10
                 communities out of 13 use CSR hashtags. Among the communities, the environmental
                 and social dimensions are prevalent, with the economic one being overlooked.
                 Interestingly, communities dealing with digital innovation and safety focus more on the
                 social dimension than the environmental one, which contrasts the main literature [24]
                 while confirming that CSR dissemination is context-dependent [25]. However, when we
                 focus on the message level, results show that CSR messages are a minority, with some
                 peculiarities appearing in some communities. Last, users seem to interact little on CSR
                 topic, showing that stakeholder engagement on these themes on Twitter is still scarce.
                     Our paper brings methodological, theoretical and practical contributions. From a
                 methodological perspective, we integrate complex network analysis in management
                 research, thus introducing a data-driven approach. Following a non-linear approach,
                 with no a-priori hypotheses, themes and communities freely emerge from data, allowing
                 similarities and differences between firms to arise in real time.
                     This allows our contributions to span across different management fields, including
                 the literature on firms and social media, CSR and stakeholder engagement. On the

March 12, 2021                                                                                        2/30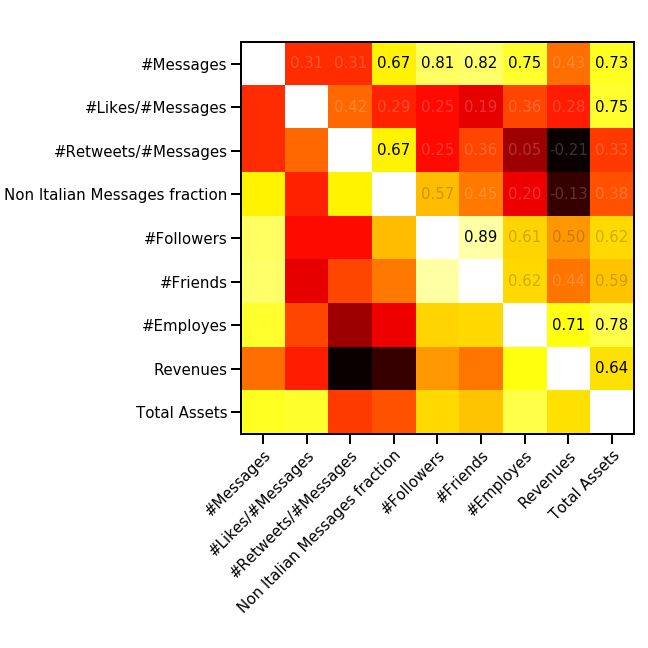
practical side, our research offers a tool for monitoring current challenges and issues
                 firms are facing. This can be useful for policy makers and managers to orient their
                 strategies and decision making [26] and to understand how firms’ and users’ perceptions
                 of CSR themes vary, reflecting different beliefs of what responsibilities firms have
                 towards society [24].

                 2     Previous findings
                 2.1    Firms, social media and the Covid-19 pandemic
                  In the last 20 years, Internet changed the ways and the speed with which firms
                  communicate and relate to their stakeholders. At first, the social dimension of website
                  communication was focused on blogs, which allowed firms to communicate their
                 “personality” and incorporate a relationship strategy based on connectivity and dialogue
                 with users. Blogs started dialogic online relationships between firms and their public.
                      When they first appeared around 15 years ago, social media were aimed at social
                  networking with friends, family and colleagues [27]. They opened new paths and ways
                  for firms to communicate with their stakeholders, shifting from a hierarchical
                  one-to-many communication to a many-to-many collaborative type of
                  communication [18]. Thus, social media became platforms for firms to share advertising,
                  marketing and public relationship strategies [27].
                      Among social media, Twitter is popular for business communication purposes [13],
                  and is the one with the highest adoption rates among large firms [15]. It is increasingly
                  used in academic research, with most contributions arising from the computer and
                  information science, and communications, while developing also in business and
                  economics [28]. While Twitter research is mostly focused on the marketing [29] and
                  financial fields [30], it is increasingly being used in the management and strategy fields,
                  for example to monitor firms’ CSR dissemination and stakeholder engagement [31], the
                  emerging trends in technology [11] or to understand the issues and challenges firms are
                  facing on specific themes [8].
                      This literature mostly studied firms’ communication on Twitter with traditional
                  methodologies. On the data collection side, manual collection methods [10] prevail,
                 while on the data analysis side, manual labelling [12], and linear regressions [13–15] are
                  the majority. However, some studies are experimenting with new approaches based on
                  network methods, with a prevailing focus to understand CSR communication and
                  stakeholder engagement on social media [9, 18].
                      There is a prolific new research line which focuses on the impacts of Covid-19 on
                  firms and their reactions (among others: [3, 7, 32–34]) and there is an extended research
                  about the Covid-19 as perceived on Twitter (see, for instance, [35–41]), but, surprisingly,
                  researchers just started to explore firms’ conversation on Covid-19 on Twitter. To the
                  best of our knowledge, only one paper [8] has studied firms’ discussion during Covid-19,
                  focusing on the pandemic’s effects on supply chains. However, the pandemic impacted
                  multiple business dimensions, including firms’ financial resources and business
                  models [3], with first reactions ranging from increasing servitization,
                  digitalization [2, 5, 7], and cooperation [42]. Managers and entrepreneurs had to rethink
                  the way they do their businesses, learning to face a totally unexpected crisis [43] and to
                  cope with a “new normal” [1]. To the best of our knowledge, there is no paper currently
                  addressing how firms’ conversation on social media is evolving during Covid-19, thus
                  providing insights on the current issues and challenges firms are facing [9].
                      Thus, we want to investigate how firms’ Twitter discussion is developing during the
                  Covid-19 pandemic.

March 12, 2021                                                                                         3/30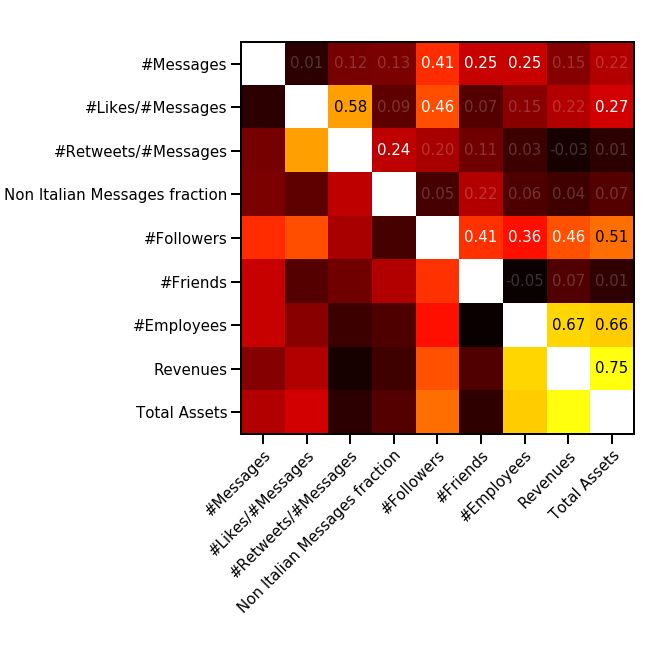
2.2    Firms, CSR dissemination and stakeholder engagement
                 Although the concept of CSR has no universal meaning and has been widely
                 defined [44], it generally refers to the relationships and responsibilities a business has
                 towards society, interpreted as the communities of stakeholders a firm interacts
                 with [25, 44, 45], going beyond what is required by law [46]. What CSR concerns in
                 practical terms depends on the historical and cultural context a firm is settled in, and it
                 can also reflect the issues a firm is facing in a particular period [45], which it have been
                 changing and increasing fast after the start of globalization [25].
                     While the advent of the Internet pushed firms to disseminate their social reporting
                 online [45], social media opened a new channel for firms to disseminate their actions and
                 interact with their stakeholders [13].
                     Previous studies show that firms use social media to disseminate their social,
                 environmental or sustainability orientation and results, but it seems that social media
                 are not fully exploited as a mean to interact with stakeholders [12]. One explanation is
                 legitimacy theory [47], which argues that companies are on social media to show their
                 presence in the digital world rather than to report their results or engaging their
                 stakeholders. In this paragraph we will discuss previous research findings, focusing on
                 (i) how the CSR dimensions are concerned in firms’ discussion on Twitter and (ii) to
                 what extent stakeholders (here considered as Twitter users) interact with firms.
                     Most research finds that firms’ social media posts about CSR topics are a minority.
                 Considering together firms’ Facebook posts, Tweets and Youtube videos in a 3-months
                 period in 2014, [12] show that CSR posts are only 7% of all posts, thus suggesting that
                 firms do not use Twittter to disseminate their CSR activities. Focusing on the top 50
                 companies from the Fortune list of 2010, [48] find similar results, highlighting that firms
                 mostly post about topics non-related to CSR (among others, posts include marketing
                 purposes, promotion of products and services), with only a small percentage of posts
                 regarding CSR. This is also consistent with [49], who finds that in general business
                 accounts 14.5% of tweets are about CSR topics, while they rise in CSR-dedicated
                 Twitter pages, with more than 70% tweets on average about CSR issues. However,
                 there are some conflicting results. For example, taking Spanish banks after the euro
                 zone crisis, CSR appears as a material topic discussed on Twitter [13].
                     Few papers use network (visualization) methods, thus showing which communities
                 around CSR topics arise. For example, selecting firms with a Twitter account dedicated
                 to CSR and using network and machine learning methods, [18] finds that firms and
                 users create several independent communities around CSR themes, instead of a unique
                 and connected network. Combining structural topic modeling and network
                 methods, [50] explore how the Twitter discussion around the hashtag #CSR evolves,
                 resulting in 20 different topics (the most prevalent one being company strategy, followed
                 by community charity, CSR teams, business ethics, . . . ), most of them related to one or
                 more topics, and seven without any significant correlation with others. The paper
                 concludes that Twitter is used as a mean to share about multiple CSR dimensions,
                 some of them are related and they change over time. Following a similar approach,
                 starting from the hashtag #sustainability, [9] adopt social networks methods, finding
                 top themes associated with #sustainability (namely, Innovation, Environment, Climate
                 Change, Corporate Social Responsibility, Technology, and Energy) and 6 communities
                 (Environmental Sustainability, Sustainability Awareness, Renewable Energy and
                 Climate Change, Innovative Technology, Green Architecture, and Food Sustainability).

                    Overall, existing research seem to agree that CSR communication on Twitter is a
                 minority and results are quite fragmented. However, there are mixed findings and
                 data-driven methods have been rarely used. Also following [49] call for a more in-depth
                 study on the topics firms address on Twitter when communicating on CSR, we want to

March 12, 2021                                                                                         4/30
investigate which CSR dimensions and topics firms discuss.
While the aforementioned results relate to one-way communication on CSR on
Twitter, a few papers also question the extent to which users interact with firms on
Twitter, as a measure of stakeholder engagement. Being a separate but related concept
to CSR, stakeholder engagement can be interpreted under many different theoretical
perspectives and has been variously defined. Following [51], “stakeholder engagement is
understood as practices the organisation undertakes to involve stakeholders in a positive
manner in organisational activities” (p. 315). Social media are increasingly used as a
tool to measure stakeholder engagement, with the assumption that social media users
are part of the firm’s stakeholders [52]. Although some preliminary evidence shows that
Twitter is less used as a mean to engage stakeholders compared to Facebook [53], it is
still considered an ideal tool for firms to engage with their stakeholders, with measures
like retweeting activity that can be interpreted as an implicit endorsement of the
content of the message [16]. Papers exploring firms’ use of Twitter for engaging their
stakeholders use different approaches and findings are quite mixed. In general, it seems
that social media are not used in their full capacity to interact and engage with
stakeholders on CSR topics. This is what both [48] and [12] found, the former
highlighting that firms interact very little on CSR topics, the latter finding that firms’
posts concerning stakeholder engagement are only the 0.22% of total messages. This is
somewhat consistent with [49], who finds that non-CSR tweets have a higher
interactivity than CSR ones. However, [16] find opposite results, with CSR messages
gaining a greater audience reaction than non-CSR messages, in particular when certain
CSR topics (e.g. environment or education) are discussed and when the post uses a
hashtag related to the topic. However, popularity was measured as a binary variable
(retweeted message vs not retweeted message), not taking into account the extent to
which a message is retweeted. Similarly, focusing on specific CSR dimensions, a few
papers study how stakeholder engagement varies depending on the type of CSR
communication. For example, using the very broad categorization of core CSR
(information directly linked to the firm’s core business) versus supplementary CSR
(information about actions detached from the firm’s core business), [13] find that
different categories of stakeholders react differently to firm’s CSR tweets depending on
the content that is shared. However, results do not allow to further distinguish which
CSR dimensions resonate most.
As the literature shows very mixed results in stakeholder engagement on CSR topics
on Twitter, we want to investigate to what extent the CSR dimensions resonate with
the public.
3 Materials and methods
3.1 Data set
We selected Italy for our study as it is one of the countries first and more severely hit by
the pandemic [3]. Although large firms are a minority in European businesses [54], they
usually have more stakeholders than small and medium sized firms, are considered to
have a bigger impact on society [55] and higher resources to invest in reporting and
accountability [56] . Therefore, we expect them to have a higher adoption rate of social
media. We relied on AIDA1 (https://aida.bvdinfo.com/), the Italian section of Bureau
1 AIDA is a database containing financial and commercial historical data from approximately 540,000
firms operating in Italy. It relies on official data retrieved from the Italian Registry of Companies and
the Italian Chambers of Commerce. AIDA contains data at the firm level, which include information
about the firm’s characteristics (e.g. location, industry, the year it was founded), the ownership and
governance structure (e.g. the name of each shareholder and board member, the respective ownership
share) and financial data (balance sheet, profit and loss accounts data, and ratios).
March 12, 2021 5/30Van Dijk (https://www.bvdinfo.com/), to select firms.
We selected all Italian active firms from with 250 or more employees, resulting in
3.870 firms. We downloaded data about firms’ characteristics (e.g. their names,
location, ownership type, ATECO code2 and website) and financial data (e.g. total
assets and revenues). As at the time of download (April 2020) not every firm’s financial
data was updated with information on 2019, the financial data we downloaded refer to
2018. We manually searched the firms’ websites as indicated in AIDA database,
checking in each website if a Twitter account was available. For each website, we
searched the home page and “contacts” sections. We found that 936 companies out of
3870 (24%) displayed a Twitter account in their website. A few of them indicated
multiple Twitter accounts on their websites.
3.1.1 Data collection and first cleaning
To collect all messages written by the selected accounts, we made use of the GET
statuses/user timeline Twitter API. Out of the original 936 accounts, 6 accounts were
not active in the period examined, while 6 were not found (probably they were
deactivated). The final data set was composed by 1.6 M of tweets.
The data set was cleaned further: we focused on firms writing tweets in the period
from the 1st of March, 2020, to 17th of November, 2020, which includes the beginning
of the Covid-19 pandemic. In order to focus on the proper set, we selected firms that
wrote a message before and after the 1st of March, 2020, to explore their activity over a
longer period. Literally, the GET statuses/user timeline API permits to download the
last circa 3200 messages written by the account3 : if the account is extremely active,
these 3200 will cover just an extremely limited period and thus cannot be considered for
the definition of a narrative over the entire period under analysis. It is the case, for
instance, of the accounts of publishing houses owning newspapers: the Twitter accounts
were used as the accounts of the newspapers, thus for communicating the latest piece of
news. Other examples include public transport accounts (messages referred to traffic
alerts), internet and mobile service companies (those accounts were either used to
advertise the latest promotions or for the customer service) or football teams
(commenting the results of the match). Selecting accounts which tweeted before and
after the 1st of March 2020 also permits to get rid of those accounts that were active in
the past, but did not contribute to the discussion during the pandemic. The resulting
firms in our data set are a total of 417 different active accounts and 917864 different
messages. Even though our research is mostly based on publicly available online data
(i.e. Twitter messages), we believe it is ethically appropriate not to disclose the firms’
names, usernames and quotes [57].
3.1.2 Hashtag cleaning
For each firm in the data set, we extracted the hashtag used, in order to study
similarities in the communication strategies. Only 401 accounts out of 417 (i.e. the
96%) used at least one hashtag in the period under study.
We find frequent mistakes in typing the hashtags: to avoid considering as different
two hashtag referring to the same subject, we implemented the Edit distance, as
implemented by the py stringmatching python module [58] (more details in the
2 ATECO is the classification of economic activities used by the Italian Institute of Statistics (ISTAT).
It is the national translation of NACE, which is the classification of economic activities in the European
Union. It stands for “Statistical classification of economic activities in the European Community” and
is derived from the French “Nomenclature statistique des activités économiques dans la Communauté
européenne”. The latest classification is NACE Rev. 2, which was implemented from 2007.
3 For more details, visit Twitter developer webpage.
March 12, 2021 6/30hashtag data cleaning can be found in the appendix A). After this cleaning, 11475
different hashtags resulted in the data set.
3.1.3 CSR hashtags
To recognise hashtags related to CSR issues, the widely known classification of
sustainability proposed by [59] was used. It distinguishes between three dimensions: (i)
the environmental dimension (i.e. attention of the company towards environmental
issues), (ii) the social dimension (i.e. the relationship between business and society –
consumers, employees and stakeholders in general), (iii) the economic dimension (i.e.
socio-economic or financial aspects, including describing CSR in terms of business
operations). In order to select relevant keywords, we adapted and integrated previous
approaches. As [60] distinguish the environmental and social dimension, using
keywords from the GRI4 (Global Reporting Initiative) 2010 standard, we updated this
list with the latest GRI 2019 standards (Italian translation), also including the
economic dimension. To create a comprehensive list of CSR keywords, we also
integrated keywords from existing research [12, 49] and added them to their relevant
CSR area. To do this, the first and fourth authors discussed the category for each item,
and placed it in the category they both agreed on.
3.2 The bipartite semantic network and its validated
projection
We represented the system as a bipartite network, i.e. a network in which the nodes are
divided into two disjointed classes (called layers) and edges are not allowed between
nodes of the same group. One layer represents the different accounts, while the second
layer represents the various hashtags. A hashtag and an account are connected if, in the
period analysed, the given account used the selected hashtag at least once.
We use the strategy described in [23] to project the information contained in the
original system on the layer of the accounts and detect similarly communicating firms.
In a nutshell, this approach consists of 3 main steps: first, we consider the network of
the co-occurrences of links, as they are observed in the real system. In our case, since
we are interested in projecting the information contained in our system onto the
company layer, for each couple of users, the co-occurrences are the number of hashtags
used by both accounts. Second, we define a proper null-model as a benchmark. In the
present application, we use a maximum entropy null-model, i.e. a model maximally
random, but for the information contained in some constraints [21, 22]. In particular, we
can discount the information contained in the degree sequence, as in the Bipartite
configuration Model (BiCM, [20]; more details on the null-model can be found in the
appendix B.1). In this way, in our analysis we are considering the attitude of the
various accounts in using hashtags (that is, the degree of the various accounts) and the
number of users using the given hashtag (i.e. the degree of the different hashtags).
Finally, we compare the observed co-occurrences with the expectations of the
null-model: if those are statistically significant, i.e. much higher than the ones predicted
by the model and such that the disagreement cannot be explained by the constraint of
the null-model, they are then validated. We then put an edge in the projection
connecting the two accounts whose co-occurrences are statistically significant. The
result of the projection is a monopartite undirected network of accounts in which a
connection indicates non trivial similarities in terms of the usage of hashtags. The entire
4 The Global Reporting Initiative (GRI) is is an independent, international organization aimed at
developing voluntary reporting guidelines for CSR. The GRI Standards are among the world’s most widely
used standards for CSR reporting. For more information, please visit: https://www.globalreporting.org/
March 12, 2021 7/30approach is described in more detail in the appendix B.2.
For the implementation of the BiCM, we used the recently released python module
NEMtropy, presented in [61].
4 Results and Discussion
4.1 General statistics
Before considering the accounts that have been validated by the projection techniques
described in the section above, we first present some features of the data set, that
includes financial data from AIDA and online data from Twitter.
Over the entire set of firms, the correlations among financial and online data remain
limited: in Fig. 1 we show the related Spearman correlation5 matrix. The correlations
between quantities related to the companies’ activity on online social networks and
those regarding their financial performance are in general weak and rarely significant.
Actually, even among Twitter quantities, the correlations are quite weak, with a few
exceptions: the number of likes per message and the number of retweets per message
(0.64), the number of followers and the number of messages (0.57), and the number of
followers and the number of likes per message (0.57).
Interestingly enough, once we focus on a single ATECO code, as in the right panel of
Fig. 1 for code 62 (Computer programming, consultancy and related activities), the
situation appears slightly different. There are significant and relatively strong
correlations between, for instance, the number of followers and the total assets (0.60),
and the total number of messages and the total assets (0.55). This difference is probably
due to the specific sector: being related to information technologies, the appearance of
these companies in online social networks is an important part of their marketing
strategies and depends on a firm’s size (as measured in the total assets).
Focusing on Twitter data, the retweeting activity is always the most frequent one,
for instance representing nearly the 80% of the actions on the platform during the
Covid-19 Italian debate [62]. Interestingly enough, probably due to the different role of
firms’ Twitter accounts, the retweeting activity in the present data set is extremely
limited: just the 22.3% of the messages collected are retweets, while the others are
original messages. A similar behaviour was detected for verified users [62]: the authors
interpreted these findings maintaining that verified users are the main drivers for the
development of a debate. Here, analogously, firms participate to the discussion by
introducing new arguments, even if the accounts are not necessarily verified: the
frequency of verified accounts in our data set is quite limited, close to 17%.
The most frequently used hashtag in the dataset is “covid”, which appears 4106
times. “Coronavirus” is the third most used hashtag, appearing 2120 times. The other
most frequently used hashtags are mostly related to public utilities themes and
digitalization.
We remind that we just selected firms’ accounts, not keywords, to download the
messages we analysed. Nevertheless, almost all accounts used hashtags related to
pandemic, due to the obvious impact that it had on every activity in the period.
4.2 Validated network of Twitter accounts
The result of the procedure described in Sec. 3.2 is a monopartite network of Twitter
accounts composed by 80 firms and 135 links, in which links indicate a non trivial
similarity in the usage of hashtags (see Fig. 2). Interestingly enough, while being heavy
5 Due to the non Gaussian distribution of the various quantities, Pearson correlation is not justified.
March 12, 2021 8/30Fig 1. Spearman correlations among different financial and online data. On
the left panel the correlation matrix for the entire data set: all correlations between
online and financial quantities are weak. This changes once we focus on specific ATECO
codes, due to their peculiarities: on the right panel the same correlation matrix for
sector 62 (Computer programming, consultancy and related activitie). A relatively
strong correlation is present between the number of followers and the total assets, for
instance. This behaviour may be due to the importance of the communications in online
social networks for this sector, which increases with a firm’s resources.
users of messages and hashtags and having a great number of friends, the validated
accounts are not among the most popular ones, see Fig. 3. Indeed, the most popular
users, i.e. those with more than a million followers, are luxury brands; those accounts
wrote many messages, but they limit the usage of hashtags to their merchandise,
probably in order to focus on the exclusiveness of their products. In this sense, let us
remark that the validated nodes are those that contribute to the formation of common
narratives, shared among various accounts; these extremely popular users, instead, are
marking their originality and do not intervene substantially to shape common
discussions.
Even in the case of the firms in the validated network, there are limited correlations
between online and financial data, see the left panel of Fig. 4: the only relatively strong
(and significant) one is between the number of followers and the total assets (0.51).
Nevertheless, when we focus on a specific ATECO code, correlations can be much
stronger and mix the online data from Twitter with the financial ones: in the right
panel of Fig. 4 we observe quite a strong correlation between the number of messages
and the total assets (0.73) or between the number of likes per message and the total
assets (0.75). A similar behaviour was observed in the analysis of the entire data set,
see Fig. 1; the correlations on the 62 ATECO code, were, nevertheless, a little weaker
than the ones observed here.
By running the Louvain algorithm [63], we identified 13 communities of accounts,
identified by nodes of different colors in Fig. 2. These groups show a certain
homogeneity in terms of companies’ sectors (for more details, see Tables 6 and 7 in the
appendix). In particular, the greatest communities in the core of the network mostly
include computer programming, consultancy and related activities (•), electricity, gas,
steam and air conditioning supply (•), employment (•), activities of head offices and
management consultancy (•) and human health (•). Instead, the ownership type (in
March 12, 2021 9/30Fig 2. Validated projection of the network of firms. The network is composed
by 80 firms and 135 links. The dimension of each node is proportional to its degree, i.e.
the number of connections. The various colors represent the different communities. The
shape of the nodes indicate the GUO (Global Ultimate Owner): rectangles are firms
owned by the state or other public bodies, diamonds are firms owned by mutual &
pension funds / nominal / trust funds, circles are firms owned by individuals or families
(family firms), while triangles are companies; the rest are diamond shaped.
term of the Global Ultimate Owner, or GUO6 ) does not seem to influence the
conversation: the GUO is represented in Fig. 2 as different shapes of the nodes and no
significant pattern can be detected. This is surprising, as some kinds of firms
communicate in a different way, especially about CSR and environmental issues. For
example, family firms are found to communicate on CSR differently from non-family
firms [55] and publicly owned firms disclose less on environmental topics (contrary to
the expectations [56, 64]). Although ownership does not seem to influence the
conversation, it is worth noting that the dialogue on environmental sustainability is
mostly carried out by firms active in the public utilities sector.
4.2.1 The usage of hashtags in the validated network: firms’ discussion
during the pandemic
Remarkably, among the 13 communities detected, 10 of them have a Covid-related
theme in their main hashtags (e.g. “coronavirus”, “covid”, “iorestoacasa”, the latter one
meaning “stayhome”), meaning that firms’ discussion is strongly related to the
pandemic. The core of the network is made of 5 interconnected communities. Based on
their most frequently used hashtags, we named them “Digital Transformation” ( ), •
6 As defined by Bureau Van Dijk, the GUO (Global Ultimate Owner) is the individual or entity at
the top of the corporate ownership structure, thus indicating the highest parent company.
March 12, 2021 10/30Friend distribution Followers distribution
all accounts all accounts
10 2 validated accounts validated accounts
10 4
frequency
frequency
10 3
10 4 10 6
10 5
10 8
10 6
100 101 102 103 104 101 102 103 104 105 106 107
number of friends number of followers
Hashtag distribution Message frequency
all accounts all accounts
10 1 validated accounts 10 2 validated accounts
frequency
frequency
10 3
10 2
10 4
10 3
10 5
10 4
100 101 102 103 100 101 102 103 104
number of hashtags used number of messages
Fig 3. Properties of nodes in the validated network vs. the ones in the
entire set. The various distributions show that the validated accounts are those that
have a greater number of friends (top left panel), use greater number of hashtags
(bottom left panel) and write more messages (bottom right panel). Interestingly enough,
the validated nodes are not the most popular, i.e. those with the highest number of
followers (top right panel). In order to check the most popular accounts, we focused on
accounts with more than 106 followers. In fact, the number of their messages is
extremely limited, while their use of hashtags is extremely focused on their activities.
This may be related to their strategies, to remark the exclusiveness of their products.
More details can be found in the main text.
• •
“Remote Working” ( ), “Digitalization” ( ), “Environmental Sustainability” ( ) and •
•
“Safety” ( ), which emerged as the main themes that firms discussed at the beginning of
the Covid-19 pandemic. The names assigned to all communities can be found in Table 1.
In the “Environmental Sustainability” community ( ), the most important hashtags •
are “sostenibilità” (meaning “sustainability”), “covid”, “innovazione” (“innovation”),
“greendeal”, “energia” (“energy”), thus showing that the environmental themes are
relevant and linked to the innovation ones, see Table 2. This community is mostly
formed by firms managing national infrastructures, and public utilities. Three
communities capture the digital innovation debate: “Digital Transformation” ( ) , •
•
“Remote Working” ( ) and “Digitalization” ( ) . The “Digital Transformation” •
community deals with the themes of digital transformation, innovation and covid, with
the most relevant hashtags being: “smartworking” (“remoteworking”), “cloud”, “covid”,
”ai” and ”sicurezza” (”security”). This community is made of private firms,
regionally-owned companies, software companies, consultancies. The other two
communities (“Remote Working” and “Digitalization”) are mostly concerned with the
changing nature of work. One has “covid”, “digitale” (“digital”), “coronavirus”, “lavoro”
(“work”), “smartworking” (“remoteworking”) as the most relevant hashtags, which
reflect the workplace adjustments during the pandemic. This community is mostly
composed of recruitment agencies, along with consultancies, telecommunication
March 12, 2021 11/30Fig 4. Spearman correlations among different financial and online data for
firms in the validated network. On the left panel the correlation matrix for the
validated network: all correlations between online and financial quantities are weak, as
in the entire data set (see left panel of Fig. 1), but for the one between the number of
followers and the total assets (0.51). Again, the situation changes once we focus on a
specific ATECO code and it is even more striking than for the entire data set (see left
panel of Fig. 1). In fact, the same correlation matrix for sector 62 (Computer
programming, consultancy and related activitie) shows a strong correlation, for instance,
between the total number of messages and the total assets (0.73) and between the
number of Likes per message and the total assets (0.75). In fact, the validated accounts
are those that follow a common strategy in the usage of hashtags and the importance of
their appearance online increases relatively to the dimension of the company.
Comm. Theme
• Digital Transformation
• Environmental Sustainability
• Remote Working
• Digitalization
• Restart
• Safety
• Mobility
• Slowing the Spread
• Solidarity
• Space
• Nursing Homes
• Locality
• Reading
Table 1. Identification between themes and the community displayed in
Fig. 2: as it can be further observed, the themes the different groups of accounts deal
with are closely related to their ATECO codes, i.e. to their sector.
companies, a trade fairs organizer, and an agency for the digital innovation. The
“Digitalization” community also focuses on work digital adjustments, with
“smartworking” (“remoteworking”), “covid”, “lavoro” (“work”), “webinar” and
“digitale” (“digital”) as the main hashtags. It is mostly composed of consultancy
March 12, 2021 12/30Comm. Hashtag Occurrence Comm. Hashtag Occurrence
• smartworking 15 • ripartiamodallitalia 5
cloud 15 covid 5
covid 13 italia 5
innovazione 13 coronavirus 5
ai 12 aprile 4
sicurezza 12 turismo 4
• sostenibilità 13 estate 4
covid 12 estatepostcovid 4
innovazione 11 sostenibilità 4
greendeal 11 coop 4
energia 11 • covid 6
• covid 11 italia 6
digitale 10 coronavirus 6
coronavirus 10 diabete 5
lavoro 9 scuola 5
smartworking 9 sanità 5
• smartworking 9 mascherine 5
covid 9 • settembre 5
lavoro 8 coronavirus 5
webinar 7 agosto 5
coronavirus 6 covid 5
digitale 6 ottobre 5
economia 6 maggio 5
marzo 5
Table 2. The top 5 frequent hashtags for the communities in the Largest
Connected Component of Fig. 2. Due to the great number of ex aequo, the top 5
most frequent hashtags is, in general, longer than 5.
•
companies. The “Safety” community ( ) is made of biopharmaceutical companies, a
hospital group and a university consortium. Its hashtags are: “covid”, “italia” (“Italy”),
“coronavirus”, “sanità” (“healthcare”), “mascherine” (“facemasks”), thus showing that
their main concerns are safety measures against Covid-19.
These results show that the digital innovation debate is central in firms’ discussion
on Twitter, with themes related to digitalization and the introduction of new tools as
remote working, webinars, cloud services. This is consistent with the first results of
firms’ reactions to the Covid-19 crisis [2]: the needs to social distancing and to shelter
at home pushed towards an acceleration of the digital transformation, which was
ongoing before the pandemic, thus changing firms’ business models and strategies. On
one hand, this appeared in an increase in the demand for technology products (e.g.
laptops) and services (e.g. cloud computers, digital services). On the other hand, many
jobs went remote. While digital transformation processes were already ongoing [65], the
pandemic highlighted the need to leverage technology to overcome the challenges and
environmental uncertainty, and accelerated a trend towards different life styles,
increasing the importance of technology in our economy and society [5]. Smaller
communities are described in details in the appendix C.
4.2.2 CSR dissemination and stakeholder engagement
In this second part of the analysis, we study CSR dissemination and stakeholder
engagement in the communities previously identified.
March 12, 2021 13/30Before starting, let us make a few remarks. First, the number of CSR hashtags is
extremely limited, being of 30 different words, compared to a set of 6036 different
hashtag used by the validated accounts, resulting respectively as the 0.17%
(environmental dimension), 0.28% (social dimension) and 0.05% (economic dimension).
Despite these small numbers, it is crucial to notice that, when we also consider the
repetitions (i.e. the number of times an account used the various hashtags), the
fractions are quite different, that is respectively the 1.17%, 0.42% and 0.07%. In this
sense, even if the set of keywords we are considering is quite limited, firms’ accounts are
particularly inclined to use it: if the number of repetitions per hashtag were constant,
we would not observe a change in its percentage when considering their total presence.
In this sense, also considering the repetitions, the environmental dimension seems
particularly popular among the validated accounts.
Comm. Accounts CSR (total) Env. Soc. Econ.
• 16 9 6 8 2
• 14 14 14 8 2
• 11 10 6 9 2
• 9 7 5 7 2
• 6 4 4 1 0
• 6 3 1 2 0
• 5 3 3 1 0
• 3 3 3 2 2
• 2 2 2 0 0
• 2 1 1 0 0
Table 3. Frequency of accounts using the various CSR hashtags. The
frequency of accounts using CSR hashtags is higher in the greater communities, with a
100% covering in the case of “Environmental Sustainability” ( ). •
CSR usage in the validated network At the community level, 10 communities out
of 13 use CSR hashtags (see Table 3), with most accounts in each community using CSR
hashtags. Environmental and social themes are prevalent, with their relevance differing
depending on the community. In the “Environmental Sustainability” community ( ), •
all accounts (14) use hashtags related to CSR. This community is mainly composed of
public utilities companies, and highlight that the sustainability debate is prevalent in
these kinds of firms, and it is joint with the innovation debate. In this community, all
the 14 accounts use hashtags related to the environmental dimension. Hashtags related
to the social dimension are also tweeted by most accounts (8 out of 14), while hashtags
related to the economic dimension are a minority (tweeted by 2 out of 14 accounts).
•
In the “Digital Transformation” community ( ), 9 accounts out of 16 use hashtags
related to CSR. Among them, 6 discuss environmental themes, 8 social ones and 2
economic ones. This shows that digital transformation themes are more connected to
social aspects than environmental ones – among the most frequently used hashtags,
words like “formazione” (“training”) and “istruzione” (“education”) appear. Considered
together with the prevalent hashtags of the community (“smartworking”, “cloud”,
“covid”, ...), it seems that firms are discussing the learning process associated with the
new technologies, which is consistent with the period of observation.
•
In the “Remote working” community ( ), 10 out of 11 accounts use CSR hashtags.
Again, the social dimension is prevalent (9 accounts use social hashtags, in contrast to 6
accounts that use environmental hashtags and 2 that use economic hashtags). The
hashtags related to the social dimension include training themes (“formazione”,
“istruzione”, meaning “training” and “education”, respectively), but are more varied
March 12, 2021 14/30than the previous community – they concern work-related themes, as
“corruzione”(“corruption”), “discriminazione” (“discrimination”) and “diversity”. This is
partly intuitive, as this community is mainly composed by recruitment agencies,
consultancies, and telecommunication companies.
•
In the “Digitalization” community ( ), 7 out of 9 accounts use CSR hashtags.
Consistently with the previous communities, accounts that use hashtags related to the
social dimension are more (7) than the ones posting about the environmental dimension
(5), while the economic dimension is still the minor one (2).
•
Again, the “Safety” community ( ) has 2 accounts tweeting about the social
dimension and 1 about the environmental dimension, and no accounts tweeting about
the economic dimension.
These results show that CSR dissemination is not evenly distributed among
communities and firms. The prevalent CSR dimension firms disseminate on Twitter is
contingent to the community they belong to, which is somehow related to the firms’
sectors – showing that different types of firms emphasize different dimensions of CSR.
The communities focused on digital innovation (“Digital Transformation”, “Remote
Working”, “Digitalization”) and safety are more concerned on the social dimension of
CSR. In these communities, the environmental dimension is present, but it is less
relevant compared to the social dimension, which is somehow surprising, as the
environmental dimension is usually the one managers put more attention on [24]. Last,
the economic dimension of CSR is overlooked in all communities. We do not know if the
higher relevance of the social dimension of CSR in the digital innovation and safety
communities is an effect of the pandemic or if this also happens in non-crisis times. One
option is that the pandemic pushed firms to see the social dimension as the most
relevant one, and it became prevalent compared to the environmental one. This would
confirm CSR as a concept evolving depending on the present circumstances [45]. In any
case, it is worth noting that, differently from the main literature [24], in some
communities the social dimension is more relevant than the environmental one. Further
research could investigate this trend, checking if these communities mostly communicate
on social CSR themes over a wider time span, also considering non-crisis times.
The analysis of the smallest communities concerns for CSR themes can be found in
the appendix D
However, when considering the dissemination of the CSR dimensions focusing on
hashtags as a unit of analysis, the relevance of CSR changes. Table 4 shows the
occurrence of CSR hashtags among the hashtags in the validated network. Overall, CSR
hashtags are less then 2% of all hashtags, with hashtags related to the environmental
dimension being the majority (1.17%) compared to the social dimension (0.42%) and
the economic one (0.07%). On one hand, this is consistent with previous literature,
which argues that the CSR dimension is overlooked in firms’ social media
posts [12, 48, 49]. However, a methodological note is needed. As the hashtags we
included in the CSR dimensions are only 30 in total, representing the 0.5% of the total
hashtags in the (validated) network, it is easily predictable that they will represent a
minority. Actually, their occurrence in the validated network is higher then expected
(1.67%), thus highlighting that firms use the hashtags related to CSR more frequently
then the others. Further research should widen the hashtags considered as related to the
CSR dimensions - as for now, we believe that the hashtags we used as representative for
the CSR dimension do not entirely capture the phenomenon. In any case, some
communities show that specific CSR dimensions are more prevalent than others. It is
•
the case of the ”Environmental Sustainability” community ( ), where hashtags related
to the environmental dimension are the 3.51% of the total. Firms in the ”Remote
March 12, 2021 15/30•
Working” community ( ), instead, use more hashtags related to the social dimension,
•
which account for the 1.12% of the total. Again, the ”Restart” community ( ) shows a
higher prevalence of the environmental dimension (1.62%).
Hashtags ENV (%) SOC (%) ECON (%)
Validated network 67805 1.17 0.42 0.07
• 12646 0.38 0.29 0.05
• 14541 3.51 0.50 0.04
• 10921 0.51 1.12 0.07
• 7164 1.62 0.52 0.08
• 3312 0.63 0.06 0.00
• 4751 0.04 0.08 0.00
• 8223 0.32 0.02 0.00
• 2115 0.28 0.47 1.13
• 1142 0.00 0.00 0.00
• 272 0.00 0.00 0.00
• 10 0.00 0.00 0.00
• 1708 0.35 0.00 0.00
• 1000 0.40 0.00 0.00
Table 4. Frequency of hashtags in the validated network, by community
and CSR dimension. As expected by analysing the community composition in terms
of ATECO code, the attention on the various group is quite different: for instance, the
“Environmental Sustainability” community • has a frequency of hashtags in the
Environmental dimension that is greater than twice the value observed on the entire
validated network. Similar considerations apply to the “Remote Working” community
• for the social dimension and the “Mobility” one • for the social one.
Likes Retweets
ENV SOC ECON ENV SOC ECON
Validated network 2.42 2.76 1.47 Validated network 2.44 3.69 1.79
• 2.75 2.22 0.80 • 2.49 2.88 1.70
• 2.27 3.13 1.79 • 2.31 3.80 2.03
• 2.20 2.84 0.80 • 2.33 3.99 1.70
• 2.50 2.72 1.27 • 2.51 3.91 1.39
• 2.72 1.31 0.00 • 2.79 1.89 0.00
• 2.83 2.39 0.00 • 2.92 2.85 0.00
• 2.55 5.03 0.00 • 2.46 4.86 0.00
• 2.83 2.81 2.78 • 2.92 4.02 2.35
• 0.00 0.00 0.00 • 0.00 0.00 0.00
• 0.00 0.00 0.00 • 0.00 0.00 0.00
• 0.00 0.00 0.00 • 0.00 0.00 0.00
• 2.83 0.00 0.00 • 2.92 0.00 0.00
• 2.88 0.00 0.00 • 3.23 0.00 0.00
Table 5. Average number of likes (left) and retweets (right) per message
containing a hashtag in the environmental (ENV), social (SOC) and
economic (ECON) dimensions. Interestingly enough, the frequency of the CSR
hashtags used (reported in Table 4) is not necessarily mirrored in the number of likes or
retweets received on average per hashtag.
March 12, 2021 16/30Stakeholder engagement on CSR dimensions We measure stakeholder (user)
engagement as the number of retweets and likes per hashtag. Table 5 shows stakeholder
engagement on all posts and CSR dimensions. Results show that posts with hashtags
related to the three CSR dimensions are retweeted and liked less then the rest of the
posts, thus confirming that social media are not fully exploited to interact and engage
on CSR themes [12, 48, 49].
In the entire data set, on average, each message containing a hashtag concerning
CSR is retweeted 2.99 times, against an average of 5.39 retweets for all the hashtags.
However, a closer look at the communities and CSR dimensions highlights some
peculiarities. While the number of retweets for the environmental dimension is more or
•
less stable in the communities, the “Mobility” ( ) community has a higher number of
retweets in the social dimension (4.86 on average). With a few exceptions, the social
dimension has on average a higher number of retweets compared to the other CSR
dimensions and to the dataset.
In terms of the number of likes per hashtag, in the entire dataset each message
containing a CSR hashtag obtains on average 2.59 likes, against an average of 14.83
likes for all the hashtags. When we look at the various communities, again the number
of likes in the environmental dimension is quite stable, while social hashtags show a few
•
different trends, with the “Mobility” ( ) and “Environmental Sustainability” ( ) •
communities having a higher number of likes (5.03 and 3.13 respectively) and the
•
“Restart” one ( ) having a lower number of likes than the average (1.31). Thus, it
seems that stakeholder engagement shows similar trends with both measures (retweets
and likes), while the extent to which users interact is unevenly distributed among
dimensions and communities.
Overall, these findings show that firms’ dissemination on CSR dimensions and
stakeholder engagement are not homogeneous and vary depending on the communities.
Thus, studies enquiring on firms’ CSR concerns and stakeholder engagement should
consider this when formulating their research questions and methods. These findings
also show that network methods, allowing firms’ discussions to emerge from data
without any a priori hypothesis are an effective way to show firms’ and users’ different
attitudes towards the CSR dimensions.
5 Conclusion
Our paper presents large Italian firms’ discussion on Twitter during the first 9 months
of the Covid-19 pandemic. Specifically, our explorative research questions followed three
lines: 1) firms’ general Twitter discussion during the Covid-19 pandemic; 2) the CSR
dimensions being discussed; 3) stakeholder engagement on CSR themes. First, we show
that the discussion is formed of 13 communities of firms, with Covid-19 themes
appearing in 10 of them. The core of the network, which reflects firms’ major challenges
during the pandemic, is composed of five communities (i.e. “Digital Transformation”,
“Remote Working”, “Digitalization”, “Environmental Sustainability” and “Safety”).
Firms’ ownership type does not seem to affect the debate. Second, we show that 10
communities out of 13 use CSR hashtags. While the environmental and the social
dimensions are the prevalent ones, the economic dimension is generally overlooked.
Moreover, the social dimension is more relevant than the environmental one in the three
digital innovation communities and the safety one. Third, stakeholder engagement on
CSR themes is limited, and unevenly distributed among communities and themes.
This work has methodological, theoretical and practical implications. On the
methodological side, we integrate a new methodology (i.e. complex network analysis) in
management research, widening the methods and focus of current research, that mostly
March 12, 2021 17/30You can also read