Russia's heavy fuel oil exports: challenges and changing rules abroad and at home - Oxford Institute for Energy Studies
←
→
Page content transcription
If your browser does not render page correctly, please read the page content below

April 2019

                     Russia’s heavy fuel oil exports:
                     challenges and changing rules
                                abroad and at home

OIES PAPER: WPM 80       Vitaly Yermakov, James Henderson and Bassam Fattouh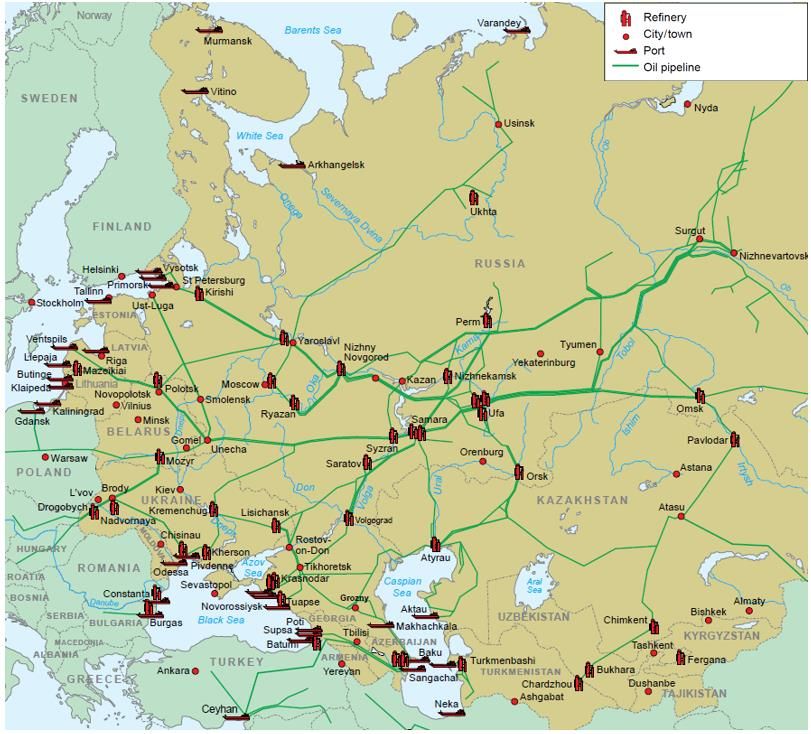
The contents of this paper are the authors’ sole responsibility. They do not necessarily represent the
              views of the Oxford Institute for Energy Studies or any of its members.

                                          Copyright © 2019
                               Oxford Institute for Energy Studies
                                  (Registered Charity, No. 286084)

  This publication may be reproduced in part for educational or non-profit purposes without special
permission from the copyright holder, provided acknowledgment of the source is made. No use of this
  publication may be made for resale or for any other commercial purpose whatsoever without prior
                  permission in writing from the Oxford Institute for Energy Studies.

                                      ISBN 978-1-78467-135-8

                           DOI: https://doi.org/10.26889/9781784671358

                                                                                                         i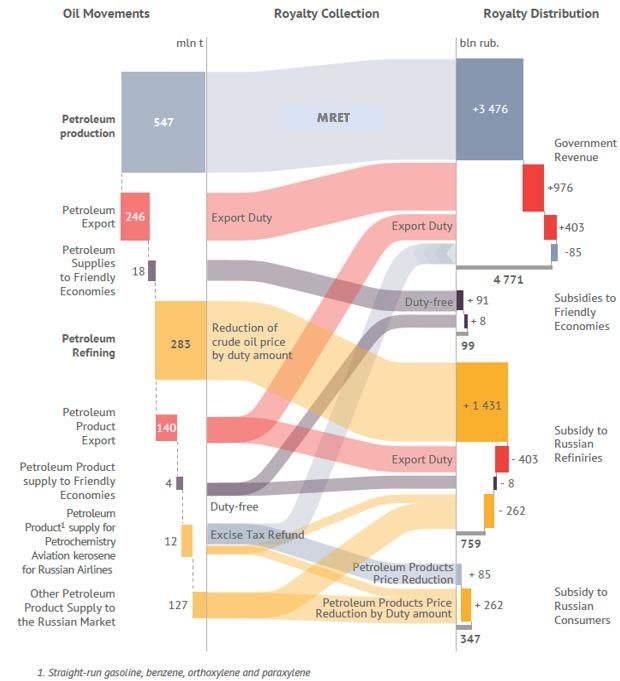
Contents
Figures ................................................................................................................................................... ii
Tables .................................................................................................................................................... iii
I. Introduction ........................................................................................................................................ 1
II. Key features of Russia’s refining industry ..................................................................................... 2
    Complexity of refining processes ........................................................................................................ 5
    Organizational structure ...................................................................................................................... 6
    Refinery throughputs ........................................................................................................................... 7
III. The paradox of Russia’s refining: the subsidy that went too far and lasted too long ........... 11
    Export taxes: the magic formula ....................................................................................................... 11
    While the state giveth, the refining sector taketh .............................................................................. 15
IV. Tax reform of 2009–2019 and its impacts ................................................................................... 17
    The 60–66–90 system ....................................................................................................................... 17
    Removing the fuel oil subsidy ........................................................................................................... 18
    The first results of the reform – a mixed bag – better yields, but excessive throughput .................. 20
    Limitations and risks of the reform .................................................................................................... 24
V. The new plan for 2019–2024 and outlook for its final phase in 2020–2024 .............................. 26
VI. Modernization of Russian refineries and outlooks for the future ............................................ 30
VII. Conclusion .................................................................................................................................... 33
Appendix I. A brief history of Soviet and Russian refining industry and its current
characteristics ..................................................................................................................................... 34
Appendix II: Complexity of Russian refining system ...................................................................... 35

Figures
Figure 1: Map of main Russian refineries, Western Russia .................................................................... 3
Figure 2: Map of Russian refineries, Eastern Russia ............................................................................. 4
Figure 3: Russian refining throughput shares by company, 2018 .......................................................... 6
Figure 4: Refining throughput volumes and refining depth for Russia’s largest refineries in 2018 ........ 7
Figure 5: Russia’s refining capacity, throughput, and capacity utilization .............................................. 8
Figure 6: Russian crude oil and refined products output index ............................................................... 8
Figure 7: Russian refined product exports .............................................................................................. 9
Figure 8: Value lost to Russia by exporting refined products instead of crude oil ................................ 10
Figure 9: Refined product exports from Russia .................................................................................... 10
Figure 10: Russian export duties for petroleum products ..................................................................... 13
Figure 11: Effective annual average export duty rates for crude oil and main refined products in 2005–
2010 ...................................................................................................................................................... 14
Figure 12: Differences in export duty rates between crude oil and main refined products ................... 14
Figure 13: Incremental change in refined product output, 2014 versus 2005 ...................................... 15
Figure 14: Incremental additions in throughput at Russian refineries, 2014 vs. 2005 .......................... 16
Figure 15: Changes in export taxes in 2011–2018 (actual annual average tax rates) ......................... 19
Figure 16: Marginal rates for petroleum export duties in Russia in relation to oil price ........................ 20
Figure 17: Russia’s refining throughput and output of main products, 2010–2018 .............................. 21
Figure 18: Incremental change in fuel oil output, 2018 versus 2014 .................................................... 21
Figure 19: Distribution of Russian fuel oil production in 2018 by refinery ............................................. 22
Figure 20: Fuel oil output by refinery, 2017–2018 ................................................................................ 23
Figure 21: Russia’s refined product exports, 2010–2018 ..................................................................... 23
Figure 22: Russian fuel oil exports via the Baltic and the northern ports ............................................. 24
Figure 23: Russian fuel oil exports via the Black Sea ports .................................................................. 24
Figure 24: Why Russia got cold feet eliminating export taxes completely in 2017 ............................... 25
Figure 25: Eligibility requirements for excise tax refunds ..................................................................... 27
Figure 26: Petroleum rent and its distribution in Russia in 2017 .......................................................... 28

                                                                                                                                                             ii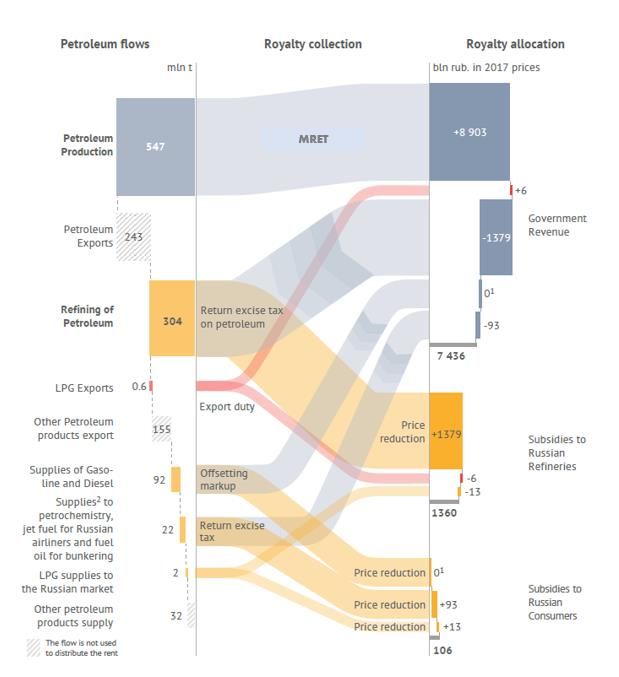
Figure 27: Petroleum rent and its distribution in Russia in 2024 .......................................................... 29
Figure 28: Investment spending of refinery upgrades in Russia in 2011–2017.................................... 30
Figure 29: Planned capacity additions at Russian refineries in 2018–2024 by process type ............... 31
Figure 30: Russia’s refined product balance, 2017 and outlooks for 2025 ........................................... 32
Figure A-II-1: Refining throughput and refining depth in Russia ........................................................... 35
Figure A-II-2: Light product share in Russian refining output ............................................................... 35

Tables
Table A-II-1: Regional differences in key characteristics of complexity for refining industry ................ 36

                                                                                                                              iii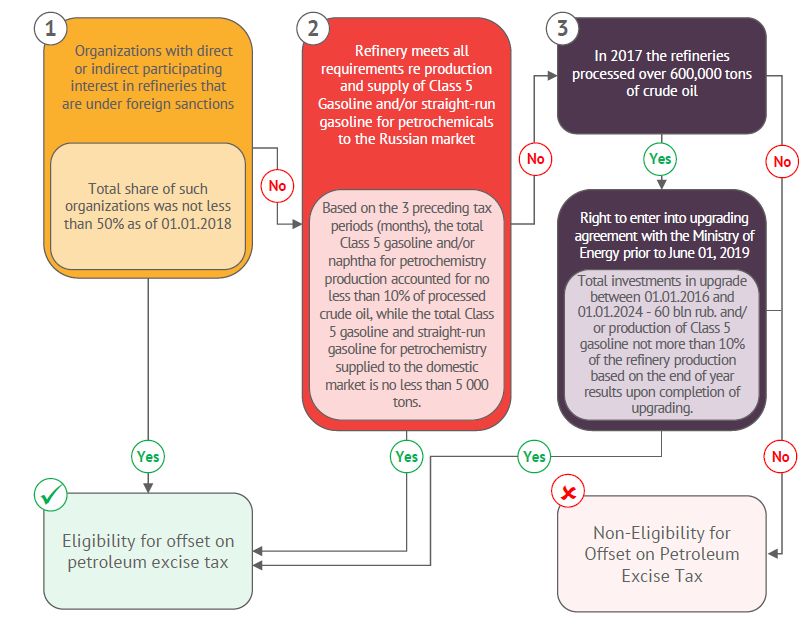
I. Introduction
Russia is the world’s second-largest exporter of refined products after the USA. Owing to the less
complex nature of Russian refineries, heavy fuel oil (HFO) exports have been very high, both as a share
of the export product mix, and in absolute terms. In 2012 the share of fuel oil in Russian product exports
peaked at 53 per cent of the total. In 2014 they reached their absolute maximum level of 82.5 million
tons (mt). From 2015, as a result of new export tax policies that changed the incentives for Russian
refiners and forced them to optimize their output, Russian fuel oil exports started to decline. But in 2018
they still amounted to 52.6 mt (35 per cent of the total).Russia remains the number one exporter of HFO
in the world and is now facing a problem: how to deal with a rapidly shrinking market for this product?
The global heavy fuel oil market has been under pressure for the past 40 years. Its niche has been
constantly declining as the demand for fuel oil has been losing one battle after another to alternative
fuels and cleaner substitutes. Coal and natural gas have pushed residual fuel oil (mazut) out of the
power and residential heating sectors. At thermal power plants in Russia, its role has been reduced to
that of emergency reserve fuel. Very few countries outside of the Middle East continue using mazut as
the main fuel in the power sector, and in countries such as Saudi Arabia and Kuwait, which currently
burn large volumes of HFO in their power plants, plans have been developed to replace it with natural
gas. In the residential heating sector, natural gas and, more recently, renewables have provided
cheaper and cleaner alternatives.
Marine bunkering had been one of the few remaining areas with robust demand for fuel oil, due to the
expansion of maritime trade and growth of shipping turnover. It is now the world’s largest consumer of
HFO. However, the International Maritime Organization (IMO) has mandated a stricter sulphur
emissions cap (0.5 per cent instead of 3.5 per cent) from January 2020 globally, which is a challenge
for shippers. The new rules will force them to choose between switching to compliant fuels (compliant
low-sulphur fuel oils and marine gasoil (MGO)), installing scrubbers, or refurbishing their ships for the
use of LNG as bunker fuel. The change in bunker fuel specifications might become the most disruptive
quality change for the refining and shipping sectors in this century. Most analysis of the IMO
requirements taking effect in 2020 suggests a lower demand for HFO and very likely downward price
pressure. Russia is going to be faced with the greatest exposure to this new challenge.
The key aim of this paper is to explore whether the Russian refining sector has the flexibility to deal with
the problem by lowering HFO output and exports before the mismatch between supply and demand
becomes excessive. This paper builds on the research conducted by OIES in 2012. 1 At that time, the
Russian government and the Russian oil companies had announced an ambitious programme of
modernization for the Russian refining sector, and planned a radical overhaul of the tax incentives that
artificially supported HFO production. According to these plans, by 2020 Russia would have
implemented investments in conversion refining processes with the effect of drastically reducing the
production of residual fuel oil. This, in turn, would have cut the levels of Russian fuel oil exports to very
low levels.
As we approach 2020, however, Russia appears to need several more years to reduce its still large
volumes of HFO output. Moreover, the emergence of some systemic and social issues, associated with
the shutting down of some inefficient refineries, suggests that some simple, die-hard Russian refining
capacity is not going to go quietly and will continue its operations. This calls for the re-examination of
some of the conclusions of earlier research and a review of the new circumstances.
The paper is structured as follows: first, it discusses the history, evolution, and key characteristics of
the Russian refining sector and reveals the systemic causes of sustained high levels of HFO output;

1
 Fattouh B. and Henderson J. ‘The Impact of Russia’s Refinery Upgrade Plans on Global Fuel Oil Markets’. OIES Paper WPM
48, 2012.

                                                                                                                      1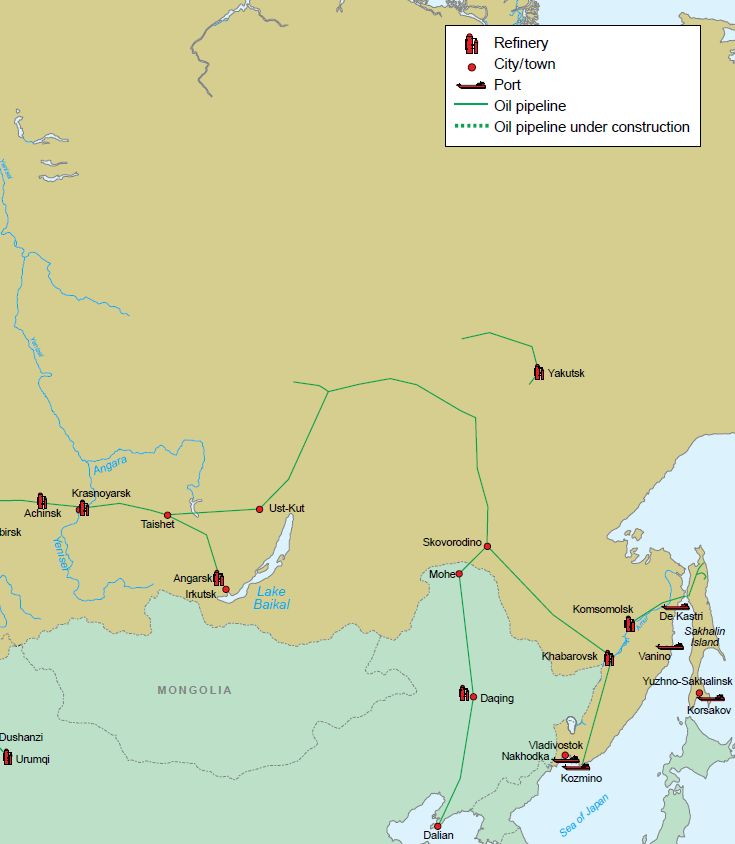
then it reviews Russia’s refined product exports and their profitability, and shows that Russia has
incurred significant losses by exporting refined products instead of crude oil. Turning to the causes of
this, the paper looks at the structure of the product export mix and Russia’s regime of export duties for
oil and refined products. This analysis highlights the distortive nature of the subsidies stemming from
the design of Russian export taxes. Next, Russia’s attempts to correct the distortions, and the
consequences of these efforts, are evaluated. The paper continues with an overview of investments in
the Russian refining sector that were made with the aim of rationalization and modernization. It
concludes with the outlook for Russia’s fuel oil output and the view on the global market of pricing
developments for HFO after 2020.

II. Key features of Russia’s refining industry
There are several key principles that make refining a viable business in the long term.
     •          Refined product output should, as far as possible, match the demand for product mix in
                the market that the refinery is going to serve. This ensures the right choice for the type of
                capacity and its level of sophistication, resulting in high utilization, efficient runs, and low
                logistical costs on delivering products to customers.
     •          The type of crude available for the refinery determines the product slate from distillation
                and sets the requirements for secondary processing capacity.
     •          The location of the refinery is very often a trade-off between a desire to be closer to crude
                oil supply and a desire to be closer to the final consumers, in which the relative costs of
                transporting crude oil to the refinery and transporting refined products to the end
                customers should be evaluated.
     •          Investing in a refinery is a long-term business, and it is important to be able to respond to
                shifts in demand and new product requirements via necessary capacity upgrades, which
                introduces another important trade-off: the flexibility to rationalize and upgrade with
                regards to the crude oil ‘diet’ and the output mix.
In Russia, it is difficult to point to any refinery that optimizes the above trade-offs. This has to do with
the history of Russia’s petroleum industry, the legacy of Soviet industrial policy that influenced decisions
on refinery locations, and the dramatic shifts in demand since the bulk of Russia’s refining capacity was
built.2
The Russian refining industry emerged in several waves: during the first stage of industrialization in the
1930s, then in the post-World War II Soviet push to rival US economic might, and finally in the late
1960s–early 1970s, on the back of the spectacular growth of Soviet oil output in Western Siberia. (See
Appendix I for more details about the history of the Soviet and Russian refining industry.) Geography
has always played a key role in the economics of Russia’s refining sector. Because of the size of the
country and the location of the bulk of its oil reserves deep inland, the transportation expenses
associated with moving crude to the refineries, and products to the target markets, have represented a
significant share of overall costs. Rail and river shipments have accounted for the lion’s share of
transportation turnover. The development of an interregional pipeline network for crude oil in the 1970s

2
  Thane Gustafson, in his canonical book about the Soviet energy sector, points to the accumulated effects of the system
embodied in the physical infrastructure and, in a powerful metaphor, compares the Soviet economy to a ‘gnarled tree’ that had
grown up ‘leaning against the north wind of forced-draft industrialization’: Its past is written into the composition and location of
its capital stock, the patterns of its roads, the size and type of its plants, the distribution of its manpower, the kind of fuel it burns
and ore it uses. … The layout of pipelines and refineries embody decisions made over decades. The same is even more true of
the consumption side, since the country map of energy demand is essentially that of its inherited structure of population and
economic activity. Gustafson T. Crisis amid Plenty. The Politics of Soviet Energy under Brezhnev and Gorbachev. Princeton,
1989. pp. 11–12.

                                                                                                                                        2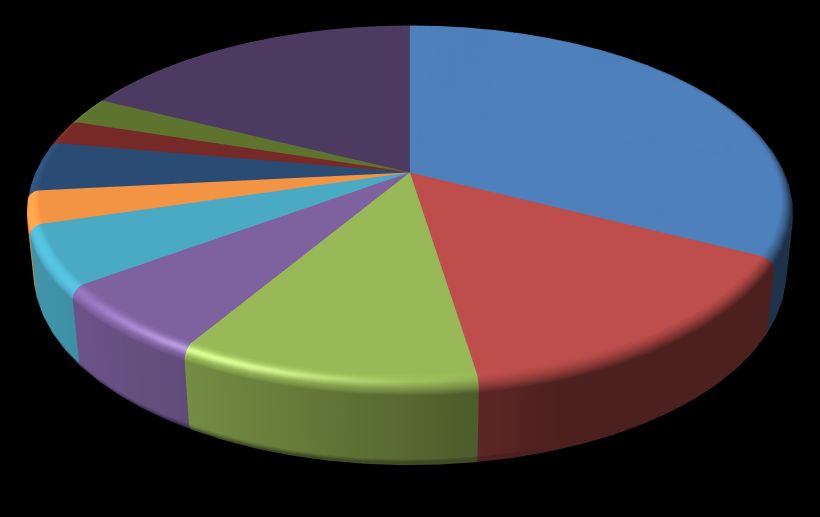
allowed Russia to optimize the costs of delivering crude oil to the refineries and to place new refineries
closer to main consumption centres in the European part of the country. But for refined products, rail
transportation has remained the dominant method of delivery. Only recently have new dedicated
pipelines for refined products (low-sulphur diesel) allowed Russian refiners to diversify some of their
transportation options.
The geographical configuration of the Russian refining industry was largely completed in the 1970s,
with most of the refineries being located deep inland serving domestic customers. A few Russian
refineries were located closer to land borders (Kirishi in the Northwest) or in the seaports (Tuapse on
the Black Sea); however, these were not designed as export-oriented facilities but to serve the regional
areas of the domestic market. This setup – with the productive base kept away from the borders –
reflected the security concerns of a country that had experienced foreign invasions and occupation of
its territory. (See Figure 1 and Figure 2)
Figure 1: Map of main Russian refineries, Western Russia

Source: Argus Media (www.argusmedia.com)

                                                                                                        3
Figure 2: Map of Russian refineries, Eastern Russia
Source: Argus Media (www.argusmedia.com)
The demand patterns of the Soviet planned economy have also left an enduring impact on the Russian
refining sector. When Russia’s refineries were built in the 1950s and 1960s, mazut, or heavy fuel oil
(the largest and least desirable product of simple distillation) was widely used domestically, primarily as
4a fuel for thermal power plants. By 1975 it accounted for almost a third of the fuel balance of thermal
plants nationally.3
From the early 1980s, however, the availability of cheap and abundant natural gas became a game-
changer. The Russian power sector switched from mazut to gas, and fuel oil was reduced to the role of
emergency fuel – representing merely 2–3 per cent of the thermal plants’ fuel balance by the 1990s.
Meanwhile, the new demand patterns favoured lighter and cleaner products, primarily motor fuels, at
the expense of the traditionally important mazut. The transition from the Soviet command economy
reduced the roles of industries and the military (traditionally large consumers of fuel oil) in the demand
for refined products, and increased the shares of the commercial and services sectors. Individual and
commercial car and truck ownership grew quickly, bringing up demand for high-octane gasoline and
low-sulphur diesel.
From that period on, most of Russia’s fuel oil production had to be disposed of to markets located
relatively far from the original marketing areas of the Russian refineries; this introduced additional
logistical costs and created a drag on their overall profitability. This change initiated large-scale exports
of fuel oil out of Russia. The export of excess refined products emerged as an important source of
flexibility for refineries that had to face the problem of a fixed refinery slate, when domestic consumption
patterns radically changed with the fast penetration of natural gas. These exports offered an alternative
to costly investments in conversion processes at the refineries. By postponing such painful but
necessary adjustments, this stop-gap solution also planted the seeds of a long-lasting problem. The
mismatch between primary and secondary capacity remains one of the biggest challenges for Russia’s
refining industry.
Complexity of refining processes
Russia’s refining sector is not very sophisticated (see Appendix II for more details). The distillation
process (primary refining), the method with the simplest technology and lowest costs has been
dominant, while the share of cracking or other conversion refining processes is relatively low.
The Russian refining sector historically did not have enough secondary refining processes. 4 These
processes either convert heavier, low-value products into lighter, premium products or improve the
quality of products resulting from the primary distillation of crude. Recent expansion has occurred mostly
in the area of hydrotreating capacity for desulfurization, allowing a significant reduction in the sulphur
content of Russian middle distillates (especially diesel fuel) that are needed for the export market. At
the same time, Russian refineries have been slow to come up with the big-ticket investments necessary
to expand their upgrading capacity in visbreaking, catalytic cracking, and coking. As of 2017, Russia
and the Caspian area managed to bring their Nelson Complexity Index (NCI) to the important threshold
of 8.0, which sets apart good refineries from mediocre and bad. The conversion ratio also improved
significantly over 2010 to 25 per cent, but it is way behind the 65–70 per cent seen in North America
and Asia–Pacific. Russia needs sizeable investments in upgrading capacity if it wants the refining
product slate to match current demand patterns that favour light clean products. This is one area where
Russia’s refining sector is not only far behind that in advanced countries, but is below the world’s
average by a wide margin.
3
In the Middle Volga region, where the concentration of refining capacity was the highest, mazut accounted for almost a half of
the thermal power plants’ fuel needs. The overhang of distillation capacity over secondary processing capacity, thus, was not
seen as a big problem.
4
These include cracking processes that convert residue from primary distillation into varying yields of distillates, ranging from
straightforward thermal cracking (visbreaking) to more complex catalytic processes such as catalytic cracking, hydrocracking,
and combination cracking. Coking destroys residue altogether, producing a mixture of distillates and coke. Hydrotreating uses
hydrogen to remove undesirable elements, mainly sulphur, from fuels and lubricants, especially diesel fuel. The catalytic
reforming process converts naphtha into higher-octane gasoline components; it is also used in the petrochemical industry to
produce aromatic hydrocarbons.
5Organizational structure
At present, Russia’s refining capacity is about 329 mt, with the bulk being concentrated in 33 fully-
fledged refineries and the rest in specialized gas condensate processing facilities, specialized lube
plants, and a number of mini-refineries. Russian refining operations are highly concentrated, with over
two-thirds of the output produced at the facilities being controlled by five vertically integrated companies
(VICs). The Soviet oil industry was reorganized in the early 1990s into 16 large vertically integrated
companies (VICs), each combining exploration, production, refining, distribution, and retailing.
Following recent consolidation, only five large oil VICs remain: Rosneft, Gazpromneft, Lukoil,
Surgutneftegaz, and Tatneft. Rosneft is the largest refiner in Russia with a share of 33 per cent; it
processed over 101 mt in 2018, if its share in Slavneft’s Yaroslavl refinery is included (see Figure 3).
Taken together, the VICs accounted for 73 per cent of Russia’s total refining throughput in 2018. The
remaining throughput is distributed among large and small independent refineries, and a few dozens of
small ‘teapots’.
Figure 3: Russian refining throughput shares by company, 2018
Other
Novatek 18%
2%
Rosneft
Gazprom
33%
2%
New Stream
5%
Tatneft
3%
Slavneft
5%
SNG
6% Lukoil
15%
GPN
11%
Source: Authors, data from Argus
Figure 4 illustrates the individual characteristics of Russia’s main refineries. The modernization of
Russian refineries over the past 10 years has improved the yields and the quality of the products, but
as of 2018 the country’s refining throughput is still very high relative to domestic demand – only about
half of the refining output was consumed at home, and almost 150 mt of refined products were exported.
The yields at some refineries belonging to VICs are still poor, and Russia’s die-hard teapot refineries
still account for a sizeable share of total output.
6Figure 4: Refining throughput volumes and refining depth for Russia’s largest refineries in 2018
25 100%
20 80%
Million ton
15 60%
10 40%
5 20%
0 0%
Novoil (Rosneft)
Komsomolsk (Rosneft)
Tuapse (Rosneft)
Saratov (Rosneft)
Yaisk
N.Novgorod (Lukoil)
Yaroslavl (Slavneft)
Others
Achinsk (Rosneft)
Salavat
Ust-Luga (Novatek)
Omsk (Gazpromneft)
Moscow (Gazpromneft)
Ufaneftekhim (Rosneft)
Syzran (Rosneft)
Orsk
Krasnodar
Volgograd (Lukoil)
Ufa (Rosneft)
Ryazan (Rosneft)
Ukhta (Lukoil)
Kuibyshev (Rosneft)
Perm (Lukoil)
Kirishi (Surgutneftegaz)
Antipinsky (New Stream)
Afipsky (New Stream)
Khabarovsk (NNK)
Ilsky
Gazprom's GPZ
Angarsk (Rosneft)
Nizhnekamsk (Taif)
Novoshakhtinsk
Mari El (New Stream)
Novokuibyshevsk (Rosneft)
Nizhnekamsk (Taneco, Tatneft)
Throughput, million ton Refining depth, % RHS
Source: Authors's calculation, data from Argus
Refinery throughputs
Russia’s total primary distillation capacity reached 360 mt in 1990, with refining throughput at 299 mt,
giving a capacity utilization of effectively 80 per cent (see Figure 5). But after the Soviet Union’s collapse
and the subsequent economic shock, its refining throughput dwindled to a low point of 165 mt in 1998,
according to BP’s Statistical Review.5 Utilization rates dropped below 60 per cent. This was because
Russia had too much obsolete simple distillation capacity and too little conversion capacity at its refining
facilities.
In the early 2000s the pendulum swung back, and Russian refining throughput started to grow robustly
(the reasons for the rebound are discussed later in the text). The ‘big bounce’ of Russian refining
occurred on the back of spectacular crude oil output growth in the country in the early 2000s. Higher
levels of refining helped alleviate the export bottlenecks for crude oil that emerged in the Transneft
pipeline system in the early 2000s while it was trying to catch up with upstream developments. Russia’s
shortage of export capacity for crude oil was effectively eliminated, as the country’s incremental
production was redirected from exports to domestic refineries, starting in 2004/5. Refining throughput
amounted to 285 mt in 2017, with utilization of 87 per cent, according to BP. 6 (See Figure 5)
From the mid-2000s the rate of growth for Russia’s refining throughput was consistently higher than
that for its crude oil output. At the same time, the output of key refined products (including residual fuel
oil) was following the rates of throughput growth, suggesting that the Russian refineries continued to
yield a relatively poor mix of products through 2014. It was only in 2015 that fuel oil output nose-dived,
and by 2018 it had returned to the level seen in 2000 (see Figure 6).
5
BP. Statistical Review of World Energy. June 2018 http://www.bp.com/statisticalreview.
6
BP reports Russian refining data in million barrels per day. In this report the coefficient of 7.3 was used to convert barrels to
tons.
7Figure 5: Russia’s refining capacity, throughput, and capacity utilization
400 100%
350 90%
80%
300
70%
250 60%
200 50%
Million ton
150 40%
30%
100
20%
50 10%
0 0%
1990 1992 1994 1996 1998 2000 2002 2004 2006 2008 2010 2012 2014 2016
Refining throughput Refining capacity Utilization, RHS
Source: Authors, data from BP Statistical Review, 2018
Figure 6: Russian crude oil and refined products output index
180
170
160
Index, Year 2000 = 100
150
140
130
120
110
100
90
2000 2002 2004 2006 2008 2010 2012 2014 2016 2018
Crude oil Refining throughput
Automotive gasoline Diesel
Fuel oil
Source: Authors, data Minenergo, Rosstat
Evolution of the product export mix and its impact on profitability
Russia is the world’s second-largest exporter of refined products (after the USA). Its total product
exports peaked in 2015 at 171.7 mt and they were about 150 mt in 2016 and 2017, according to the
official Russian statistics, based on customs data. In 2018, total product exports reported by the Russian
Customs Service were 149.3 mt. In terms of value, Russian refined product exports reached a peak of
US$116 billion in 2014, resulting from the combined effects of high volume and record price. Since
dwindling to US$46 billion in 2016 they have recovered and in 2018 the figure amounted to US$78
billion (see Figure 7).
8Figure 7: Russian refined product exports
200 800
700
150 600
116 500
109
Million ton
104
96
100 400
80 78
70 67
US$/ton
300
58
52 48
45 46
50 34 200
19
11 9 11 14 100
0 0
2000 2002 2004 2006 2008 2010 2012 2014 2016 2018
Total refined product exports
Value of product exports, billion US$
Source: Authors, data from Russia's Central Bank and Customs Service
The official statistics also contain some troubling revelations. The striking result of a simple comparison
of the effective realized export price of Russian crude oil with the effective realized price for the basket
of exported products is that in the past 18 years, exports of refined products were value destroying.
Russia would have been better off exporting its crude oil rather than the mix of refined products it did
export.
The graphics vividly demonstrate that Russia experienced much lower export earnings from its
aggregate oil exports. This was due to the significantly lower value of an average ton of Russian refined
product exports than that of an equivalent amount of crude oil. Applying the price differential to the
volume of exports, the value lost to Russia as a result of the poor export mix can be calculated. During
2005–2014, the cumulative losses amounted to the staggering figure of about US$36 billion (see Figure
8). The value of Russian refined product exports relative to crude oil exports only finally moved into
positive territory in 2017/18. The key reason for the change was a shift in the composition of the product
export basket. Historically, this contained a very large share of unfinished or intermediate products.
These were essentially surrogates that needed further processing before they could be used: straight-
run gasoline (naphtha), high-sulphur diesel, vacuum gasoil (VGO), and high-sulphur fuel oil. These
surrogates could only be sold at significant price discounts, putting downward pressure on Russia’s
export revenues.
The greatest drag on the value of product exports was high-sulphur fuel oil. In 2012 the share of fuel oil
in Russian product exports peaked at 53 per cent of the total. In 2014 fuel oil exports reached their
absolute maximum level of 82.5 mt. From 2015, as a result of new export tax policies discussed later
in this text, Russian fuel oil exports started to decline. In 2018 they amounted to 52.6 mt (35 per cent
of the total), according to data provided by Argus. 7 As soon as their share in Russia’s overall export
volumes started to decline, losses on total product exports stopped (see Figure 9).
7
Argus reports the data on refined product shipments from ports and from land border crossings in the FSU. These numbers
differ from the data on Russian product exports reported by the Russian Customs Service. The discrepancy might be due to the
possible inclusion into Argus statistics of refined product exports from Belarus and Kazakhstan – members of the customs-free
zone with Russia.
9Figure 8: Value lost to Russia by exporting refined products instead of crude oil
6 30
4
20
2
10
0
Billion US$
2000 2002 2004 2006 2008 2010 2012 2014 2016 2018
$/ton
-2 0
-4
-10
-6
-20
-8
-10 -30
Value gain/loss Price difference b/w Russian export product basket and crude oil, Rhs
Source: Authors' calculation, data from Russia's Central Bank and Customs Service
Figure 9: Refined product exports from Russia
90
60
Million ton
30
0
2002 2003 2004 2005 2006 2007 2008 2009 2010 2011 2012 2013 2014 2015 2016 2017 2018
Fuel oil Gasoil Jet kerosene Gasoline VGO Naphtha
Source: Authors, data from Argus
It is noteworthy that this calculation does not consider the additional costs associated with refining crude
oil or the higher unit costs of transportation (transporting crude oil over long distances via high diameter
pipelines costs less on a unit basis compared with transporting refined products by rail, which has been
the dominant shipping mode for products in Russia). But the importance of these statistics is that the
figures are official and simple to calculate. For many years the losses were well-known, but the
correction happened only recently. So the question is, why did the government allow this situation to
persist?
The explanation requires an analysis of the state of Russian refineries, and of Russian petroleum export
regulations, which are discussed in the next chapter.
10III. The paradox of Russia’s refining: the subsidy that went too far and lasted
too long
This brief overview of the Russian refining sector’s performance over the past two decades leaves us
with a paradox: despite low sophistication, poor yields, mismatch between demand and output, and
poor location and long transit distances for most of the refineries with regards to exporting refined
products, the sector seemed to be living through a golden age. Refining throughput grew from 173.8 mt
in 2000 to 287 mt in 2018, up 113.2 mt or 65 per cent for the period, implying a compound annual
growth rate of 2.8 per cent. Exports of refined products almost tripled from 62.6 mt in 2000 to 171.7 mt
in 2015, before declining to 149.3 mt in 2018 (but still demonstrating a compound annual rate of 4.9 per
cent). How was this possible?
In short, the ‘secret of success’ for Russia’s refining sector had been the state policies that channelled
oil rent from upstream to downstream, resulting in massive subsidies to refining operations. These
policies introduced significant price distortions in Russia’s markets for crude oil and refined products
and created artificial incentives to increase refining levels well over and above what was necessary to
meet domestic demand. They also caused the postponement of much needed rationalization and
modernization of the Russian refining industry and resulted in value destruction for Russia’s economy
measured in tens of billions of dollars. For a long time, many people raised concerns about the distorted
signals and incentives,8 but the systemic causes and regulatory mismanagement prolonged the agony
of biased regulatory instruments. The regulators’ failure to properly address the problem stemmed from
short-term planning horizons, unstable and conflicting priorities, and improvised stop-gap solutions that
introduced further distortions, making the ultimate task even more complicated.
Export taxes: the magic formula
The Russian government’s two major goals in regulating the domestic petroleum market have been
first, to keep refined product prices low for domestic consumers and, second, to avoid shortages,
especially during seasonal peak demand periods (in the autumn and winter months for fuels used in
electricity and heat generation, or in late spring and autumn for fuels needed by the agricultural sector).
The government’s main mechanisms for influencing product prices since the liberalization of crude oil
and refined product prices in 1995 have been indirect, and have ranged from restrictions on exports
(temporary, often seasonal bans on the export of selected products) to requirements for domestic
delivery (compulsory deliveries of refined products to customers in the Far North), and agreeing pricing
pacts with the oil companies.
Since 1999, crude production in Russia has grown very rapidly, but the expansion of its export pipeline
capacity has lagged. This has had several consequences. Integrated companies (VICs) have been able
to run surplus crude through their refineries and export the resulting refined products. Since the VICs
controlled both upstream and downstream assets, they paid low prices to their production subsidiaries
(through internal transfer pricing) while taking their profits downstream. The independents, however,
lacking refinery capacity, had to sell their crude into the small domestic commercial market, turning
them into captive suppliers to the Russian refineries. This caused domestic crude prices in the
commercial sales segment to drop to very low levels, especially during winter, when available export
facilities were even more restricted because of ice and bad weather. Low crude acquisition prices
supported healthy margins for Russian refineries despite their poor yields. At the same time, a large
portion of refined products (close to 40 per cent of total output) was flowing to export markets, which
was enough to ‘clear’ the domestic market. Thus, in contrast to relatively low domestic crude prices,
8
Sagers M. and Yermakov V. Russia’s Crude Oil Market and the Oil Refining Industry: Resting on a Razor’s Edge. CERA
Decision Brief, March 2006; Yermakov V. and Sagers M. A Potential Game-Changer: Implications of Recalibrating Russia’s Oil
Export Taxes. CERA Decision Brief, November 2008.
11refined product prices in Russia remained close to export parity levels. 9 Essentially, when Russian
companies had been unable to export crude, they had exported refined products as a ‘second-best’
alternative. It is noteworthy that unlike crude oil (most of which moves through the state-controlled
pipelines of Transneft), most refined products are moved by rail and were much harder for the state to
control administratively.
In this environment, export taxes on crude oil and refined products emerged as the most important
instrument of state regulation of the domestic petroleum market. They were easy to collect, and they
offered to the state an instrument for transferring the tax paid by exporters to domestic oil consumers
(by keeping domestic petroleum prices in Russia at lower levels compared with international prices,
through the export parity price formation mechanism).10
Although abolished in July 1996 under International Monetary Fund pressure, the crude oil export tax
was reintroduced in Russia in January 1999 and since February 2002 it has been set in federal law. It
varies in accordance with a sliding-scale formula linked to the price of Urals Blend in international
markets (with a two-month time lag). Under the original formula the crude oil export tax took effect when
the price for Urals Blend in international markets was above $15 per barrel (if the price was lower than
that, the tax was zero-rated) and was calculated as follows:
• 35 per cent of the difference between $15 and the actual price when Urals Blend ranged
between $15 and $20 per barrel ($109.50 and $146 per ton);
• 45 per cent of the difference between $20 and the actual price when Urals Blend ranged
between $20 and $25 per barrel ($146 and $182.50 per ton);
• 65 per cent of the difference between $25 and the actual price when Urals Blend exceeds
$25 per barrel ($182.50 per ton).
Export taxes on refined products were initially left to the government’s discretion rather than being set
by law. This changed briefly in 2003 with the passage of an amendment to the law on customs tariffs
that set export taxes on refined products at 90 per cent of the export tax on crude. This law was repealed
at the end of 2003, and the government was again free to adjust the tax through discretionary
administrative measures.
On 19 March 2005, a new law came into effect, establishing a new mechanism under which the export
duty on refined products was tied to the export tax on crude oil. The export tax for products was
calculated as the difference between the average export price of Urals Blend during the previous two
months and a non-taxable minimum of $109.50 per ton, multiplied by the coefficient 0.416 for light
products, or 0.224 for heavy products.11 Effectively, the linear formulae linked to the Urals price set the
marginal tax rate for crude oil at 65 per cent, for light refined products at 41.6 per cent, and for dark
refined products at 22.4 per cent. Different slopes in the linear formulae meant that in a low international
9
The principle of ‘export parity’ is based on the concept of a producer being able to choose freely between selling its product to
either the export or the domestic market. For producers in a net exporting country, the equilibrium price will be equal to the
international price minus all costs associated with exports, such as transportation, customs fees, export duties, etc. If the export
netback price is higher than the price in the domestic market, exports would go up, reducing domestic supply and pushing up
domestic prices, until the market clears.
10
Russia’s export tax serves as a wedge between international and domestic prices for crude oil and individual refined
products. Therefore, a change in the level of oil export taxes and the relative differentials has immediate consequences for
domestic crude and refined product prices, via the mechanism of the export parity price formation. For example, reducing the
export tax on crude oil would lead to much higher acquisition prices for Russian refineries and reduce their refining margin.
Reducing the export tax on light refined products would increase domestic wholesale prices for gasoline and diesel (and
support the refining margin) but would quickly increase end-user prices at the pump and feed into overall inflation. Increasing
the export tax on heavy refined products (residual fuel) would bring prices of mazut down in the domestic market, but would
create problems for the less sophisticated Russian refineries, where mazut constitutes a large share of output.
11
In Russia, the distinction between light (gasoline, diesel, jet kerosene) and dark (mazut, VGO, bitumen, asphalt, tar) refined
products is common.
12oil price environment the differentials between export taxes on crude and products would be relatively
small, but in a high oil price scenario they could grow very significantly. This, in turn, would mean that
with higher prices for Urals Blend, the share represented by the export tax on refined products, relative
to the crude oil tax, declines. The same principle applied to the tax differential between gasoil and
mazut. Even more importantly, the design of the tax implied that the higher the oil price, the better the
netbacks from exports of refined products and downstream operations would be vis-à-vis the netbacks
from exports of crude oil and upstream operations (assuming transportation costs would not change
much as prices changed).
At the time when this mechanism was designed and calibrated (2004) hardly anyone expected that
long-term oil prices would be higher than $40 per barrel. Indeed, the conservative long-term plans of
governments and companies alike assumed a real oil price of 25–30 dollars per barrel. Under these
price assumptions, the weighted average for Russia’s refined product exports (based on the proportions
for each major type of product in Russia’s actual export mix) worked out to about 58–60 per cent of the
export tax on crude oil.
The government’s desire was to channel some rent from the more profitable upstream to the struggling
downstream, by skewing the tax differentials between export duty for crude and products in favour of
Russia’s refiners. But what had been originally intended as a moderate refining subsidy, turned into a
completely different set of incentives in the high and rising oil price environment that brought the oil
price to the level of $143 per barrel in July 2008, and resulted in an average oil price of almost $90 per
barrel in 2006–2014 (see Figure 10). Under these price conditions, the absolute differentials between
the export taxes for crude oil and refined products skyrocketed, more than offsetting the higher
transportation and other costs involved in exporting refined products and making their export netbacks
better than those for crude oil – even for refineries with a poor product mix.
Figure 10: Russian export duties for petroleum products
500
450
400
350
US$ per metric ton
300
250
200
150
100
50
0
May-02
May-04
May-06
May-08
May-10
May-12
May-14
May-16
May-18
Jan-03
Jan-05
Jan-07
Jan-09
Jan-11
Jan-13
Jan-15
Jan-17
Jan-19
Sep-01
Sep-03
Sep-05
Sep-07
Sep-09
Sep-11
Sep-13
Sep-15
Sep-17
Crude oil Fuel oil Gasoil/middle distillates Gasoline Naphtha
Source: Authors, data compiled from multiple RF government resolutions
But not only was the Russian government providing direct financial incentives to export refined products
rather than crude oil, the higher effective tax rate on crude kept export parity levels depressed at home
and lowered crude oil acquisition prices for refineries in Russia. On the other hand, the relatively lower
export tax rates on refined products artificially raised the domestic price levels for diesel and mazut
(relative to a situation of equal tax treatment for crude oil and refined products), giving Russian refiners
another booster shot. As a result, Russian refining margins became the highest in the world and
13stimulated higher levels of refinery operations. Unfortunately, the effective subsidy for residual fuel oil
became so high that even simple distillation and subsequent substantial exports of mazut were resulting
in higher netbacks than those from crude oil exports. (See Figure 11)
Figure 11: Effective annual average export duty rates for crude oil and main refined products
in 2005–2010
400 355
350
300 274
252
250 207
197 197
200 179
US$ per metric ton
142 151
130 136 133
150 106
85 76 82 72
100
50
50
0
2005 2006 2007 2008 2009 2010
Crude oil Fuel oil Gasoil/middle distillates Gasoline Naphtha
Source: Authors, calculation on the basis of multiple RF government resolutions
As a by-product of this massive distortion (one that was giving wrong incentives to the industry to
expand simple distillation even at refineries that would never be competitive absent the subsidy) another
distortion emerged with regards to refinery modernization programmes that were already under
development. This problem stemmed from the existence of too large a difference in export taxes for
light and dark products. (See Figure 12)
Figure 12: Differences in export duty rates between crude oil and main refined products
400
350
300
250
US$ per metric ton
200
150
100
50
0
May-02
Jan-03
May-04
Jan-05
May-06
Jan-07
May-08
Jan-09
May-10
Jan-11
Jan-13
May-14
Jan-15
May-16
Jan-17
May-18
Jan-19
Sep-01
Sep-05
Sep-07
Sep-09
Sep-11
May-12
Sep-13
Sep-15
Sep-17
Sep-03
-50
Difference b/w export duty on crude oil and fuel oil
Difference b/w export duty on crude oil and gasoil
Difference b/w export duty on crude oil and naphtha
Source: Authors, data compiled from multiple RF government resolutions
14A consequence of this was the narrowing of price differentials (also called the crack spreads) in Russia’s
domestic market between mazut on the one hand and high-octane gasoline and diesel on the other.
The crack spread is an important stimulus to invest in the refinery upgrades needed to transform mazut
into premium products. Thus, to achieve a quick fix to the problem of profitability of residual fuel oil
exports in the near term, the policy actually reduced incentives to invest in the refinery upgrades needed
to cut the amount of residual fuel oil volumes produced in the long term.
While the state giveth, the refining sector taketh
In the artificial but attractive conditions created by state policies, the Russian refineries started to
expand their operations – cautiously at first, then with greater assertiveness. On a positive note, the
redirection of crude flows from export to domestic refineries allowed Russia to solve the problem of
export pipeline bottlenecks. The domestic market cleared, and domestic commercial prices reached
export parity levels. Since 2005, prices for both crude and products in the domestic market have
generally been at parity with export netbacks.12
During 2005–2014, refining throughput increased from 207.4 mt to 288.9 mt, up 38 per cent. The
increase in refinery throughput over the period amounted to 81.5 mt nationally, but the composition of
the corresponding incremental product output suggests little progress with regards to improving the
yields. (See Figure 13)
Figure 13: Incremental change in refined product output, 2014 versus 2005
35 289
300
21
250 16
207 6 3
200
Million ton
150
100
50
0
2005 Gasoline Jet kero Gasoil Fuel oil VGO, 2014
Naphtha,
other
Source: Authors, data from Argus
With regards to individual refineries, incremental additions varied significantly, evidently suggesting that
not all were able to take advantage of the situation to significantly expand their crude throughput.
Certain refineries in Russia were already running at high capacity utilization factors and so were simply
unable to take advantage of the incentives to significantly expand throughput, at least initially. Typically,
these were either refineries with high conversion ratios due to their superior secondary processing
capabilities, which made their previous level of throughput close to their maximum effective capacities
(such as Perm, Volgograd, Yaroslavl), or those with favourable market positions (Moscow). Others
could not expand significantly because they had such poor conversion ratios that the product slate
would deteriorate too much with significantly higher throughput, making it economically unattractive (for
12
High-octane gasoline was one exception, usually priced with premium to export netbacks.
15example Orsk). But as incentives grew stronger, most Russian refineries expanded. Moreover, new
refineries emerged – both relatively sophisticated (Antipinsky) and simple (Afipsky, Ilsky, Yaiskiy) – as
well as Novatek’s gas condensate processing plant in Ust-Luga, and a few smaller ‘teapot’ facilities.
The key beneficiaries were the less sophisticated refineries and those with poor location, because the
new incentives allowed them to economically utilize their idle primary processing capacity (see Figure
14). Thus, the expansion was of the wrong type – it boosted simple distillation and put upgrades on the
back burner.
A key question is: why was the situation not corrected immediately? For example, a ceiling could have
been put on the absolute differentials between crude oil and refined products, and a proper set of
incentives developed for each Russian refinery, ensuring that the subsidy was used for modernization
and necessary upgrades. In retrospect, it appears that neglecting this question has had dire
consequences for the industry and resulted in multi-billion losses, as demonstrated earlier.
One explanation is the ideology of promoting the ‘value-added’ processing at the expense of crude oil
exports, especially when Russian refineries had such underutilized production capacities. The fact that
the Russian refineries were not adding value (because they had to produce lots of ‘wrong products’
owing to a lack of conversion capacity and then dispose of the surplus at a loss) was simply ignored.
Figure 14: Incremental additions in throughput at Russian refineries, 2014 vs. 2005
Source: Authors, data from Argus
Another explanation for the lack of action by regulators was uncertainty over the continuity of the high
oil price environment and policy inertia. Indeed, the distortive features of the petroleum export taxes
appeared only when oil prices were high. In 2006 and 2007, many still believed that the high price was
transitory in nature and was going to give way to a return of moderate and even low oil prices. The
sharp price correction in 2008–2009 seemed to support this theory. Only when oil prices returned to
$100 per barrel territory in 2011–2014 and losses (arising from exporting refined products instead of
crude oil) sky-rocketed, did the necessity to act became inevitable. Unfortunately, it was too late. The
damage had been done.
16IV. Tax reform of 2009–2019 and its impacts
An important meeting of the Russian government with oil industry leaders in Kirishi (the site of the
Surgutneftegaz refinery) in February 2009 launched tax reform initiatives. The necessity of reining in
the refining subsidy was gradually emerging within the Russian government due to the realization of
the magnitude of the distortions it was causing to the downstream. But the immediate pressure to
change the export duties regime came from the upstream side and was caused by oil companies’
concerns over their ability to sustain oil output.
In 2009 Russia’s crude oil output reached a level of 10 million barrels per day, supported by several
new projects launched before the oil price collapse that year. But the fall of oil prices caused concerns
about the high costs of the next generation of Russia’s oil. In the absence of a new generation of
upstream projects, it would become critical to control decline rates in the old producing fields in the
mature Russian oil-producing basins (primarily West Siberia and Volga–Urals). Oil prices recovered in
2010, but diminishing returns at the brownfields and the high tax take were preventing Russian oil
companies from realizing their fields’ full potential. A barrel of oil could be priced at $100 in international
markets, but the wellhead netback for a Russian oil producer in West Siberia (after deducting export
tax, production tax, and transportation expenses) was only about $25 per barrel. Some of the marginal
fields in Russia, especially the ones with high water cuts 13 and high operating costs, were becoming
unprofitable, placing up to 10 per cent of Russia’s output into the ‘danger zone’.
One easy recipe for preventing a possible oil production decline was to reduce the marginal rate of the
export duty on crude oil. Once the export tax regime became subject to closer investigation, the
government decided to adjust marginal export tax rates for refined products as well.
The 60–66–90 system
In 2011, in a move that started the latest round of tax reforms in the Russian oil industry (this became
known as the ‘tax manoeuvre’14), the Russian government decreased the marginal rate of export tax on
crude from 65 to 60 per cent and equalized the export taxes for light and dark refined products at the
level of 66 per cent of the tax on crude (resulting in a marginal rate of 39.6 per cent). Previously, the
tax rate for heavy refined products was much lower than that for light products. The export tax rate for
gasoline and naphtha was increased to 90 per cent of the export tax on crude oil (resulting in a marginal
rate of 54 per cent). The new system became widely known as ‘60–66–90’.
This final element of the new design – introduced to curb domestic gasoline shortages – was probably
unnecessary. The intention of a higher export tax on gasoline was to keep the domestic market for
gasoline well-supplied and to have naphtha available to domestic petrochemical plants. But the effect
of the change was also to increase the spread between the domestic price of gasoline and diesel. The
government had introduced a wrong incentive yet again. 15
High-octane gasoline had not been exported from Russia in any significant volumes before the higher
export duty rate was introduced. Russia’s gasoline output was limited by insufficient conversion
capacity, but the volume produced matched domestic demand. Domestically, gasoline commands
healthy premiums over export netbacks. Simple distillation in Russia results in a yield of about 20 per
cent of gasoline and naphtha, and the higher export tax on these products was expected to reduce
incentives for the less sophisticated refineries. However, the 60–66–90 regime did not achieve its main
goal: to remove the foundation from export-oriented simple refining. The new calibration would have
13
Water-flooding, to increase reservoir pressure, is a traditional method of oil extraction in West Siberia. The pumping of large
amounts of oil/water mix using electric pumps increases electricity usage and contributes to higher operating costs.
14
Shifting the tax burden from upstream to downstream was apparently considered as being similar to troop redeployment,
hence the rather unusual term ‘manoeuvre’ started to apply to tax reform efforts.
15
This tax differentiation increased the spread between the domestic price for diesel and for gasoline. It also promoted
investments in hydrocracking that resulted in a higher output of diesel fuel (already available in excess in Russia) but prevented
investments in catalytic cracking that would have increased the output of high-octane gasoline, the product that Russia needed.
17You can also read