The Carbon Footprint of Fat Tire Amber Ale - THE NSERVANCY CLIMATE
←
→
Page content transcription
If your browser does not render page correctly, please read the page content below
THE
                                                 CLIMATE
                                                CO2NSERVANCY

The Carbon Footprint of
Fat Tire® Amber Ale

                          Some proprietary content (i.e. trade secrets)
                          has been withheld from this version.
Contents

Executive Summary                      01   Downstream     26

                                            Distribution   26

Definition of Terms                    02   Retail         27

                                            Use            28

Introduction                           04   Disposal       29

The Climate Conservancy                04
                                            Conclusions    31
Life Cycle Assessment (LCA)            04

Background of Beer LCA                 04
                                            References     32

Upstream                               05

Packaging & Non-consumable Materials   05

Consumable Materials                   09

Entity                                 20

Brewing Operations                     20

Manufacturing Waste Disposal           22

Corporate Behavior                     24
The carbon footprint of Fat Tire® Amber Ale   01

Executive Summary                              3,188.8 g CO2e
This report contains the results of work performed by The Climate Conservancy
in cooperation with New Belgium Brewing Company to assess greenhouse
gases emitted across the full life cycle of Fat Tire® Amber Ale.

System boundaries of the assessed life cycle encompass
acquisition and transport of raw materials, brewing opera-
tions, business travel, employee communting, transport                        6.6%
and storage during distribution and retail, use and                                                      2.3%
disposal of waste.
                                                                                                         2.3%
                                                                              3.9%
The carbon footprint of a 6-pack of Fat Tire® Amber Ale
(FT), or the total greenhouse gas (GHG) emissions during                      8.2%
its life cycle, is 3,188.8 grams of CO2 equivalents (g CO2e).

Of this total, emissions from New Belgium Brewing
Company’s own operations and the disposal of waste                            8.4%
produced therefrom account for only 173.0 g CO2e, or
5.4%. Upstream emissions during production and trans-                         6.0%
portation of packaging materials and beer ingredients add
up to 1,531.3 g CO2e, or 48.0% of total emissions. Down-
stream emissions from distribution, retail, storage and
                                                                            12.6%                             All Other Sources
disposal of waste account for the remaining 1,484.6 g
CO2e, or 46.6% of the total.                                                                                  CO2
                                                                                                              Paper
The largest line item in the tally of GHG emissions is
                                                                                                              Brewing Operations
electricity used for refrigeration at retail: 829.8 g CO2e.
The next largest sources are production and transportation                                                   Use
of glass and malt (including barley): 690.0 and 593.1 g                     21.6%
                                                                                                             Distribution
CO2e, respectively. These three sources alone account for
68.4% of all emissions embodied in a 6-pack of FT. The                                                        Malt
bulk of remaining emissions are accounted for by produc-                                                      Barley
tion and transportation of paper and CO2 for carbonation,
refrigeration in consumer’s homes, distribution transport,
                                                                                                              Glass
and natural gas consumed during brewing operations.                                                           Retail
These six sources account for another 25.1% of total
emissions per 6-pack of FT.
                                                                            28.1%

                                                                Figure 1. Carbon Footprint of Fat Tire® Amber Ale
                                                                showing major sources of GHG emissions by
                                                                percentage of total emissions.
02   The Climate Conservancy

Definition of Terms
While we have tried to keep this report as free of jargon as possible, following
are some abbreviations, terms and units that may not be familiar to all readers.

6-pack Six glass bottles of 12 fluid ounce capacity each,     Entity The business operation responsible for manufac-
packaged together in a paperboard carrier.                    ture of the product being assessed

Carbon Credits See “Offsets”                                  FT     Fat Tire® Amber Ale, a product and registered
                                                              trademark of New Belgium Brewing Company
Carbon Footprint The carbon footprint, or embodied
carbon, of a product or service is the total amount of        g or gram 0.035 ounces or 0.0022 pounds
GHGs emitted across the life cycle of a product. Though
there are non-CO2 GHGs that are included in the carbon        GHGs Greenhouse Gases. TCC’s assessment tracks the
footprint, the term arises from the most significant GHG:     six “Kyoto” gases regarded as most significant in terms of
CO2 (carbon dioxide).                                         their climate impact: carbon dioxide (CO2), methane (CH4),
                                                              nitrous oxide (N2O), hydrofluorocarbons (HFCs), perfluoro-
Carbon Emission Factor see “Emission Coefficient”             carbons (PFCs), and sulfur hexafluoride (SF6).

CO2e Carbon dioxide equivalent. A unit of GHG emis-           GWP Global Warming Potential. A number that is a
sions including non-CO2 gases that have been converted        nondimensional measure of the warming caused by
to an equivalent mass of CO2 according to their global        non-CO2 greenhouse gases relative to an equivalent mass
warming potentials (see GWP below).                           of CO2, defined over a specific period of time. For
                                                              instance, methane has a 100-year global warming poten-
Direct/Indirect These terms are used to refer to green-       tial of 25, meaning that over 100 years, a given mass of
house gas emissions that are immediately related to an        methane has the equivalent warming effect of 25 times as
operation or process, such as by combustion of fuel or        much CO2. Herein, we apply the 100-year global warming
leakage of refrigerant hydrofluorocarbon (direct), or         potentials prescribed in the Fourth Assessment Report of
released during the prior production of material or genera-   the International Programme on Climate Change (IPCC) in
tion of electricity (indirect). In the context of the GHG     2002.
Protocol of the World Resources Institute and World
Business Council for Sustainable Development                  Hectare 2.47 acres
(WRI/WBCSD), these terms are interchangeable with
“Scope 1” “Scope 2/3” emissions, respectively.                Kg or kilogram 1,000 grams or 2.2 pounds

Emission Coefficient Fossil sources of energy entail          LCA Life Cycle Assessment. An academic field
GHG emissions. The mass of GHGs emitted during                concerned with the accounting of material and energy
combustion of fuel or consumption of electricity that is      flows involved in the life cycle of a product or service, and
derived from combustion of fossil fuels elsewhere can be      the assessment of associated environmental impacts.
calculated using an Emission Coefficient or “carbon           TCC’s Climate Conscious Assessment is an LCA of
emission factor.” The US Energy Information Administra-       GHGs.
tion (EIA), the UK’s Department of Environment, Food and
Rural Affaris (DEFRA), and the World Resources Institute      Mt or Metric Ton 1,000 kilograms or 2,204.6 pounds
(WRI), all provide databases of Emission Coefficients. But
note that the Emission Coefficients provided by these         NBB New Belgium Brewing Company of Fort Collins,
sources relate only to GHGs produced during combustion        Colorado
of fuel or consumption of electricity, and NOT the GHGs
emitted during the production and delivery of that fuel or
electricity.
The carbon footprint of Fat Tire® Amber Ale   03

Offsets GHGs removed from the atmosphere (e.g. by
growing trees) or prevented from escaping to the atmo-
sphere (e.g. by capturing exhaust from power plants or
gases released from landfills) have been commoditized by
companies and organizations which market them as a
means of “offsetting” comparable masses of greenhouse
gases emitted elsewhere. Purchasers of offsets often
seek to obtain amounts sufficient to compensate for all
their direct emissions, thus making their
product/service/activity “carbon neutral.” TCC’s assess-
ment does not consider offsets, since we are seeking to
quantify the GHGs emissions immediately related to the
production system.

RECs Renewable Energy Credits/Certificates. Electricity
generated from renewable resources (e.g. wind, solar,
geothermal) and fed into one of the national power grids is
assumed to reduce demand for electricity generated from
fossil fuels (e.g. coal, natural gas, oil) on a 1:1 basis. As
such, there is a market for certificates representing
electricity generated from renewable resources that
effectively allows renewable sourcing of electricity at any
location.

TCC The Climate Conservancy, a non-profit located in
Palo Alto, California

Ton Where not specified Metric Ton or abbreviated Mt,
“ton” refers to a short ton of 2,000 lbs.
04 The Climate Conservancy
Introduction
This report was prepared for New Belgium Brewing Company to help the
company manage greenhouse gas emissions throughout the supply chain
of Fat Tire® Amber Ale.
The Climate Conservancy Life Cycle Assessment
The Climate Conservancy (TCC) is a California nonprofit The Climate ConsciousTM Assessment is a product-level
corporation founded by concerned members of elite GHG inventory based on the principles of process life
academic and business communities. Our mission is to cycle assessment (LCA). TCC works with the companies
reduce greenhouse gas (GHG) emissions by informing whose products we assess to tally the GHGs emitted
consumers of the relative climate impacts of products and during the complete life cycle of their product. The life
services that they purchase on a daily basis. We achieve cycle of a product, as defined by the system boundaries of
this by working in partnership with members of private our LCA methodology, include the production of all raw
industry to quantify the GHGs emitted during the life cycle and manufactured materials, conversion of those materials
of their companys’ product(s) using our Climate into finished products and co-products, processing of
ConsciousTM assessment methodology and by offering waste, product packaging, storage and transportation of
assessed companies the licensed use of our Climate products during distribution and retail, in-use emissions,
ConsciousTM label in connection with their product, disposal or recycling of the product, as well as immediate
provided certain criteria are met. offset projects and any other innovative solutions of the
company whose products are under assessment.
Our objective in coupling life cycle assessments with an
associated labeling program is to create a consumer Background of Beer LCA
driven and market-based mechanism that promotes the
consumption of products with low GHG intensity and that To our knowledge, there have been only a few attempts at
provides companies with the ability to further differentiate performing an LCA of beer. Those that we were able to
their products in the market. Moreover, as GHG emissions find are largely academic in nature and none attempted to
become increasingly commoditized and regulated, our quantify the GHG emissions associated with a particular
Climate ConsciousTM assessment tool will provide increas- brand of beer (Talve, 2001; Narayanaswamy et al., 2004;
ing value to companies that wish to better manage their Garnett, 2007). Previous efforts have generally used
GHG assets and liabilities. In concert, we believe our either a more consequential approach in quantifying the
services to industry will play a significant role in, and GHG emissions associated with decisions made in the
provide an efficient means for the inevitable transition to a brewing process or have focused on the overall contribu-
low carbon economy. tion of the GHG emissions from the beer industry to the
total emissions of all industries. Though the LCA method-
ologies and system boundaries of previous assessments
are quite similar to those defined and used by TCC, the
influence of qualitative data and/or the incompleteness of
certain other data make it difficult to compare previous
results to the results of this assessment.
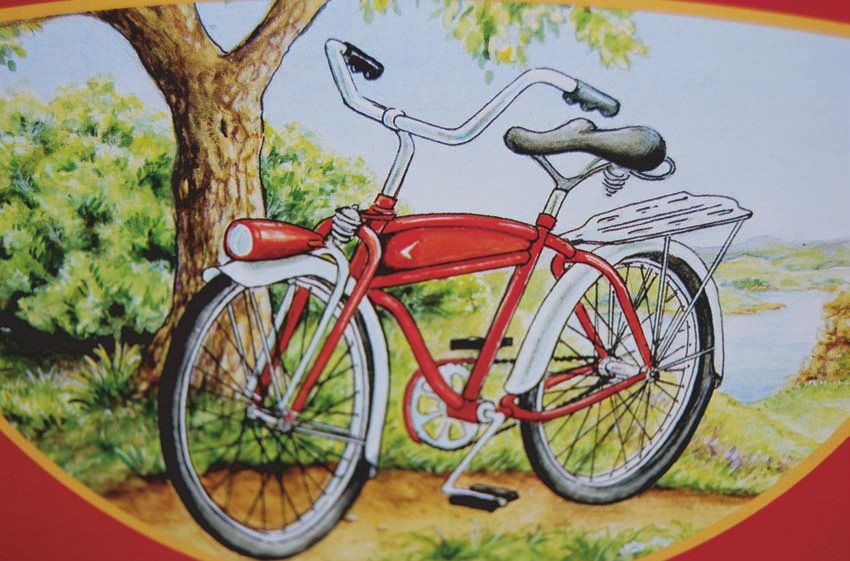
Figure 2. Life cycle of a 6-pack of Fat Tire® Amber Ale
Raw Material Beer Distribution Use Waste
Acquisition Manufacture and Retail (Consumption) DisposalThe carbon footprint of Fat Tire® Amber Ale 05
Upstream 1,531.3 g CO2e
Emissions assessed in this section are those associated with
the acquisition of raw materials and any pre-processing of those
materials prior to their delivery to NBB.
Packaging & 853.3 g CO2e
Non-consumable Materials
Glass 690.0 g CO2e
Production of packaging materials using virgin inputs
results in GHG emissions due to the extraction and Production 688.2 g CO2e
transportation of raw materials, as well as the manufacture Virgin Inputs
of the packaging material. Emissions from both the
transportation of virgin inputs as well as the manufacturing The raw materials used in glass production are: wet
process are included as part of the production of packag- sand, soda, Chempure sand, limestone, dolomite,
ing materials. Calumite brand slag, nephylene syenite, feldspar,
sodium sulphate, iron chromite and water. They are
Production of packaging materials using recycled inputs typically melted at 1400oC to form glass (Edwards and
generally requires less energy and is therefore preferable Schelling, 1999). GHG emissions result from quarrying
to the use of virgin materials. Though the transportation of raw materials, transportation, and fuel consumption in
material recovered for recycling also results in GHG the production process.
emissions, these emissions are accounted for in the
disposal phase (page 30). In this section, we consider The combined process and transportation emissions
GHGs emitted during the manufacture of packaging resulting from glass manufacturing from 100% virgin
materials from recycled inputs based on analyses of the inputs is 0.66 Mt CO2e per ton of glass produced (1
US Environmental Protection Agency (EPA, 2006).1 metric ton = 1,000 kilograms). The mass of glass in a
6-pack of FT is 1,210 g (2.67 lbs),2 hence the GHG
emission is 724.5 g of CO2e.
Recycled Inputs
All Other Sources Glass produced using recycled inputs permits substan-
Cardboard tial energy savings because recycled glass cullet
requires a lower melting temperature (1250oC) in the
CO2
manufacturing process (Edwards and Schelling, 1999).
Paper Emissions resulting from producing glass using 100%
Malt recycled cullet is 0.33 Mt CO2e per ton, yielding
362.2 g of CO2e for the glass contained per 6-pack.
Barley
Glass Mix of inputs
Products can be manufactured using a mix of virgin
and recycled inputs. Although the national average
percentage of recycled input in the production of glass
is 23%, the mix of inputs used by Owens-Illinois, Inc. to
manufacture bottles for NBB is 10% recycled.3 Using
Figure 3. Major sources of upstream GHG this figure for the mix of inputs, the weighted average
emissions by percentage of total upstream GHG emission is then 688.2 g of CO2e for the produc-
emissions. tion of glass contained in one 6-pack of FT.
Distribution
and Retail
1
Environmental Protection Agency, Solid Waste Management and Greenhouse Gases: A Life-Cycle Assessment of Emissions and Sinks 2006 (available online
at http://epa.gov/climatechange/wycd/waste/SWMGHGreport.html)
2
This figure includes a scrap rate of 5%. NBB data, “6 Pack BOM 082907 (with scrap loss rates).xls” (Tranche 2)
3
Information throughout this section regarding mix of inputs used by NBB was provided by NBB during a telephone conversation with Jenn Orgolini on
March 11, 200806 The Climate Conservancy
Transportation 1.8 g CO2 Mix of inputs
Twelve ounce brown glass bottles are delivered to NBB
from Windsor, Colorado, a distance of 16 miles. These The national average percentage of recycled input in
bottles are shipped by OTR (over the road) truck. the production of paper is 4% and that of paperboard is
Because specific information was not available , it is 23%. However, inputs to FT are 0% and 100%,
assumed in the calculations that the truck type is a respectively, so that the weighted average GHG
Class 8 tractor-trailer with an average fuel efficiency of emissions for the paper and paperboard content of one
6.3 mpg (miles per gallon),4 a maximum cargo weight 6-pack are 8.7 g of CO2e (paper) and 53.9 g of CO2e
of 20,000 kg and using standard diesel fuel. For a (paperboard).
truck to be defined as a Class 8 truck, the minimum
gross vehicle weight must be 15,000 kg. However, for
profitability and in light of recent higher fuel costs, it is Transportation 11.5 g CO2
assumed herein that shippers are shipping at the
Paper bottle labels are shipped 946 miles from
maximum federal weight limit of 36,363 kg.
LaCrosse, Wisconsin to NBB. Although the labels are
shipped less than truck load (LTL) it is assumed that
The sixteen-mile trip requires 2.54 gallons of diesel
the majority of the travel distances are similar to that of
fuel. The production and transportation of a gallon
the glass bottle shipment and the same assumptions
diesel fuel contributes 11.8 kg of CO2 to the environ-
apply. The entire trip consumes 150.16 gallons of
ment (West and Marland, 2002). The entire trip then
diesel fuel that represents a total CO2 output of
emits 29.96 kg of CO2. Allocating this CO2 per 6-pack
1,771.67 kg. Allocating for the mass of the labels per
results in a total amount for the transportation of bottles
6-pack results in a total amount of 0.5 g of CO2.
of 1.8 g of CO2.
6-pack carriers are shipped from the Sierra Pacific
Paper 74.0 g CO2e Packaging (SPP) plant in Oroville, California at a
distance of 1,112 miles after being transported from
Production 62.5 g CO2e Altivity Packaging in Santa Clara, California, a distance
Virgin Inputs of 183 miles. Although SPP provided detailed informa-
tion concerning their operations and shipping, we were
Beer bottle labels and 6-pack carriers are composed of not able to ascertain specific information concerning
paper and paperboard, respectively. When 100% shipping (make, model, year and fuel economy). Using
virgin inputs are used for the production of paper, GHG our standard shipping assumptions, the trips require
emissions during transportation and manufacture are 205.56 gallons of diesel fuel and correspond to a total
1.69 Mt CO2e per ton.5 Paperboard production is of 2,425.27 kg of CO2 per trip. Each 6-pack carrier
responsible for 1.17 Mt CO2e per ton.6 The weight of 6 contributes 11.0 g of CO2 to that total.
labels is approximately 5.7 g (The carbon footprint of Fat Tire® Amber Ale 07
Recycled Inputs Mix of inputs
Process emissions during the manufacturing of card- Specific data regarding the mix of inputs used by the
board from 100% recycled inputs correspond to 0.92 Pelliconi Group was not available. In the US, the
Mt CO2e per ton. In this case, production of 0.13 lb of average percentage of recycled input in steel products
corrugated cardboard therefore results in 50.0 g of is 28%. Assuming a mix of virgin and recycled inputs
CO2e. is used, the weighted average of GHG emissions from
the manufacturing of 6 steel crowns is 16.0 g of CO2e.
Mix of inputs
NBB inputs match the national average percentage of Transportation 1.4 g CO2
recycled input for the production of corrugated card- Beer bottle crowns are manufactured in Atessa, Italy.
board is 35%. The weighted average GHG emission Because only limited information regarding the
for the production of cardboard from this mix of inputs shipping of crowns was provided by the Pelliconi
is 47.4 g of CO2e per 6-pack of FT. Group, it has been assumed that the crowns are
shipped by truck from Atessa to the port in Napoli, a
distance of 111 miles via Class 8 truck (or named EU
Transportation 0.4 g CO2e
equivalent). Truck fleets in the EU have higher fuel
The corrugated cardboard coming from Temple Inland efficiency than those in the United States, with a 2002
travels 65 milles from Wheat Ridge, Colorado to NBB, average of 7.1 mpg traveling at 63 miles per hour and
a journey that consumes 10.32 gallons of diesel fuel 8.4 mpg traveling at 54 mph.12 Another source rates
per truckload. A full truckload contributes 121.73 kg of the 2002 Volvo truck within the EU at 7.8 mpg.13
CO2 and allocating this mass over the mass of the Travel speeds in Italy are restricted to 61 mph, with
cardboard used in the production per 6-pack of FT trucks and buses restricted to even slower speeds,
creates 0.4 g of CO2. thus increasing the fuel efficiency of the vehicle.
However, it is assumed that congestion will decrease
Steel 17.4 g CO2e the effective fuel efficiency of an EU fleet truck. The
number assumed here is 1 mpg higher than the fuel
Production 16.0 g CO2e efficiency of the US (6.3 mpg) or 7.3 mpg. With these
Virgin Inputs figures, the diesel use from Atessa to Napoli is 15.21
gallons, a volume of fuel that generates 178.97 kg of
Steel is used in beer bottle crowns.9 Six of these CO2 (assuming that emission standards are equivalent
crowns weigh approximately 5.7 g (08 The Climate Conservancy
Adhesive 7.6 g CO2e
From Newark, the crowns are transported via Class 8 Production 7.5 g CO2e
truck to NBB over a distance of 1,767 miles. This trip The adhesive used by NBB to apply paper labels to
will consume 280.48 gallons of diesel fuel and emit glass beer bottles is a combination of natural starch
3,309.24 kg of CO2. The 5.6 g of crowns will account and synthetic resins.17 The adhesive is manufactured
for 0.9 g of CO2. in batches in Sacramento, California. The most
energy-intensive steps during manufacture are heating
and steaming of the adhesive mixture. Reliable
Wood 16.0 g CO2e sources on the energy requirements of glue manufac-
ture were not available. Emissions during its manufac-
Production 16.0 g CO2e ture are instead estimated using the known carbon
Virgin Inputs emissions factor for the production of resin-based
LDPE (2.35 Mt CO2e per ton of LDPE), which we
Dimensional lumber is used in the production of wood believe to be a liberal estimate in this case. Based on
pallets for easier packing and transportation of goods. this assumption, GHG emissions resulting from produc-
Its production using virgin wood results in GHG emis- tion of label adhesive used per 6-pack are 7.5 g CO2e.
sions of 0.18 Mt CO2e per ton of wood. One 6-pack
occupies a fraction of a pallet equal to 0.28%. The Note that many manufacturers use casein-based glues
mass of lumber allocated to one 6-pack of FT is to apply paper labels to glass bottles (Ciullo, 1996;
approximately 96.4 g (0.21 lb),16 which represents 16.0 Fairley, 2005). Casein is a protein obtained from
g of CO2e from wood production. bovine milk, and is generally imported to the US from
eastern Europe or New Zealand (Richert, 1974; Kelly,
Recycled Inputs 1986; Southward, 2008). As a product of the dairy
industry (which is a large source of CH4 emissions) that
There is no reduction of GHG emissions due to recy- is shipped from overseas, casein glues are likely to
cling of lumber; emissions during recycling of lumber entail greater CO2e emissions that the glue used by
products are also 0.18 Mt CO2e per ton of wood. NBB.
Production of 96.4 g of dimensional lumber from
recycled material therefore results in the same 16.0 g
of CO2e. Transportation 0.1 g CO2e
Label glue and hot melt glue used for cases come from
Mix of inputs Sacramento, California and Eden Prarie, Minnesota,
respectively. Assuming that the density of label glue is
Dimensional lumber is not manufactured using a mix of near 1 g per mL, the 0.95 mL of glue for each 6-pack
recycled and virgin inputs. would weigh 0.95 g. Over the 1,101 miles from Sacra-
mento, California to NBB, the transportation of the glue
Transportation 0 g CO2 would emit 0.07 g of CO2.
Wooden pallets from Rocky Mountain Battery and
The amount of hot melt glue used to secure cases was
Recycling travel only one mile to NBB that consumes
not provided to TCC. However, by assuming that the
0.16 gallons in a Class 8 truck. The trip thus consti-
density and mass of the glue used is similar to that of
tutes an emission of 1.87 kg of CO2. Allocating the
the label glue, we have assumed that the transporta-
96.4 lb of pallet associated with one 6-pack of beer is
tion of this glue would emit 0.07 g of CO2, for an
0.01 g of CO2. Contributions of less than 0.01 g CO2
adhesive total of 0.1 g of CO2 per 6-pack.
are counted as effectively nothing throughout this
report.
16
Scrap rate equals 0.5%. NBB data, “6 Pack BOM 082907 (with scrap loss rates).xls” (Tranche 2)
17
Telephone conversation with Pacific Adhesives on February 28, 2008The carbon footprint of Fat Tire® Amber Ale 09
Plastic 0.5 g CO2e Consumable Materials 678.0 g CO2e
Production 0.5 g CO2e Malt 593.9 g CO2e
Virgin Inputs
Barley Agriculture 394.1 g CO2e
The basic ingredients in all plastics are resins derived
Cultivation of barley (Hordeum vulgare L.) results in
from petroleum oil or natural gas. Other chemical
GHGs emitted during production of seeds, fertilizers,
additives are mixed with the melted resin to form the
pesticides and soil amendments, operation of farm
final plastic product. Production of low-density polyeth-
equipment (including irrigation) and emissions from the
ylene (LDPE), 230 mg (0.23 g or 0.002 lb) of which is
soil (Lal, 2004a). While storage of organic carbon (C)
used as stretch-wrap per 6-pack of FT,18 from 100%
in the soil may theoretically offset emissions, the
virgin materials (including manufacture and transporta-
required management practices are not widely used
tion) causes emission of 2.35 Mt CO2e per ton of LDPE
(West and Marland, 2002; Lal, 2004b; Mosier et al.,
produced. GHG emissions allocated to one 6-pack are
2005).
then 0.5 g of CO2e.
Nationwide, yield per cultivated hectare of barley in
Recycled Inputs
2006 was 3.28 Mt (3,281.85 kg).19 In the calculations
below, we use this figure to allocate emissions during
Different types of plastic resins have different molecular
agriculture to a given mass of barley. It should be noted
structure and yield various finished products. The
that malt barley yields are typically less than feed
different molecular structures cause plastics not to mix
barley, where more nitrogenous fertilizer may be
when melted, so that they need to be separated from
applied without concern for protein content and kernel
each other prior to recycling in order for the recycled
plumpness.20 However, because roughly two-thirds of
resin to be of high quality. In the case of LDPE,
the US barley grown in 2006 was malt barley,21 we
processing of recycled material results in emission of
believe the national yield statistics are representative.
0.15 Mt CO2e per ton of plastic produced. Thus, the
manufacture of stretch-wrap material associated with
There is a potential for agricultural lands to reduce
one 6-pack results in 10 mg (0.001 g) of CO2e emis-
carbon emissions and even sequester atmospheric
sions.
carbon as organic carbon in the soil by adopting no-till
techniques, integrating fertilizer and pest control
Mix of inputs
practices, and increasing the efficiency of irrigation
systems (West and Marland, 2002; Lal, 2004b).
The national average percentage of recycled input in
However, conventional farming practices are carbon
the production of LDPE is 4%. Using this mix of inputs,
intensive and also quite disruptive to soil carbon
we estimate 0.2 g of CO2e emissions per 6-pack of FT.
reservoirs used (West and Marland, 2002; Lal, 2004b;
Mosier et al., 2005). Though we have quantified GHGs
Transportation 0 g CO2 emitted throughout agricultural production, we do not
Shrink wrap supplied by Katzke in Denver, Colorado is assess soil carbon storage owing to the high degree of
transported 65 miles to NBB, a trip that consumes variability associated with exchanges of soil carbon
10.32 gallons of diesel fuel. This amount of diesel (depending heavily on such details as soil type, the
emits a total of 121.73 kg of CO2 into the atmosphere time-distribution of irrigation water, and the speed of
and allocated to an individual 6-pack amounts to 0.01 g plowing).
of CO2.
18
Scrap rate equals 1%. NBB data, “6 Pack BOM 082907 (with scrap loss rates).xls” (Tranche 2)
19
Per crop reports of the US Department of Agriculture:
www.fas.usda.gov/psdonline/psdgetreport.aspx?hidReportRetrievalName=BVS&hidReportRetrievalID=885&hidReportRetrievalTemplateID=1
20
See note of Jackson, G., soil scientist at the University of Montana’s Western Triangle Ag. Research Center, Conrad, MT:
http://landresources.montana.edu/FertilizerFacts/24_Nitrogen_Fertiliztion_of_Dryland_malt_Barley.htm
21
www.ag.ndsu.edu/ibms/newsletters/IBMS%20Newsletter%20Dec%2006.pdf10 The Climate Conservancy
Tillage
Seed Production 40.3 g CO2e
Mechanical preparation of the seedbed requires fuel for
In the US, North Dakota, Idaho, Montana, Washington, operating farm equipment. Fuel use depends upon
and Minnesota produce the bulk of malt barley, and depth of tillering, soil density, tractor speed, the type of
barley is generally planted in spring as soon as a tilling equipment used, and the size the tractor used
seedbed can be prepared. Emissions during produc- (Collins et al., 1976; Collins et al., 1980; Lal, 2004a).
tion of barley seed have been previously estimated at Lal (2004a) compiled and published average CO2e
1.47 kg CO2e per kg seed (West and Marland, 2002). emissions from multiple studies, breaking out emis-
Recommended seed application is between 72.85 and sions by equipment type. Statistical data of tillage
145.72 kg per hectare (1 hectare = 2.47 acres).22 practices of US barley growers was not available.
Thus, seed for a single hectare relate to emissions of Instead, Table 2 shows average emissions related to
between 106.85 and 213.72 kg CO2e. conventional tillage (moldboard plow), reduced tillage
(chisel plow or disking) and no-till (drill only), allocated
Using the upper estimate of CO2e emissions and the to a 6-pack of FT based on 2006 barley yield. For the
average yield in 2006, 65.1 g of CO2e emissions from final calculations, we have assumed conventional
seed production were embodied in each kilogram of tillage was practiced, emitting 24.4 g of CO2e.
barley crop. Assuming a ratio of barley:malt of 4:3, the
618 g of barley used to brew a 6-pack of FT account
for 40.3 g of CO2e emissions.23 Irrigation 61.6 g CO2e
While barley may be grown in dryland environments
Agricultural Machinery Production 48.3 g CO2e
without irrigation,26 data from the USDA’s 2002 Census
Tillage, planting, spreading, spraying and harvesting of Agriculture indicates that 77% of barley cultivated in
typically entail agricultural machinery which require the US is from irrigated farms.27 Protein content
energy (Lal, 2004a). requirements of grain intended for malting may mean
the percentage of irrigated malt barley is even higher.28
Sowing, Spreading, Spraying, Harvesting
Typical supplemental irrigation of 25 to 50 cm
Other farm operations that require fuel are planting, (Franzluebbers and Francis, 1995) relates to CO2e
spreading of fertilizer, spraying of fertilizers and pesti- emissions of between 26.4 to 3,117.4 kg per hectare,
cides, and harvesting. CO2e emissions per hectare for depending on the source of energy and specific factors
different operations are shown in Table 1. Because of the irrigation system (Dvoskin et al., 1976;
statistical data of farm practices of US barley growers Schlesinger, 1999; Follet, 2001; West and Marland,
was not available, we assume: (1) planting was on a 2002). Besides application of water, the installation of
conventionally tilled (CT) seedbed, (2) fertilizers were different irrigation systems may demand energy
broadcast in granular form on all of the barley crop in annually. In 2003, 71% of irrigated barley received
separate applications, (3) pesticides were sprayed in water from pressure distribution systems, most often
the same proportion as for barley grown in North from “center pivot and linear move” sprinkle systems
Dakota,24 and (4) harvesting was 50% straight combin- (43% of total irrigated crops), and 29% were watered
ing and 50% combined after windrowing.25 Using from gravity-fed systems.29
these assumptions, CO2e emissions from farm opera-
tions per 6-pack of FT total 23.9 g.
22
Recommended seed application supplied by North Dakota Barley Council for malt spring barley: http://www.ndbarley.net/malt_barley.html and North Dakota
State University Agriculture Communction: http://www.ext.nodak.edu/extnews/newsrelease/2001/031501/06seedin.htm
23
See http://www.prairiemaltltd.com/maltingprocess.html for discussion of the ratio of barley to malt
24
See, www.ipmcenters.org/cropprofiles/docs/NDbarley.html, www.ag.ndsu.nodak.edu/aginfo/entomology/entupdates/ICG_08/02_BarleyInsects08.pdf, and
www.ag.ndsu.edu/pubs/plantsci/pests/pp622/pp622.pdf
25
See the publication of the American Malting Barley Association describing harvesting methods to prevent damage to kernels of malting barley:
www.ambainc.org/pub/Production/Harvesting.pdf
26
See, e.g., the article by Jackson, G. (infra note 20)
27
Available at: http://www.agcensus.usda.gov/
28
See, http://www1.agric.gov.ab.ca/$department/deptdocs.nsf/all/irr1245
29
USDA 2002 Census of Agriculture (infra note 27)The carbon footprint of Fat Tire® Amber Ale 11
Table 1. Carbon dioxide equivalent emissions from miscellaneous
farm operations during cultivation of malt barley (total reflect assump-
tions noted in text)
Operation kg CO2e per hectarea g CO2e per 6-pack of
Fat Tire® Amber Ale
Planting
Plant/Sow/Drill 11.7 2.2
No-Till Planting 13.9 2.6
Total 2.2
Fertilizer Spreading
Combined Application 27.9 5.3
Separate Applications (x2)b 55.7 10.5
Total 10.5
Pesticide Spraying (Total) 5.1 1.8
Harvesting
Harvesting 29.0c 7.8
Windrower 17.6 3.3
Total 9.5
Grand Total 23.9
a
Lal (2004a)
b
Because K fertilizer is not frequently applied, only two applications are included
c
Average of “Corn and Soybean Combines” reported by Lal (2004) and the “Harvest
Combine” reported by West and Marland (2002)
Table 2. Carbon dioxide equivalent emissions from
different tillage practices in the cultivation of malt barley
Tillage kg CO2e per hectarea g CO2e per 6-pack of
Fat Tire® Amber Ale
Conventional Till
Moldboard Plowing 55.7 10.5
Disking (x2) 51.7 9.7
Field Cultivation 14.7 2.8
Rotary Hoeing 7.3 1.4
Total 129.4 24.4
Reduced Till
Disking (x2) 51.7 9.7
Field Cultivation 14.7 2.8
Rotary Hoeing 7.3 1.4
Total 73.7 13.9
No Till
Disking (x1) OR 21.3 4.0
Chisel Plow 29.0 5.5
Total (avg) 25.1 4.7
a
Lal (2004a)12 The Climate Conservancy
Weighting the proportion of dryland crops and irrigation Production, transport, storage and transfer of phos-
methods used in the US, the average of CO2e emis- phatic fertilizer has been determined to cause 0.73 ±
sions associated with barley irrigation over a 6 month 0.22 kg of CO2e per kg of fertilizer (Lal, 2004a). This
growing season is 23.7 kg per hectare for irrigation represents 10.0 g of CO2e per kilogram of barley, or 6.2
system installation (Batty and Keller, 1980; Lal, 2004a), g per 6-pack of FT.
and 303.4 kg per hectare for water application (Dvoskin
et al., 1976; ITRC, 1994; Follet, 2001; West and Potassium
Marland, 2002).30 Using 2006 barley yield statistics
described above, we find 61.6 g of CO2e from barley Barley also has a low demand for potassium (K), and
irrigation are embodied in a 6-pack of FT. application of K fertilizer is often not required.36 How-
ever, for purposes of this assessment we assume K
fertilizer is applied in moderation to achieve average
Fertilizer and Soil Amendments 123.2 g CO2e
yield, at a rate of 67.25 kg K2O per hectare (60 lbs per
Nitrogen acre).37
Commonly, contracts for malt barley specify a minimum Production, transport, storage and transfer of potassic
of 75% kernel plumpness. Because plumpness is fertilizer has been determined to cause 0.55 ± 0.22 kg
related to fertilization and yield, spring barley intended of CO2e per kg of fertilizer (Lal, 2004a). This repre-
for malting demands somewhat less nitrogen (N) than sents 11.3 g of CO2e per kilogram of barley, or 7.0 g
feed barley. Application rate of N fertilizer is generally per 6-pack of FT.
determined with regard to soil test results and the
preceding crop.31 For purposes of this assessment we Micronutrients and Lime
assume urea-N fertilizer is applied in moderation to
achieve average yield, at a rate of 95.0 kg per hectare Very rarely, barley requires addition of sulfur or copper
(85 lbs per acre).32 This is consistent with a ratio of N fertilizer. For purposes of this assessment, we have
to barley of ~2.9 to 100.33 assumed none.
Production of nitrogenous fertilizer is energy intensive, Soil pH less than 5.3 can significantly diminish barley
as fixation of atmospheric N2 means breaking a strong yields. Amendment of soil with agricultural lime
triple bond at the molecular level. Previous studies of (CaCO3) at the rate of 2.2 to 4.5 Mt per hectare (1 to 2
N fertilizer estimate 4.8 ± 1.1 kg of CO2e emissions per short tons per acre)38 may improve yields on acidic
kg of fertilizer produced, transported, stored and soils (Tang and Rengel, 2001). The benefits of such
transfer to location of use (Lal, 2004a; Samarawick- liming persist for at least 15 years (Tang and Rengel,
rema and Belcher, 2005). Based on 2006 barley yield, 2001).
this amounts to 138 g of CO2e per kilogram of barley,
or 85.3 g per 6-pack of FT. Production, transport, storage and transfer of lime has
been determined to cause 0.59 ± 0.40 kg of CO2e per
Phosphorus kg of lime (Lal, 2004a). Assuming an average applica-
tion of 3.4 Mt per hectare and 2006 yields over a 15
Barley has a relatively low demand for phosphorus (P), year period, this amounts to 40.1 g of CO2e per kg of
and where soil analysis shows very high residual barley, or 24.8 g per 6-pack of FT.
phosphate, application of P fertilizer may not be
required.34 In most cases, however, P fertilizer is
applied. The recommended application rate depends
on soil testing, but for purposes of this assessment we
assume P fertilizer is applied in moderation to achieve
average yield, at a rate of 44.8 kg P2O5 per hectare (40
lbs per acre).35
30
The emissions factor for water application represents an average of data from all of the cited studies
31
An example of how growers determine appropriate N fertilizer requirements of barley is described by a study from the University of Idaho and Washington
State University: http://info.ag.uidaho.edu/pdf/CIS/CIS0920.pdf
32
This assumption is premised on the guidance of the University of Idaho/Washington State University study (infra, note 5) and the University of Minnesota
extension service: http://www.extension.umn.edu/distribution/cropsystems/DC3773.html
33
Recommended ratio of fertilizer N to yield of dryland (2-row) malting barley supplied by Grant Jackson, soil scientist at the University of Montana’s Western
Triangle Ag. Research Center, Conrad, MT: http://landresources.montana.edu/FertilizerFacts/24_Nitrogen_Fertiliztion_of_Dryland_malt_Barley.htm
34
This assumption is premised on the guidance of the University of Idaho/Washington State University study (infra, note 5) and the University of Minnesota
extension service: http://www.extension.umn.edu/distribution/cropsystems/DC3773.html
35
Ibid.The carbon footprint of Fat Tire® Amber Ale 13
Pesticides 0 g CO2e Barley Transport 8.0 g CO2e
A host of insecticides, herbicides, and fungicides are Barley is purchased either as a commodity on the open
routinely used on barley seed and growing barley. We market or from previously approved growers, as in the
examined the carbon intensity of such treatment in case of malt purchased by Coors Brewing Company
detail based on reported emissions for production and (Coors). One of Coors’ trademarks is that of a com-
transport of these chemicals (Lal, 2004a), the percent- pletely integrated regional brewer who sources all of its
age of barley treated, and prescribed application malting barley needs directly from producers through the
rates.39 In the end, the GHGs associated with these use of production contracts.41 However, in times of
chemicals are vanishingly small when allocated to a drought or poor general barley quality, malting opera-
single 6-pack of FT (~0.01 g). tions must look farther from Colorado into Canada for
barley. Because of the commoditized nature of barley
Soil Emissions 120.8 g CO2 and the potential of varying supply and quality from
Nitrous oxide (N2O) is emitted directly from cultivated approved growers, the GHG emitted during its transpor-
soils depending on the amount and type of N fertilizer tation can only be estimated very roughly. Because
applied, the type and yield of crop, and the methods of 2006 was a drought year in Colorado, Coors received
tillage and managing of crop residues shipments of barley by rail from grain elevators in Burley,
(Samarawickrema and Belcher, 2005; IPCC, 2006). Idaho; Huntley, Montana; Worland, Wyoming and Monte
IPCC guidelines suggest that ~1% of N added in Vista, Colorado and by truck from the grain elevator in
synthetic and organic fertilizers is volatilized as N2O. Longmont, Colorado.42
N2O is a powerful GHG, with a global warming potential
298 times that of CO2.40 As such, N2O soil emissions Barley transported by train travels a distance of 490
related to the application of N fertilizer at the rate miles,43 while grain transported by truck is transported
determined above and the incorporation of N in crop only 45 miles. Assuming each grain elevator contributed
residues correspond to 112.4 g of CO2e emissions per an equal share of barley to NBB, and taking the fuel
6-pack of FT. economy of freight trains as 423 MPG per short ton
(AAR, 2008; cf. Börjesson, 1996), the 618 g of barley
In addition, some soil nitrogen is volatilized as NH3 or necessary to produce the 463.5 g of malt used per
NOx, which, when later deposited onto other soils or 6-pack of FT contributes 8.0 g of CO2 emissions.
surface waters. This atmospherically deposited N
becomes part of the system again, and a proportion of Malt Production 166.8 g CO2e
it becomes N2O (IPCC, 2006). Based on IPCC
estimates of the percentage of fertilizer N that follows Malt manufacturers steep, germinate, and dry barley in
this indirect pathway to N2O, an additional 8.4 g of order to produce malt. These steps require energy in the
CO2e emissions per 6-pack of FT originate from soil N form of electricity and natural gas to warm the water
(IPCC, 2006). used for steeping, to control the air temperature for
germination, and to dry, cure, and roast the malt (Briggs,
1998). Data gathered from both primary and secondary
sources yielded remarkably consistent estimates of GHG
emissions (mean 120.19 g CO2, 1σ = 7.49). Because
primary data from all malt suppliers was not available,
we elected to use primary data where applicable to a
specific malt type and take an average of both primary
and secondary findings for those malt types where no
primary information was available.
36-38
Ibid.
39
See, e.g., www.ipmcenters.org/cropprofiles/docs/NDbarley.html, www.ag.ndsu.nodak.edu/aginfo/entomology/entupdates/ICG_08/02_BarleyInsects08.pdf, and
www.ag.ndsu.edu/pubs/plantsci/pests/pp622/pp622.pdf
40
Fourth Assessment Report of the IPCC (2007)
41
Vertical Coordination In The Malting Barley Industry: A ‘Silver Bullet’ For Coors? Michael Boland, Gary Brester, and Wendy Umberger Prepared for the 2004 AAEA
Graduate Student Case Study Competition Denver, Colorado August 1-2, 2004
42
Personal communication with Thomas Richardson, Coors Brewing Company with February 14, 2008
43
This distance represents an average of the distances between Coors and grain elevators in Burley, Huntley, Worland and Monte Vista.14 The Climate Conservancy
Primary Source Data Secondary Source Data
Coors Brewing Company Owing to a lack of primary source data for all the malts
types contained in FT, TCC conducted further research
In 2006, NBB obtained 60% of the Two Row malt used of the energy requirements of the malting process in
in FT produced from Coors.44 In turn, Two Row malt order to understand whether different types of malt
made up 67.9%, or 314.9 g, of the malt contained in might entail greater or less GHG emissions. Following
each 6-pack of FT. According to a TCC survey com- are estimates derived from this research, the sum of
pleted by Coors, production of 100 pounds of Two Row which is remarkably similar the total emissions
malt required 6.79 kWh of electricity and 0.165 estimated from the primary source data described
mmBTUs (1.65 therms) of natural gas. Assuming this above.
energy intensity applied to the production of all 314.9 g
of Two Row malt in a 6-pack of FT, 44.4 g of CO2e Steeping
relate to electricity consumed45 and 69.5 g correspond
to natural gas used, for a total of 113.8 g of CO2e per Steeping requires roughly 1 therm of natural gas per
6-pack of FT. metric ton of malt produced (Briggs, 1998). Based on
life cycle emissions of 6.06 kg CO2e per therm of
TCC was not able to obtain comparable information natural gas (see Table 3, page 22), steeping 463.5 g of
from Briess Malt and Ingredients Company, which malt in a 6-pack of FT results in 2.8 g of CO2e emis-
company supplies the remaining 32.1%, or 148.6 g, of sions.
malt per 6-pack of FT. However, if the energy intensity
of Coors’ process is assumed for all 463.5 g of malt per Germination
6-pack of FT, 20.9 and 32.8 g of CO2e result from
electricity and natural gas use, respectively, totaling After steeping, the barley must germinate, requiring
167.6 g CO2e for all the malt in a 6-pack of FT. energy to maintain the proper temperature of the grain
and ventilate the germination units. Heating the
Rahr Malting Company germination units requires less than 1 therm of natural
gas per metric ton of malt produced, or less than 2.8 g
Though NBB did not purchase malt from Rahr Malting of CO2e per 6-pack of FT. In some cases, germination
Company (Rahr) in the year 2006, TCC was able to units are refrigerated, requiring as much as 60 kWh of
obtain information about actual energy requirements of electricity per metric ton of malt produced (Briggs,
Rahr’s malting process for comparison with secondary 1998). Assuming this electricity is generated in the
source data. According to a report by the Energy region where the bulk of US malt barley is grown, as
Efficiency and Renewable Energy division of the US much as 24.0 g of CO2 emissions result from refrigera-
Department of Energy, the Rahr malthouse located in tion of 463.5 g of malt.49 Fans in the germination units
Shakopee, Minnesota consumed 1,100 million cubic also require between 25 and 40 kWh per metric ton of
feet of natural gas (approximately 11,000,000 therms) malt produced (Briggs, 1998). This translates to
and 66,000,000 kWh of electricity in 2005.46 The between 10.0 and 16.0 g of CO2e per 6-pack of FT.
same Rahr malthouse annually produces 370,000 Mt Assuming the likelihood of heating and refrigeration
of malt.47 This translates into 29.7 therms of natural during germination are equal and an average of 32.5
gas and 178.4 kWhs of electricity per metric ton of malt kWh of electricity is consumed by ventilation systems,
produced, or 146.5 g of CO2 to produce the 463.5 g of 26.4 g of CO2e are emitted to germinate the malt in a
malt in a 6-pack of FT.48 6-pack of FT.
44
NBB data, “BOM for life cycle study.xls” (Tranche 1)
45
Version 2.1 (2006) of the Energy Information Administration’s eGRID database indicates that 1,986 lbs of CO2 are emitted per MWh of electricity generated in
the state of Colorado. Average GHGs emitted in the life cycle of fuels prior to their combustion to generate electricity have also been included (Table 2 of West
and Marland, 2002).
46
http://www.eere.energy.gov/industry/saveenergynow/partners/pdfs/esa-025-1.pdf
47
http://www.rahr.com/index.geni?mode=content&id=177
48
Version 2.1 (2006) of the Energy Information Administration’s eGRID database indicates that 1,588 lbs of CO2 are emitted per MWh of electricity generated in
the state of Minnesota. Average GHGs emitted in the life cycle of fuels prior to their combustion to generate electricity have also been included (Table 2 of West
and Marland, 2002).
49
Version 2.1 (2006) of the Energy Information Administration’s eGRID database indicates that 1,814 lbs of CO2 are emitted per MWh of electricity generated in
the MRO West subregion (which includes most of Minnesota, North and South Dakota, Nebraska and Iowa). In addition, we have included average GHGsThe carbon footprint of Fat Tire® Amber Ale 15
Drying and Roasting figure to allocate emissions during agriculture to a given
mass of hops.
After germination, the green malt is first dried and then
roasted in a kiln, which is the most energy-intensive Agricultural Machinery 1.1 g CO2e
processes in malting. Drying requires approximately 4 Hop farms (“yards”) operate machinery for planting,
therms of natural gas per metric ton of malt, or 11.2 g spraying, pruning and harvesting, and maintain drip
of CO2e per 6-pack of FT. Depending on the efficiency irrigation systems, all of which demand energy (Lal,
of the kiln and the amount of roasting required, 2004a).
between 30 and 60 therms of natural gas are required
to roast a metric ton of malt. This amounts to between A study compiled in 1999 lists equipment and fuel used
84.3 and 168.6 g of CO2e per 6-pack of FT. Some kilns on a representative hop farm in the Yakima Valley of
incorporate fans which consume up to 75 kWh per Washington (Hinman, 1999). Equipment used in a
metric ton of malt produced (Briggs, 1998). GHG representative hop yard included loaders, cutters,
emissions associated with this electricity amount to as trucks, and tractorized equipment for spraying, spread-
much as 30.0 g of CO2e to produce the amount of malt ing and pruning. Fuel consumption by this equipment
in a 6-pack of FT. Assuming half of malting kilns use amounted to 56.1 and 31.8 gallons per cultivated
fans, the drying and roasting of malt for a 6-pack of FT hectare (22.7 and 14.4 gallons per acre) of diesel #2
result in an average 182.0 g of CO2e emissions. and gasoline, respectively.
Malt Transport 25.0 g CO2e Emissions factors for diesel #2 and gasoline (including
extraction, refining and transport) are 11.78 and 10.23
Fuel Use
kg CO2 per gallon, respectively.51 Based on the
Using similar calculations to those detailed in the average yield of hops in 2006, operation of farm
packaging section with the same emission coefficients equipment therefore resulted in 470 g of CO2 emis-
and shipping methods (Class 8 truck), the malt sions per kilogram of hops. The 2.3 g of hops used in
received from Coors, Prairie Malt, Ltd. (Prairie), Inter- the production of FT thus embody 1.1 g of CO2.
national Malting Company (IMC) and Briess Malt and
Ingredients Co. (Briess) constitute 1.3 g, 9.0 g, 8.4 g Irrigation 1.2 g CO2e
and 15.0 g of CO2 respectively. Of the entire amount of
Most hop yards in the US are irrigated by drip (or
malt used in the production of FT, 40.5% is Coors Two
trickle) systems.52 Annual GHG emissions associated
Row, 27.0% Prairie or IMC (a 50% likelihood of either
with the installation of such systems is estimated to be
was used in the calculations) and 32.4% Briess
311.3 kg CO2e per hectare per year (Lal, 2004a).
Munich, Caramel, Carapils and Victory malts. The
Application of water by this method is quite efficient
weighted average of transportation emissions for malt
relative to sprinkle systems; CO2e emissions per
transportation for a 6-pack of FT is 25.0 g CO2.
irrigated hectare per year are estimated to be 792 kg
Hops 5.7 g CO2e (ITRC, 1994). Assuming all hops in FT were irrigated
in this manner, and again using 2006 yield data, the
Hop Agriculture 5.4 g CO2e 2.3 g of hops used in producing a 6-pack of FT relate
to a total of 1.2 g CO2e from irrigation of hop bines.
As with barley, the cultivation of hops (Humulus lupulus)
results in GHGs emitted during production of fertilizers, Fertilizer and Soil Amendments 1.4 g CO2e
pesticides and soil amendments, operation and installa-
tion of farm equipment (including irrigation) and emis- Nitrogen
sions from the soil (Lal, 2004a).
The application rate of N fertilizer to aroma hop bines
The bulk of hops grown in the US are from the Yakima averages 140 kg per hectare (125 lbs per acre).53
and Willamette Valleys of Washington and Oregon, As noted previously, the production of nitrogenous
respectively. This is the case for nearly all the hop fertilizer is quite energy intensive, with an estimated 4.8
varieties in FT, with the exception of Target hops, which ± 1.1 kg of CO2e emissions per kg of N fertilizer
are grown in a similar climate in the UK. In the US, yield produced, transported, stored and transfer to location
per cultivated hectare of hops in 2006 was 2.20 Mt of use (Lal, 2004a). Based on 2006 hops yield, this
(2,201.4 kg).50 In the calculations below, we use this amounts to 303 g of CO2e per kilogram of hops, or 0.7
g per 6-pack of FT.
50
Per crop reports of the US Department of Agriculture: www.nass.usda.gov/Statistics_by_State/Washington/Publications/Hops/hops06.pdf
51
Calculated using figures from Table 1 of West and Marland (2002) and assuming the energy content of diesel #2 and gasoline to be 0.03868 and 0.03466 GJ per
liter, respectively16 The Climate Conservancy
Phosphorus Pesticides 0 g CO2e
Hop growers use a variety of insecticides, herbicides
Hops in the Pacific Northwest generally do not require and fungicides to deter aphids, works, caterpillars,
significant phosphorus (P) inputs; only where soil analysis beetles, weevils, mites, weeds and molds. The carbon
showsThe carbon footprint of Fat Tire® Amber Ale 17
Thus, we calculated GHG emissions during the drying
and packing process based on the estimated cost of
these activities on a Yakima Valley hop farm and
assuming this cost was fully attributable to purchased
natural gas (Hinman, 2004). Based on these assump-
tions, the drying and packing of hops resulted in 0.9 g
of CO2 per 6-pack of FT.
Hop Transport 0.3 g CO2e
The hops used to produce FT (Goldings, Target and
Willamette) are supplied by S.S. Steiner, John I. Haas
(distributed by HopUnion USA) and Hops From England.
The 0.2 g of CO2 emitted from the transportation of
Willamette and Goldings hops from S.S. Stenier by
semi-truck from a distance of 1,107 miles is equal to that
of the 0.2 g of CO2 emissions from HopUnion USA at
1,109 miles. Determining the transportation emissions of
the Target hops acquired from Hops From England
presents a greater challenge. These hops are grown at
‘The Farm’ Bosbury, Ledbury, Herefordshire, UK and
shipped to a port in the UK, then by sea to Washington
state and then to NBB. It is assumed that semi-truck
shipping from ‘The Farm” Bosbury, Ledbury, Hereford-
shire UK to Bristol, UK, Panamax container ship61
transport from Bristol, UK to Seattle, Washington and
truck transport to NBB.62 While the exact port of call in
the UK is not known, the trucking within the UK will
contribute roughly 0.02 g CO2, sea-borne shipping 0.4 g
CO2 and US trucking 0.3 g CO2 for a total of 0.7 g CO2.
Though the exact route is not known, the emissions do
not change significantly when alternative ports in Liver-
pool, London and Tacoma are considered. Weighting
the transportation emissions according to the variety and
mass of hops used in FT, the total 2.3 g of hops
accounts for 0.3 g CO2.
61
A Panamax ship has an average DWT of 65,000 tons and is this largest ship that can navigate the Panama Canal
62
Personal communication with the distributor for Hops From England, Crosby and Baker LTD18 The Climate Conservancy
Water 3.2 g CO2e Carbon Dioxide 72.5 g CO2e
Production and Transport 3.2 g CO2e Production 72.3 g CO2e
Energy Intensity Energy Intensity
Water provided to NBB by the city of Fort Collins is The carbon dioxide used to carbonate FT is a byprod-
treated by a series of conventional techniques: coagu- uct of either oil well drilling, petroleum refining or
lation, flocculation, sedimentation, filtration, and production of hydrogen in a Hydrogen Production Unit.
chlorination. According to the city of Fort Collins, Before shipment to NBB, the gas must be purified,
average annual energy consumption at their water tested and liquefied, each step requiring energy.
treatment facility over the past 9 years was 4,026,793 Energy intensity information for carbon dioxide was not
kWh. During the same period, the average amount of readily available for our calculation, so the energy
water produced per year was 9,346 million gallons per intensity to liquefy nitrogen (N2) was used as a proxy.
year.65 Thus, the average energy intensity of the The minimum power necessary (in a theoretical Carnot
treated water provided to NBB is 431 kWh per million cycle) to liquefy N2 is 80 kWh per tonne.69 However,
gallons of water. the actual power requirements are around 400 kWh per
tonne for liquefication alone. The number does not
Carbon Intensity take into account the initial cooling, oxidation, aftercool-
According to the city of Fort Collins all energy needs for ing, adsorption, drying, condensing and distillation that
the water treatment facility are provided by Xcel may be required for purification depending on the
Energy, which has reported carbon intensity of deliv- source gas.70
ered electricity in 2006 of 1.478 lbs CO2 per kWh.66
However, this is lower than the figure listed in the Carbon Intensity
Environmental Protection Agency’s Emissions and Given that the CO2 is purified and liquefied in Chey-
Generation Resource Integrated Database (eGRID) for enne by DynoNobel, the mean carbon intensity of
the Rocky Mountain subregion, which is 2.036 lbs CO2 electricity produced in Wyoming was used: 0.8175 kg
per kWh (or 0.93 kg CO2 per kWh), and which we of CO2 per kWh. On a per 6-pack basis, the production
believe is more accurate given its regional character.67 of 54.5 g of CO2 used to carbonate FT emits 17.8 g of
CO2. Although the molecular mas and thermodynam-
Allocation ics of N2 mean more energy is required to compress it
The water to beer ratio of NBB’s production process is than CO2, because many of the steps (and energy)
3.9 to 1.68 Based on this ratio, the 72 fluid ounces of needed to purify and test CO2 are not included here,
beer in a 6-pack (2.13 liters) require 280.8 fluid ounces the carbon intensity will not be less than the 17.8 g of
(8.307 liters) of water to produce. Applying the energy CO2. The 54.5 g of CO2 used to carbonate te beer is
and carbon intensities above, we calculate 3.2 g of CO2 also included, as this gas is derived from fossil carbon.
are embodied in the water used per 6-pack of beer.
65
Energy use and volume of water produced were obtained by communication with a financial analyst at Fort Collins Utilitiesn January 7, 2008
66
2006 Triple Bottom Line Report of Xcel Energy, http://www.xcelenergy.com/XLWEB/CDA/0,3080,1-1-1_38873_39323-19025-5_406_651-0,00.html
67
EPA eGRID (2006), reporting 2004 data, http://www.eia.doe.gov/cneaf/electricity/page/co2_report/co2report.html
68
NBB data, “NBB Follow Up Questions_10.doc” (Tranche 2)
69
Industrial Gas Handbook: Gas Separation and Purification, Frank Kerry, CRC Press
70
From pamplet, “All About Carbon Dioxide: Properties, Applications, Sources and Plants” Totomont Process Systems, A Division of Toromont Industries, Inc.You can also read