Techno-Economic Assessment of Soiling Losses and Mitigation Strategies for Solar Power Generation - DLR
←
→
Page content transcription
If your browser does not render page correctly, please read the page content below
Please cite this article in press as: Ilse et al., Techno-Economic Assessment of Soiling Losses and Mitigation Strategies for Solar Power Gener-
ation, Joule (2019), https://doi.org/10.1016/j.joule.2019.08.019
Perspective
Techno-Economic Assessment of Soiling
Losses and Mitigation Strategies
for Solar Power Generation
Klemens Ilse,1,2,3,4,* Leonardo Micheli,5 Benjamin W. Figgis,6 Katja Lange,1,2 David Daßler,1,2
Hamed Hanifi,1,2 Fabian Wolfertstetter,7 Volker Naumann,1,2 Christian Hagendorf,1,2
Ralph Gottschalg,1,2,3 and Jörg Bagdahn3
Soiling consists of the deposition of contaminants onto photovoltaic (PV) mod- Context & Scale
ules or mirrors and tubes of concentrated solar power systems (CSPs). It often The light-collecting surfaces of
results in a drastic reduction of power generation, which potentially renders solar power systems cover areas
an installation economically unviable and therefore must be mitigated. On the of more than 3,000 km2
other hand, the corresponding costs for cleaning can significantly increase the worldwide, with PV modules
price of energy generated. In this work, the importance of soiling is assessed accounting for the majority. An
for the global PV and CSP key markets. Even in optimized cleaning scenarios, often-neglected problem is the
soiling reduces the current global solar power production by at least 3%–4%, contamination of these surfaces,
with at least 3–5 billion V annual revenue losses, which could rise to 4%–7%, so-called ‘‘soiling,’’ which leads to
and more than 4–7 billion V losses, in 2023. Therefore, taking into account significantly reduced energy
the underlying physics of natural soiling processes and the regional cleaning yields, especially in high-
costs, a techno-economic assessment of current and proposed soiling mitiga- insolation arid and semi-arid
tion strategies such as innovative coating materials is presented. Accordingly, climates. Indeed, an inadequate
the research and development needs and challenges in addressing soiling are soiling mitigation strategy in high
discussed. solar-potential and soiling-prone
locations such as China, India, or
INTRODUCTION the Middle East can cancel out in
Soiling can easily cause more than 1% power loss per day1–4 and is a site-specific few weeks the impressive
phenomenon, strongly influenced by local climatic conditions.1,5–11 The predomi- progress in solar cell and CSP
nant type of contamination could change considerably depending on the location: efficiency made in recent
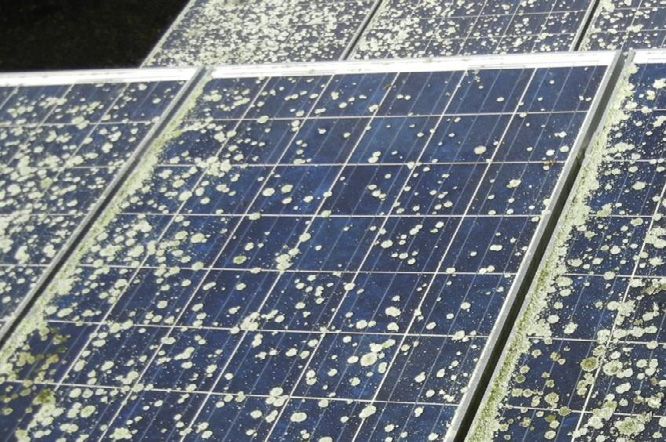
mineral dust deposits1 (Figure 1A), bird droppings (Figure 1B), biofilms of bacteria, decades.
algae, lichen, mosses, or fungi12–14 (Figure 1C), plant debris or pollen15 (Figure 1D),
engine exhausts or industry emissions (Figure 1E), and agricultural emissions such as Currently, there is no one-
feed dusts (Figure 1F). solution-fits-all to the problem of
soiling due to its site-specific and
For PV modules, soiling on the front glass mainly results in optical losses due to light seasonal variability, differences in
absorption or backward scattering,2,16 depending on the area shaded by soiling par- local energy costs, and the
ticles and also on the dust compositions and particle size distributions.2,8,16,17 availability and costs of resources
Compared to PV, soiling-induced losses are 8–14 times greater for CSP because required for cleaning, such as
most of the forward scattered light, which could still generate electricity in PV, water or labor. Indeed, frequent
does not hit the CSP receiver due to limited collector acceptance angles. Similar cleaning can increase the energy
applies to concentrator photovoltaics (CPVs), which also use lenses or mirrors. How- generation costs and water
ever, as CSP only accounts for about 1.1% of global installed solar power capacity, consumption dramatically,
and CPV being less than 0.1%, the focus of this study is set on conventional PV.18–20 leading to a need for water-less
and inexpensive soiling mitigation
The physics of dust deposition and adhesion are complex due to the many influ- technologies. Our analysis
encing factors, ranging from weather, site, and system specifications to surface
Joule 3, 1–19, October 16, 2019 ª 2019 Elsevier Inc. 1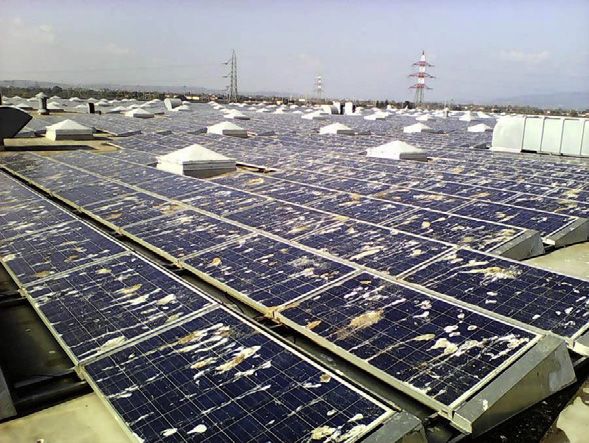
Please cite this article in press as: Ilse et al., Techno-Economic Assessment of Soiling Losses and Mitigation Strategies for Solar Power Gener-
    ation, Joule (2019), https://doi.org/10.1016/j.joule.2019.08.019

nano-characteristics as well as their time-variability (e.g., diurnal or seasonal weather
changes).1 Airborne dust concentration is considered the major determinant of soil-                        indicates that in addition to
ing,1,6,7,21 together with rain frequency, as rain is quite effective at cleaning soiled                   optimized cleaning plans,
surfaces if sufficiently abundant.1,6,22 On the other hand, rain can also cause nega-                      automated cleaning machines,
tive effects, e.g., by wet deposition of aerosol particles that have been washed                           anti-soiling coatings, tracking
out of the atmosphere.23 Wind speed is also an important parameter, as it influences                       system modifications, PV module
the particle deposition mechanisms and rates the balance between deposition                                design, improved soiling
and resuspension.24–26 Tilt angle of the PV modules and CSP mirrors should                                 monitoring, and site adaption can
be considered since soiling rates are greater on flatter surfaces.2 Relative humidity                      be economically feasible and
and dew strongly enhance dust adhesion to surfaces through capillary forces, parti-                        effective solutions to reduce the
cle caking, and cementation.1,17,27,28 These moisture-related adhesion mechanisms                          negative impact of soiling. Other
are considered important, even in deserts: radiative cooling of the glass surfaces at                      technologies like electrodynamic
night allows surfaces to cool below the ambient air temperature. They frequently                           screens or dew mitigation need
reach the dew point, and thus, dew precipitates on the collector surfaces.1,27                             further research and development
                                                                                                           to improve functionality and
On top of reversible optical losses, soiling can cause permanent degradation of PV                         become economically relevant for
modules and mirror materials. In cases of omitted cleaning, cemented dust layers,                          large-scale application.
lichens, and fungi can become practically irremovable, whereas harsh cleaning can
lead to the scratching or abrasion of typical anti-reflective coatings (ARCs) or glass
corrosion.13,29,30 In addition, mechanical loads during cleaning or thermal shocks
when a hot element is cleaned with cold water may lead to breakage of solar cells
and glasses or expansion of micro cracks. Further, potential induced degradation
(PID) in PV can be enhanced by soiling,31,32 and partial shading due to non-uniform
soiling can lead to the formation of hot spots. In CSP, increased dust loads can lead
to accelerated degradation of receivers by particle melting, failure of bearings, ball
joints, and others.

However, within this study, only the optical and corresponding yield losses due to
soiling are considered for the investigation of the global impact of soiling. Currently,
cleaning is the state-of-the-art to tackle soiling. Cleaning economics also determine
the economic viability of other mitigation technologies. Therefore, the techno-
economic feasibility of potential technologies is investigated based on an evaluation
of their efficiency in soiling loss reduction and potential costs. The most promising
available strategies are thus identified and recommendations provided for further
research.

                                                                                                        1Fraunhofer Center for Silicon Photovoltaics CSP,
IMPACT ON GLOBAL SOLAR POWER PRODUCTION AND ENERGY                                                      06120 Halle (Saale), Germany
COSTS                                                                                                   2Fraunhofer Institute for Microstructure of
In order to estimate the global impact and cost of soiling, the optimum between                         Materials and Systems IMWS, 06120 Halle (Saale),
                                                                                                        Germany
cleaning costs and revenue losses due to soiling between cleaning events was deter-
                                                                                                        3Anhalt
                                                                                                              University of Applied Sciences, Faculty
mined for the twenty top PV markets (about 90% of global installed PV capacity in                       EMW, Koethen (Anhalt), Germany
201833) and the global CSP market. Accordingly, an extensive dataset was compiled                       4Institute
                                                                                                                 of Physics, Martin Luther University
from literature and interviews with stakeholders, including regional soiling rates (Fig-                Halle-Wittenberg, 06120 Halle (Saale), Germany
ure 2B and Tables S1–S3), local cleaning costs (Figure 2C and Table S1), and simu-                      5Centre for Advanced Studies on Energy and
lated local energy yields (Figure 2D and Table S4). From these, the optimum number                      Environment (CEAEMA), University of Jaén,
                                                                                                        23071 Jaén, Spain
of cleaning cycles per year was calculated for each country (Figure 2E). The calcula-                   6Qatar  Environment and Energy Research
tions were performed considering the reported installed capacity33 and regional                         Institute (QEERI), HBKU, Doha, Qatar
feed-in-tariffs34 from 2017 to 2018, as well as a medium growth scenario and an                         7German  Aerospace Center (DLR), Institute of
average electricity price of 0.03V/kWh for 2023. In addition, the total costs of soiling                Solar Research, Plataforma Solar de Almerı́a,
                                                                                                        04200 Tabernas, Spain
being the sum of optimized annual cleaning costs and the remaining revenue losses
                                                                                                        *Correspondence:
were determined (Figure 2F). Further details of the methodology are provided in the                     klemens.ilse@csp.fraunhofer.de
Experimental Procedures and the Supplemental Information.                                               https://doi.org/10.1016/j.joule.2019.08.019

2       Joule 3, 1–19, October 16, 2019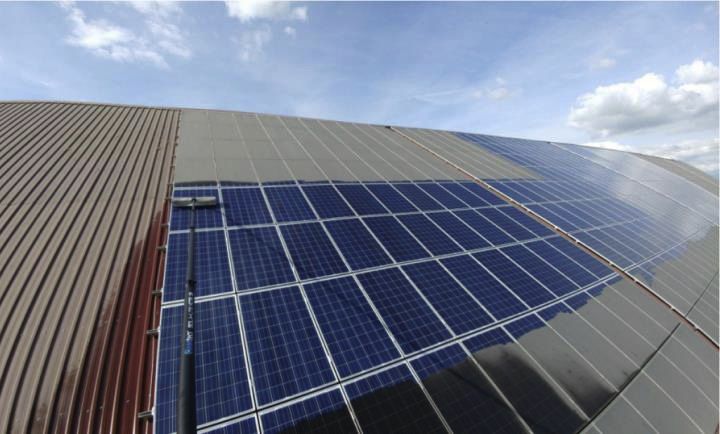
Please cite this article in press as: Ilse et al., Techno-Economic Assessment of Soiling Losses and Mitigation Strategies for Solar Power Gener-
 ation, Joule (2019), https://doi.org/10.1016/j.joule.2019.08.019

 A Mineral dust                                          B Bird droppings                              C Algae/lichen/mosses/fungi

 D Pollen                                                E Engine exhaust                              F Agriculture emissions

Figure 1. Examples of Soiling
Overview of different soiling types with exemplary photographs of soiling by (A) mineral dust in a desert area, (B) bird droppings, (C) algae, lichen,
mosses or fungi and (D) pollen in wet and moderate climates, (E) engine exhaust from an industrial area, and (F) agricultural emissions.

According to the data presented in Figure 2, soiling is estimated to have reduced
global solar power production by at least 3%–4% in 2018, causing global revenue
losses of at least 3–5 billion V. This conservative estimate does not consider addi-
tional costs of non-optimized PV cleaning schedules (e.g., in residential application)
and cleaning rooftop installations (3–8 times costlier than cleaning ground-mounted
PV), which accounted for about 29% of global installations in 2018.33 This assump-
tion is less pronounced for CSP, as this technology is only profitable in large plants
where cleaning is typically performed in a more cost-optimized manner. Higher in-
centives of power purchase agreements that were contracted earlier than 2018
were not taken into consideration. Such projects tended to have higher prices for
generated electricity, which would increase the optimum cleaning frequency and
the related cleaning expenses. Secondary effects such as increases in loan rates
due to the uncertainty of yield forecasts because of the unpredictability of soiling
could also have a financial impact but were not evaluated here.

Based on the assumptions made, global soiling losses could rise significantly to
4%–7% of annual power production, causing more than 4–7 billion V economic los-
ses by 2023. This development is mainly driven by an increased deployment of PV in
high insolation and also in highly soiling-affected regions such as China and India, as
well as the mentioned low predicted electricity price, which reduces the incentive for
cleaning.35,36 Additional factors that increase the impact of soiling are rising
PV module efficiencies and a predicted increasing share of rooftop installations in
PV (from about 29% in 2018 up to about 35% in 202333). They have not yet been
considered in the calculations. Other factors such as improved air quality in some
parts of the world37–41 could reduce anthropogenic sources of soiling, although
air-quality policies typically operate over long time scales. On the other hand, the
increase in temperature and the changes associated with climate change might
cause a rise in the global soil aridity42 and the risk of droughts43 and wildfires, wors-
ening PV and CSP soiling because of the higher concentration of aerosols and the
more irregular precipitation patterns.

                                                                                                                 Joule 3, 1–19, October 16, 2019         3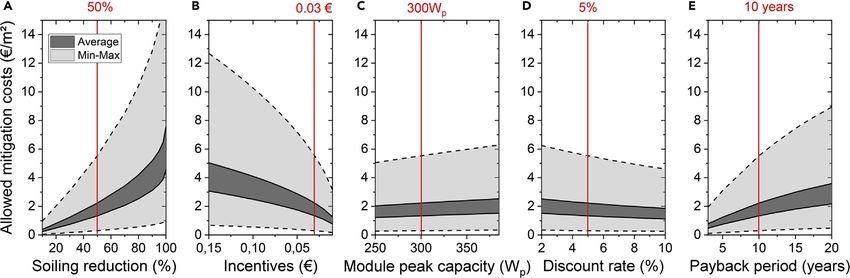
Please cite this article in press as: Ilse et al., Techno-Economic Assessment of Soiling Losses and Mitigation Strategies for Solar Power Gener-
    ation, Joule (2019), https://doi.org/10.1016/j.joule.2019.08.019

A                                                        B                                          C

D                                                        E                                          F

Figure 2. Impact of Soiling on Solar Power Generation
(A) PV capacity installed by 2018 and medium estimate for 2023, sorted by country for the top 22, and global CSP capacity.
(B) Corresponding soiling rates reported in literature; see Tables S2 and S3.
(C) Reported cleaning costs per cleaning and square meter.
(D) Typical energy yield in kWh/kW p for representative locations, see Table S4.
(E) Calculated range of optimal number of yearly cleaning cycles (bars) and actual range of typical yearly cleaning cycles reported in literature (blue lines,
see Model Validation). The arrow indicates that for CSP, the numbers are out of range and (up to 85 in 2018 and 55 in 2023).
(F) Minimum expected financial losses due to soiling calculated from optimum cleaning cycles.

TECHNICAL EVALUATION OF SOILING MITIGATION TECHNOLOGIES
The previous section described the severity of soiling across the solar-energy indus-
try. Here, soiling mitigation and cleaning strategies as reported in various studies
and reviews2,44–51 are re-assessed to gain new insights into physical constraints
and technology developments. New innovative approaches are suggested and
evaluated.

4       Joule 3, 1–19, October 16, 2019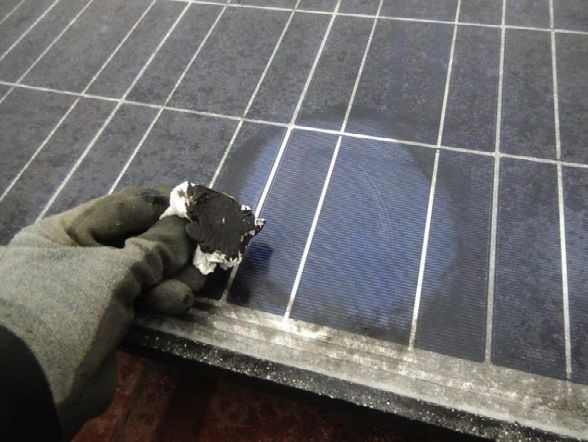
Please cite this article in press as: Ilse et al., Techno-Economic Assessment of Soiling Losses and Mitigation Strategies for Solar Power Gener-
 ation, Joule (2019), https://doi.org/10.1016/j.joule.2019.08.019

Figure 3. Overview of Different Cleaning Technologies Sorted by Category: Manual, Semi-automatic (Including Truck-Mounted Solutions and
Portable Robots), and Fully Automatic

Cleaning
So far, no passive anti-soiling technology (e.g., surface coatings) completely
eliminates the need for cleaning. Furthermore, there is not a universally recom-
mended cleaning method, as the economics and effectiveness change with local
conditions, available resources, and cleaning frequencies. In general, cleaning
methods can be categorized into manual, semi-automatic, and fully automatic
(Figure 3). A further distinction can be made between dry cleaning technologies
on the one hand that are currently only available for PV and not CSP and are
mostly applied in regions with water scarcity such as desert environments,
and wet cleaning technologies on the other hand, that are generally preferred
due to their increased cleaning efficiency and lower damage potential.13
Despite this, the fully autonomous cleaning market, which represents only
0.13 % of the current global solar capacity, is expected to grow from about
1.9 GW today to 6.1 GW in 2022,52 thanks to the recent developments of
dry, fully automated robots, which can be already integrated into the plant
design.

There are many factors influencing the decision on optimal cleaning technology,
including soiling type and deposition rates, water availability, accessibility of
the site, and system configuration (e.g., tracking versus fixed tilt angle, roof
versus ground mounted) as well as labor cost, equipment required, and
feed-in contract conditions. Efforts are being made to also identify optimal
cleaning schedule based on soiling rate detection and weather as well as dust
forecasts.

Anti-soiling Coatings
Anti-soiling coatings (ASCs), applied to the front glass of PV modules or CSP mirrors,
aim to reduce soiling and the demand for cleaning. Ideally, ASCs are highly trans-
parent, anti-reflective, durable, non-toxic, applicable at industrial scale, low cost,
and, of course, self-cleaning and are considered as a ‘‘holy grail’’ by the soiling
community.2

Five dry and wet soiling mechanisms (Figure 4A), especially important for ASC per-
formance in arid regions, have been identified through outdoor and laboratory
testing.1,17,24,27,53–55 They are (1) rebound (particles bouncing off the surface upon
impact), (2) resuspension (delayed removal of particles by wind), (3) caking
(rearrangement and compaction of particles during dew events), (4) cementation

                                                                                                             Joule 3, 1–19, October 16, 2019        5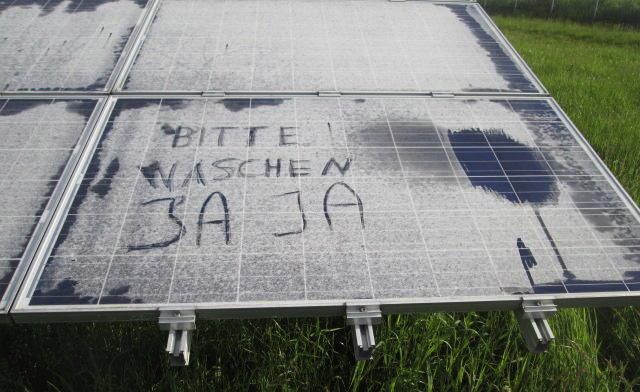
Please cite this article in press as: Ilse et al., Techno-Economic Assessment of Soiling Losses and Mitigation Strategies for Solar Power Gener-
    ation, Joule (2019), https://doi.org/10.1016/j.joule.2019.08.019

A          ASC + soiling mechanisms                        B               Tracking                        C                  EDS

D                  Dew mitigation                          E           Module design                       F              Site adaption

Figure 4. Schematic Illustration of Soiling Mitigation Technologies
(A) Important soiling mechanisms which could be addressed by anti-soiling coatings (ASCs).
(B) Single-axis tracking and optimization of night stowing position.
(C) Working principle of EDS (standing wave version).
(D) Dew mitigation by low-ε coatings and active and passive heating.
(E) PV module design approaches for soiling loss reduction: the red overlay indicates lost cell strings dew to soiling.
(F) Site adaption.

(formation of chemical and/or solid bridges between particles and surfaces after dew
cycles), and (5) water cleaning (particles washed off by rain or strong dew). To reduce
soiling, rebound, resuspension and water cleaning should be enhanced,
cementation should be avoided, and the optical loss (projected area) of caked
particles should be minimized by ‘‘herding’’ dust into agglomerates via coating hy-
drophobicity.28,56 However, limitations arising from physical phenomena must be
considered:

      Location: factors affecting soiling rate and coating performance can change
       dramatically with location, as well as with diurnal and seasonal variation of
       weather conditions. Consequently, coatings need to be tailored to specific
       site conditions.
      Particle adhesion physics: dust particles smaller than 10–20 mm diameter are
       essentially irremovable by wind because they are immersed in a thin viscous
       part of the boundary layer, which attenuates flow velocity and turbulence.1,55
       Furthermore, when dew occurs, particles typically become more tightly
       adhered to the surface.27 The particle size distribution of surface soiling differs
       by location, with a volume fraction of particles < 20 mm generally in the range of

6       Joule 3, 1–19, October 16, 2019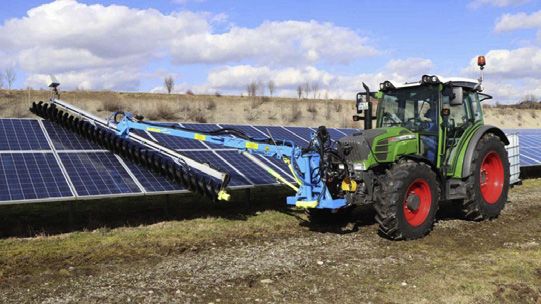
Please cite this article in press as: Ilse et al., Techno-Economic Assessment of Soiling Losses and Mitigation Strategies for Solar Power Gener-
 ation, Joule (2019), https://doi.org/10.1016/j.joule.2019.08.019

     35%–90%.1,26 Consequently, small particles remain stuck to the PV or mirror
     surfaces and, over time, comprise an increasing fraction of the soiling layer
     and optical losses.
    Durability: coating performance tends to degrade over time due to abra-
     sion (by cleaning or sand storms),13,29 particle settlement and cementa-
     tion,17 UV irradiation, temperature cycles, or even by rain or condensed
     water.57,58 There are two components to this degradation: a permanent
     degradation due to the physical damage or removal of the ASC itself
     and a temporal degradation due to the contamination of its outermost sur-
     face by the environmental matter, which obstructs its anti-soiling proper-
     ties. Indeed, this latter type can also have permanent effects if not properly
     and timely addressed.17,30 The durability and long-term performance of
     coatings are currently difficult to predict, and the community has been
     working to identify standard methodologies to test them in advance, e.g.
     IEC 62788-7-3 or VDI 3956-1.

ASCs have seen limited market deployment, as they do not eliminate the need for
cleaning but offer longer periods between cleanings. Nevertheless, the attraction
of a passive anti-soiling solution is great, so that development continues, with
many promising approaches.2–4 Soiling rate reductions of more than 80% have
been reported from outdoor exposure studies; however, over longer periods,
average anti-soiling performances are typically much lower (e.g., 20%–50%) and
could even be worse than uncoated glasses depending on coating type, local
climatic conditions, and status of degradation.28,59–73

Tilt Angle and Solar Trackers
Field studies consistently show that soiling rates significantly decrease at steeper
surface tilt angles.2,47,74 In addition, new insights indicate that, for several locations
at least, soiling could be similar or even greater during the night than during the
day,1,75 suggesting soiling mitigation by vertical or inverted overnight stowing76
(see Figure 4B). Experiments conducted on glass coupons in Doha, Qatar, showed
an average soiling loss reduction of 41% for vertical stowing and of 50% for in-
verted stowing during the night.77 In addition, about 60% reduction in soiling
loss was reported in India for PV modules inverted upside down during non-
sunshine hours,78 and more than 98% for non-tracked vertical mounted bifacial
modules.79

An analysis of the top 13 PV solar tracking companies indicated that a 90 or
180 stowing technique could not be currently applied, as the tilt angle range
for typical tracker designs are either G45 or G60 . With the solar tracker mar-
ket share of utility-scale PV plants estimated to rise from about 20% in 2016 to
40% in 2020,35 the concept of extending the tracker tilt range for night stowing
appears a potential cost-effective soiling mitigation strategy. In contrast, the
grand majority of CSP heliostats do have the inverted stow option, and para-
bolic troughs are typically stored in 15 toward the ground. However, some
heliostat concepts do not allow inverted stow positions, and changing its design
was considered not convenient for one example due to increased construction
cost that was estimated not to be compensated by the reduced cleaning
cost.80 Accordingly, the technical feasibility of tracker adaption must be exam-
ined individually. Nevertheless, steep stowing positions of traditional PV tracking
systems during the night have already been reported to decrease soiling by
more than 30%.81

                                                                                                             Joule 3, 1–19, October 16, 2019        7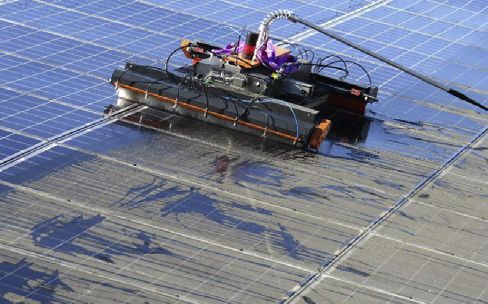
Please cite this article in press as: Ilse et al., Techno-Economic Assessment of Soiling Losses and Mitigation Strategies for Solar Power Gener-
    ation, Joule (2019), https://doi.org/10.1016/j.joule.2019.08.019

Heating of Surfaces Preventing Water Condensation
Dew has been identified as a crucial factor in soiling in many places, both for PV and
CSP, by increasing cementation, decreasing particle rebound and causing distinct
soiling patterns.1,27,53 Condensation typically peaks before dawn, when the relative
humidity is high, and PV modules are colder than the ambient air temperature
because of their infrared radiative emission to the sky (so-called radiative cooling).
PV modules are reported to cool significantly below ambient temperature so that
the dew point temperature is reached frequently, especially in clear sky condi-
tions.1,53 Additionally, condensation may also occur at temperatures above the
dew point due to capillary and hygroscopic condensation.27,53 Soiling rates are re-
ported to be considerably higher on days with dew occurrence as compared to
dry days.82 Accordingly, new approaches were proposed for soiling mitigation by
preventing condensation through active and passive surface heating17,27 (see Fig-
ure 4D). This includes heat generation by controlled current supply to solar cells,
adapted application of photovoltaic thermal hybrid solar collectors83 or using latent
heat from phase-change materials (PCM), typically proposed for PV cooling during
the day.84 In addition, low-emissive (low-ε) coatings could significantly reduce the
radiative cooling and therefore the occurrence of dew. Active heating with relatively
high power indicated up to 65% soiling reduction,17,27 but so far no results, models,
or practical conclusion on the economic feasibility of heating approaches to reduce
soiling exist. However, in combination with positive effects of PV module cooling
during the day (higher energy yield, reduced PV module degradation due to lower
daily temperature difference), heating modules at night might offer potential for
soiling mitigation in situations with high cleaning and maintenance costs (e.g.,
remote locations, street lighting, and building-integrated PV) in arid environments.

Electrodynamic Screens
Transparent electrodynamic screens47 (EDSs), also called electrodynamic dust
shields85 or cleaning systems,86–88 repel dust particles by creating a time-varying (dy-
namic) electric field over a surface.2 The fields are often generated by interdigitated
electrodes embedded in a protective film, supplied with alternating high voltages (Fig-
ure 4C). EDSs have been successfully demonstrated in the lab and are often proposed
as an anti-soiling strategy for PV and CSP. However, they have proved difficult to trans-
late to the field, where harsh conditions interfere with the electronic systems, and dust
becomes cemented to the surface by moisture.2,45,47,85 Some common issues have
been reported, including reduced effectiveness in cases of high relative humidity,2,89
long particle duration on the surface,2,85 and low surface tilt angle.89 A recently
launched commercial device reported 32% soiling rate reduction in Saudi Arabia,87
but large-scale implementation has not occurred yet due to its relatively high cost of
around 30 V/m2 (PV module prices are actually in the range of 30–90 V/m2). There
are attempts to mass-produce EDS systems to lower their cost. However, the cost
reduction potential and effectiveness in a variety of weather conditions and durability
still need to be demonstrated for market adoption. Therefore, in the near future, EDSs
are likely to be limited to applications where high system costs are acceptable.

PV Module Design
PV module design and materials can themselves be tailored to reduce impacts of
non-uniform soiling patterns. Examples are use of half-sized PV cells, configuration
of cell strings and bypass diodes, and frameless modules to avoid dirt collection at
edges. Partial shading, due to dust accumulating preferentially on one part of a PV
module, can degrade power output significantly more than the same amount of dust
spread uniformly. Indeed, shading only 50% of a single solar cell can trigger the
bypass diode of this string (see schematic in Figure 4E), which could lower the power

8       Joule 3, 1–19, October 16, 2019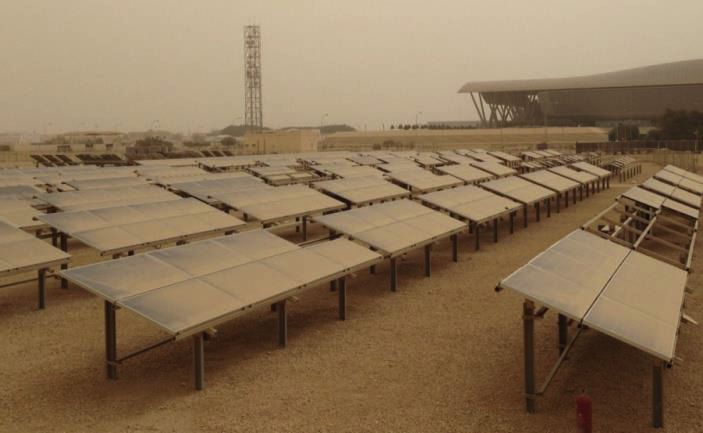
Please cite this article in press as: Ilse et al., Techno-Economic Assessment of Soiling Losses and Mitigation Strategies for Solar Power Gener-
 ation, Joule (2019), https://doi.org/10.1016/j.joule.2019.08.019

production of a typical 3-string module by one third. Considering that soiling gener-
ally accumulates on the bottom frame, a dense strip of dust covering the bottom row
of cells could theoretically cause complete power loss if the module was unfavorably
oriented. In contrast, for modules using half-sized PV cells, the risk of this situation
can be reduced by parallel sub-strings of cells.90,91 Half-cell modules could have
up to 65% higher power than an equivalently shaded full-cell module, but this also
strongly depends on the cell interconnection layout, the shading pattern, and mod-
ule orientation. Further, under partial shading conditions, half-cell modules could
have a lower temperature due to changed reverse-biased heat dissipation.92
Actually, there are already commercial PV modules with favorable module design
available in the market. With lower electrical losses and the higher optical gains,
the half-cell modules are expected to show almost similar or even lower costs in pro-
duction per Watt peak compared to full-size modules.93

Site Selection, Adaption, and Monitoring
The possibility of soiling mitigation through selection and modification of the
plant site has received little attention from PV researchers. However, lessons
can be drawn from experience with CSP systems,45 which are more strongly
affected by soiling than PV. First, soiling (daily loss rate, rain frequency, and
dust characteristics) should be analyzed at each potential site during resource
assessment measurement campaigns using full-size PV modules or CSP soiling
measurement devices at their intended tilt or tracking pattern and orientation.
It is not yet possible to accurately predict soiling only from climate information,
although some studies could show underlying principles of soiling dependencies
on other weather parameters.1,10,24,75,94–96 In addition, soiling rates can vary
dramatically for sites only 5–10 km apart or even within the same site.97 The
closer a site is to a dust generation source, the greater is its soiling risk.1 Indus-
trial dust sources such as cement plants, agriculture and livestock farms, and dirt
roads or high traffic roads can be avoided by site selection. If such sources are
unavoidable, their impact can be mitigated by design and layout of the solar
plant to facilitate cleaning, e.g., choosing row spacing and length to allow effi-
cient use of truck-mounted systems or automated cleaning machines. In addi-
tion, preventive measures can reduce the impact of fugitive local dust sources
e.g., by water spray, vegetation, paved roads, dust barriers, or increased height
of installation (see Figure 4F).45 Chemical soil stabilizers have been used in
some US PV plants and reduced dust emission by orders of magnitude.98
Wind and dust barriers have the potential to reduce soiling as shown by wind
tunnel and FEM dust transport simulations,99,100 but their effectiveness has to
be proven in operating environments45 and might need to be tailored to the
specific site, as strong wind could both worsen or ameliorate soiling.26

Monitoring is an essential soiling mitigation tool, as it helps to detect extreme
soiling conditions and to adapt the cleaning schedule depending on the inter-
annual variability of the climatic conditions, or to other exceptional soiling
events, such as road or building works. For large PV systems, ideally also soiling
non-uniformity is mapped to identify sections that are economically worth clean-
ing. The current IEC 61724-1 standard101 recommends to monitor soiling where
the expected annual losses are higher than 2% with at least two soiling sensors
for PV sites of more than 5 MW. There are numerous soling sensor concepts,
including two-sensor systems (at PV-cell or module level), where one of the sen-
sors is cleaned regularly (manually or automatically), and more recent develop-
ments toward maintenance-free sensors.50,102–106 In CSP, it is recommended
to monitor soiling on a daily basis by handheld devices107 that are operated

                                                                                                             Joule 3, 1–19, October 16, 2019        9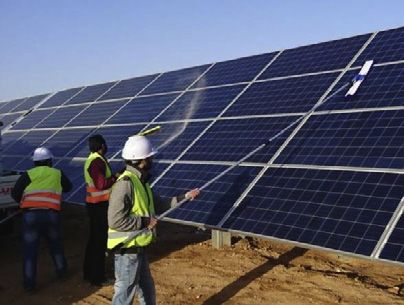
Please cite this article in press as: Ilse et al., Techno-Economic Assessment of Soiling Losses and Mitigation Strategies for Solar Power Gener-
 ation, Joule (2019), https://doi.org/10.1016/j.joule.2019.08.019

Table 1. Economics of Soiling Mitigation
 Assumed            Reduction of Optimum          Remaining          Allowed Costs for Mitigation
 Reduction in       Number of Annual              Cumulative         Technology to Achieve
 Soiling Rate       Cleaning Cycles               Yield Loss         Positive NPV
 100%              100%                         0%                 5.00–7.90 V/m2 (average)
                                                                     1.00–18.70 V/m2 (min-max)
 80%               55%                          45%                2.50–4.20 V/m2 (average)
                                                                     0.60–10.40 V/m2 (min-max)
 50%               29%                          71%                1.30–2.20 V/m2 (average)
                                                                     0.30–5.50 V/m2 (min-max)
 20 %              11%                          89%                0.50–0.80 V/m2 (average)
                                                                     0.10–2.00 V/m2 (min-max)

Estimate of maximum allowed technology costs to achieve a positive net present value (NPV), calculated
for different theoretical soiling rate reductions and assuming utility-scale PV plants, optimum cleaning
cycles, power purchase prices of 0.03 V/kWh,36 and a 10-year payback period for technology investment
at 5% discount rate.113

by solar field technicians. One of the challenges here is to select the minimal
number of measurement points to sufficiently predict the average solar field
cleanliness.108,109 A tendency to make soiling measurements less labor intensive
is also predominant in CSP soiling sensor development.107

A qualitative survey of the soiling distribution at a plant can also be conducted
through visual terrestrial or aerial (drone and satellites) inspection of the field or
by advanced solar field performance analysis (e.g., monitoring on module-level),
with new methods being continuously developed.50,110–112

Cost Estimates for Soiling Mitigation Technologies
From the data presented in Impact on Global Solar Power Production and Energy
Costs, rough estimates for a positive net present value (NPV), at which soiling miti-
gation technologies become economically feasible, were calculated assuming
different efficiencies for the reduction of soiling rates, see Table 1.

The values vary greatly between different countries and site conditions, as indicated
by the range of global minima and maxima. Economic benefits from soiling mitiga-
tion leading to reduced numbers of cleaning cycles could easily increase with higher
cleaning costs (e.g., rooftop installations and remote locations) or in areas with
extreme soiling.

The provided estimates can be compared with our assumptions for soiling rate
reduction potential and current costs of the different technologies; see Table 2.
The automated cleaning systems, ASCs, optimized PV module design, and tracker
solution are assumed to reach a feasible cost range at utility scale. In contrast, elec-
trodynamic screens and heating solutions appear too expensive, or the technology
is not mature enough.

CONCLUSIONS AND RECOMMENDATIONS
Due to its large impact on the maintenance and economics of solar-energy plants,
there is growing interest in soiling mitigation in the solar power industry and
research community, with the publication rate on the topic increasing exponentially
since 2008.3,4 However, the amount of research is small compared to other fields of
solar technology such as PV cell development or CSP plant design. To place these
topics into perspective, the increase in crystalline PV cell efficiencies achieved

10    Joule 3, 1–19, October 16, 2019
Please cite this article in press as: Ilse et al., Techno-Economic Assessment of Soiling Losses and Mitigation Strategies for Solar Power Gener-
ation, Joule (2019), https://doi.org/10.1016/j.joule.2019.08.019
Table 2. Soiling Reduction Potential and Costs for Selected Soiling Mitigation Technologies
Mitigation Technology Potential Optimum Reduction Costs Potential Limitations Most Reasonable Application
of Soiling Rates Scenario
Fully automated cleaning >95% 2.4–8.2 V/m2 49,114 integration in plant design PV utility scale, ground mounted
Anti-soiling coatingsPlease cite this article in press as: Ilse et al., Techno-Economic Assessment of Soiling Losses and Mitigation Strategies for Solar Power Gener-
ation, Joule (2019), https://doi.org/10.1016/j.joule.2019.08.019
EXPERIMENTAL PROCEDURES
Estimation of Global Soiling Impact
Since soiling rates vary significantly with location, technology, site specifics, season
and time of the day, a statistical analysis of in excess of 100 publications reporting
soiling rates for PV modules and CSP plants for different regions of the world was
used to estimate regional losses and their variability, see Figure 2B. A detailed over-
view of the literature results is presented in the Supplemental Information; see
Tables S1–S3. Only data from outdoor exposure experiments performed at typical
tilt angles were considered because soiling increases dramatically for low tilt angles.
From the dataset of each country, the median value was chosen for calculation. For
countries with no data available from literature, estimates from soiling rates from
nearby countries were used.
In comparison to soiling rate studies, there are only a few scientific reports on
common cleaning economics and costs with regard to PV soiling.9,22,51,115–126 The
outcomes of these studies are difficult to compare, as they mostly report on soiling
economics for a particular site (sometimes without optimization), use complex
model approaches that are not easy to reproduce or are based on limited or
outdated data. Therefore, information on cleaning costs has been compiled from in-
dustry partners and stakeholders, indicating huge differences between the different
countries and different sites and plant sizes (see Figure 2C). For the calculations,
both minimum and maximum values for utility plants were used. In the case that
no reliable data was available, cleanings costs were estimated based on costs in
countries with comparable economic development and labor conditions.
The specific yield for PV systems was simulated with the project design software
PV*SOL premium 2018 for a 67 kWp PV system with 200 PV modules from Canadian
Solar Inc. (CS6U-335P) and an inverter from SMA (Sunny Tripower 8000TL-20). From
this, the energy yield was determined at fixed, optimum tilt without soiling losses
for one year for several locations for each country (see Figure 2D) and the average yield
per country was used for the calculations. The yield data and details for the simulated
locations are provided in the Supplemental Information (see Figure S1 and Table S4).
In order to estimate the financial losses due to potential yield losses from soiling, the
incentives from power purchase agreements in 2018 were determined for each
country; the data is provided in Table S1. For 2023, average electricity prices of
0.03 V/kWh and 0.05 V/kWh were assumed for PV and all countries and for CSP,
respectively.
From the collected datasets, the optimum number of cleaning cycles per year, cyc,
and the corresponding total costs were calculated by cost optimization as follows for
each of the top 22 countries (PV) and global CSP. The average number of days be-
tween cleanings, n, was determined as
365
n= : (Equation 1)
cyc
The soiling rate SR is defined as an increase of soiling loss per day. This means that
for a soiling rate of 0.5 %/day, the soiling loss on the first day will be 0.5 %, on the
second day it will be 1%, and on the third day 1.5 %, respectively. In this study,
the soiling rate was assumed to be constant between cleaning events, which is typi-
cally the case for desert environments. Accordingly, the total, cumulative soiling loss
factor between cleaning cycles Sloss can be calculated by
12 Joule 3, 1–19, October 16, 2019Please cite this article in press as: Ilse et al., Techno-Economic Assessment of Soiling Losses and Mitigation Strategies for Solar Power Gener-
ation, Joule (2019), https://doi.org/10.1016/j.joule.2019.08.019
X
n
n2 + n
Sloss = k 3 SR = SR ; (Equation 2)
k =1
2
with the index k accounting for all days without cleaning, see also Figure S2 in the
supplemental material. Equation 2 assumes a linear soiling derate independently
of the value of the soiling loss, up to a maximum loss of 100%. Some authors have
been suggesting the use of an exponential function that asymptotically tends to
the maximum loss of 100%.116 However, in this work, linear soiling profile modeling
has been preferred, as it directly employs the soiling rate metric, which is widely
available in the literature and often reported to match experimental results (see
also Table S2).17,22,127 From the soiling loss, the annual yield loss Yloss can be deter-
mined by multiplication with the installed capacity C, the specific annual yield Yspec,
and the total number of cleaning cycles per year:
n+1
Yloss = C 3 Yspec 3 Sloss 3 cyc = 365 C 3 Yspec 3 SR 3 : (Equation 3)
2
The solar power generation and supply to the grid is generally rewarded by incen-
tives I, as commonly reflected by feed-in tariffs or bid prices, in units of V/kWh. By
multiplication of the lost annual yield with the assumed local incentives, the annual
financial loss Floss due to soiling of a system can be estimated:
Floss = Yloss 3 I: (Equation 4)
On the other hand, the annual cleaning costs are determined by
1 1 365
U = u3C3 3 cyc = u 3 C 3 3 : (Equation 5)
A A n
u is the cleaning cost per cleaning in V/m2, and A is the module/mirror area effi-
ciency. For PV, module characteristics of 300 Wp and an area of 1.64 m2 were
assumed, yielding A = 0.183 kWp/m2. For CSP, exemplary values of the plant
Noor Ouarzazate III were taken (150 MW, 7400 heliostats with an area of 178.5 m2
each), resulting in A = 0.114 kW/m2.
The total soiling-related costs T is the sum of cleaning costs and financial losses due
to reduced energy yield.
T = Floss + U: (Equation 6)
Accordingly, the optimized number of cleaning cycles was calculated by determina-
tion of the minimum of the total costs T 0 ðnÞ = 0, which yields
rffiffiffiffiffiffiffiffiffiffiffiffiffiffiffiffiffiffiffiffiffiffiffiffiffiffiffiffiffiffiffiffiffiffiffiffiffi
365 Yspec 3 SR 3 I 3 A
cycopt = = 365 : (Equation 7)
nopt 2u
It should be noted that here, the specific yield Yspec needs to be converted to a daily
value (annual yield divided by 365). Similar approaches to calculate the optimum
cleaning number also resulted in a dependence on the square root of the lost incen-
tives divided by twice the cleaning costs.123,125
As described above, a minimum and maximum optimum number of cleaning cycles
was determined for minimum and maximum utility-scale plant cleaning costs and
used for calculation of the financial losses for each of the top 22 countries (PV).
The global soiling loss was calculated as sum from the top 22 countries:
P22
i = 1 Yloss;i nopt;i
P22 : (Equation 8)
i = 1 Ci Yspec;i
Accordingly, also the global soiling costs were calculated as sum of top 22 countries
Joule 3, 1–19, October 16, 2019 13Please cite this article in press as: Ilse et al., Techno-Economic Assessment of Soiling Losses and Mitigation Strategies for Solar Power Gener-
ation, Joule (2019), https://doi.org/10.1016/j.joule.2019.08.019
X
22
Ti : (Equation 9)
i=1
Tables with detailed data and references are provided in the Supplemental Informa-
tion. As Figure 2 demonstrates, the available data, such as soiling rates, are often
limited and can vary considerably within a country. This also increases the uncer-
tainty of the rough estimates for the global impact of soiling.
Calculation of the Potential Cost Range for Soiling Mitigation Technologies
The estimated financial losses for each country in the previous section were
used to determine the potentially feasible costs range for soiling mitigation
technologies assuming specific reductions of soiling rates (see Table 1). For
this, the soiling rate in Equation 7 was adapted to the reduced soiling rate
SRmitigate. The country-specific optimum numbers of cleaning cycles were recal-
culated and used for determination of the adapted total soiling-related costs
Tmitigate (see Equation 6). From this, the difference between the total costs for
non-mitigated (only cleaning) and mitigated soiling was calculated for each
country and divided by the capacity-related area, yielding the potential annual
cost savings of soiling mitigation per m2 CSmitigate.
CSmitigate;i = Ti Tmitigate;i: (Equation 10)
The maximum allowed technology investment costs Vmax, so that a NPV R 0 V is
achieved after a 10-year payback period and a discount rate of 5%, were calculated
for each country i according to the minimum and maximum cleaning costs by:
X
9
CSmitigate;i
Vmax;i = l
zCSmitigate;i 3 8:11 (Equation 11)
l=0 ð1 + lÞ
A payback period of 15 years is typical for financing PV plants in moderate cli-
mates by bank lenders.128 However, for soiling, especially desert environments
become relevant, and no reliable data on long-term durability of mitigation
technologies is available yet. Accordingly, 10 years were chosen, corresponding
to the typical product warranty of PV modules. Discount rates for PV have been
reported to be typically in the range of 4%–9% (depending on the country).113
The average values of Vmax as displayed in Table 1 were determined as the
(non-weighted) mean of all Vmax,i, and the global minimum and maximum values
were also provided.
In summary, the calculations in this study indicate the cost range for which invest-
ments into soiling mitigation technologies might become profitably compared to
standard cleaning approaches. Opportunity investments, such as adding PV capac-
ity to an existing installation, are not considered in this analysis. However, against
the background of ultra-low module and system prices, such investments could
become reasonable to even replace the cleaning itself, at least in low-soiling envi-
ronments (see Example S1).
Model Validation
The model results largely build on reported soiling rates and cleaning costs (see
Tables S1 and S2). Model validation by correlation with further field data is chal-
lenging, because only rare data is available, and there is a large uncertainty
because soiling rates and cleaning costs vary considerably already within one
country. However, the first attempt of validation can be made by comparing
the calculated optimum number of cleaning cycles with typical numbers re-
ported from the field. Some data could be derived from literature and interviews
14 Joule 3, 1–19, October 16, 2019Please cite this article in press as: Ilse et al., Techno-Economic Assessment of Soiling Losses and Mitigation Strategies for Solar Power Gener-
ation, Joule (2019), https://doi.org/10.1016/j.joule.2019.08.019
Figure 5. Sensitivity Analysis of Selected Parameters Influencing the Estimates for Allowed Mitigation Costs
(A) Soiling rate reduction.
(B) Incentives for power generation and supply to the grid.
(C) PV module peak capacity.
(D) Discount rate.
(E) Payback time for calculation of NPV.
for China,124 India,114 Germany, and Saudi Arabia129 and is plotted as blue lines
in Figure 2E. As stated above, the data vary significantly. However, it can be
concluded that the model estimates match the expected numbers for different
regions quite well.
A second approach for validation is a comparison between the calculated allowed
costs for soiling mitigation of 80%–100% (2.5–7.9 V/m2, see Table 1) and the costs
for automated cleaning robots (2.4–8.2 V/m2 which match very well 49,114 see Table
2). Automated cleaning robots are increasingly gaining relevance in high-soiling
areas,52 which is also suggested by the data obtained within this study and demon-
strates that the heuristic approach used has the potential to reflect the actual soiling
economics.
However, in order to provide a better overview of factors influencing the outcomes,
a sensitivity analysis has been performed for soiling rate reductions (Figure 5A), in-
centives (Figure 5B), PV module peak capacity (Figure 5C), discount rates (Fig-
ure 5D), and payback time period (Figure 5E). Only one parameter was changed
during each analysis, and the standard parameters used are indicated by red lines
in Figure 5. The graphs show the average costs as well as absolute minimum and
maximum as derived for minimum and maximum cleaning cost estimates for the
different regions (see Equation 8). A more in-depth analysis for selected countries
is also provided in Figure S3.
From Figure 5, it can be concluded that the cost estimates are mainly determined by
the assumed soiling rate reduction of the respective technology and the incentives
for power supply to the grid, followed by the assumed payback period of the initial
investment. PV module peak capacity and discount rate have only a minor impact on
the final results.
SUPPLEMENTAL INFORMATION
Supplemental Information can be found online at https://doi.org/10.1016/j.joule.
2019.08.019.
Joule 3, 1–19, October 16, 2019 15Please cite this article in press as: Ilse et al., Techno-Economic Assessment of Soiling Losses and Mitigation Strategies for Solar Power Gener-
ation, Joule (2019), https://doi.org/10.1016/j.joule.2019.08.019
ACKNOWLEDGMENTS
This research was funded in part by the Federal Ministry of Education and Research
of Germany (BMBF) in the project WÜSTENMODUL (project number 03FH014IX4)
and in part by the federal state of Sachsen-Anhalt in the EFRE project ‘‘PVFoil’’ (IB
Sachsen-Anhalt, FuE 102/18). L.M. was funded through the European Union’s Hori-
zon 2020 research and innovation programme under the NoSoilPV project (Marie
Skłodowska-Curie grant agreement no. 793120). F.W. was funded through the
European Union’s Horizon 2020 research and innovation programme under the
SOLWARIS project (grant agreement no. 792103). The authors would like to thank
industry partners for provision of photographs and permission to use, including
Wenzel Präger Photovoltaik Reinigung (Figures 2B and 2E), solarsol Solarreinigung
(Figure 2C), SRS Nord (Figure 2D), Solarpflege.de (Figure 2F), Mohammad Ba’ra
(Figure 3A), Sunbrush GmbH (Figure 3B), Staudinger GmbH/Helios (Figure 3C),
and NOMADD Desert Solar Solutions (Figure 3D).
AUTHOR CONTRIBUTIONS
Conceptualization, K.I.; Methodology, K.I.; Validation, K.I., D.D., and L.M.; Formal Anal-
ysis, K.I. and K.L.; Investigation, K.I., K.L., L.M., B.W.F., D.D., H.H., and V.N.; Visualiza-
tion K.I.; Writing – Original Draft, K.I., L.M., B.W.F., H.H., and V.N.; Writing – Review &
Editing, K.I., L.M., B.W.F., C.H., F.W., V.N., and R.G.; Funding Acquisition, J.B., K.I., and
C.H.; Resources, C.H., R.G., and J.B.; Supervision, C.H., R.G., and J.B.
REFERENCES
1. Ilse, K.K., Figgis, B.W., Naumann, V., dust and particulate air pollution. Environ. Sci. The role of pollen in PV module performance
Hagendorf, C., and Bagdahn, J. (2018). Technol. Lett. 4, 339–344. degradation. Energies 11, 294.
Fundamentals of soiling processes on
photovoltaic modules. Renew. Sustain. 9. You, S., Lim, Y.J., Dai, Y., and Wang, C.-H. 16. Piedra, P., and Moosmüller, H. (2017). Optical
Energy Rev. 98, 239–254. (2018). On the temporal modelling of solar losses of photovoltaic cells due to aerosol
photovoltaic soiling. Energy and economic deposition. Role of particle refractive index
2. Sarver, T., Al-Qaraghuli, A., and Kazmerski, impacts in seven cities. Appl. Energy 228, and size. Sol. Energy 155, 637–646.
L.L. (2013). A comprehensive review of the 1136–1146.
impact of dust on the use of solar energy: 17. Ilse, K.K., Figgis, B.W., Werner, M., Naumann,
history, investigations, results, literature, and 10. Javed, W., Guo, B., and Figgis, B. (2017). V., Hagendorf, C., Pöllmann, H., and
mitigation approaches. Renew. Sustain. Modeling of photovoltaic soiling loss as a Bagdahn, J. (2018). Comprehensive analysis
Energy Rev. 22, 698–733. function of environmental variables. Sol. of soiling and cementation processes on PV
Energy 157, 397–407. modules in Qatar. Sol. Energy Mater. Sol.
3. Costa, S.C.S., Diniz, A.S.A.C., and Kazmerski, Cells 186, 309–323.
L.L. (2017/2018). Solar energy dust and soiling 11. Coello, M., and Boyle, L. (2019). Simple model
R&D progress. Literature review update for for predicting time series soiling of 18. Wüllner, J., Steiner, M., Wiesenfarth, M., and
2016. Renew. Sustain. Energy Rev. 82, 2504– photovoltaic panels. IEEE J. Photovoltaics 9, Bett, A.W. (2018). Operation & maintenance –
2536. 1382–1387. the key for reliable performance in a CPV
power plant. AIP Conf. Proc. 2012, 020011.
4. Costa, S.C.S., Diniz, A.S.A.C., and Kazmerski, 12. Martin-Sanchez, P.M., Gebhardt, C., Toepel,
L.L. (2016). Dust and soiling issues and J., Barry, J., Munzke, N., Günster, J., and 19. International Energy Agency. IEA.
impacts relating to solar energy systems. Gorbushina, A.A. (2018). Monitoring Renewables (2018). Analysis and Forecasts to
Literature review update for 2012–2015. microbial soiling in photovoltaic systems. A 2023 (OECD Publishing).
Renew. Sustain. Energy Rev. 63, 33–61. qPCR-based approach. Int. Biodeterior.
Biodegrad 129, 13–22. 20. IEA PVPS: a snapshot of global PV markets
5. Micheli, L., Deceglie, M.G., and Muller, M. and trend reports. 2019. http://www.iea-pvps.
(2019). Mapping photovoltaic soiling using 13. Einhorn, A., Micheli, L., Miller, D.C., Simpson, org/fileadmin/dam/public/report/statistics/
spatial interpolation techniques. IEEE J. L.J., Moutinho, H.R., To, B., Lanaghan, C.L., IEA-PVPS_T1_35_Snapshot2019-Report.pdf.
Photovoltaics 9, 272–277. Muller, M.T., Toth, S., John, J.J., et al. (2019).
Evaluation of soiling and potential mitigation 21. Pelland, S., Pawar, P., Veeramani, A.,
6. Micheli, L., and Muller, M. (2017). An approaches on photovoltaic glass. IEEE J. Gustafson, W., and Etringer, L.L.A. Testing
investigation of the key parameters for Photovoltaics 9, 233–239. global models of photovoltaic soiling ratios
predicting PV soiling losses. Prog. Photovolt: against field test data worldwide. In IEEE 7th
Res. Appl. 25, 291–307. 14. Shirakawa, M.A., Zilles, R., Mocelin, A., World Conference on Photovoltaic Energy
Gaylarde, C.C., Gorbushina, A., Heidrich, G., Conversion (WCPEC), pp. 3442–3446.
7. Micheli, L., Deceglie, M.G., and Muller, M. Giudice, M.C., Del Negro, G.M.B., and John,
(2018). Predicting photovoltaic soiling losses V.M. (2015). Microbial colonization affects the 22. Kimber, A., Mitchell, L., Nogradi, S., and
using environmental parameters. An update. efficiency of photovoltaic panels in a tropical Wenger, H. (2006). The effect of soiling on
Prog. Photovolt Res. Appl. 8, 547. environment. J. Environ. Manage 157, large grid-connected photovoltaic systems in
160–167. California and the Southwest region of the
8. Bergin, M.H., Ghoroi, C., Dixit, D., Schauer, United States. In 2006 IEEE 4th World
J.J., and Shindell, D.T. (2017). Large 15. Conceição, R., Silva, H., Mirão, J., and Conference on Photovoltaic Energy
reductions in solar energy production due to Collares-Pereira, M. (2018). Organic soiling. Conference (IEEE), pp. 2391–2395.
16 Joule 3, 1–19, October 16, 2019Please cite this article in press as: Ilse et al., Techno-Economic Assessment of Soiling Losses and Mitigation Strategies for Solar Power Gener-
ation, Joule (2019), https://doi.org/10.1016/j.joule.2019.08.019
23. Merrouni, A.A., Wolfertstetter, F., Mezrhab, China: the effect of pollution-control on solar %20Paper%20-%20PV%20Module%
A., Wilbert, S., and Pitz-Paal, R. (2015). power generation and revenues. PLoS One 20Cleaning%20-%20Market%20Overview%
Investigation of soiling effect on different 13, e0207028. 20and%20Basics.pdf.
solar mirror materials under Moroccan
climate. Energy Procedia 69, 1948–1957. 38. Boys, B.L., Martin, R.V., van Donkelaar, A., 50. Mesbahi, M. (2018). White paper - soiling: the
MacDonell, R.J., Hsu, N.C., Cooper, M.J., science & solutions. https://www.solarplaza.
24. Figgis, B., Guo, B., Javed, W., Ahzi, S., and Yantosca, R.M., Lu, Z., Streets, D.G., Zhang, com/channels/asset-management/11893/
Rémond, Y. (2018). Dominant environmental Q., et al. (2014). Fifteen-year global time white-paper-soiling-science-and-solutions/.
parameters for dust deposition and series of satellite-derived fine particulate
resuspension in desert climates. Aerosol Sci. matter. Environ. Sci. Technol 48, 11109– 51. Wolfertstetter, F., Wilbert, S., Dersch, J.,
Technol 52, 788–798. 11118. Dieckmann, S., Pitz-Paal, R., and Ghennioui,
A. (2018). Integration of soiling-rate
25. Goossens, D., and van Kerschaever, E. (1999). 39. Yang, X., Jiang, L., Zhao, W., Xiong, Q., Zhao, measurements and cleaning strategies in
Aeolian dust deposition on photovoltaic solar W., and Yan, X. (2018). Comparison of yield analysis of parabolic trough plants.
cells: the effects of wind velocity and airborne ground-based PM2.5 and PM10 J. Sol. Energy Eng 140, 41008.
dust concentration on cell performance. Sol. concentrations in China, India, and the U.S.
Energy 66, 277–289. Int. J. Environ. Res. Public Health 15. 52. Gallagher, B. (2018). Rise of the machines:
solar module-washing robots. In Wood
26. Figgis, B., Ennaoui, A., Ahzi, S., and Rémond, 40. Butt, E.W., Turnock, S.T., Rigby, R., Mackenzie, GTM Report. https://www.
Y. (2017). Review of PV soiling particle Reddington, C.L., Yoshioka, M., Johnson, J.S., woodmac.com/our-expertise/focus/Power–
mechanics in desert environments. Renew. Regayre, L.A., Pringle, K.J., Mann, G.W., and Renewables/rise-of-the-machines-solar-
Sustain. Energy Rev. 76, 872–881. Spracklen, D.V. (2017). Global and regional module-washing-robots/.
trends in particulate air pollution and
27. Ilse, K.K., Figgis, B.W., Khan, M.Z., Naumann, attributable health burden over the past 50 53. Figgis, B., Nouviaire, A., Wubulikasimu, Y.,
V., and Hagendorf, C. (2019). Dew as a years. Environ. Res. Lett. 12, 104017. Javed, W., Guo, B., Ait-Mokhtar, A., Belarbi,
detrimental influencing factor for soiling of PV R., Ahzi, S., Rémond, Y., and Ennaoui, A.
modules. IEEE J Photovolt, 287–290. 41. Weagle, C.L., Snider, G., Li, C., van Donkelaar, (2018). Investigation of factors affecting
A., Philip, S., Bissonnette, P., Burke, J., condensation on soiled PV modules. Sol.
28. Ilse, K.K., Rabanal, J., Schonleber, L., Khan, Jackson, J., Latimer, R., Stone, E., et al. (2018). Energy 159, 488–500.
M.Z., Naumann, V., Hagendorf, C., and Global sources of fine particulate matter:
Bagdahn, J. (2018). Comparing indoor and interpretation of PM2.5 chemical composition 54. Ilse, K.K., Khan, M.Z., Voicu, N., Naumann, V.,
outdoor soiling experiments for different observed by SPARTAN using a global and Hagendorf, C. (2019). Advanced
glass coatings and microstructural analysis of chemical transport model. Environ. Sci. performance testing of anti-soiling coatings.
particle caking processes. IEEE J. Technol 52, 11670–11681. Part I: laboratory test setup and experimental
Photovoltaics 8, 203–209. results. Sol. Energy Mater. Sol. Cells 202,
42. Berg, A., Findell, K., Lintner, B., Giannini, A., 110048.
29. Ferretti, N., Ilse, K., Sönmez, A., Hagendorf, Seneviratne, S.I., van den Hurk, B., Lorenz, R.,
C., and Berghold, J. (2016). Investigation on Pitman, A., Hagemann, S., Meier, A., et al. 55. Ilse, K.K., Khan, M.Z., Lange, K., Voicu, N.,
the impact of module cleaning on the (2016). Land–atmosphere feedbacks amplify Naumann, V., and Hagendorf, C. (2019).
antireflection coating. In 32nd European aridity increase over land under global Advanced performance testing of anti-soiling
Photovoltaic Solar Energy Conference and warming. Nat. Clim. Change 6, 869–874. coatings. Part II: particle-size dependent
Exhibition, pp. 1697–1700. analysis and determination of adhesion
43. Dai, A. (2013). Increasing drought under forces. Sol. Energy Mater. Sol. Cells 202,
30. Toth, S., Muller, M., Miller, D.C., Moutinho, H., global warming in observations and models. 110049.
To, B., Micheli, L., Linger, J., Engtrakul, C., Nat. Clim. Change 3, 52–58.
Einhorn, A., and Simpson, L. (2018). Soiling 56. Nayshevsky, I., Xu, Q., Barahman, G., and
and cleaning. Initial observations from 5-year 44. Mondal, S., Mondal, A.K., Sharma, A., Devalla, Lyons, A. (2017). Anti-reflective and anti-
photovoltaic glass coating durability study. V., Rana, S., Kumar, S., and Pandey, J.K. soiling properties of KleanBoost TM, a
Sol. Energy Mater. Sol. Cells 185, 375–384. (2018). An overview of cleaning and superhydrophobic nano-textured coating for
prevention processes for enhancing efficiency solar glass. In IEEE 44th Photovoltaics Spec.
31. Koehl, M., and Hoffmann, S. (2016). Impact of of solarphotovoltaic panels. Curr. Sci. 6, 1065– Conf., Washington DC.
rain and soiling on potential induced 1077.
degradation. Prog. Photovolt: Res. Appl. 24, 57. Wilke, K.L., Preston, D.J., Lu, Z., and Wang,
1304–1309. 45. Bouaddi, S., Fernández-Garcı́a, A., Sansom, E.N. (2018). Toward condensation-resistant
C., Sarasua, J., Wolfertstetter, F., Bouzekri, H., omniphobic surfaces. ACS Nano 12, 11013–
32. Hacke, P., Burton, P., Hendrickson, A., Sutter, F., and Azpitarte, I. (2018). A review of 11021.
Spataru, S., Glick, S., and Terwilliger, K. conventional and innovative- sustainable
Effects of photovoltaic module soiling on methods for cleaning reflectors in 58. Isbilir, K., Lisco, F., Womack, G., Abbas, A.,
glass surface resistance and potential- concentrating solar power plants. and Walls, J.M. (2018). Testing of an anti-
induced degradation. In IEEE 42nd Sustainability 10, 3937. soiling coating for PV module cover glass. In
Photovoltaics Special Conference, New 2018 IEEE 7th World Conference on
Orleans, LA, USA, pp. 1–4. 46. Jamil, W.J., Abdul Rahman, H., Shaari, S., and Photovoltaic Energy Conversion (WCPEC).
Salam, Z. (2017). Performance degradation of
33. Schmela, M., Beauvais, A., Chevillard, N., photovoltaic power system. Review on 59. Alkandary, A., Al-Asfour, A.T., and Alzubi,
Paredes, M.G., Heisz, M., and Rossi, R. Global mitigation methods. Renew. Sustain. Energy F.G. (2018). Comparative assessment of anti-
Market Outlook. Rev. 67, 876–891. soiling nanocoated photovoltaic modules in
an arid desert environment. In 35th European
34. Jäger-Waldau, A. PV Status Report 2017. EUR 47. Sayyah, A., Horenstein, M.N., and Mazumder, Photovoltaic Solar Energy Conference and
28817 EN; 10.2760/452611 (Publications M.K. (2014). Energy yield loss caused by dust Exhibition.
Office of the European Union). deposition on photovoltaic panels. Sol.
Energy 107, 576–604. 60. Brito, P.P., Diniz, A.S.A.C., and Kazmerski, L.L.
35. Jäger-Waldau, A. (2018). Snapshot of (2019). Materials design and discovery:
photovoltaics February 2018. EPJ Photovolt 48. Syafiq, A., Pandey, A.K., Adzman, N.N., and potential for application to soiling mitigation
9, 6. Rahim, N.A. (2018). Advances in approaches in photovoltaic systems. Sol. Energy 183,
and methods for self-cleaning of solar 791–804.
36. Apostoleris, H., Sgouridis, S., Stefancich, M., photovoltaic panels. Sol. Energy 162,
and Chiesa, M. (2018). Evaluating the factors 597–619. 61. Abrams, Z.R., Gonsalves, P., Brophy, B., and
that led to low-priced solar electricity projects Posbic, J. (2014). Field and Lab Verification of
in the Middle East. Nat. Energy 3, 1109–1114. 49. Ferretti, N. (2018). White paper - PV module Hydrophobic Anti-Reflective and Anti-Soiling
cleaning. Market overview and basics (PI Coatings on Photovoltaic Glass. In 29th
37. Labordena, M., Neubauer, D., Folini, D., Patt, Photovolatik-Institut Berlin AG). http://www. European Photovoltaic Solar Energy
A., and Lilliestam, J. (2018). Blue skies over pi-berlin.com/images/pdf/publication/White Conference and Exhibition, pp. 2759–2764.
Joule 3, 1–19, October 16, 2019 17You can also read