Monitoring the Climate system from space: progress, pitfalls and possibilities
←
→
Page content transcription
If your browser does not render page correctly, please read the page content below
Grantham Institute for Climate Change
Briefing paper No 9
February 2013

Monitoring the Climate system from
space: progress, pitfalls and possibilities
Dr Helen Brindley and Dr Jacqueline Russell

Executive summary
Passive satellite sensors have provided unique observations of the
Earth’s climate system since the dawn of space-based weather observations
in 1960. In the following years, such measurements have become ever more
numerous, the instrumentation more complex and our use of the data more              Contents
sophisticated. From combinations of different satellite measurements observing
the Earth we can retrieve information about the Earth’s surface, atmosphere          Executive summary..................... 1
and energy budget. In this way satellites can provide us with a global picture
of the Earth that cannot be obtained by other means and their measurements           Introduction.. .......................... 2
can be used to provide detailed maps of, for example, surface and atmospheric
temperature, humidity, greenhouse gas concentrations, circulation patterns,          Understanding the satellite
cloud amount and properties.                                                         measurements used to study
                                                                                     climate change.. .................. ..... 3
Satellite measurements have provided direct observational evidence that
recent increases in greenhouse gas concentrations have produced the expected         Reconciling space-based EO records
changes to the outgoing energy emitted by the Earth. They have also been key         with other evidence for change.. .....11
in confirming some aspects of the climate response to change, including the
operation of a positive water vapour feedback acting on global temperatures.         Future capabilities and implications
However, while they play a critical role in evaluating and improving the models      for climate policy ................. .... 16
used to make future climate projections required by policymakers they are
not yet of sufficient accuracy to definitively establish the pace and scale of the   Conclusions........................... 19
climate response to changes caused by human activity.
                                                                                     References........................ .... 20
Historically most satellite observations have been tailored to the needs of
weather forecasting which demands highly detailed information on short
timescales but places less stringent requirements on absolute accuracy, long
term stability and comprehensive sampling. Climate monitoring is by contrast
generally concerned with widespread but relatively small changes in statistical
                                                                                     Grantham Briefing Papers analyse climate
properties of fields which may occur over relatively long periods of time. This      change research linked to work at Imperial,
places somewhat different demands on the observations required. However,             setting it in the context of national and
existing data has the advantage of spanning many years and because of its            international policy and the future research
                                                                                     agenda. This paper and other Grantham
continuity, there is the possibility of overcoming some of the limitations of        publications are available from www.imperial.
the measurement accuracy through the inter-comparison of different sensors.          ac.uk/climatechange/publications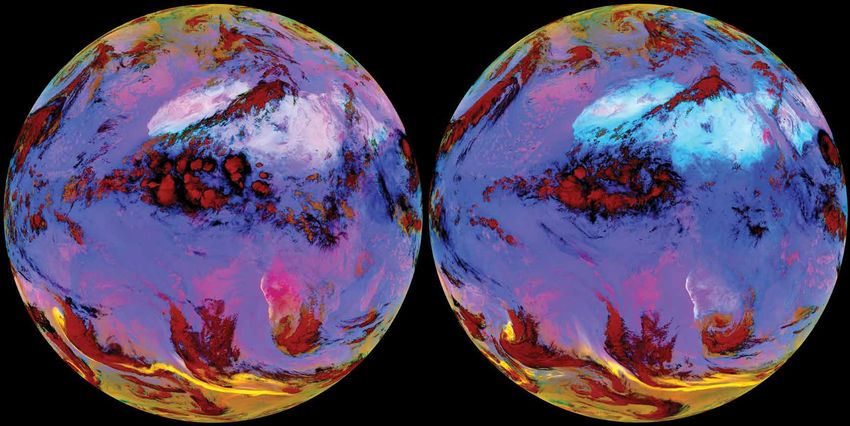
Imperial College London    Grantham Institute for Climate Change

The process is not always straightforward, and artefacts in the          Introduction
measurements if not properly treated can compromise their use
for the study of climate. It is also a high risk strategy from the       The aim of this briefing paper is to provide an overview of the
point of view of climate monitoring, as any gaps in the record           way measurements from space can provide a basis for the
in the future, caused for example by the delay in the launch             understanding and analysis of climate change, highlighting some
of a new sensor or the early failure of an existing one, destroy         of the insights that they have provided but also describing the
our ability to link the records from different sensors and thus          difficulties that are inherent in constructing climate quality space-
effectively end the record. Hence, while existing observations           based records. We also introduce several proposed initiatives
have provided us with many insights into the state and the               that may help to resolve some of these difficulties in the future
evolution of our climate, their limitations, coupled with the desire     and provide an indication of how these data may be used to
for rapid, ‘policy relevant’ results have also sometimes resulted in     address several important scientific and policy areas.
imperfect interpretation and flawed conclusions. This highlights
the need both for better quality climate focused observations and        Since the launch of the first successful weather satellite,
careful, judicious exploitation.                                         Television InfraRed Observation Satellite (TIROS-1) in 1960,
                                                                         space-based instrumentation has played an increasingly
However, the situation is changing. Innovative techniques                important role in monitoring our climate system. The state-of-the-
are being employed to maximise the usefulness of existing                art in space-based Earth Observation (EO) has evolved from what
observations for climate monitoring, and an increasing number            now appear relatively humble beginnings using simple cameras
of specifically climate focused satellite observations promise           taking videos or photographs of the Earth and its atmosphere1,
new advances. For the existing measurements, routine inter-              to a billion-dollar industry2,3 exploiting and developing a wide
calibration of instruments and tracking of their calibration             variety of instrumental techniques designed to target specific
stability over their operational lifetime is now performed. This         environmental variables.
tracking uses the results of dedicated programmes which have
characterised both stable Earth sites and targets such as the            The sheer breadth of the EO data currently collected makes
Moon so that they can be used to provide known comparison                it impossible to cover every use to which they could be put in
points. In the near future planned missions will open up further         this relatively short note. Given the focus on climate relevant
possibilities such as directly monitoring CO2 emissions from             time-scales, the scope of the paper is limited to discuss records
space. And, while there is a concern that even with these efforts        derived from passive satellite sensors since these span the
the current observations are not sufficient for us to detect             longest time period, being available on an operational basis
potentially important changes to our climate in time to mitigate         from the late 1970s onward. Passive sensors collect radiation
their effects, or that we have sufficient information to test and        that emanates from the climate system, as compared with
improve our understanding of how the climate will change,                active systems, that send out a pulse and collect the reflected
sensors with the ability to do this are now possible.                    signal, and require significantly more power to operate. We
                                                                         look specifically at how such observations either have or could
Groups in the UK, led by the National Physical Laboratory, and           provide information about a number of key climate ‘forcings’
in the US led by NASA have designed climate focused missions             and ‘feedbacks’.
with high absolute accuracy and stability as cornerstones.
Crucially the missions are optimised to distinguish small signals        For the purposes of this note we define a ‘forcing’ mechanism
of climate change from natural variability and hence provide the         as a change applied externally to the climate system—an
information required to detect and attribute these signals to            increase in atmospheric carbon dioxide concentrations as a
the correct underlying cause. If these missions can be brought           result of human activities for example—to which the climate
to fruition they should offer a new perspective on the problem           system must respond. A ‘feedback’ can then occur because of the
of observing climate from space, overcoming many of the                  response of the climate system itself to that forcing. For example,
current limitations and providing a robust monitoring system             a reduction in the extent of the polar ice caps in response to
into the future. That such missions are now possibilities is a           surface warming caused by an increase in atmospheric carbon
testament both to technological advances and to our improved             dioxide would reduce the reflectivity of these regions. This
understanding of the climate system, gained in no small measure          constitutes a positive feedback as it allows a larger fraction of
from previous and current missions. Despite scientific approval          incident solar radiation to be absorbed, resulting in additional
of these plans, successful design phases of the projects and the         warming. We frame the discussion in terms of measurements that
magnitude of the risks associated with climate change, funding           can provide insight into the overall energy balance of the planet,
pressures on both sides of the Atlantic make the future of these         and those which can identify and quantify specific quantities of
ventures uncertain.                                                      direct interest to policymakers and the general public such as
                                                                         temperature and humidity.

2       Briefing paper No 9 February 2013                           Monitoring the Climate system from space: progress, pitfalls and possibilities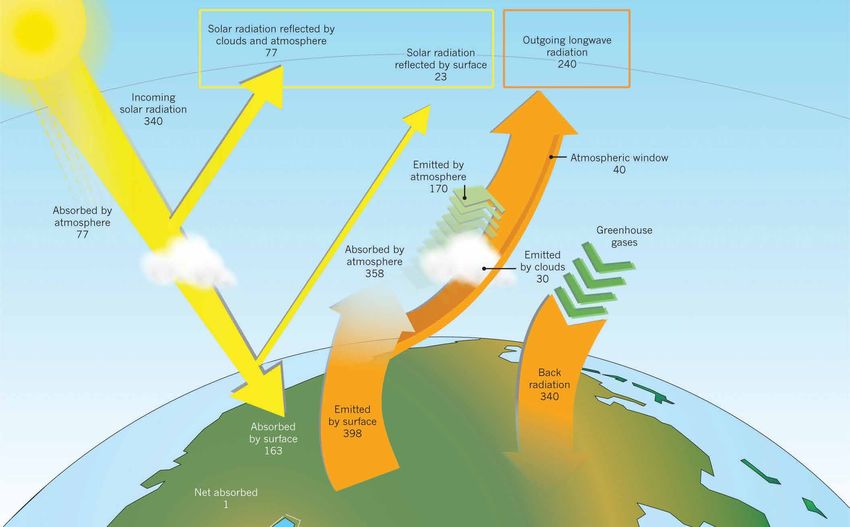
Grantham Institute for Climate Change    Imperial College London

Understanding the satellite                                                  solar energy entering the Earth-atmosphere system must be
                                                                             balanced by the OLR leaving. Hence, if a change results in more
measurements used to study climate                                           energy leaving the system than is absorbed from the Sun, the
change                                                                       net loss of energy will cause the average temperature to fall
                                                                             decreasing the outgoing energy until it balances the absorbed
Passive sensors and their applications                                       energy again6. Similarly, if a change causes less energy to
Passive satellite sensors measure the natural radiation (or                  escape than enter, the excess energy will cause heating and the
energy) that is reflected or emitted by objects. Looking at the              average temperature will rise increasing the outgoing energy
Earth from space there are two primary sources of energy that                until balance is obtained. It is this basic principle that lies behind
may be measured by such instruments: energy from the sun                     the theory that human-induced increases in greenhouse gases
which has been reflected by the Earth (which may be referred                 such as carbon dioxide, the associated increased absorption of
to as solar, or shortwave radiation (i.e. light)), and the thermal           thermal energy and hence the reduction in the amount of thermal
emission from the Earth itself (the Outgoing Longwave Radiation              energy which escapes to space—the anthropogenic greenhouse
or OLR) (Figure 1).                                                          effect—will lead to increased surface temperatures and ‘global
                                                                             warming’7,8.
Looking at Figure 1, arguably the most fundamental climate
variable that can be measured from space is the Earth’s Radiation            Satellite sensors designed to observe the ERB measure the total
Budget (ERB), comprising the total incoming energy from                      reflected shortwave and emitted longwave energy. However,
the Sun, and the total outgoing energy, a combination of the                 this energy from the Sun and Earth is distributed over a range of
reflected solar energy and the OLR. Why is the ERB so important?             wavelengths; in the shortwave these range from the ultraviolet
The incoming, shortwave energy from the Sun to the Earth is the              (UV) through the visible spectrum to the near-infrared (IR) and
basic power source driving our climate5. Solar energy absorbed               a little beyond; in the longwave the majority of the energy is
by the Earth-atmosphere system is eventually re-emitted as                   emitted at thermal and far infrared wavelengths but there is
thermal radiation, some of which escapes to space. The amount                also a measurable amount at longer microwave wavelengths
of thermal energy which escapes depends on the temperature                   (Figure 2). Some sensors are designed to make measurements
and composition of the Earth-atmosphere system. To maintain                  across specific wavelength intervals. As the properties of
a steady-state, i.e. to avoid warming or cooling, the amount of              the Earth’s surface and atmosphere vary with wavelength,

Figure 1: Components of the Earth’s annual global mean energy budget (after Loeb et al., 2009)4. Each component is expressed as
a flux of energy in W m-2. Satellite based passive instruments viewing the Earth can measure the reflected solar radiation (yellow
box) and the outgoing longwave radiation (orange box). Over the time and space scales considered here these outgoing fluxes
approximately balance the incoming solar radiation.

Monitoring the Climate system from space: progress, pitfalls and possibilities                         Briefing paper No 9 February 2013         3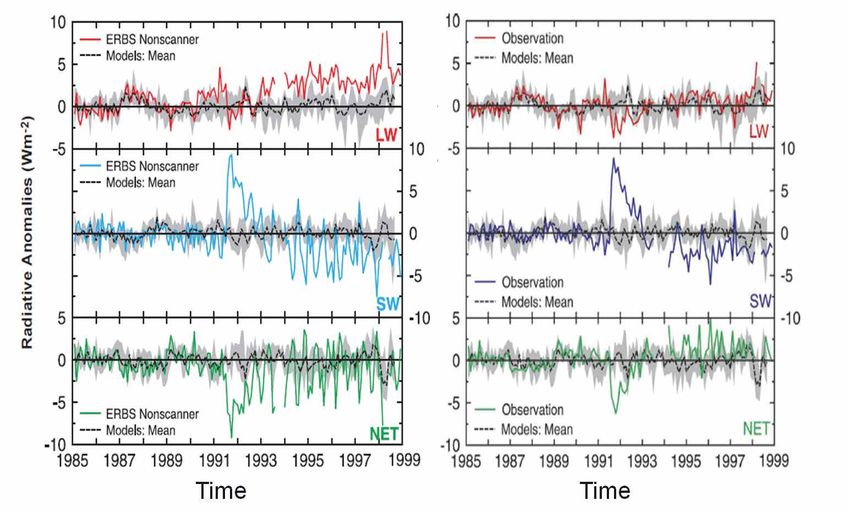
Imperial College London    Grantham Institute for Climate Change

Figure 2: The distribution of energy across wavelength for perfect ‘blackbody’ emitters at temperatures typical of the emission from
the Sun and Earth. Because the Sun is so much hotter than the Earth, incident and reflected solar energy at the top of the Earth’s
atmosphere is mainly confined to ‘short’ wavelengths whereas outgoing energy emitted by the Earth mainly falls within the ‘long’
wavelength regime. In reality the energy spectra from the Sun and Earth is more complicated due to variations in emission properties
with wavelength (see Figure B1, Box 1), however the energy still falls within the envelopes of these basic blackbody curves (adapted
from Goody and Yung9).

appropriate measurements at different wavelengths can provide              surface. It is dependent on the surface type—as we noted above,
a lot of information about the atmospheric or surface state.               ice reflects a lot of solar radiation—and plays an important
Combining observations from instruments measuring across                   role in modulating the surface energy budget. Changing land
the shortwave and longwave wavelength regimes is particularly              use, for example, can alter the surface albedo, perturbing the
beneficial, allowing us to exploit the sensitivities of each regime        surface energy budget and potentially further modifying surface
to investigate specific climate variables.                                 conditions, thus acting as a climate feedback. Clearly then, many
                                                                           of the individual variables have complex inter-dependencies
As an example, consider attempts to map sea ice extent, a                  within the climate system.
climate variable believed to be highly sensitive to human-induced
climate change10. Since sea-ice is much more reflective than the           What about the state of the atmosphere itself? Here again
ocean at visible wavelengths, observations of reflected solar              passive sensors can be used to obtain information concerning
radiation in the visible can be used to monitor changes in its             critical climate variables such as temperature, water vapour,
extent, usually at relatively high spatial resolution (~100m).             carbon dioxide, cloud, atmospheric winds and aerosols. Box 1
However, such measurements can only provide such information               shows how clear-sky infrared and microwave observations from
during sunlit hours and when clouds do not obscure the surface.            operational satellite instruments are sensitive to different heights
Fortunately, ocean and sea-ice also appear markedly different              within the atmosphere, making it possible in theory to infer or
when viewed at microwave wavelengths because of differences                ‘retrieve’ temperature and gas vertical profiles. Shortwave and
in their emission at these wavelengths: a patch of sea-ice will            longwave measurements can also be used either independently
emit more microwave radiation than a patch of ocean at the same            or together to first detect cloud and then build up a detailed
temperature. Although microwave observations generally have                picture of its properties. A similar approach can be employed to
a poorer spatial resolution (~ 10km) than those made at visible            quantify and characterise aerosols within the atmosphere. These
wavelengths, they have the advantage of being able to provide              tiny solid particles or liquid droplets held in suspension in the
measurements at all times of day and microwave radiation can               air play a crucial role in modifying the energy budget of the Earth
also penetrate through cloud.                                              both directly, by reflecting and absorbing energy, and indirectly
                                                                           by modifying cloud properties and lifetimes12.
Similar approaches, using carefully selected wavelength
combinations, have been used to generate long-term records of
many so-called ‘Essential Climate Variables’ from passive space-
based sensors (Figure 3). For the Earth’s surface these include:
land and sea-surface temperatures; land use, with particular
focus on vegetation mapping and productivity; ocean colour,
a measure primarily of the chlorophyll and dissolved carbon
content or the biological activity of the upper ocean; ocean
currents; snow cover and surface albedo. This last quantity is the
fraction of incident solar radiation that is reflected by the Earth’s

4        Briefing paper No 9 February 2013                            Monitoring the Climate system from space: progress, pitfalls and possibilities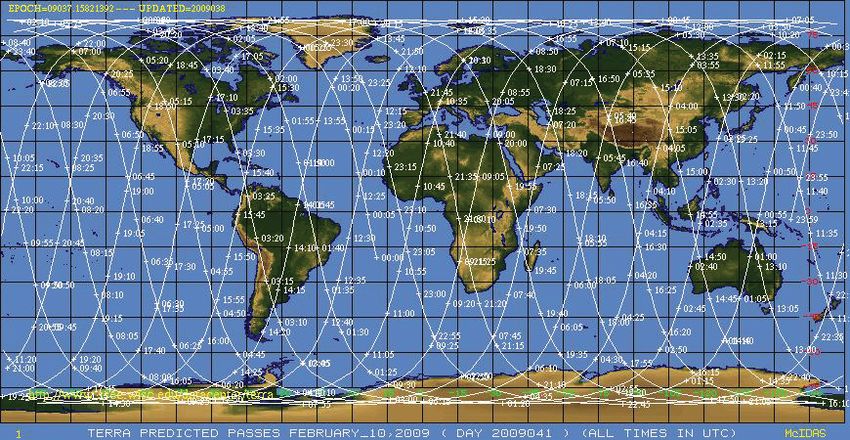
Grantham Institute for Climate Change    Imperial College London

Figure 3: Essential Climate Variables (ECVs) as defined by the Global Climate Observing System (GCOS)11. Variables are defined
as belonging to five general categories: terrestrial, oceanic surface and sub-surface, atmospheric surface or atmospheric upper air.
Space-based passive EO sensors are currently used to infer those variables which are boxed.

Monitoring the Climate system from space: progress, pitfalls and possibilities                 Briefing paper No 9 February 2013       5
Imperial College London Grantham Institute for Climate Change
Types of satellite orbit Satellites in geostationary orbit on the other hand, are located
For space-based Earth Observation there are two main categories some 36,000 km above the equator and orbit at the same speed
of satellite orbit, ‘low earth’ and ‘geostationary’. Satellites placed as the Earth rotates and thus stay over the same point on the
in low earth orbit generally fly at altitudes between 600–2,000 Earth throughout the day. As a result, they are limited in the
km above the Earth’s surface. The weather satellites from which area they can view but can monitor the behaviour of this area
we have our longest global records are typically placed in special continuously in time. Hence measurements from instruments
orbits—sun-synchronous near polar orbits—which pass above flying on these satellites are often exploited to track rapidly
or nearly above both poles of the Earth. This allows them to developing phenomena like hurricanes, wildfires, volcanic ash
gradually build up a picture of the whole globe as the Earth clouds and tropical storms (Figure 5). More generally, since the
rotates beneath them. The sun-synchronous aspect means that height of specific features (such as those due to cloud or water
the instruments on board the satellite will always observe a given vapour) can be inferred, it is possible to use sequential imagery
location at the same local time or times (Figure 4). This may be from these sensors to derive three dimensional atmospheric
useful if one does not wish the observations to be affected by, circulation patterns.
for example, the daily cycle in surface temperature.
In essence then, polar-orbiting satellites can provide global
coverage, with a repeat time (the time it takes to return to
the original orbital track) of the order a few days to a month,
while geostationary satellites provide high resolution temporal
coverage for the part of the globe they can observe from their
fixed location. In both cases, instruments on the satellites
typically make observations continuously in time, generating
a huge volume of data that needs to be transmitted back to
Earth and subsequently exploited. For example, the Space
and Atmospheric Physics Group at Imperial routinely receives
and archives observations from the Spinning Enhanced Visible
and Infrared Imager (SEVIRI), a passive narrowband imager in
Figure 4: Orbital tracks and time of observation (in white) of the geostationary orbit. A day’s worth of data from just this one
sun-synchronous Terra satellite for February 10th 2009. Over instrument comprises of the order 40 gigabytes. Instrumentation
the course of a day the satellite samples a given location twice planned for the next generation of geostationary satellites
(Extracted from 13). will have higher spatial, temporal and spectral resolution,
substantially increasing the demand on data-reception and
storage facilities.
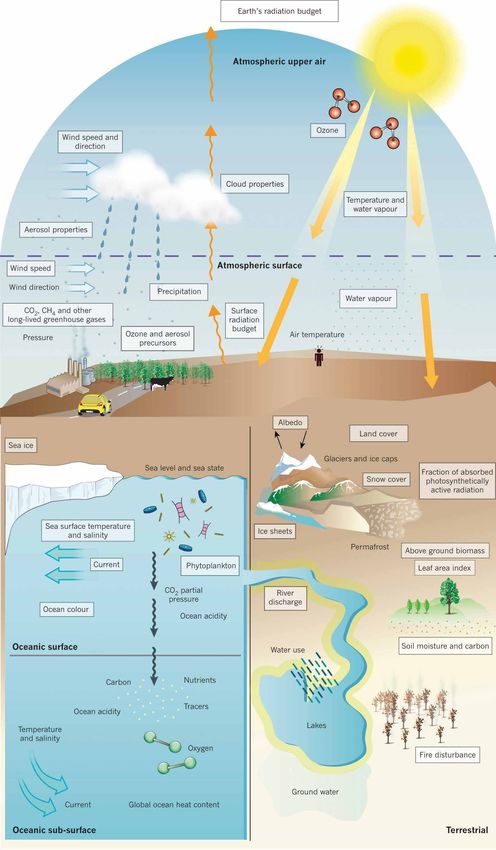
Figure 5: Imagery from SEVIRI on Meteosat-8 at midnight (left) and 12 pm (right) on 8th June 2011 viewing Europe, Africa, Arabia and
the Atlantic. Deep red colours indicate cloud systems, the area of deep magenta over Sudan is a developing Saharan dust storm, while
the yellow streaks are volcanic ash transported over the South Atlantic from the eruption of the Puyehue volcano in Chile (Source: Raw
data from EUMETSAT, authors own imagery).
6 Briefing paper No 9 February 2013 Monitoring the Climate system from space: progress, pitfalls and possibilities
Grantham Institute for Climate Change    Imperial College London

Instrument viewing geometry                                                 for nadir viewing instruments to produce a large amount of
Dependent on the particular application for which a passive                 vertical structure information for reasons we shall discuss
instrument is intended it may be designed to look downwards                 below, when it is possible they can provide relatively detailed
through the Earth’s atmosphere towards the surface, (a so-called            geographical maps of the variable of interest.
‘nadir’ view), or horizontally through the atmosphere without
intersecting the Earth’s surface (a ‘limb’ view). An individual
instrument can be designed to operate in both modes but
not simultaneously (Figure 6). Each observation from a limb
viewing instrument is restricted to a limited altitude range in
the atmosphere, but relates to a large geographical region.
These instruments can step though the atmosphere in height,
building up a highly detailed picture of the vertical distribution
of a particular variable, but in general the observations suffer
from poor horizontal spatial resolution because of the integrated
nature of the signal they receive from along the long limb path.
By contrast a nadir observation relates to a specific geographic
location, but the effect of the surface and different levels in the
atmosphere are combined in the measurement. However because
the properties of the various components of the atmosphere
vary with wavelength in a defined way, by combining nadir
observations at many different wavelengths it is in principle
possible to obtain a vertical profile (or ‘sounding’) of temperature
or gas concentrations throughout the atmosphere. One can also                Figure 6: Schematic of a nadir and limb view through the Earth’s
infer the total amount of cloud or aerosol within the vertical               atmosphere. In this case the instrument is measuring reflected
column of atmosphere seen by the sensor. While it is a challenge             solar radiation. Taken from 14.

 Box 1: How do passive satellite sensors provide                            the black line is close to the top dashed curve (for example
 information about our atmosphere?                                          between 10-12.5 µm) there is relatively little absorption of
                                                                            energy by the gases in the atmosphere and most of the OLR
 Consider a downward looking (nadir viewing) instrument                     lost to space at these wavelengths originates from or near
 measuring the outgoing energy from the earth at infrared                   to the surface (which has a temperature of 300 K). Marked
 wavelengths. The energy received by the sensor will comprise a             differences between the black curve and the red 300 K line
 component which has originated from the Earth’s surface and is             occur at wavelengths where there is significant atmospheric
 transmitted through the atmosphere, and a component which                  absorption (for example due to CO2 between ~14-17 µm). As we
 is emitted by the atmosphere itself. The balance between how               move from a non-absorbing (12.5 µm) to more absorbing region
 much energy comes from the surface and how much comes                      (14.5 µm) the atmosphere is becoming more opaque and from
 from each height within the atmosphere varies with wavelength,             space we are effectively seeing energy which has originated
 and is a result of the surface properties and the temperature              from higher in the atmosphere where it is colder (right-hand
 structure and composition of our atmosphere, since each gas                panel of B1). Hence, if we know how much of the absorbing gas
 has different characteristic wavelength bands over which it can            is present and how its absorption changes with wavelength we
 absorb and emit energy. Clouds and some types of aerosol also              can use measurements at different wavelengths to determine
 affect the amount of energy received by the sensor in a way                the temperature at different heights within the atmosphere15
 which varies with wavelength dependent on their properties,                (usually referred to as the ‘vertical temperature profile’). Since
 making it possible in theory to obtain information about them              the concentration of CO2 does not vary substantially with
 such as their height and amount.                                           height within the lower atmosphere—the troposphere and
                                                                            stratosphere, passive measurements of OLR at wavelengths
 Some of the key atmospheric gases that absorb at infrared                  where CO2 absorbs energy can be used to obtain the
 wavelengths are shown in the left-hand panel of Figure B1.                 temperature profile of the lower atmosphere. Conversely, if we
 The panel shows an example of the effect these absorbers                   want to know how the concentration of a gas varies with height
 have on the clear-sky OLR wavelength spectrum of energy                    and location (for example water vapour), once the temperature
 (in black). The dashed red lines show the amount of energy                 profile is known, observations of OLR at wavelengths where
 emitted at each wavelength by a blackbody’ emitter at the                  this gas absorbs significant amounts of energy can be used to
 temperatures (in Kelvin: Degrees Celsius are equal to Kelvin               obtain a vertical profile of the gas amount16.
 minus 273.15) marked on the curves (c.f. Figure 2). Where

Monitoring the Climate system from space: progress, pitfalls and possibilities                        Briefing paper No 9 February 2013          7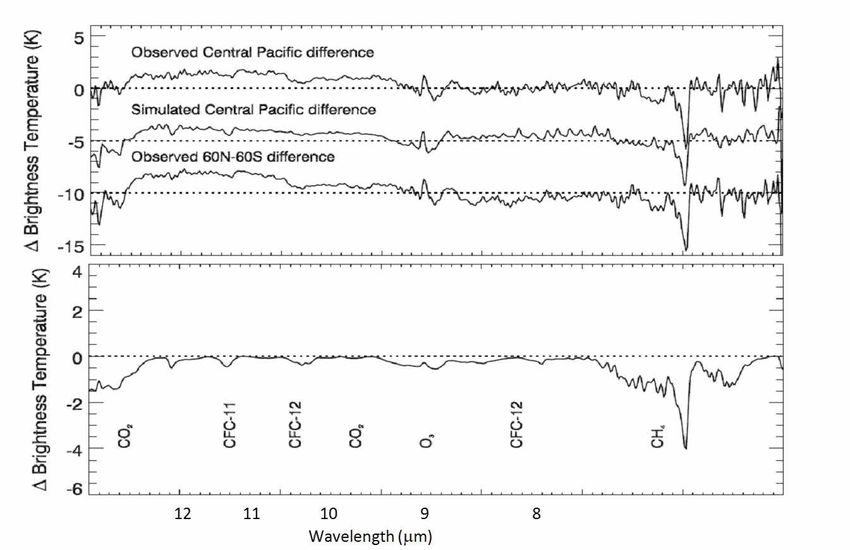
Imperial College London    Grantham Institute for Climate Change

 Figure B1: Left: Calculated clear-sky energy spectrum of OLR for a tropical atmosphere (black line). Red dashed lines show
 the energy that would be obtained from blackbody emitters at the temperatures marked on the curves. Right: The associated
 temperature profile. The point at which the blackbody temperature equals the actual environmental temperature provides an
 indication of where in the atmosphere the energy is originating from. Hence the red horizontal line shows approximately where
 the OLR circled in red on the left-hand side panel is originating from while the green horizontal line shows the same information
 for OLR within the green circle (Source: authors own calculations using GENLN217).

 In both cases, and apparent from Figure B1, for measurements           designed specifically to improve our weather forecasting
 over a certain wavelength range, increasing the wavelength             abilities, have very high spectral resolution (1000s of individual
 resolution over this range or the number of individual                 ‘channels’ at different wavelengths across the OLR spectrum)
 absorption features that can be resolved, generally increases          and are classed as ‘hyper-spectral’. However, the instruments
 the amount of information about the vertical structure that            from the past which are typically used to create multi-decadal
 can be obtained. Essentially, averaging over many adjacent             climate records are of the narrow-band type. As we have seen,
 wavelengths, as is generally done by so-called ‘narrow band’           this means that the energy measured within each channel is
 instruments, smears out vertical information.                          the sum of the energy from a much wider vertical layer of the
                                                                        atmosphere. Or more technically, the ‘weighting functions’
 In practice, satellite sensors will always have a finite wavelength    for each channel, which describe how much each level in the
 or ‘spectral’ resolution. The newest atmospheric sounders,             atmosphere contributes to the total signal, are much broader.

Issues in creating long-term space-based                                in temperature, water vapour (or humidity) and cloud18,19,20; the
EO records                                                              impact of natural phenomena on atmospheric temperatures and
The launch of TIROS-N in 1978 can really be considered to be            the response of the climate system21; the variability of the ERB on
the beginning of the global operational EO satellite era because        decadal time-scales, and our ability to model and understand this
of the way in which the observations were freely disseminated           variability22; the concept of ‘missing energy’ within the climate
and could hence be routinely exploited for worldwide weather            system and how this may relate to a recent slow-down in global
forecasting purposes. The TIROS programme essentially                   mean surface temperature increases23,24.
continues up until the present day, albeit with various name
changes reflecting advances in the instrumentation carried by           However, to reliably use satellite observations to make inferences
individual satellites and in the overall organisational structure       about changes to our climate one must first be aware that most
of the programme. Space-based observations of the Earth from            of the measurements, and in particular the programmes from
passive sensors are thus, in principle, available over several          which we have the longest records, were not designed for climate
decades. While this is certainly not long in the context of the         monitoring, but rather to improve our weather forecasting ability.
history of our climate as a whole, the observations can and have        There are subtle, yet important differences in the requirements
been exploited to provide multi-decadal information on a wide           for each purpose. In conventional weather forecasting the aim
variety of topics including, but by no means limited to: trends         is to capture in as much detail as possible the behaviour of the

8       Briefing paper No 9 February 2013                           Monitoring the Climate system from space: progress, pitfalls and possibilities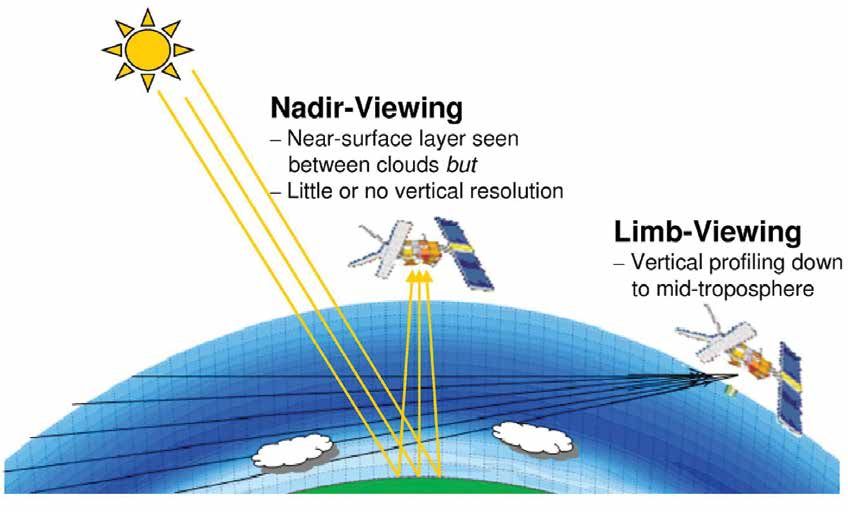
Grantham Institute for Climate Change    Imperial College London

Earth-atmosphere system at the current time. Hence there is a               years or decades; aspects almost totally unconsidered in the
need to reliably compare one measurement to the next over short             requirements for weather forecasting. Note that observations
time periods over the area of interest. This requires that errors           with high absolute accuracy and precision will implicitly have
in the measurement should not vary very much on these scales:               high stability.
that is, they need to have high ‘precision’ (Figure 7). However,
large scale or long term fixed errors in the observations, known            The extent of the problem is greatest where the signals of
as systematic biases, can be corrected for, thus in general,                change are small in comparison with natural variability and
weather forecasting does not demand, or at least prioritise, what           uncertainties in the stability or sampling of the measurements.
is termed high absolute accuracy. Similarly, even changes to                Such behaviour is commonly seen in key climate variables, for
systematic biases over time, as long as they are slow, or occur             example Figure 8 shows a number of records of global mean
suddenly at a known point such as due to a change in instrument,            tropospheric temperature derived from in-situ observations and
are not a huge concern. Thus for many weather forecasting                   from a satellite instrument which is sensitive to the same vertical
applications there is no strong demand for high long term                   region. Over the period of the satellite observations there is,
stability in the measurements.                                              in general, a small positive trend, but the year to year variation
                                                                            is much greater. There are differences between all the records,
In contrast, climate studies are often trying to do two different           even those derived from the same raw measurements, so for the
things. Firstly they want to test that we understand and can                period since 1980 the long-term temperature trend implied by
truthfully represent the climate system and the way it behaves.             each would vary slightly.
For example, do climate models faithfully represent the amount of
energy absorbed by the atmosphere or reflected by clouds right?
This requires measurements with high absolute accuracy, so we
can have confidence in what we are measuring, and relatively
high precision, so we can make repeatable measurements and
achieve a detailed understanding. Secondly they are looking
for relatively small but real changes to the climate which may
be occurring gradually over relatively long periods of time, for
example a change in global mean sea-surface temperature of
0.1 K per decade. The sooner we can confidently detect these
small changes, the more warning we will have of what our future
climate may hold. Hence it is crucial that we are as certain as
possible that the change seen is a true change to the climate               Figure 7: Concepts of precision and accuracy. Left: The
and not a result of errors in the observations or natural climatic          observations have high accuracy (dots close to the bullseye) but
variability. This requires comprehensive sampling (all parts of             are scattered with low precision. Right: The observations have
the globe at different times of day for example) spanning many              high precision (clustered) but a systematic bias from the ‘truth’25.

Figure 8: Global mean tropospheric temperature derived from in-situ radiosonde (T2-HadAT2, T2-RATPAC) and microwave satellite
(Microwave Sounding Unit, MSU) observations (T2-UAH, T2-RSS, T2-VG2). Note that subtly different records can be derived from the
same raw satellite observations because of differences in the approaches employed. This is due to factors explained below (adapted
from Solomon et al26).

Monitoring the Climate system from space: progress, pitfalls and possibilities                        Briefing paper No 9 February 2013       9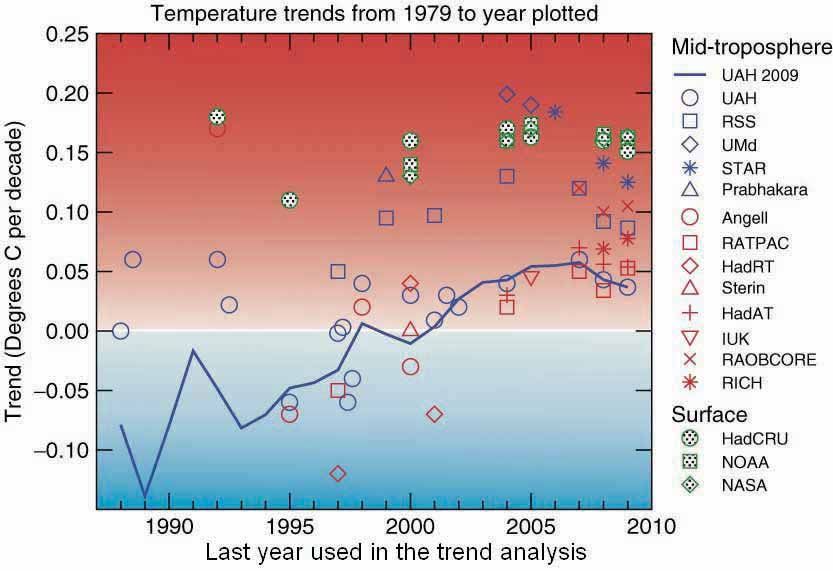
Imperial College London    Grantham Institute for Climate Change

Although the situation is improving, our satellite observing           efforts to derive reliable, long-term satellite records27,28, as we
system is far from optimised to the needs of climate monitoring.       have noted, the original purpose of space-based EO predates
This does not invalidate the substantial efforts that have been        this and was focused on improving short-term weather forecasts.
made to exploit satellite observations for the purposes of             Hence the necessary information concerning the calibration and
long-term change detection, but it does mean that one must             design of, in particular, the earliest instrumentation may not be as
have a thorough understanding of the various factors that can          detailed as required, or may even have been lost.
influence the particular record being exploited. The first step
in creating any reliable instrumental record involves relating         A further complication that must be addressed is the fact that
the measurements a particular instrument makes to known,               satellite orbits tend to drift in time and altitude: the satellite
internationally recognised standards. In other words we need to        does not retain the same sampling characteristics that it had
‘calibrate’ the instrument. Ideally, for satellite instrumentation,    at launch. This can introduce spurious changes to the records
this should be done over the full range of conditions likely to be     derived from space-based instruments29. The degree to which
encountered in space. The harsh space environment also means           a record may be affected can depend on a number of factors
that the lifetime of an individual instrument may be only around       such as the amount of drift, the particular wavelengths that the
3 to 5 years. Even if follow-on instrumentation is intended to         instrument is measuring, the scene type (land, ocean, clear or
be of an identical design, in practice there will always be small      cloudy conditions) and the solar illumination30. For example,
differences that one must be able to account for in order to create    because of the large daily cycle in land surface temperature, a
a consistent record. More often, over time there are less than         channel sensitive to thermal radiation emitted from near the
subtle differences between instruments as technology improves          Earth’s surface, would show significant changes when observing
and greater complexity is possible. Whilst these advances often        a particular land location if there was a substantial drift in time of
allow a more detailed picture of the climatic state to be obtained,    day the satellite observed that location (Figure 9).
they do not necessarily help long term monitoring which is often
better served by long consistent records. Accounting for any           Finally, one should also recognise that the raw space-
spurious differences that are introduced is generally achieved via     based observations must undergo a substantial amount of
a combination of theoretical modelling, assessing the expected         interpretation in order to produce records of the climate variables
impact of known changes to the instrument characteristics, and         that we actually measure on the ground or within the atmosphere
by ensuring that there is sufficient overlap between successive        like temperature or humidity. As outlined in Box 1 it is physically
instruments to enable the instrument induced differences in the        reasonable to ‘retrieve’ atmospheric and surface properties
measurements to be observed over a range of conditions. The two        from the raw radiation measurements but to do this various
sets of measurements can then be adjusted to a common scale,           assumptions must be made. Different research groups may make
or ‘inter-calibrated’ using coincident observations. However, this     different assumptions and employ different retrieval methods.
approach does leave a record highly vulnerable to data gaps,           This means that the same initial set of raw observations can end
a result perhaps of an instrument or launch failure, or simply         up providing the basis for subtly different records of a particular
budget constraints leading to the delay or cancellation of an          climate variable (Figure 8). When climate change signals are
ongoing program. In addition, while rising concern about the state     themselves small and uncertain this has the potential to lead to
of our climate has led to a number of national and international       great controversy, as we shall see in the following section.

Figure 9: Left: Time-series of Brightness Temperature (a measure of radiated energy) anomalies derived from a surface sounding
channel on the High resolution InfraRed Sounder from 1979-2005. The record comprises observations from seven different satellites
carrying basically the same design of instrument: the curve thickness increases for successive satellites. The jumps in the record when
moving from one satellite to the next are clearly apparent, the trends apparent within each satellite record correspond to drifts in an
individual satellite’s orbit overpass time through the day that occur over time—shown on the right (adapted from Jackson and Soden30).

10      Briefing paper No 9 February 2013                        Monitoring the Climate system from space: progress, pitfalls and possibilities
Grantham Institute for Climate Change    Imperial College London

Reconciling space-based EO records                                          had previously been seen in numerous radiosonde analyses.
                                                                            The absence of a tropospheric temperature trend was also
with other evidence for change                                              inconsistent with observed positive surface temperature trends
                                                                            measured over the same period36.
Having discussed the issues involved in creating reliable space-
based EO records, in this section we provide three examples
                                                                            The results sparked a huge international effort to understand
illustrating why no dataset should be considered in isolation.
                                                                            the reason for the discrepancy between the observed trends.
Evaluating any observational record in conjunction with other
                                                                            These detailed analyses unearthed flaws in both the radiosonde
available data can highlight inconsistencies which motivate work
                                                                            and satellite records. From the satellite perspective, these flaws
to understand and account for the discrepancies, potentially
                                                                            were related to many of the points raised in the previous section.
leading to improvements in the individual records as well as
                                                                            One key extra issue related to the sensitivity of the satellite
a greater understanding of their uncertainty. Only after this
                                                                            measurements used to create the records to temperatures in
process can these records be used with confidence to test
                                                                            the stratosphere. In contrast to the surface and troposphere,
model simulations of our past climate to determine where the
                                                                            increasing carbon dioxide concentrations would be expected
models are in agreement with the observations and where robust
                                                                            to cool the stratosphere because of enhanced stratospheric
differences are present, helping to direct future research efforts.
                                                                            emission from the centre of strong carbon dioxide bands resulting
                                                                            in more energy being lost from the stratosphere (Figure B1).
Trends in global temperature and humidity                                   Over time any such cooling would be further exacerbated by
Conventional radiosondes are balloon-borne packages that are                stratospheric ozone loss since ozone strongly absorbs solar
launched from the ground and transmit measurements of the                   radiation. Hence, if an instrument has some sensitivity to the
atmospheric temperature, humidity and pressure as they ascend               stratosphere as well as the troposphere, the effects of changes in
through the atmosphere. Such observations from a network                    stratospheric temperatures must be properly accounted for when
of many locations over the globe have been used to create a                 deriving a tropospheric temperature record. Without such an
dataset extending back to the middle of the 20th century31.                 effort the inferred tropospheric temperatures would include the
However, geographically these measurements were, and still are,             effect of the decreasing stratospheric temperature, which in this
primarily distributed across the US, Europe and Asia (Figure 10).           case partially masked the tropospheric temperature increase.
In contrast, the great advantage of satellite observations is the
regular, global coverage that they can provide. Observations of             Problems were also present in the radiosonde records due in
the OLR at the appropriate wavelengths can, as we have seen,                part to the limited geographic coverage of these data, but also
be used to obtain temperature and humidity information at                   arising from changes in the time of day the measurements were
different levels in the atmosphere. With careful instrument inter-          made, and variations in the sensor type used, as a result for
calibration, long-term space-based records of both quantities,              example, of changes in technology or sensor manufacturer37.
representative of various layers within the atmosphere, can                 Subsequent analysis taking these issues into account derived
be derived.                                                                 improved results from both the space-based and the radiosonde
                                                                            observations. Figure 11 shows how estimates of the global mean
                                                                            trend in surface and mid-tropospheric temperature trends derived
                                                                            from different analyses of radiosonde and MSU satellite data
                                                                            have changed over time, as a result of both the increasing length
                                                                            of the time-series available, but also more critically because of
                                                                            changes and improvements made to the analyses. The most
                                                                            recent results show greater consistency between the surface,
                                                                            radiosonde and satellite derived products, a result which, with
                                                                            consideration of the uncertainties in each record, led to the
                                                                            2007 Inter-governmental Panel on Climate Change (IPCC) report
                                                                            concluding that there was no evidence for a discrepancy between
                                                                            observed and modelled surface and tropospheric warming trends
Figure 10: Locations of stations within the Integrated Global               on the global scale26.
Radiosonde Archive active in 2003 (taken from Durre et al32).
                                                                            However, the same IPCC report noted that there were still marked
What do these records tell us about the recent behaviour of our             deviations in the tropics between modelled and observed surface
atmosphere? Climate modelling studies lead us to expect the                 and tropospheric temperature trends. This is an important
Earth’s surface and lower atmosphere (troposphere) to warm                  difference as enhanced tropical upper tropospheric warming
in unison as a result of the enhanced absorption of longwave                relative to the surface has remained a robust signal in climate
energy caused by increases in carbon dioxide33,34. However,                 model simulations for some time. The physics behind this relates
early observational evidence from MSU satellite data35 did not              to the process of ‘moist convection’ in the tropics. In the tropics
show the warming of the troposphere that was expected and                   the surface is subject to intense solar heating, which leads moist

Monitoring the Climate system from space: progress, pitfalls and possibilities                       Briefing paper No 9 February 2013      11
Imperial College London Grantham Institute for Climate Change tropical air to rise. As the moist air rises into a cooler part of A further, related robust prediction from models is that as the the atmosphere it cools, and the cooling results in some of the climate warms the amount of water vapour within the atmosphere moisture condensing to form liquid water droplets (i.e. clouds). will increase39. Although this is now generally accepted, it has The change from a gas to a liquid, releases energy or ‘latent heat’ been questioned by some authors40. It is important because, as to the surroundings, and warms them. So the whole process evident from Box 1, water vapour absorbs energy across much effectively moves some heat from low down in the atmosphere to of the OLR spectrum. So, if CO2 induced warming caused the higher up, so reducing the temperature difference between the amount of water vapour in the atmosphere to increase this would heights. Technically it decreases the lapse rate, the rate at which result in even more outgoing energy being trapped, enhancing temperature changes with height (see Figure B1 for a typical the initial warming. This amplification of the original temperature tropical temperature profile) within the tropical troposphere. change due to CO2 alone would constitute a significant positive This lapse rate is itself dependent on temperature and humidity climate feedback. Although the total amount of water vapour in since warmer air can ‘hold’ more water vapour and thus more the upper troposphere (UT) is small, increases in water vapour water vapour is available to condense and release latent heat in this part of the atmosphere are most effective at reducing the as the air rises. Hence, as a result of this process an increase in amount of outgoing energy41. surface temperature due to increases in CO2 would result in an even larger increase in the temperature of the upper troposphere There are two reasons for this: firstly, there is strong absorption in tropical convective regions. Although there is still vigorous by UT water vapour in the far infrared part of the longwave debate as to whether observations and model simulations can be spectrum wavelengths where the Earth’s surface emits a great reconciled in this region, there is now a much greater awareness deal of its energy; secondly, the low temperatures typical of of the uncertainties in models and observations associated the UT mean that increased absorption within and re-emission with the natural variability of our climate, and of the difficulties by water vapour from this region can substantially reduce the inherent in creating climate quality datasets from observations amount of longwave energy which escapes to space (Figures 1 which were not originally designed for this purpose38. and B1). Instruments like radiosondes find it very difficult to Figure 11: How estimates of the observed trend in the global mean mid-tropospheric (MT) temperatures from satellite (blue) and radiosonde (red) and in the surface temperature from ground based (green) measurements has changed with time, as more data became available and analysis evolved. The linear trend, shown on the y axis in degrees C per decade, is calculated from changes observed between 1979 and the year shown on the x-axis, which is when the estimate was made. Differences in the trend occur both because of different analysis techniques and because of increasing amounts of data being used. The blue line shows the trend for a single analysis technique (described by University of Alabama (UAH) group in 2009) for an increasing amount of MSU MT observations, with estimates being based initially on less than 10 years of data in 1988 and finally determined from a 30 year record in 2009. (Adapted from Thorne et al.38). 12 Briefing paper No 9 February 2013 Monitoring the Climate system from space: progress, pitfalls and possibilities
Grantham Institute for Climate Change    Imperial College London

Figure 12: Comparison of satellite-observed (black) and model-predicted change in global-mean lower tropospheric temperature with
(blue) and without (red) water vapour feedback included after the eruption of Mount Pinatubo in 1991 (adapted from Soden et al21).

measure the very small amounts of water vapour in the UT                    sensitive the radiation budget is to changes in these variables.
accurately. Satellite based measurements that observe the large             Key studies exploiting ERB measurements have provided
effect this small amount of water has on the outgoing energy                observational evidence for the greenhouse effect43; insights
and are thus very sensitive to UT humidity can therefore play               into how aerosol pollution may act to cool the surface but heat
an important role in assessing the patterns and trends in some              the atmosphere, potentially changing circulation patterns44;
of the most critical parts of the global humidity field over the            the suggestion that the tropical atmospheric circulation has
recent past. For example, on the global scale, vertical profiles of         intensified, leading to moistening of already moist regions and
specific humidity derived from thermal infrared hyper-spectral              drying of dry regions45; and estimates of the way in which the
measurements show an increase in the amount of tropospheric                 response of clouds to a warming climate can further accentuate
water vapour with increasing surface temperature42.                         this warming46.

Even more compellingly perhaps, the volcanic eruption of Mount              Again however, constructing long-term climate quality records
Pinatubo in 1991 has been used as a test to see how well we                 from the observations is far from straightforward. One such
understand the response of the climate system to a perturbation             attempt showed large decadal variability in the ERB observed
to the ERB. The eruption injected a large amount of reflective              over the tropics. Comparisons with model simulations over
material into the upper atmosphere, reducing the amount of solar            the same period showed that they were unable to capture this
radiation reaching the surface and decreasing global tropospheric           behaviour. It was initially thought that the problem lay with the
and surface temperatures over the following couple of years.                way the models simulated clouds22 but subsequent analysis
A positive water vapour feedback would cause a subsequent                   revealed three issues with the observations. First, the way in
reduction in UT absolute humidity and a further cooling of                  which averages had been calculated from the observations meant
the troposphere, and this was indeed observed from space.                   that the change in incident solar energy through the day had
Moreover, without including this positive feedback in climate               introduced spurious variations in the calculated values. Second,
model simulations of the period, the observed result could not be           the altitude of the satellite carrying the ERB instrumentation
simulated (Figure 12)21.                                                    decreased over time, leading to an artificial increase in the
                                                                            energy fluxes measured. Third, a small drift in calibration of
Variability in the Earth’s Radiation Budget                                 the instrument measuring the solar component of the ERB was
Starting with the Earth Radiation Budget instrument on the                  found. Applying suitable corrections to account for these issues
Nimbus-7 satellite in 1978, accurate measurements of the total,             much improved the agreement between the model simulations
broadband energy reflected and emitted by the Earth have been               and observations47 (Figure 13).
made by a variety of satellite instruments up to the present day.
Given the fundamental link between the radiation budget at the              More recently, ERB measurements used in conjunction with
top of the atmosphere and the evolution of our climate, these               observations of ocean heat content have suggested that we do
data offer an invaluable way to test our overall understanding of           not yet fully understand the energy flows within our climate23.
the workings of our climate system. By carefully combining such             In particular, it has been argued that the net energy leaving the
measurements with observations from other instruments which                 Earth, responding, in the main, to increases in greenhouse gas
are sensitive to specific components of the climate system like             concentrations such as CO2, has, since about 2004, reduced at
water vapour, clouds or aerosols it is also possible to see how             a faster rate than the ocean heat content has increased. Since

Monitoring the Climate system from space: progress, pitfalls and possibilities                        Briefing paper No 9 February 2013     13
Imperial College London Grantham Institute for Climate Change Figure 13: Observed (coloured lines) Longwave (LW); Reflected shortwave (SW) and Net outgoing tropical (20°S -20°N) radiation anomalies relative to the 1985-1989 average calculated from the Earth Radiation Budget Wide Field of View Instrument. Left: As originally reported by 22, Right: After corrections for spurious solar diurnal signal and satellite orbit decay47. In both cases the observations are compared to the simulations from the same set of five climate models. The black dotted line shows the multi-model mean, while the shading shows the total model range. The distinct feature from mid-1991 to early-1993 is due to the eruption of Mount Pinatubo which injected a large amount of highly reflective material into the Earth’s atmosphere21. The models did not attempt to simulate this eruption so the discrepancy over this period is to be expected (adapted from figures presented by Wielicki et al22 and Wong et al47). over 90% of the extra energy trapped in the climate-system is of changes in energy due to changes in specific climate variables stored in the ocean these two records should track each other. like cloud or water vapour may, and do, compensate. Hence A reduction in the amount of excess energy going into the ocean although climate change signals over specific wavelength ranges would be expected to lead to an increase in the rate at which the may be large, the net impact on the ERB, comprising the effects of surface temperature was rising, so the discrepancy, which led to a myriad of different processes, may be very small48. In contrast, the coining of the term ‘missing energy’ is inconsistent with the if measurements of the solar energy and OLR can be made recent slow-down in the rise of global mean surface temperature. separately at each wavelength or spectrally resolved, we may be A subsequent analysis, taking full account of the uncertainties able to avoid the compensating effect inherent in the broadband both in the ERB and ocean heat content observations has shown approach and identify and monitor the effects of changes in many that the updated records can be reconciled24. Nonetheless, different components. Essentially the same information that is both sets of scientists agree that upgrades to the measurement used to perform retrievals of different climate variables would be network are needed in order to improve our ability to track the used, but without introducing the uncertainties associated with behaviour of these crucial climate variables. the retrieval process itself. Direct use of spectrally resolved information Could this work in practice? Although the situation is improving, Up to now we have either discussed how climate variables can continuous records of space-based spectrally resolved radiation be retrieved from passive space-based measurements of the are only available from the early 2000s onwards, and even these outgoing energy, or considered the ERB. While ERB observations are not over the full shortwave and longwave ranges. Isolated provide the overall energy budget at the top-of-the-atmosphere, missions have provided measurements for short periods from the alone, they are not the ideal tool to identify specific climate 70s and 90s which have been used to show the power of such processes. Since the measurement sums the energy across all the data in terms of highlighting the effects of changes in greenhouse wavelengths in the shortwave or longwave, the combined effect gas concentrations on the Earth’s OLR spectrum49 (Figure 14). 14 Briefing paper No 9 February 2013 Monitoring the Climate system from space: progress, pitfalls and possibilities
You can also read