Untargeted Metabolomics Reveal Defensome-Related Metabolic Reprogramming in Sorghum bicolor against Infection by Burkholderia andropogonis - MDPI
←
→
Page content transcription
If your browser does not render page correctly, please read the page content below
Article

Untargeted Metabolomics Reveal Defensome-Related
Metabolic Reprogramming in Sorghum bicolor
against Infection by Burkholderia andropogonis
Charity R. Mareya, Fidele Tugizimana, Lizelle A. Piater, Ntakadzeni E. Madala, Paul A.
Steenkamp and Ian A. Dubery *
 Centre for Plant Metabolomics Research, Department of Biochemistry, University of Johannesburg, Auckland
 Park 2006, Johannesburg, South Africa; charitymareya25@gmail.com (C.R.M.), fideletu@gmail.com (F.T.),
 lpiater@uj.ac.za (L.A.P.), ntaka.madala@univen.ac.za (N.E.M.), psteenkamp@uj.ac.za (P.A.S.)
 * Correspondence: idubery@uj.ac.za; Tel.: +27-011-559-2401; Fax: +27-011-559-2370

 Received: 10 November 2018; Accepted: 24 December 2018; Published: 2 January 2019

 Abstract: Burkholderia andropogonis is the causal agent of bacterial leaf stripe, one of the three major
 bacterial diseases affecting Sorghum bicolor. However, the biochemical aspects of the
 pathophysiological host responses are not well understood. An untargeted metabolomics approach
 was designed to understand molecular mechanisms underlying S. bicolor–B. andropogonis
 interactions. At the 4-leaf stage, two sorghum cultivars (NS 5511 and NS 5655) differing in disease
 tolerance, were infected with B. andropogonis and the metabolic changes monitored over time. The
 NS 5511 cultivar displayed delayed signs of wilting and lesion progression compared to the NS 5655
 cultivar, indicative of enhanced resistance. The metabolomics results identified statistically
 significant metabolites as biomarkers associated with the sorghum defence. These include the
 phytohormones salicylic acid, jasmonic acid, and zeatin. Moreover, metabolic reprogramming in an
 array of chemically diverse metabolites that span a wide range of metabolic pathways was
 associated with the defence response. Signatory biomarkers included aromatic amino acids,
 shikimic acid, metabolites from the phenylpropanoid and flavonoid pathways, as well as fatty acids.
 Enhanced synthesis and accumulation of apigenin and derivatives thereof was a prominent feature
 of the altered metabolomes. The analyses revealed an intricate and dynamic network of the sorghum
 defence arsenal towards B. andropogonis in establishing an enhanced defensive capacity in support
 of resistance and disease suppression. The results pave the way for future analysis of the
 biosynthesis of signatory biomarkers and regulation of relevant metabolic pathways in sorghum.

 Keywords: Burkholderia andropogonis; defence; flavonoids; metabolomics; phytochemicals;
 phytohormones; phytoalexins; Sorghum bicolor

1. Introduction
      Sorghum [Sorghum bicolor (L.) Moench] is the fifth most valuable and highly produced cereal
crop that plays an important role in sustainable grain production and food security, particularly in
semi-arid and tropical areas. Bacterial leaf stripe disease is one of the three major sorghum bacterial
infections considered economically important [1]. The causal agent of the disease is the bacterial
pathogen, Burkholderia andropogonis, a Gram-negative, motile, aerobic soil bacterium [2,3]. B.
andropogonis has a diverse and extensive geographical dispersion as well as host range [4]. Bacterial
leaf stripe symptoms occur primarily on leaves and are characterised by linear lesions which are red,
yellow, tan, or purple in colour, running along the veins due to invasion of the parenchymatous leaf

Metabolites 2019, 9, 8; doi:10.3390/metabo9010008                         www.mdpi.com/journal/metabolites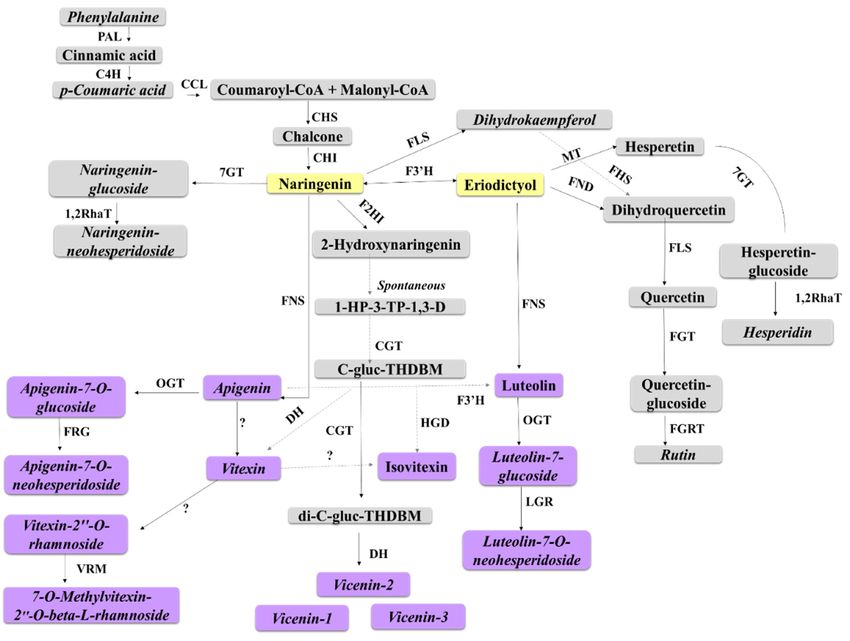
Metabolites 2019, 9, 8                                                                              2 of 25

tissue by the pathogen. In some cases the infection not only occurs on the leaves but stems, flower
buds, calyxes, peduncle, stalk interior, and seeds [2], destroying plants and reducing crop yields.
      Unfortunately, the mechanistic physiological and molecular bases that determine the outcome
of the phytopathogenic interaction between sorghum and B. andropogonis are not well investigated.
Present strategies to aid plants to adapt and defend against such bacterial infection have become
alarmingly less effective and some are environmentally unfriendly [5]; hence, new approaches are
urgently needed to address important global concerns such as boosting agricultural productivity and
sustainable food security [6]. However, to make informed practical decisions on the best tactics in
this regard, it is imperative to understand the molecular details of this specific plant‒pathogen
interaction at a biochemical level [3,4]. Hence, unravelling the intricacies of the molecular
mechanisms underlying the sorghum defensive responses to B. andropogonis infection could provide
descriptive insights that can be explored for development of improved sorghum cultivars.
      In this report, a non-targeted metabolomics approach, based on a liquid chromatography – mass
spectrometry (LC-MS) analytical platform, was used to study the biochemical mechanisms involved
in the defence response of Sorghum bicolor upon B. andropogonis infection. Metabolomics is a
qualitative and quantitative analysis of the metabolome, used to understand the cellular processes
that control the biochemical phenotype of a cell, tissue and whole organism [7]. Newly emerging and
maturing metabolomics approaches have proven to be powerful and indispensable tools to
interrogate plant biochemistry, thus providing a comprehensive and mechanistic understanding of
molecular processes involved in the actual physiological and phenotypic state of the cell or organism
under investigation [8–13].
      The reports on interactions between sorghum and bacterial pathogens are limited; hence, there
is a poor understanding on the aetiology and epidemiology of these diseases [14]. The current study,
therefore, contributes to and expands on this scientific endeavour by profiling defence-related
metabolites differentially deployed by sorghum in response to attack by a bacterial pathogen. Such
biochemical understanding is vital in the development of new crop protection strategies such as
enhancement of natural plant defence mechanisms and production of more resistant cultivars in plant
breeding programs.

2. Results

2.1. Bacterial Leaf Stripe Symptom Progression and Evaluation
     Following treatment of sorghum plants, bacterial leaf stripe progression was visually evaluated
by monitoring symptom development on leaves over time. Both NS 5511 and NS 5655 infected leaves
revealed typical bacterial leaf stripe symptoms (Figure S1A,B in supplementary materials). Small
linear tan lesions appeared on the inoculated plant leaves – which progressively elongated with time,
nearly encompassing the entire leaf surface, and indicative of the disease progression. The plants
started to display symptom development at 3 d.p.i. Appearance of lesions is one of the first visible
indicators of host plant–pathogen interactions and in sorghum, pigmented lesions development is
regarded as an action set to enhance plant resistance [15]. A disease severity-rating indexing, based
on the percentage of leaf area covered in symptoms (Table S1 in supplementary materials), indicated
that both NS 5511 and NS 5655 cultivars showed similar symptom development, as depicted in Figure
S1A,B. However, the symptom progression displayed a cultivar- and time-dependant response to
infection. The NS 5655 cultivar (ST) displayed signs of wilting at an earlier stage relative to the former.
The NS 5511 (BT) cultivar, thus, appeared to be more resistant to the bacterial infection based on the
symptomatology. Although both cultivars are categorised as exhibiting resistance against head smut,
leaf disease and stem rot (Capstone Seeds, Howick, South Africa, see Section 4.1), such information
was not available with regards to bacterial leaf stripe disease.

2.2. UHPLC-MS Analyses of Sorghum Leaf Extracts
   The aqueous-methanol extracts from both infected and non-infected plant leaf tissue samples of
NS 5511 and NS 5655 displayed inherent multidimensionality emerging from the complex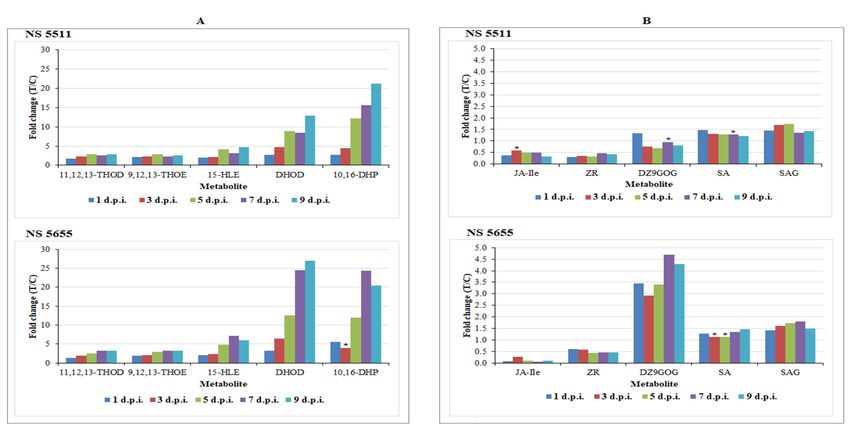
Metabolites 2019, 9, 8                                                                                   3 of 25

physicochemical characteristics of the sample constituents. Visual chromatographic inspection
showed differential observations which included variation in peak intensities and presence/absence
of peaks across samples, indicating differential metabolic profiles: i.e., time-related metabolic
responses (Figures S2 and S3) and differential responses between the cultivars (cultivar-related)
(Figure S4) to bacterial treatment.

2.3. Multivariate Data Analyses: Statistical Description and Explanation of Variation in the Acquired LC-
MS Data
      To further explore and explain differences visually observed in the chromatograms, i.e., to
highlight the metabolic changes induced in response to B. andropogonis infection, statistical analyses
were performed. Multivariate data analysis (MVDA) methods were employed to mine the collected
multidimensional data and extract relevant biological information related to the study [8,16]. PCA
(Figures 1A, S5–S6A, 2A and S7A) provided a non-biased reduction of data dimensionality and
facilitated the identification of trends and patterns in the data, thus giving an overview thereof [17].
The computed PCA models provided a descriptive visual evaluation of the effect B. andropogonis
treatment on sorghum plants, revealing time-related sample clustering. This was reflected by the
time-trend clusters when the PCA scores plot is coloured based on time points (Figures 1B and S5–
S6B) and cultivar-related sample clustering as shown by separation between the NS 5511and NS 5655
cultivars (Figures 2B and S7B). The clustering of samples reflect the differences in metabolite profiles
across the samples and between the two sorghum cultivars respectively. Bacterial infection, thus,
induced differential metabolic reprogramming in S. bicolor plants, with cultivar-related nuances.

      Figure 1. Principal component analyses of the electrospray ionisation (ESI) negative data for sorghum
      NS 5511 (BT) extracts. (A) represents an 11-component model, explaining 84.2% variations in Pareto-
      scaled data, X, and the amount of predicted variation by the model, according to cross-validation, is
      74.1%. (A) and (B) represent the same principal component analysis (PCA) scores plot; with (A)
      coloured according to condition (control vs. infection treatment) and (B) coloured according to time.
      This two-dimensional scores space, spanned by the first two PCs, reveals infection-related sample
      clustering (treated/infected = blue, controls = green) and time-related clustering, (days 1-9 post
      infection) respectively. Note: to determine the group (control/infected) to which the time-related
      clusters in (B) belong, link to the corresponding positions in (A).

      To complement the descriptive view provided by PCA modelling, OPLS-DA, a supervised
statistical tool, was applied to evaluate and explain the uncovered metabolic changes of sorghum
plants responding to B. andropogonis. Generated OPLS-DA score plots (Figure 3A and S8A) show
evident classification of samples, i.e., the samples are clearly grouped into two distinct classes of
treated/infected (blue) and non-treated (green) samples, reflecting the differential metabolite profiles.
Furthermore, the OPLS-DA models were validated using various diagnostic tools, to determine how
well these binary classification models performed and to also rule out model-overfitting in the
supervised modelling [17,18]. These validation steps are regarded as necessary when handling highly
dimensional datasets from LC-MS [19]. To confirm the performance of OPLS-DA as a binary
classifier, the receiver operator characteristic (ROC) plot was employed. ROC plots (Figures 3B and
S8B) graphically summarised a perfect discrimination depicted by the OPLS-DA models (binary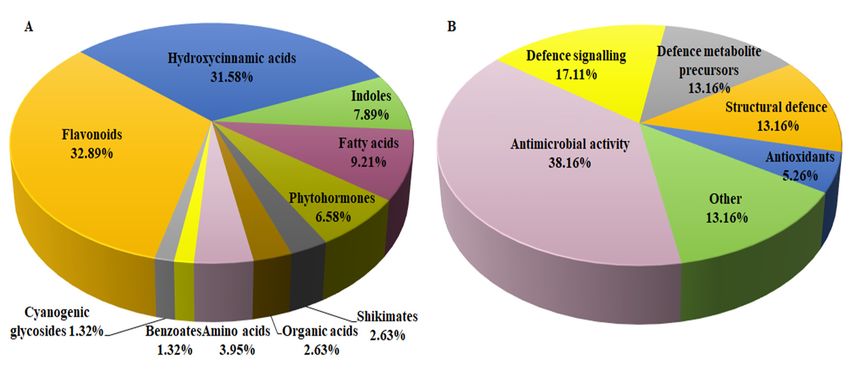
Metabolites 2019, 9, 8                                                                                       4 of 25

classifier) i.e., computed models were perfect classifiers – as revealed by the high sensitivity and
specificity (~ 100%) of the ROC curve [20]. Other additional diagnostic tools used to validate OPLS-
DA models are explained in the supplementary file (and displayed in Figures S9 A,B and S10 A,B).

      Figure 2. Principal component analyses of the ESI negative data for sorghum NS 5511 (BT) and NS
      5655 (ST) extracts. (A) and (B) are 15-component models, explaining 86.0% variations in Pareto-scaled
      data, X, and the amount of predicted variation by the model, according to cross-validation, is 79.6%.
      (A) and (B) represent the same scores plot, with (A) coloured according to condition (control, green
      vs. infection treatment, blue) and (B) coloured according to cultivar. This two-dimensional scores
      space, spanned by the first two PCs, reveals infection-related sample clustering (A, control vs. treated)
      and cultivar-related clustering (B, NS5511 vs. NS 5655).

      Figure 3. Supervised multivariate analyses of the ESI negative UHPLC-MS data for NS 5511 (BT)
      cultivar extracts. (A): The OPLS-DA score plot shows grouping of control vs. infected for all samples.
      This model comprises 1 predictive component and 2 orthogonal components (R2X= 67.2%, R2Y= 99.3%
      and Q2= 98.7%). (B): A representative receiver operator characteristic (ROC) plot summarising the
      performance of OPLS-DA (a binary classification method). (C): The OPLS-DA loading S-plot displays
      the discriminating features (ions) that explain the clustering (sample grouping) observed in the OPLS-
      DA scores plot, with the features in the top right quadrant positively correlated to the treatment and
      those in the bottom left quadrant negatively correlated to the treatment. The loading S-plot comprises
      1 predictive component explaining 47.1% of the total variation and 2 orthogonal components
      explaining 20.1% of the total variation. (D): A VIP plot summarising the importance of some of the
      variables in the projection of the model. A VIP value >1 is significant/important in the projection and
      higher score values indicate an increase in significance of the variables.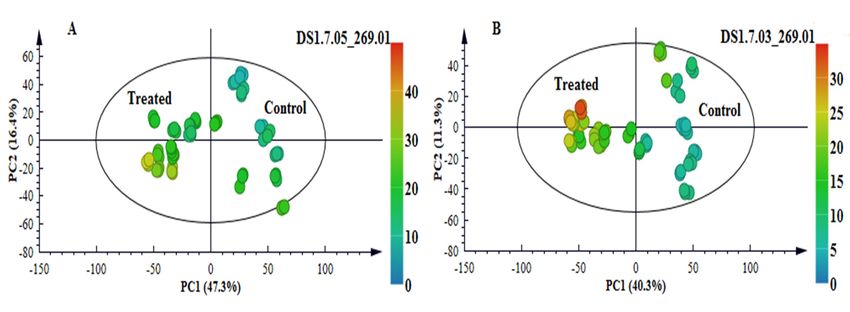
Metabolites 2019, 9, 8                                                                         5 of 25

      For extraction of features responsible for the discrimination between infected and non-infected
samples, variable selection methods such as the OPLS-DA loading S-plot was used (Figure 3C—
NS5511 and S8C—NS 5655). Significant discriminatory features were extracted for metabolite
annotation. The significance of the variables extracted from the S-plot was statistically validated
using VIP plots (Figure 3D and S8D). VIP scores evaluation obviated variable selection bias and
helped describe the importance of the variables to the model. On the VIP plot, variables with a score
of more than 1 are considered significant [16] and an increase in VIP score correlates to increased
significance [21]. Therefore, from the VIP plots the variables with a score greater than 1 were chosen
for metabolite annotation. Figure 3D (and S8D) show some of the selected variables (e.g., highlighted
in red) validated using VIP plots prior to metabolite annotation. Additional tools for further
evaluation of selected variables are presented as part of the supplementary data; Figures S9C and
S10C, NS5511 and NS5655 respectively).
      Following validation of the extracted signatory variables considered as important contributors
to the class discrimination, metabolite annotation was carried out. These variables relating to
metabolic changes following bacterial treatment were annotated to level 2 as classified by the
Metabolomics Standard Initiative (MSI): putatively annotated compounds (without chemical
reference standards) based on mass spectral information. These metabolites are listed in Table 1.
Further details regarding metabolite annotation are given in the experimental section. The fold
changes and p-values of the various metabolites were obtained from the models constructed from all
control samples against all the infected samples of the NS 5511 and NS 5655 cultivars.
      The visual inspection of symptoms and chromatographic analysis results, further investigated
using various statistical tools, evidently pointed to metabolic reprogramming in sorghum plants
responding to B. andropogonis infection. As seen in Table 1 and summarised in Figure 4A, LC-MS-
based untargeted metabolomics facilitated annotation and analysis of an array of chemically diverse
metabolites, representing a wide range of metabolic pathways associated with the plant defence
response. Chemical classification (Figure 4A) highlighted two major classes i.e., flavonoids and
hydroxycinnamic acids (HCAs), highlighting the significance of these metabolites in sorghum
defences. In addition, the annotated metabolites demonstrated to possess various defence-related
functions as summarised in Figure 4B. For example, challenged sorghum plants activated both
structural and chemical defences to counteract pathogen infection. The diversity of the metabolites,
arising from different metabolic pathways (particularly amino acid, fatty acid, shikimic acid,
phenylpropanoid and flavonoid metabolic pathways), showed an intricate and dynamic network of
the sorghum defence arsenal towards B. andropogonis in resistance and disease suppression.
Moreover, it correlates with what is known about cereal responses towards pathogen attack [22] and
reflects the significant genetic diversity and extensive adaptive abilities of sorghum [23]. The
metabolic fluctuations in response to bacterial treatment as well as the functional roles of the
annotated metabolites in defence responses are detailed in the following section. Relative quantities,
expressed as fold changes of the putatively identified metabolites, were used to provide measurable
evaluation of metabolic changes and to give a comprehensive picture of the reprogramming of S.
bicolor metabolism.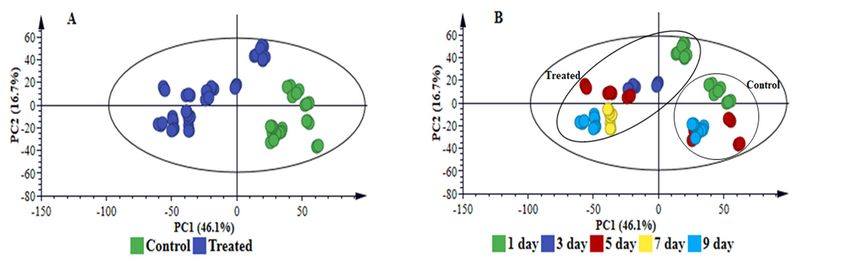
Metabolites 2018, 8, x                                                                                6 of 25

      Table 1. Annotation of discriminatory metabolites belonging to various chemical classes and related to Burkholderia andropogonis-induced metabolic reprogramming in
      Sorghum bicolor plants. Following UHPLC-MS analysis, the selected features from both ESI (+/−) modes, were extracted from OPLS-DA S-plots and annotated at MSI-level
      2. The reported fold changes for cultivars NS 5511 and NS 5655 were obtained from an OPLS-DA model of control vs. all treated/infected samples (1–9 d.p.i.).

                                                                                                                           NS 5511                    NS 5655
                                                                                   Ion        Molecular                                                               Metabolite
                   Metabolites                 m/z      RT (min)      Adduct                                                      Fold                       Fold
                                                                                  Mode        Formula            p-Value                    p-Value                     Class
                                                                                                                                 Change                     Change
                 L-Phenylalanine              180.092     2.59      [M−H_NH3]−     neg        C9H11NO2             0.159           0.9        0.002           0.9     Amino acid
                    L-Tyrosine                182.081     1.13         [M+H]+      pos        C9H11NO3          1.77 × 10⁻³¹       0.5     1.94 × 10⁻³¹       0.4     Amino acid
                  L-Tryptophan                205.097     2.69         [M+H]+      pos        C11H12N2O2        1.87 × 10⁻²⁷       0.6     2.67 × 10⁻¹⁵       0.5     Amino acid
                Benzoic acid                  121.028     4.46         [M−H]−      neg          C7H6O2          1.76 × 10⁻²⁰       0.6        0.603           0.7     Benzoates
                   Dhurrin                    334.090     2.6        [M+H_Na]+     pos        C14H17NO7         2.49 × 10⁻²⁹       0.4     2.51 × 10⁻²⁷       0.4     Cyanogen
                  Apigenin                    269.007     7.05         [M−H]−      neg         C15H10O5            0.838           1.0        0.000           1.5     Flavonoid
        Protocatechuic acid hexoside          315.069     5.41         [M−H]−      neg         C13H16O9         5.24 × 10⁻⁷        1.5     1.67 × 10⁻¹¹       2.1     Flavonoid
                    Tricin                    329.066     8.92         [M−H]−      neg         C17H14O7         6.62 × 10⁻⁷        0.7        0.091           0.8     Flavonoid
            Sophoraflavanone B                341.137     2.50         [M+H]+      pos         C20H20O5         8.06 × 10⁻³⁴       0.4     4.38 × 10⁻²⁷       0.4     Flavonoid
      Trihydroxypentamethoxyflavone           419.095     5.69         [M−H]−      neg         C20H20O10        1.64 × 10⁻²⁴       3.1     1.31 × 10⁻¹⁶       3.8     Flavonoid
            Sophoraflavanone G                423.182     5.46         [M−H]−      neg         C25H28O6         4.59 × 10⁻¹¹       0.6     1.29 × 10⁻⁵        0.7     Flavonoid
      Apigenin-8-C-glucoside (vitexin)        431.099     5.55         [M−H]−      neg         C21H20O10        7.57 × 10⁻⁵        1.4        0.347           1.1     Flavonoid
     Apigetrin (apigenin 7-O-glucoside)       431.098     6.33         [M−H]−      neg         C21H20O10           0.238           1.0        0.001           0.8     Flavonoid
  Naringenin 7-O-beta-D-glucoside (prunin)    433.114     5.91         [M−H]−      neg         C21H22O10        1.44 × 10⁻¹⁶       2.3     5.76 × 10⁻¹⁸       4.6     Flavonoid
           Luteolin 7-O-glucoside             447.091     5.71         [M−H]−      neg         C21H20O11        4.44 × 10⁻¹³       1.6        0.799           1.0     Flavonoid
   Quercetin 3-O-rhamnoside (quercitrin)      447.092     4.61         [M−H]−      neg         C21H20O11        9.02 × 10⁻¹⁷       1.8     8.37 × 10⁻¹⁷       3.8     Flavonoid
   Pentahydroxychalcone 4’-O-glucoside        449.108     4.57         [M−H]−      neg         C21H22O11        7.50 × 10⁻¹¹       1.4     5.49 × 10⁻¹⁹       2.1     Flavonoid
    Apigenin 8-C-xyloside-6-C-glucoside
                                              563.139     5.09        [M−H]−       neg         C26H28O14           0.672             1.1   3.88 × 10⁻⁸          1.2   Flavonoid
                 (vicenin-3)
    Apigenin 6-C-xyloside-8-C-glucoside
                                              563.140     4.87        [M−H]−       neg         C26H28O14        6.91 × 10⁻¹¹         1.2      0.008             1.1   Flavonoid
                 (vicenin-1)
          Vitexin 2’’-O-rhamnoside            577.154     5.32         [M−H]
                                                                           −       neg         C27H30O14        1.43 × 10  −15       1.5   7.43 × 10  −14       1.5   Flavonoid
  Apigenin 7-O-neohesperidoside (rhoifolin)   577.156     6.06         [M−H]−      neg         C27H30O14        1.52 × 10⁻⁷          1.1      0.488             1.0   Flavonoid
            Unknown flavonoid                 581.149     4.33         [M−H]−      neg         C26H30O15        7.67 × 10⁻²⁵         2.5   1.75 × 10⁻¹⁵         2.8   Flavonoid
       Luteolin 7-O-neohesperidoside          593.150     5.51         [M−H]−      neg         C27H30O15        2.20 × 10⁻¹⁵         1.3      0.037             0.9   Flavonoid
   Apigenin-6,8-di-C-glucoside (vicenin-2)    593.151     4.45         [M−H]−      neg         C27H30O15           0.637             1.0   8.60 × 10⁻⁶          1.3   Flavonoid
   Quercetin-3-rhamnoside-7-rhamnoside        595.165     4.51         [M−H]−      neg         C27H32O15        2.87 × 10⁻⁹          1.4   4.17 × 10⁻¹⁰         1.5   Flavonoid
         Quercetin rutinoside (rutin)         609.146     5.43         [M−H]−      neg         C27H30O16        1.22 × 10⁻¹⁹         2.1   3.98 × 10⁻¹⁰         2.1   Flavonoid
                 Hesperidin                   609.181     4.80         [M−H]−      neg         C28H34O15           0.236             1.1      0.000             0.9   Flavonoid
            Unknown flavonoid                 611.158     3.10         [M−H]−      neg         C27H32O16        4.59 × 10⁻⁹          1.2   3.07 × 10⁻⁸          1.4   Flavonoid
 Naringenin 7-O-neohesperidoside (naringin)   625.180     3.33     [M−H_HCOOH]−    neg         C27H32O14           0.000             1.1   3.10 × 10⁻⁶          0.7   Flavonoid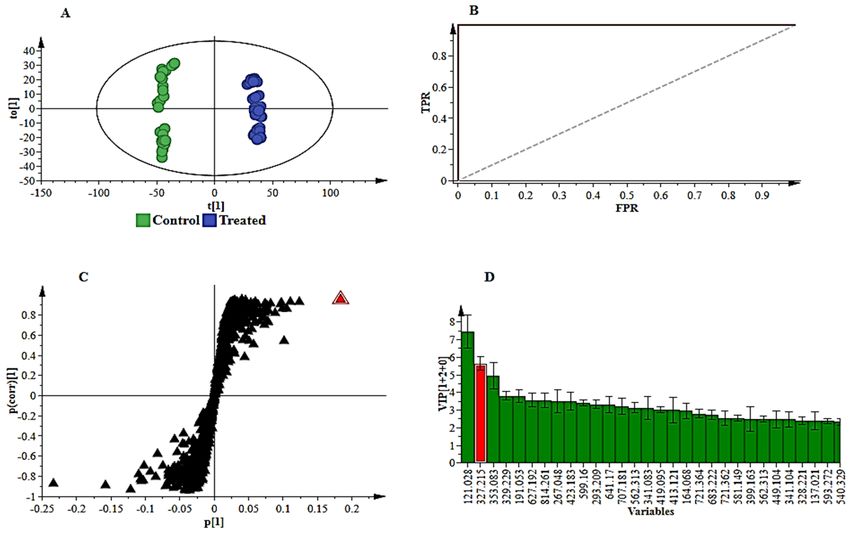
Metabolites 2018, 8, x                                                                         7 of 25

  7-O-Methylvitexin 2’’-O-beta-L-rhamnoside      637.177   6.21    [M−H_HCOOH]−   neg    C28H31O14          0.466       1.0      0.563       1.0     Flavonoid
              4-Hydroxycoumarin                  161.024   1.87        [M−H]−     neg     C9H6O3         3.91 × 10⁻¹²   0.6      0.017       0.8       HCA
                 p-Coumaric acid                 163.039   3.65        [M−H]−     neg     C9H8O3            0.064       0.9      0.953       0.9       HCA
                    Caffeic acid                 179.034   4.35        [M−H]−     neg     C9H8O4         1.68 × 10⁻⁷    0.5      0.083       0.6       HCA
                    Ferulic acid                 193.048   4.01        [M−H]−     neg    C10H10O4        1.95 × 10⁻¹²   0.8   1.25 × 10⁻⁷    0.8       HCA
                 Sinapoyl alcohol                209.074   6.72        [M−H]−     neg    C11H14O4        1.48 × 10⁻¹⁵   2.4   1.07 × 10⁻¹⁶   3.1       HCA
                 Coniferyl acetate               221.081   7.42        [M−H]−     neg    C12H14O4            nd         nd    3.47 × 10⁻¹⁰   8.2       HCA
           2-O-Caffeoylglyceric acid             267.048   4.38        [M−H]−     neg    C12H12O7        1.48 × 10⁻¹⁰   0.5      0.017       0.7       HCA
             4-Coumaroylquic acid                337.051   3.29        [M−H]−     neg    C16H18O8        1.54 × 10⁻³⁰   3.8   6.41 × 10⁻²⁶   3.6       HCA
               Caffeic acid hexose               341.083   6.17        [M−H]−     neg    C15H18O9        3.44 × 10⁻⁷    0.7      0.003       0.8       HCA
              4-Caffeoylquinic acid              353.091   3.58        [M−H]−     neg    C16H18O9        4.75 × 10⁻²³   0.3   2.60 × 10⁻⁵    0.5       HCA
         1-O-Feruloyl-beta-D-glucose             355.102   4.06        [M−H]−     neg    C16H20O9        3.21 × 10⁻²⁴   0.2   4.17 × 10⁻¹⁸   0.1       HCA
             4-Coumaroylagmatine                 277.027   2.63        [M−H]−     neg   C14H20N4O2         0.0464       0.9   1.09 × 10⁻⁷    0.8       HCA
              3-Feruloylquinic acid              367.099   3.75        [M−H]−     neg    C17H20O9        5.98 × 10⁻⁹    1.3      0.002       1.2       HCA
               Sinapoyl aldehyde                 371.130   6.53        [M+H]+     pos    C17H22O9        4.70 × 10⁻²⁹   0.3   3.58 × 10⁻²²   0.4       HCA
             2-O-Caffeoylglucarate               371.062   2.05        [M−H]−     neg    C15H16O11          0.167       0.3       nd         nd        HCA
        1-O-Coumaroyl-beta-D-glucose             371.097   4.26    [M−H_HCOOH]−   neg    C15H18O8           0.001       1.1      0.442       1.0       HCA
               Sinapoyl-(S)-malate               385.078   3.74    [M−H_HCOOH]−   neg    C15H16O9        1.56 × 10⁻¹⁰   0.8      0.066       0.6       HCA
         1-O-Sinapoyl-beta-D-glucose             385.113   5.16        [M−H]−     neg    C17H22O10       7.38 × 10⁻⁹    0.8      0.000       0.9       HCA
                Feruloylserotonin                351.072   3.65        [M−H]−     neg   C20H20N2O4          0.793       1.0   1.43 × 10⁻¹⁰   0.3       HCA
      1,3-O-Coumaroyl-feruloylglycerol           413.121   9.03        [M−H]−     neg    C22H22O8        9.84 × 10⁻¹²   0.4   4.47 × 10⁻¹⁷   0.5       HCA
           Sinapaldehyde glucoside               415.123   4.44    [M−H_HCOOH]−   neg    C17H22O9        7.13 × 10⁻¹⁶   0.7   9.48 × 10⁻⁷    0.8       HCA
           1,3-O-Diferuloylglycerol              443.132   9.22        [M−H]−     neg    C23H24O9        4.20 × 10⁻¹¹   0.4   2.53 × 10⁻²⁶   0.3       HCA
             Caffeic acid derivative             475.143   1.92        [M−H]−     neg    C20M28O13       1.81 × 10⁻¹⁵   1.5   2.56 × 10⁻¹⁷   2.5       HCA
     1,2-bis-O-Sinapoyl-beta-D-glucoside         591.166   6.19        [M−H]−     neg    C28H32O14          0.547       1.0      0.105       1.0       HCA
              Indole-3-acrylic acid/
                                                 188.076   2.71       [M+H]+      pos   C11H9NO2         2.12 × 10⁻²⁷   0.5   1.85 × 10⁻¹⁸   0.5       Indole
        N-Ac-indole-3-carboxyaldehyde
            Methyl indole-3-acetate              190.085    2.69       [M+H]
                                                                           +      pos   C11H11NO2        4.47 × 10⁻¹¹   0.5   4.33 × 10 −9   0.5       Indole
                Indole-3-pyruvate                202.051    7.89       [M−H]−     neg   C11H9NO3         3.07 × 10⁻¹⁸   1.9   5.79 × 10⁻¹³   2.5       Indole
       6-Hydroxy-indole-3-acetyl-valine          289.119    3.95       [M−H]−     neg   C15H18N2O4       1.83 × 10⁻⁹    1.7      0.469       0.9       Indole
             Indole-3-acetyl-leucine             333.120    3.25    [M+H_NaNa]+   pos   C16H20N2O3       1.45 × 10⁻⁷    4.1      0.001       1.9       Indole
 Indole-3-yl-acetyl-myo-inositol L-arabinoside   468.152    3.13       [M−H]−     neg   C21H27NO11          0.000       1.3      0.117       0.9       Indole
                  DIMBOA-Glc                     372.093    1.58       [M−H]−     neg   C15H19NO10          0.001       0.8   9.77 × 10⁻¹⁴   0.4    Benzoxazine
                   Isocitric acid                191.018    1.10       [M−H]−     neg     C6H8O7         5.97 × 10⁻¹⁴   2.3   1.64 × 10⁻⁹    1.6   Carboxylic acid
            Octadecatetraenoic acid              275.200   13.44       [M−H]−     neg    C18H28O2        1.64 × 10⁻¹⁷   4.1   1.20 × 10⁻¹¹   3.6     Fatty acid
              16-Hydroxypalmitate                271.044   13.43       [M−H]−     neg    C16H31O3        8.38 × 10⁻¹⁹   4.9   9.55 × 10⁻¹³   4.1     Fatty acid
            15-Hydroxylinoleic acid              295.226    14.3       [M−H]−     neg    C18H32O3        1.38 × 10⁻¹⁸   3.6   8.76 × 10⁻¹⁴   3.4     Fatty acid
          10,16-Dihydroxypalmitate               287.075   10.24       [M−H]−     neg    C16H31O4        9.76 × 10⁻¹⁴   8.0   6.75 × 10⁻¹¹   8.1     Fatty acid
       Dihydroxy-octadecadienoic acid            311.220   11.81       [M−H]−     neg    C18H32O4        5.87 × 10⁻¹⁷   4.9   2.18 × 10⁻¹¹   6.0     Fatty acid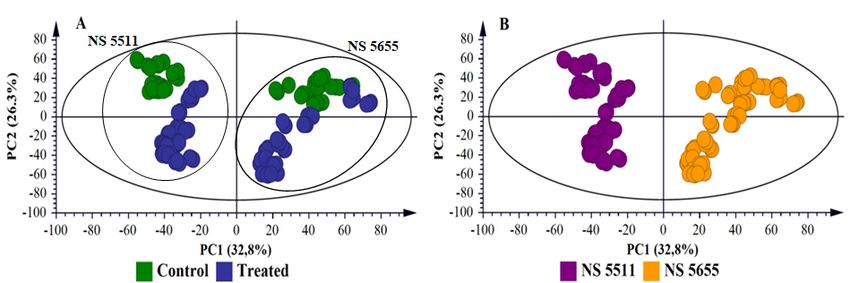
Metabolites 2018, 8, x                                                                                      8 of 25

   11,12,13-Trihydroxy-9,15-octadecadienoic
                                              327.215     9.06         [M−H]−           neg          C18H32O5         1.95 × 10⁻³²   2.7       1.30 × 10⁻⁵      1.5          Fatty acid
                        acid
    9,12,13-Trihydroxy-10-octadecenoic acid   329.229     9.60         [M−H]−           neg          C18H34O5         3.23 × 10⁻²⁷   2.5       3.95 × 10⁻¹⁷     2.0         Fatty acid
                   Salicylic acid             137.031     3.69         [M−H]−           neg           C7H6O3          4.29 × 10⁻¹²   1.3          0.091         3.9       Phytohormone
       Salicylic acid 2-O-beta-D-glucoside    299.074     1.62         [M−H]−           neg          C13H16O8         7.21 × 10⁻¹⁷   1.7       9.28 × 10⁻²⁴     1.9       Phytohormone
             Jasmonoyl-L-isoleucine           322.010     4.16         [M−H]−           neg         C18H29NO4         2.94 × 10⁻¹²   0.5       5.03 × 10⁻²⁰     0.1       Phytohormone
   Dihydrozeatin-9-N-glucoside-O-glucoside    544.208     2.80         [M−H]−           neg         C22H35N5O11          0.001       0.8       4.22 × 10⁻¹²     2.8       Phytohormone
                  Zeatin riboside             352.183     3.16         [M+H]+           pos         C15H21N5O5        1.35 × 10⁻²⁸   0.3       3.27 × 10⁻²²     0.4       Phytohormone
                  Chorismic acid              225.040     2.61         [M−H]−           neg          C10H10O6             nd         nd           0.076         0.9         Shikimate
              Caffeoylshikimic acid           335.076     4.64         [M−H]−           neg          C16H16O8         2.89 × 10⁻¹⁷   0.3       3.84 × 10⁻¹¹     0.3      Shikimate/ HCA
      nd: not detected in the cultivar; p-values refer to significance level of metabolites. Fold change was calculated by dividing the average of the metabolite peak intensity
      values in replicate samples of ‘infected’ by the average of the metabolite intensity values in replicate samples of ‘control’, a value >1 represents an increase (metabolite is
      higher in the infected samples than in the control) and value
Metabolites 2018, 8, x 9 of 25
Figure 4. Classification of the annotated signatory / discriminatory metabolites in extracts of sorghum
plants responding to infection by B. andropogonis, according to the chemical classes (A; see Table 1)
and primary/prominent functions in defence (B; see Section 3.1–3.4 for functions of some annotated
metabolites). A total of 76 plant metabolites were putatively identified. (A): Illustrates the chemical
diversity of metabolites potentially contributing to defence against B. andropogonis (flavonoids and
hydroxycinnamic acids - two major classes). (B): Due to some metabolites possessing more than one
function, grouping was based on the known primary/prominent role in plant defence.
3. Discussion
3.1. Metabolic Reprogramming of Primary and Secondary Metabolism - the Role of Aromatic Amino Acids in
Pathogen-Induced Stress Responses
Infection of sorghum with B. andropogonis triggered changes in amino acid metabolism. These
alterations occurred in the three aromatic amino acids, L-tyrosine, L-tryptophan and L-
phenylalanine. Relative quantitative analyses revealed a decrease of these amino acids in the
respective levels (fold change < 1; Table 1) in infected plants over time (time-related changes; 1–9
d.p.i.) as well as cultivar-related differences in metabolite levels. The role of metabolic pathways of
distinct amino acids in the regulation of defence responses in pathogen-challenged plants has been
demonstrated in several studies [24–26]. Aromatic amino acids synthesised via the chorismic – /
shikimic acid pathway are central to plant metabolism ‒ serving as precursors in the synthesis of a
range of secondary metabolites and phytohormones with plant defence functions [27,28].
Phe is an important precursor for phenylpropanoid and flavonoid pathways, whereas Tyr and
Trp are involved in cyanogenic glycosides and indole metabolite synthesis respectively [27,29].
Additionally, Phe is a precursor in synthesis of signalling molecules such as the phytohormone
salicylic acid (SA), pivotal in launching of plant defence. Thus, the decrease in levels of the amino
acids and increase in the levels of some of the downstream derivatives following infection, suggests
the channelling of these precursors into metabolic pathways of Phe-derived (e.g., phenylpropanoids,
flavonoids and SA), Trp-derived (e.g., indole and serotonin derivatives) and Tyr-derived defence-
related metabolites (e.g., dhurrin) [27,30].
3.2. Differential Changes in Fatty Acid Metabolism
The results reveal the significant accumulation of fatty acids in B. andropogonis-challenged plants
(Table 1), and the levels of 15-hydroxylinoleic acid, 10,16-dihydroxypalmitate, dihydroxy-
octadecadienoic acid, 11,12,13-trihydroxy-9,15-octadecadienoic acid and 9,12,13-trihydroxy-10-
octadecenoic acid were found to considerably increase over time (Figure 5A) in both cultivars. The
increase in free fatty acid levels (particularly unsaturated) has been reported in pathogen-stressed
plants ‒ linoleic (18:2), and linolenic acids (18:3) have been linked to increased resistance to
Colletotrichum gloeosporioides in avocado and Pseudomonas syringae in tomato [31] respectively. MutantMetabolites 2018, 8, x 10 of 25
Arabidopsis plants compromised in production of trienoic fatty acids have been shown to be
susceptible to P. syringae [32].
Compelling evidence from several studies have demonstrated induced activation of NADPH
oxidase by linoleic - and linolenic acid, leading to production of ROS [31–33]. Accumulation of the
latter can result in the fragmentation/cleavage of fatty acids into various products that can act as
chemical inducers of defence responses. In Arabidopsis as well as other plants, azelaic acid (a cleavage
product) acts as an inducer of SAR via the accumulation of SA [31,32]. Additionally, cell death-
inducing activity of some fatty acids has been reported [34].
The hydroxy fatty acids, 15-hydroxylinoleic acid (avenoleic acid), 9,12,13-trihydroxy-10-
octadecenoic acid (pinellic acid) and others annotated in Table 1, are classified as oxylipins,
synthesised from linoleic acid in cereal crops and in other plants [35,36]. 9,12,13-Trihydroxy-10-
octadecenoic acid together with other trihydroxyoctadecenoates were reported to be produced in
response to fungal infection, conferring resistance to a spectrum of fungal pathogens. Previous
reports have also highlighted the growth-inhibitory roles of trihydroxy derivatives of linoleic - and
linolenic acids to plant fungal pathogens [36,37]. Generally, oxylipins perform defence roles in plant
innate immunity as signalling molecules; inducing defence responses or as compounds exhibiting
antimicrobial properties [33,38]. Antimicrobial activities of epoxy- and hydroxy-fatty acids and other
oxylipins towards bacterial pathogens, and growth inhibition properties to a spectrum of pathogens
were reported [38].
In local defence, fatty acids (particularly C16 and C18) are involved in the formation of cutin in
the plant cuticle that confers resistance against pathogens by hindering pathogen ingress and
proliferation in the host [31,33]. The synthesis of 10,16-dihydroxypalmitate and 16-hydroxypalmitate
(major cutin monomers) annotated in Table 1 can be interpreted as an attempt to strengthen the
cuticle and limit further bacterial ingress [39].
Apart from acting as hydrophobic hormones in modulating signal transduction pathways and
antimicrobial compounds, fatty acids also serve as precursors to the phytohormone jasmonic acid
(JA) [32,38] and as essential constituents of membrane lipids in plants. The up-regulation of the
annotated fatty acids of known function thus supports a functional role in sorghum
defence/resistance [31–33].
3.3. Plant Hormones: Regulatory and Signalling Molecules in Sorghum Defence Responses
The intricate defence responses of sorghum also involved several phytohormones such as SA
and SA glucoside, JA and zeatin derivatives (Table 1). Drawing attention to the well-known plant
stress phytohormone, SA and its conjugate (salicylic acid 2-O-beta-D-glucoside (SAG), augmented
levels were noticed following bacterial treatment (Figure 5B). SA levels in NS 5511 (BT) were elevated
in the early stages of bacterial infection (1–3 d.p.i.) as compared to NS 5655 (ST), which showed
increased levels in the late stages (5–9 d.p.i.). This finding postulates an early onset of defence
responses in NS 5511 compared to NS 5655, and corroborates the view that the former cultivar is
more resistant than the latter. However, for SAG the levels between the two cultivars were
comparable. Plant hormones play various biological roles, including signalling in stress responses,
inducing secondary metabolite accumulation [40,41]. Experimental evidence has shown a link
between the accumulation of SA and SAG, expression of PR proteins, accumulation of
phenylpropanoids and resistance to pathogens in a range of plants [21,24].
SA, a phenolic phytohormone synthesised from cinnamic acid or isochorismate [24,31] plays a
key role in local and systemic defence [42]. This hormone accumulates in regions around the infection
site, stimulating the hypersensitive response (HR) to result in necrotic lesions that limits pathogen
proliferation. The HR can be linked to the observed development of lesions on B. andropogonis-
infected sorghum plants (Figures S1A,B) [43]. Moreover, SA is a major signalling molecule triggering
SAR, leading to up-regulation of PR proteins and enhancement of phenylpropanoid accumulation
[26,44]. The production of and signalling function of SA, is highly important in plant immunity
towards pathogens exhibiting biotrophic and hemibiotrophic lifestyles. The detection of SA and SAGMetabolites 2018, 8, x 11 of 25
as signatory biomarkers, therefore, indicates their importance in triggering defences against B.
andropogonis [26,45].
The highly biologically active derivative of JA, jasmonoyl-L-isoleucine (JA-Ileu), is a known
modulator of stress responses [46]. Although this phytohormone was identified to be present, it was
not statistically significant and not significantly related to the treatment, as indicated by the very low
levels detected upon quantitative evaluation (Table 1 and Figure 5B). Jasmonates derived from
linolenic acid metabolism are also classified as oxylipins. These molecules are involved as signalling
molecules in activation of defence responses towards both abiotic and biotic stressors [31,41].
Exogenous application of JA results in defence-related gene expression as well as production of
antimicrobial compounds [33,41]. The accumulation of this phytohormone is mostly associated with
necrotrophic pathogens and also triggers ISR [47].
The levels of two zeatin conjugates, dihydrozeatin-9-N-glucoside-O-glucoside and zeatin
riboside, were also found to be altered as part of the induced host responses (Figure 5B). The levels
of the former were dramatically higher in NS 5655 as compared to NS 5511 (Figure 5B). Zeatin and
derivatives thereof (e.g., riboside and glucosides) are regarded as the principal group of isoprenoid
cytokinins (CKs) in plants. Previously, trans-zeatin cytokinins were demonstrated as the more active
class in enhancing resistance against pathogens; however, recently, the role of cis-zeatin CKs in
regulating plant defence responses and as ‘novel’ stress-response markers has been highlighted
[48,49]. CKs can act synergistically with SA in the activation of defence gene expression [50] and
enhancing of resistance by zeatin CKs to be linked to an increase in cell membrane integrity [49,51].
The identification of the various phytohormones revealed an interplay of hormonal activity in
sorghum defence signalling and regulation. Interaction (antagonistically or synergistically) and fine-
tuning between phytohormones governs activation of a range of defences, including those specific to
the stressor [41,47,50]. The identification of phytohormones as biomarkers can, therefore, be
explained as triggers of defence responses to B. andropogonis infection.Metabolites 2018, 8, x 12 of 25
Figure 5. Relative quantification of fatty acids (A) and phytohormones (B) annotated in sorghum leaves responding to infection by B. andropogonis. The relative levels of
each metabolite are expressed as fold changes, computed from treated against control (T/C) samples, where fold change > 1 represents significant accumulation in NS 5511
(BT) and NS 5655 (ST). Abbreviations: (A) 11,12,13-THOD = 11,12,13-trihydroxy-9,15-octadecadienoic acid; 9,12,13-THOE = 9,12,13-trihydroxy-10-octadecenoic acid; 15-
HLE = 15-hydroxylinoleic acid; DHOD = dihydroxy-octadecadienoic acid; 10,16-DHP = 10,16-dihydroxypalmitate (B) JA-Ile = jasmonoyl-L-isoleucine; ZR = zeatin riboside;
DZ9GOG = dihydrozeatin-9-N-glucoside-O-glucoside; SA = salicylic acid; SAG = salicylic acid 2-O-beta-D-glucoside. The fold changes on the various treatment days
presented in the graphs have a p-value < 0.005, except for the ones indicated by * with p-value > 0.005, but < than 0.05.Metabolites 2018, 8, x 13 of 25
3.4. Metabolic Reprogramming of Defence-Related Metabolites Derived from Shikimic Acid-,
Phenylpropanoid-and Flavonoid Pathways
The metabolic reprogramming in sorghum following B. andropogonis infection involved
perturbations in the pool of metabolites synthesised via the shikimic acid -, phenylpropanoid - and
flavonoid biosynthetic pathways ‒ which are partially interlinked [52]. The shikimic acid pathway
yields chorismic acid – a precursor in the aromatic amino acid biosynthetic pathways. This pathway
portrays a prime regulatory link of primary and secondary metabolism, with Phe serving as an
initiator/regulatory metabolite in the biosynthesis of phenylpropanoids of which the flavonoid
pathway is a downstream branch [27,28].
Data analysis revealed a decrease in chorismic acid levels in the NS 5655 (ST) cultivar which
was, however, not annotated in the NS 5511 (BT) cultivar (Table 1). As stated previously, chorismic
acid provides a carbon skeleton in the synthesis of aromatic acids, from which aromatic secondary
metabolites arise [27,28,51]. Benzoic acid was also detected in both cultivars. Benzoic acid and
derivatives are known for antioxidant and antimicrobial activity. The decrease in levels of chorismic
- and benzoic acid can be attributed to channelling of the metabolites into synthesis of various
defence-related compounds to which the molecules serve as precursors [53].
Two major groups of phenolic compounds derived from the phenylpropanoid pathway and
regarded as the major phenolic compounds found in sorghum, namely flavonoids and HCAs,
accumulated significantly in infected plants. The profusion of these classes of compounds amongst
the putatively identified metabolites (Figure 4A and Table 1) suggests a pivotal role in sorghum
defence (as either preformed phytoanticipins or induced phytoalexins) [54,55]. Phenolic secondary
metabolites are a major group directly involved in plant resistance and in determining
resistance/susceptibility of a plant host to microbial pathogens [56,57]. Many reports have
demonstrated accumulation of phenolic compounds at the site of infection following pathogen
invasion [56,58].
3.4.1. Flavonoids as Biomarkers in Sorghum Defence Responses
The flavonoids annotated from extracts of infected plants (Table 1) were mostly sugar-
conjugated and belonged to various subgroups; (i) flavones: apigenin and derivatives, luteolin and
tricetin derivatives, (ii) flavanones: naringenin and hesperitin derivatives and (iii) flavonols:
kaempferol and quercetin derivatives. Interestingly, the 3-deoxyanthocyanidins, luteolinidin and
apigeninidin were not detected in any extract.
Most of the detected flavonoid glycosides significantly accumulated following bacterial
infection. Flavonoids are a highly diverse class of secondary metabolites [59], with a wide range of
biological functions in plant systems which include signalling, abiotic and biotic stress response, and
antioxidant activity, amongst others. Synthesis, transportation and allocation of this class of
compounds hallmark an adaptive metabolism in plants geared towards protective and regulatory
functions [58–60]. For example, upon pathogen challenge, flavonoids accumulate at the infection site
and impede fungal spore germination, inactivate bacterial pathogen adhesion and distort microbial
membranes, all in attempt to hinder microbial invasion [29,58].
The results revealed infection-triggered metabolic changes in flavonoid metabolism, largely
characterised by significant accumulation of apigenin and its glycosides (mostly existing as C-
glycosides) (Table 1). Apigenin demonstrated to be a pathogen-induced biomarker in both cultivars
and displayed an increase in levels over time points particularly from 3–9 d.p.i. (levels ≥ 1.5-fold)
(Figure 6A). This finding was visually confirmed by exploration of the PCA scores space (Figure 7).
In the non-infected samples, there was no detectable presence of the metabolite. However, it was
clearly detectable in the treated samples, with levels increasing over time and most intensely in NS
5655 (ST). Apigenin is a known phytoalexin in sorghum and studies have shown rapid de novo
synthesis and elevated accumulation of the metabolite following infection. The flavone has been
demonstrated to inhibit fungal growth and spore germination against fungal pathogens such as
Colletotrichum sublineolum [60]. For bacterial pathogens, apigenin has been reported to exhibit a
stronger antibacterial activity towards Gram-negative bacteria [61].Metabolites 2018, 8, x 14 of 25
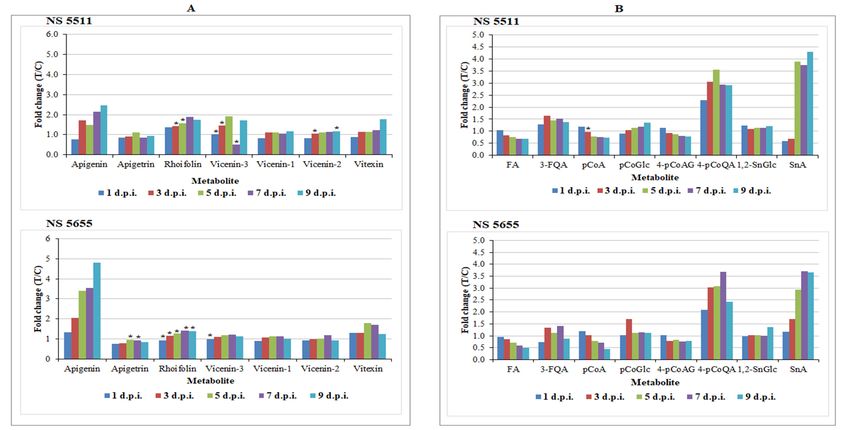
Figure 6. Relative quantification of some flavonoids (A) and hydroxycinnamic acids (B) annotated in sorghum leaves responding to infection by B. andropogonis. The relative
levels of each metabolite are expressed as fold changes, computed from treated against control (T/C) samples, where fold change > 1 represents significant accumulation
in NS 5511 (BT) and NS 5655 (ST). Abbreviations: (A) apigetrin = apigenin 7-O-glucoside; rhoifolin = apigenin 7-O-neohesperidoside; vicenin-3 = apigenin 8-C-xyloside-6-
C-glucoside; vicenin-1 = apigenin 6-C-xyloside-8-C-glucoside; vicenin-2 = apigenin-6,8-di-C-glucoside; vitexin = apigenin-8-C-glucoside. (B) FA = ferulic acid; 3-FQA = 3-
feruloylquinic acid; pCoA = p-coumaric acid; pCoGlc = 1-O-coumaroyl-beta-D-glucose; 4-pCoAg = 4-coumaroylagmatine; 4-pCoQA = 4-coumaroylquinic acid; 1,2-SnGlc
=1,2-bis-O-sinapoyl-beta-D-glucoside; SnA = sinapoyl alcohol. The fold changes of the various treatment days presented in the graphs have a p-value < 0.05, except for the
ones indicated by * with p-value > 0.05 but < 0.5.Metabolites 2018, 8, x 15 of 25
Figure 7. An unsupervised colour-coded PCA score plot displaying the presence/absence and
intensity of the phytoalexin apigenin across the samples. (A): NS 5511 (BT) and (B): NS 5655 (ST). The
absence of the metabolite in control samples and presence in samples from infected plants indicates
that the metabolite was pathogen-induced.
For NS 5655 (ST), levels of apigenin was slightly higher than in NS 5511 (BT). On the other hand,
levels of apigenin glycosides (found to be constitutively present in this study i.e., as phytoanticipins)
appeared to be more augmented in the NS 5511(BT) cultivar compared to NS 5655 cultivar (ST). The
apigenin conjugates, rhoifolin and vitexin, found to significantly accumulate in infected tissues
(Figure 6A), have been reported to possess antimicrobial properties [61,62]. Notably, vitexin (and
related conjugates) and the other apigenin glycosides, vicenin-1, vicenin-2 and vicenin-3, were
reported, in connection with defence responses. The levels of these metabolites together with those
of apigetrin (Figure 6A) in infected plants suggests a defence-related role towards B. andropogonis;
however, further work is required to elucidate and explore the particular roles in sorghum defence.
Other flavonoids found to be up-regulated following bacterial infection (Table 1 and Figure S11)
are luteolin-, naringenin-, quercetin- and chalcone conjugates. These conjugates have been linked to
defence in plants following pathogen challenge. Luteolin 7-O-neohesperidoside has been reported as
an antibacterial compound, while luteolin 7-O-glucoside has been shown to possess antifungal
activity contributing to host resistance [61,62]. Naringenin 7-O-beta-D-glucoside and naringin were
reported to exhibit antimicrobial activity in grains like wheat [58] and barley [63], contributing to host
resistance. Similarly, antibacterial and antifungal activity has been reported for chalcones and
quercetin derivatives, respectively [58,64].
We can, therefore, propose that defence responses launched towards B. andropogonis infection
by sorghum largely involves the subgroups of flavonoids mentioned above, particularly the flavones.
A schematic representation of the metabolites annotated in this study, superimposed on the flavonoid
biosynthetic pathway, is shown in Figure 8.Metabolites 2018, 8, x 16 of 25
Figure 8. Schematic representation of the proposed biosynthetic pathway of defence-related
flavonoids in sorghum. This pathway displays some of the flavonoids annotated in sorghum plant
extracts following infection with B. andropogonis. Solid lines represent main routes and dashed lines
represent alternative routes. Abbreviations: PAL = phenylalanine ammonia lyase; C4H = cinnamate
4-hydroxylase; CCL = coumaryl-CoA ligase; CHS = chalcone synthase; CHI = chalcone isomerase; 7GT
= flavanones-7-O-glucosyltransferase; Cm1,2RhaT = 1,2 rhamnosyltransferase; F2HI = flavanone-2-
hydrohlyase; FNS = flavone synthase; OGT = O-glycosyltransferase; FRG = flavanones 7-O-glucoside-
2”-O-β-L-rhamnosyltransferase; LGR = luteolin 2-O-β-L-rhamnosyltransferase; VRM = vitexin 2”-O-
rhamnoside 7-O-methyltransferase; MT = methyltransferase; FND = flavanones 3-dioxygenase; FLS =
flavonol synthase; FGT = flavonoid 3-O-glucosyltransferase; FGRT = flavonol-3-O-glucoside L-
rhamnosyltransferase; FHS = flavonoid 3’,5’-hydroxylase; CGT = C-glycosyl transferase; HGD = 2-
hydroxynaringenin-6-C-glucoside dehydratase; DH = dehydrogenase; ? = enzymes not yet
characterised. Metabolites annotated in this study are in italics. Flavones and derivatives are
indicated in purple and the flavanone precursors in yellow.
3.4.2. The Defensive Functions of Hydroxycinnamic Acids in Sorghum
Infected sorghum plants accumulated HCAs in response to B. andropogonis. This class of
metabolites also originates from the early phenylpropanoid pathway [27,28] and the annotated
biomarkers included coumaric -, caffeic -, sinapic - and ferulic acid conjugated to various molecules
such as sugars, organic acids, alcohols, aldehydes and amines (Table 1). These compounds
accumulated in varying degrees in the two cultivars. Sinapoyl alcohol, 4-coumaroylquinic acid, 3-
feruloylquinic acid, 1-O-coumaroyl-beta-D-glucose and 1,2-bis-O-sinapoyl-beta-D-glucoside were
up-regulated (Table 1) following bacterial infection. Furthermore, relative quantification analysis
(Figure 6B) generally showed an increase in levels over time. Comparison of the two cultivars
displayed a more significant accumulation in NS 5511 (BT). p-Coumaric acid, ferulic acid and 4-
coumaroylagmatine (also shown in Figure 6B), however, displayed slight decreases in levels across
time, indicative of further metabolism such as conjugation to quinic acid.
HCAs are known to possess defence-related functions. Ferulic -, caffeic -, p-coumaric - and
sinapic acids are functional antimicrobial compounds, and precursors to the synthesis of both
inducible and constitutive defence metabolites. The metabolites are also key in structural defences asMetabolites 2018, 8, x 17 of 25
monolignol precursors of lignin and by participating in cross-linking primary cell wall
polysaccharides [25,56,65]. HCA amides, such as 4-coumaroylagmatine and feruloylserotonin, are
also known in the context of cell wall strengthening as well as antimicrobial compounds. A study on
potato showed the accumulation of these HCA amides and other HCAs; 4-coumaroylquinic acid,
feruloylquinic acid, 1-O-sinapoyl-beta-D-glucose, 4-hydroxycoumarin and 1-O-feruloyl-beta-D-
glucose in resistant cultivars in response to Phytophthora infestans. Similarly, a number of these
metabolites reported in potato, and also reported here for sorghum, were associated with pathogen
resistance in some members of the Poaceae family such as wheat and barley [25,26,56]. The observed
significant accumulation of these HCAs can thus be linked to defence-related functions in sorghum
towards B. andropogonis.
Sinapoyl alcohol derived from cinnamic acid via p-coumaric -, caffeic -, ferulic - and sinapic acid
intermediates, is an important precursor (together with sinapaldehyde also annotated in this study)
in plant cell wall lignification. The decrease in levels of 1-O-sinapoyl-beta-D-glucose (not shown)
accompanied by higher levels of its active form, sinapoyl alcohol (Figure 8B), displayed a conversion
of an inactive to an active form which marks the activation of structural defences to hinder pathogen
penetration.
The sinapoyl glucoside and 1-O-feruloyl-beta-D-glucose are inactive storage forms that are
activated due to pathogen infection to form sinapoyl alcohol and feruloyl alcohol respectively [39,66].
Other metabolites annotated in this study, and also involved in structural defence, are coniferyl
acetate, sinapaldehyde glucoside and sinapoyl-(S)-malate. The significant accumulation of HCA
conjugates associated with a decrease in the precursors, therefore, shows channelling of the latter into
synthesis of corresponding derivatives more important for sorghum resistance [26,56,67].Metabolites 2018, 8, x 18 of 25
4. Materials and Methods
4.1. Sorghum Plant Cultivation
Two commercial cultivars (NS 5511/BT and NS 5655/ST) were evaluated and compared in this
study. Both cultivars are grain sorghum hybrids (from the same breeding line) of the malting class;
NS 5511 seeds (bitter) have dark testa and high condensed tannin content, while NS 5655 seeds
(sweet) have light coloured testa and no condensed tannins (Agricol Seed Company, Silverton,
Pretoria, RSA). NS 5511 and NS 5655 have both a rating of ‘3’ (on a 1–9 scale, 1 = most resistant and 9
= most susceptible) with regards to resistance against head smut, leaf disease and stem rot (Capstone
Seeds, Howick, South Africa). Seeds were initially surface-sterilised with a 1.2% sodium hypochlorite
solution for 20 min before rinsing in sterile distilled water and being placed on wet paper towel in
glass Petri dishes and incubated at 27 °C in the dark for 48 h to germinate. Following germination,
the seedlings were planted in vermiculite under a 12 h fluorescence light (≈ 85 µmol m−2 s−2) and 12 h
dark cycle at 22–27 °C. The study was designed to monitor the responses for 9 d post-inoculation
(d.p.i.); and at each time point (1, 3, 5, 7 and 9 d.p.i.) 3 biological replicates were harvested. Plants
were watered twice a week with a water-soluble chemical fertiliser (Multisol ‘N’, Culterra,
Muldersdrift, South Africa) and distilled water solution. All the plants were grown at the same time
under the same environmental conditions to minimise biological variation.
4.2. Bacterial Suspension Preparation and Infection of Sorghum Seedlings
The initial bacterial stock of B. andropogonis (strain BD256) was obtained from the Plant
Protection Research Institute (PPRI, Agriculture Research Council, Pretoria, South Africa), cultured
in Nutrient broth (Merck, Johannesburg, South Africa) and incubated overnight on a shaker at 28 °C
and 130 rpm. Bacterial cells were harvested by means of centrifugation at 9 000 × g and 4 °C for 20
min. The pelleted cells were resuspended in 2 mL phosphate buffered saline (PBS). The working
bacterial suspension was subsequently prepared by serial dilution in PBS solution to an OD600 of 0.1.
To complete the preparation of the bacterial suspension, a wetting and spreading agent (Insure pH
buffer) was added at a 1:1000 v/v dilution as per manufacturer’s (Plaaskem, Boksburg, South Africa)
instructions.
At the 4-leaf growth stage (~30 d post sowing), the seedlings were infected by spraying the leaves
equally and homogenously with the bacterial suspension (OD600 = 0.1) using a hand sprayer. In prior
optimisation experiments, it was found that the spray treatment did not elicit any detectable
responses in the control plants and the negative controls were accordingly not sprayed. Infected
plants were then incubated at 30 °C in a high humidity environment for 24 h. Incubation was followed
by exposing the plants to initial growth conditions. Following the infection, leaves from both cultivars
were harvested at 1, 3, 5, 7 and 9 d.p.i. for infected plants and at 1, 5 and 9 d.p.i. for the non-infected
plant leaves. Leaves were cut from the plant and immediately stored at –80 °C to quench enzymatic
activity until the metabolite extraction steps could be performed.
4.3. Metabolite Extraction and Pre-Analytical Sample Preparation
Metabolites were extracted as previously described [20]. Briefly, leaves from infected and non-
infected plants were mixed with a cold extraction solvent (80% aqueous methanol) in a ratio of 1:15
(w/v). The mixture was homogenised using an Ultra-Turrax homogeniser, followed by sonication for
15 s with a probe sonicator (Bandelin Sonopuls, Berlin, Germany) set at 55% power. Homogenates
were centrifuged at 5000 × g and 4 °C for 25 min. The supernatants of each sample were concentrated
by evaporation under vacuum to 1 mL using a rotary evaporator set at 55 °C. The 1 mL extracts from
each sample were further evaporated to complete dryness with a speed vacuum concentrator
(Eppendorf, Merck, Johannesburg, South Africa) set at 45 °C. The final step of sample preparation
consisted of resuspending the dried extracts in 50% UHPLC-grade methanol (Romil, Cambridge, UK)
in a 1:10 m/w ratio. This was followed by filtering samples through 0.22 µm nylon syringe filters intoMetabolites 2018, 8, x 19 of 25
UHPLC glass vials fitted with 500 µL inserts. The filtered samples were capped and kept at –20 °C
until analysed.
4.4. Ultra-High Performance Liquid Chromatography-High Definition Mass Spectrometry
UHPLC-MS analyses were performed on a Waters Acquity UHPLC coupled in tandem to a
SYNAPT G1 Q-TOF mass spectrometer (Waters Corporation, Milford, MA, USA) via an electrospray
ionisation (ESI) interface. Sample extracts were chromatographically separated on a reverse phase
C18 column (150 mm × 2.1 mm × 1.8 µm – HSS T3, Waters Corporation, Milford, MA, USA) at 60 °C.
The mobile phase consisted of 0.1% formic acid in MilliQ water (solvent A) and 0.1% formic acid in
acetonitrile (Romil, Cambridge, UK) (solvent B), and flow rate was set to 0.4 mL/min. Gradient elution
was used and the initial conditions were 2% B and maintained for 1 min. The gradient was ramped
to 95% B at 15 min and maintained for 2 min, and then changed to the initial conditions at 18 min,
followed by a 2 min equilibration time of the column. The total chromatographic run time was 20
min and the injection volume was 2 µL. Each sample was analysed in triplicate. Sample acquisition
was randomised and the QC sample used to condition the UHPLC-MS system was repeatedly
injected to account for any analytical variability. The MS detector acquired data in both positive and
negative modes following electrospray ionisation (ESI). The conditions were set as follows: capillary
voltage of 2.5 kV, sampling cone at 30 V, extraction cone at 4 V, cone gas flow 50 L h−1, desolvation
gas flow 550 L h−1, source temperature at 120 °C, desolvation temperature at 450 °C, scan time of 0.1
s and mass range of 100–1000 Da. Leucine encephalin (50 pg/mL) was used as a calibrant to acquire
mass accuracies between 1 and 3 mDa and data were acquired at different collision energies (MSE,
10–50 eV) to aid with structural elucidation and annotation of the analytes.
4.5. Data Processing and Multivariate Data Analyses
Raw data, both ESI negative and positive, obtained from UHPLC-HDMS were extracted using
MassLynxTM XS software and processed with MarkerLynx software (Waters Corporation,
Manchester, UK). The data matrices obtained from MarkerLynx processing were exported into
SIMCA 14 (Umetrics, Umea, Sweden) for multivariate statistical analyses. The data were Pareto-
scaled before principal component analysis (PCA) and orthogonal projection to latent structures
discriminant analysis (OPLS-DA). For the purposes of the MVDA, the data sets from all the control
time points were combined and compared to the combined data sets obtained from the infected
tissues at different days. The generated models were validated using different methods. The
calculated OPLS-DA models were statistically significant models (with CV-ANOVA p-value less than
0.05), and computed to separate multivariate relationships into: predictive variation (related to
bacterial infection) and orthogonal variation (unrelated to bacterial infection) [8–12]. Features
significantly contributing to the model, with │p[1]│ ≥ 0.05 and │p(corr)│ ≥ 0.5, were extracted from
the OPLS-DA loading S-plot for downstream metabolite annotation. Fold changes indicated in Table
1 were obtained from the OPLS-DA model of all control samples (days 1, 5, 9) computed against all
samples from infected tissues (days 1, 3, 5, 7, 9), whilst the fold change values used to compute the
graphs in Figure 5 and Figure 6 were dependant on the model of a control (C 1 day) vs. samples from
a particular day post infection.
4.6. Metabolite annotation
Metabolites were annotated as previously described [9,20]. To summarise, metabolite annotation
involved running data matrices obtained after MarkerLynx processing (raw data) on the Taverna
workbench (www.taverna.org.uk) for PUTMEDID_LCMS metabolite identification workflows. The
workflows consist of correlation analysis, metabolic feature annotation and metabolite annotation.
The resulting metabolite identities generated were then confirmed with the aid of MS fragmentation
patterns acquired at different collision energies (MSE). Here, accurate masses obtained from the
SYNAPT G1 Q-TOF system were used to generate empirical formulae. Corresponding formulae with
mass difference between measured and calculated mass at or below 5 mDa, was selected and queriedYou can also read


