Exelon Illinois Nuclear Fleet Audit - Findings and Recommendations - Synapse Energy Economics
←
→
Page content transcription
If your browser does not render page correctly, please read the page content below
Redacted Version

Exelon Illinois Nuclear Fleet Audit

Findings and Recommendations

Prepared for Illinois Environmental Protection Agency

April 14, 2021

AUTHORS

Divita Bhandari
Max Chang
Philip Eash-Gates
Jason Frost
Steve Letendre, PhD
Jackie Litynski
Cheryl Roberto
Andrew Takasugi
Jon Tabernero
Rachel Wilson

                                         485 Massachusetts Avenue, Suite 3
                                         Cambridge, Massachusetts 02139

                                         617.661.3248 | www.synapse-energy.com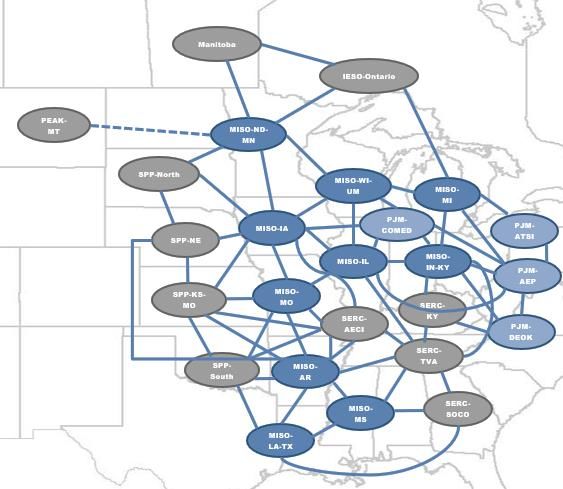
Redacted Version

                             This page left intentionally blank

Synapse Energy Economics, Inc.                             Exelon Illinois Nuclear Fleet Audit   1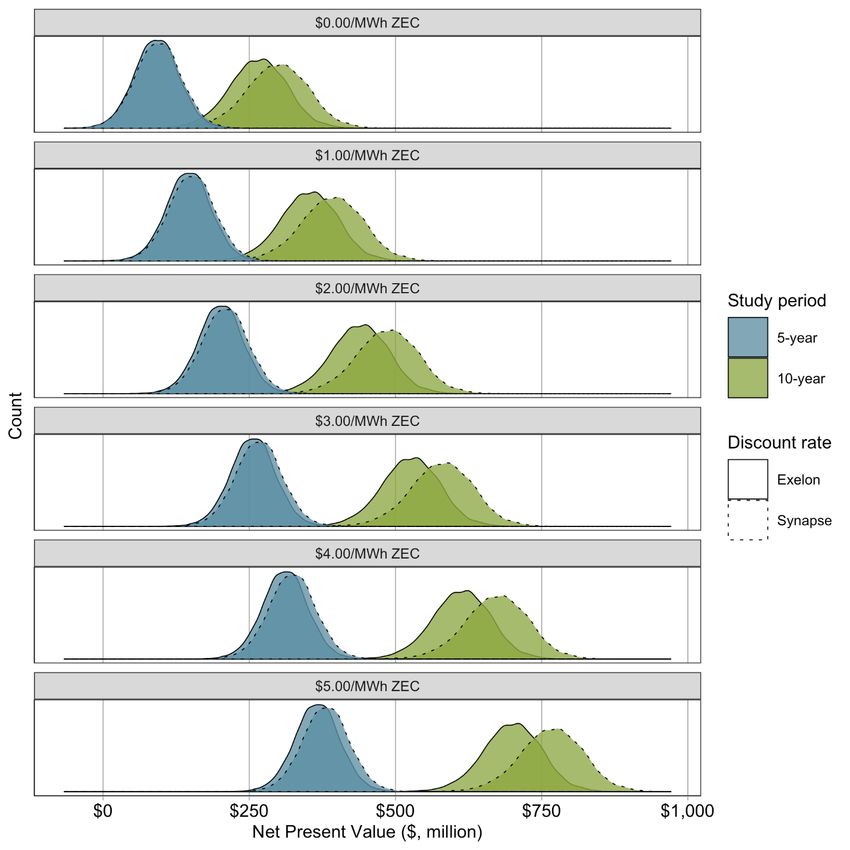
Redacted Version

C ONTENTS
EXECUTIVE SUMMARY ......................................................................................... I

1.    BACKGROUND........................................................................................... 1
      1.1. Summary of Illinois Plants ......................................................................................... 1
      1.2. Historical Revenues .................................................................................................. 2
      1.3. Separation of Exelon................................................................................................. 8

2.    METHODOLOGY......................................................................................... 8
      2.1. Monte Carlo Analysis ................................................................................................ 9
      2.2. EnCompass Modeling ..............................................................................................14

3.    RESULTS: BYRON AND DRESDEN.................................................................... 15
      3.1. Monte Carlo Analysis Results ....................................................................................15
      3.2. Encompass Modeling Results ....................................................................................21

4.    RECOMMENDATIONS ................................................................................. 26

APPENDIX A. CURRENT ILLINOIS ZERO EMISSION CREDITS........................................ A-1

APPENDIX B. ECONOMIC CONTRIBUTION TO LOCAL COMMUNITIES ..............................B-1

APPENDIX C. CAPACITY MARKET BACKGROUND ....................................................C-1

APPENDIX D. EXELON’S EARNINGS OPTIMIZATION EFFORTS ..................................... D-1

APPENDIX E.         ENCOMPASS INPUTS .................................................................... E-1

APPENDIX F.         MONTE CARLO ANALYSIS INPUTS..................................................... F-1

APPENDIX G. MONTE CARLO ANALYSIS RESULTS FOR BRAIDWOOD AND LASALLE ............ G-1

APPENDIX H. CARBON PRICE SCENARIO ............................................................. H-1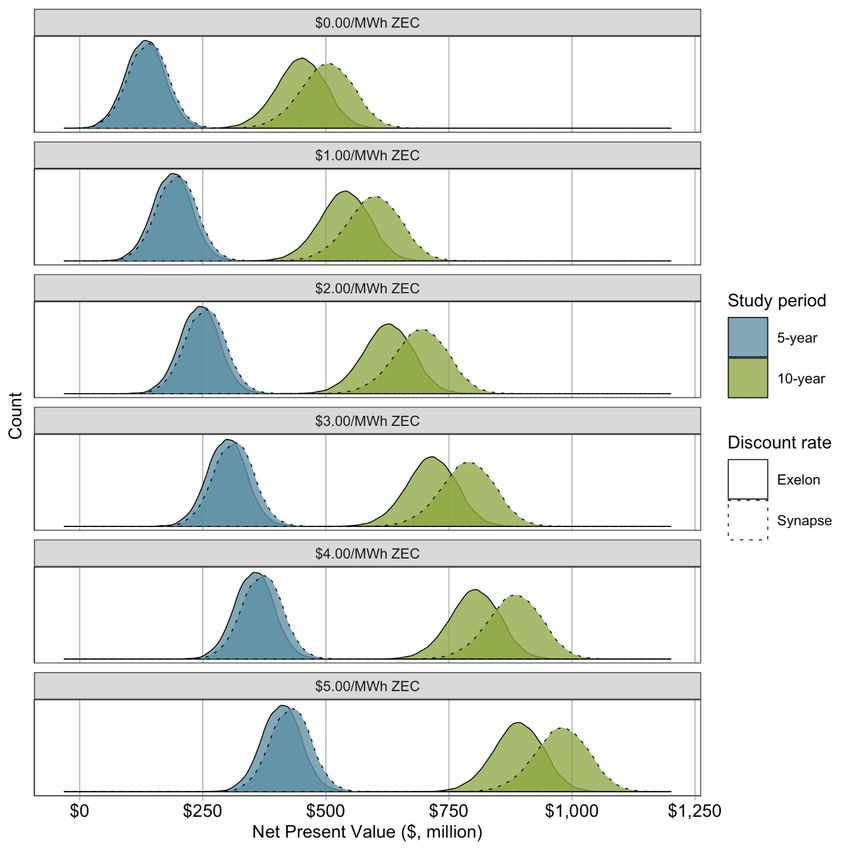
Redacted Version

EXECUTIVE SUMMARY
On August 20, 2020, Exelon Generation (Exelon) announced its intention to retire the Byron Nuclear
Station (Byron) in September 2021 and the Dresden Nuclear Station (Dresden) in November 2021. In
January 2021, the Illinois Environmental Protection Agency (IEPA) selected Synapse Energy Economics
(Synapse) to conduct a financial audit of Exelon’s claims regarding the financial outlook for its Byron and
Dresden plants, as well as Exelon’s Braidwood and LaSalle nuclear plants. This report presents Synapse’s
findings regarding the financial outlook for the four nuclear plants (Byron, Dresden, Braidwood, and
LaSalle) over an analysis period of five years (2021–2025) and 10-years (2021–2030).

For context, analyses of nuclear plant financials have customarily utilized linear trajectories for future
revenues and costs. This has led to debates about the timing of analysis, the appropriateness of
assumptions, the determination of uncertainties, and the magnitude of future risks. As an example, one
regularly debated issue is the assumption of fixed certainty for operational and market risk with the
inclusion of cost adders. We find the various outcomes impacting the future profitability for a nuclear
plant to be too complex to solve directly.

To account for the likelihood of various outcomes, we incorporated a Monte Carlo simulation that
encompassed distribution and probabilities of revenues and costs for the four plants over the next five
and 10 years. This flexibility enhanced the usefulness of our analysis over analyses based upon the
assignment of fixed estimates for revenues and costs. The Monte Carlo simulation identified possible
results by applying a probability distribution to inputs with inherent uncertainty. The simulation then
recalculated results 10,000 times, each time using a different set of inputs randomly selected from
within minimum and maximum values for the inputs. After this, the simulation developed a distribution
of net present values for each of the four plants for the analysis period using Exelon’s discount rate of
     percent without a subsidy and a lower Synapse discount rate of percent with a subsidy.

Our Monte Carlo simulations identified the range of possible net present values for the future operation
of four plants. The results represent a span of potential future market and operational conditions
inclusive of Exelon’s expected future expenses, Synapse’s forecast of plant revenues, and probabilistic
likelihood of unanticipated plant outages based on 10 years of operating experience and market data for
Exelon’s 11 Illinois nuclear units across the six plants.

Synapse finds:

    •    The Byron plant has a five-year expected net present value (NPV) of $31 million using
         Exelon’s discount rate. Our Monte Carlo analysis found that 95 percent of the iterations
         will be above an NPV of -$30 million.

    •    The Dresden plant has a five-year expected NPV of -$87 million using Exelon’s discount
         rate. Our Monte Carlo analysis found that 95 percent of the iterations will be above a
         net present value of -$139 million.

Synapse Energy Economics, Inc.                                           Exelon Illinois Nuclear Fleet Audit   i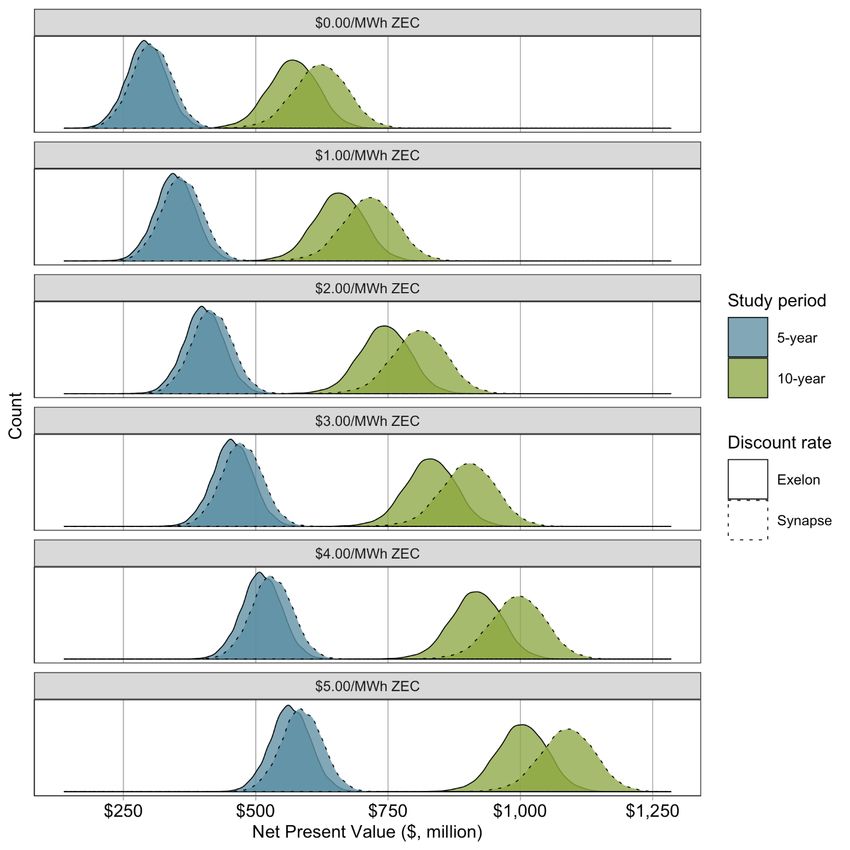
Redacted Version

    •    Both the Braidwood and LaSalle plants have positive expected NPVs for the five-year
         period. The expected NPV for Braidwood is $69 million with 95 percent of the iterations
         above $7 million and LaSalle showed an NPV of $293 million with 95 percent of the
         iterations above $232 million.

    •    The 10-year expected NPV for the Byron plant is $111 million using the Exelon discount
         rate. The 10-year expected NPV for the Dresden plant is also positive. We note that the
         10-year results assume that Dresden Unit 2 retires as scheduled in 2029, since Exelon
         has not announced any plans to extend the current license.

    •    In an Illinois Carbon Price Scenario with prices comparable to the Regional Greenhouse
         Gas Initiative (RGGI) prices starting in 2023, our five-year expected NPVs are $91 million
         for Byron with 95 percent of the iterations above $28 million and -$39 million for
         Dresden with 95 percent of the iterations above -$92 million. These finding indicate that
         modest carbon prices would benefit the financial outlook of the two nuclear plants.

As a private entity, Exelon will have profitable years and unprofitable years. Exelon is not regulated by
the Illinois Commerce Commission, so the state does not have an obligation to ensure that Exelon
shareholders have an opportunity to realize a return each year on their investment in the plants. That
said, our analysis demonstrates that Byron and Dresden do face real risk of becoming uneconomic in the
near term. This has implications for Illinois’s policy goals because the plants generate carbon-free
electricity that is currently undervalued or even ignored within current wholesale electricity markets. In
addition, the plants employ hundreds of workers directly and contribute to the economies of numerous
Illinois communities. Illinois could reasonably determine that it is in the public interest for the plants to
remain in operation, warranting public support.

State support of the Exelon nuclear power plants could help provide certainty for the plants through the
period of anticipated risk.

                                  State support could be part of a strategy for the Illinois economy to
transition to less carbon-emitting resources. To structure the support efficiently, state support would

Synapse Energy Economics, Inc.                                            Exelon Illinois Nuclear Fleet Audit   ii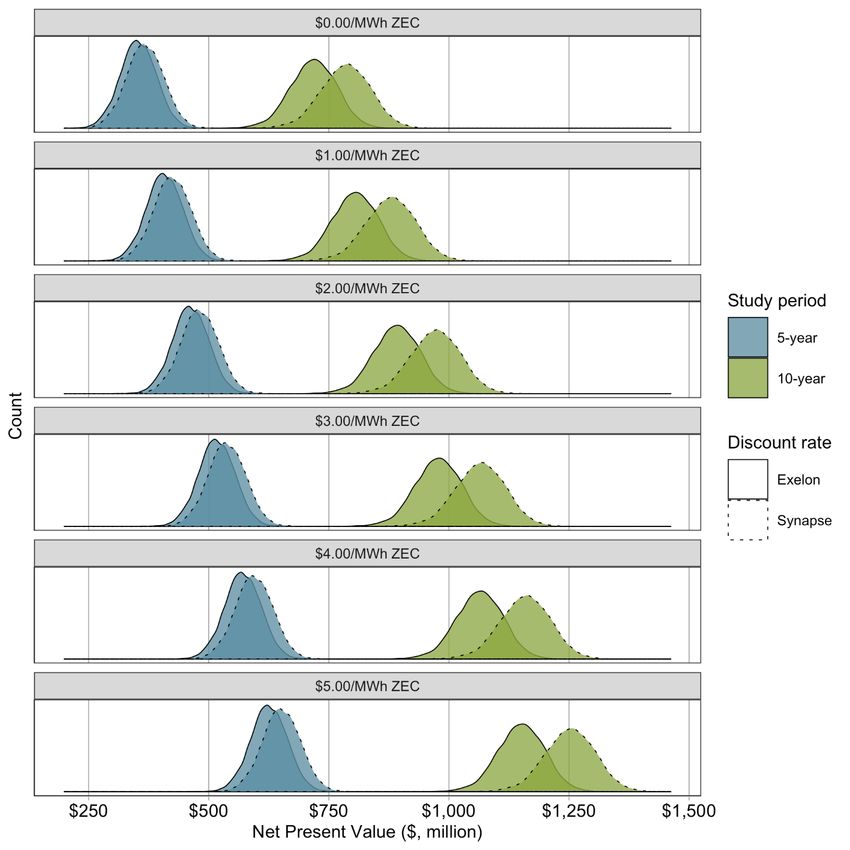
Redacted Version

require cooperation from Exelon to be transparent with its finances to ensure that state support is
provided only when required to support the economic operation of the plants.

Synapse Recommends:

If Illinois determines it is in the interest of state public policy to support the existing nuclear plants, then
Synapse recommends that Illinois develop a program that offers financial support for the Byron and
Dresden plants only when the plants require this support. Such a program should include the following
features:

    •    This program need not extend beyond five years and could be re-evaluated at the end of
         the five-year period. The 10-year expected NPVs for Byron, LaSalle, and Braidwood are
         all positive. The 10-year NPV for Dresden is also positive but may be affected by the
         assumed retirement of Unit 2 in 2029.

    •    Illinois could consider of a subsidy rate of $1.00/MWh for Byron and $3.50/MWh for
         Dresden that would ensure that 95 percent of the five-year expected NPVs for each
         plant remains above zero at the Synapse discount rate in the Monte Carlo analysis. For
         illustrative purposes, a $3.00/MWh rate would collect approximately $100 million per
         year from ratepayers for the two plants.

    •    Alternatively, If Illinois adopts a carbon price, the State could consider a subsidy rate of
         $2.50/MWh for Dresden only that would ensure that 95 percent of the five-year
         expected NPVs for each plant remains above zero at the Synapse discount rate in the
         Monte Carlo analysis. No subsidy would be required for Byron in the Carbon Price
         Scenario.

    •    While Synapse recommends no particular mechanism, any subsidy for the output of the
         two plants should be based on each plant’s financial need. No subsidy should be paid
         without demonstration of actual need. Such need could be determined by either actual
         costs and revenues or based on projected energy prices relative to the projections
         developed in this analysis. This process should occur annually and should be transparent
         and formulaic for all parties.

    •

                                 (See Appendix D for an explanation of these optimization
         efforts.)

Synapse Energy Economics, Inc.                                               Exelon Illinois Nuclear Fleet Audit   iii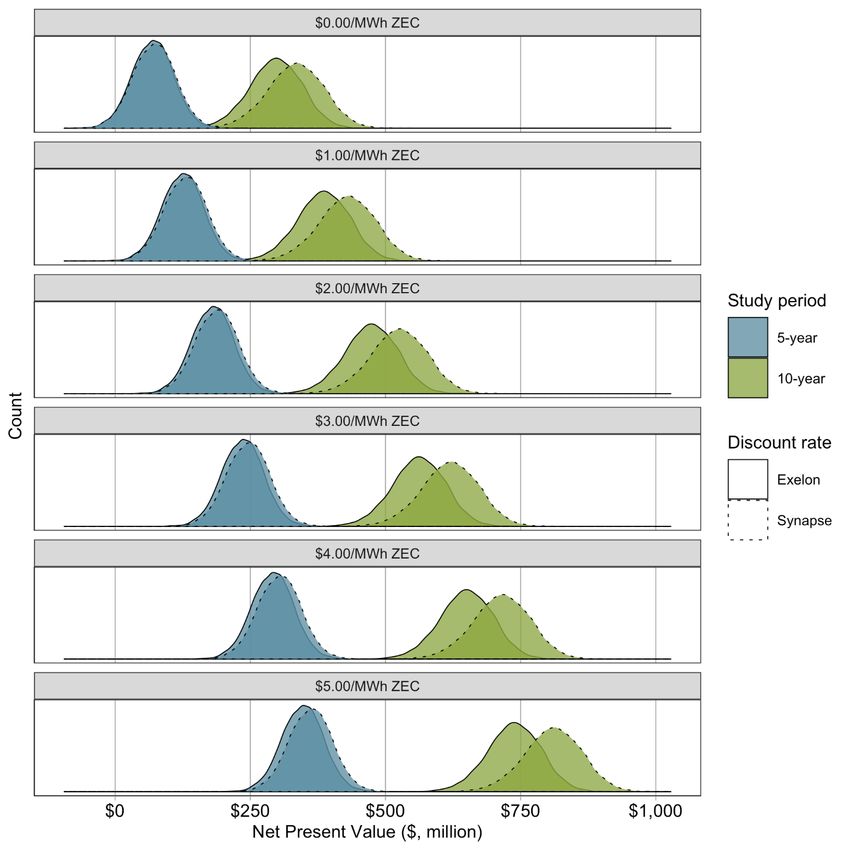
Redacted Version

The table below summarizes our findings for the four plants and includes information for Exelon’s
Clinton and Quad Cities plants that already receive zero emission credits (ZECs) and are not part of this
analysis. 1

Table ES- 1. Summary of findings
                                               Five-year
                                             Expected Net                          Five-Year
                 License      Nameplate                                           Recommend
                                             Present Value         Subsidy
    Plant       Expiration     Capacity                                             Subsidy
                                              at Exelon’s        Appropriate?
                 Date(s) 2      (MW) 3       Discount Rate                          Amount
                                                                                   ($/MWh)
                                               (millions) 4
 Braidwood           2046,          2,386                  $69              No            none
                      2047
 Byron               2044,          2,347                  $31             Yes            $1.00
                      2046
 Clinton              2027          1,080                  N/A             N/A              N/A
 Dresden             2029,          1,845                 -$87             Yes            $3.50
                      2031
 LaSalle             2042,          2,320                 $293              No            none
                      2043
 Quad               2032,           1,403                 N/A              N/A              N/A
 Cities              2032
Notes:
Clinton and Quad Cities currently receive ZECs from the 2016 CEJA. These ZECs expire in 2027 .
Exelon owns 75 percent of the Quad Cities Nuclear Station. Values presented represent the portion owned by Exelon

1 Exelon’s Clinton and Quad Cities plants currently receive ZECs through 2027. Synapse did not conduct financial analysis of
 those two plants for the five-year and 10-year period.
2 50_EXC_Audit_Response.

3 Exelon Corporation. Form 10-K Annual Report Pursuant to Section 13 or 15(d) of the Securities Exchange Act of 1934 for the
 Fiscal Year Ended December 31, 2020. Page 341. Available at: https://investors.exeloncorp.com/static-files/ab8f2e58-fb68-
 4f1c-9197-bdca30371726
4 Monte Carlo Analysis Results.

Synapse Energy Economics, Inc.                                                          Exelon Illinois Nuclear Fleet Audit    iv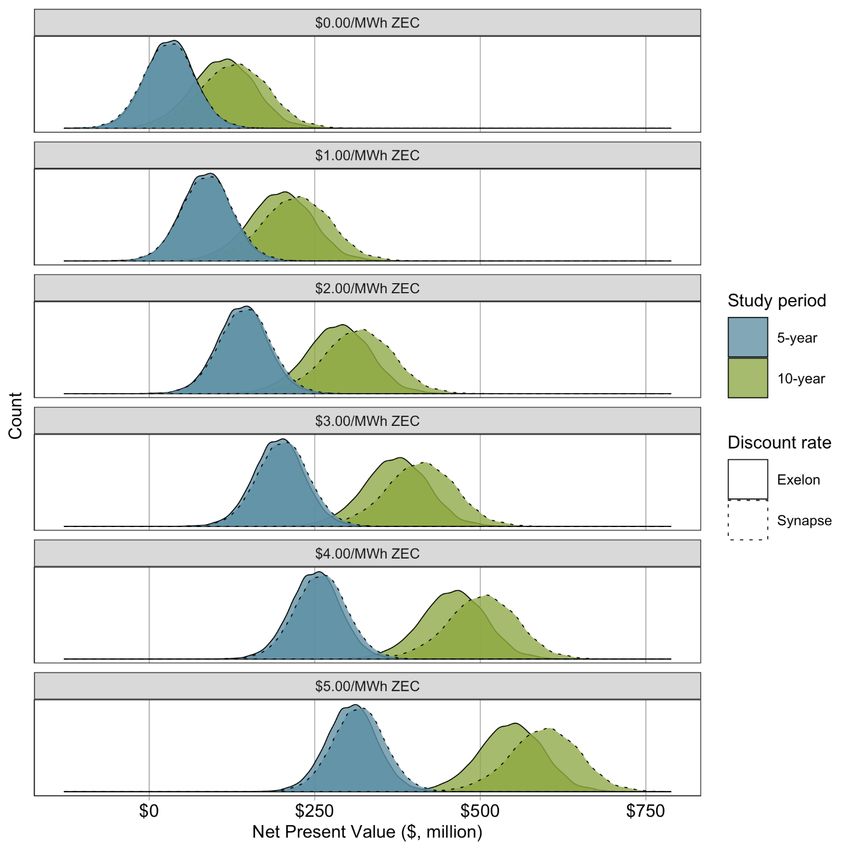
Redacted Version

1. BACKGROUND
1.1. Summary of Illinois Plants
Exelon currently operates six nuclear plants within the State that contain a total of 11 reactors. With
12,415 megawatts (MW) of nuclear nameplate capacity, Illinois ranked first in the country in terms of
nameplate capacity and first in total energy generation (100,246 gigawatt-hours, or GWh) from nuclear
units in 2020. 5 Figure 1 below provides a summary of the six plants.

Figure 1. Summary of Exelon’s Illinois nuclear plants
                                                                                            Operating             Years to
                                                          Commercial
                       Nameplate MW          Unit                              Age           License              License
          Plant                                            Operation
                                                                                            Expiration           Expiration

                                               1           9/16/1985            35          10/31/2044                23
          Byron              2,347
                                               2            8/2/1987            33          11/6/2046                 25

                                               1           7/29/1988            32          10/27/2046                25
    Braidwood                2,386
                                               2           10/17/1988           31          12/18/2047                26

      Clinton                1,080             1           9/15/1987            33          4/17/2027                  6

                                               3            6/9/1970            50          12/22/2029                 8
      Dresden                1,845
                                               4           11/16/1971           49          1/12/2031                 10

                                               1            1/1/1984            37          4/17/2042                 21
      LaSalle                2,320
                                               2           10/19/1984           36          12/16/2043                22

                                               1           2/15/1973            48          12/14/2032                11
    Quad Cities              1,403
                                               2           3/10/1973            48          12/14/2032                11

Source: Exelon 2020 10K and other nuclear plant data.

On August 27, 2020, Exelon Generation (Exelon) announced its intention to shut down the Byron and
Dresden plants starting in September 2021 for Byron and November 2021 for Dresden. 6 Exelon claims
that projected losses for the two plants were in the hundreds of millions of dollars due to declining
energy prices and market rules that favored fossil fuel plants. 7

5 Pennsylvania was second with 9,532 MW of nameplate capacity and 76,521 GWh in 2020. Data is available from the U.S.
 Energy Information Administration web page on nuclear generation, available at https://www.eia.gov/nuclear/generation/.
6 Exelon. “Exelon Generation to Retire Illinois’ Byron and Dresden Nuclear Plants in 2021.” August 27, 2020. Available at
 https://www.exeloncorp.com/newsroom/exelon-generation-to-retire-illinois%E2%80%99-byron-and-dresden-nuclear-plants-
 in-2021.
7 Ibid.

Synapse Energy Economics, Inc.                                                          Exelon Illinois Nuclear Fleet Audit   1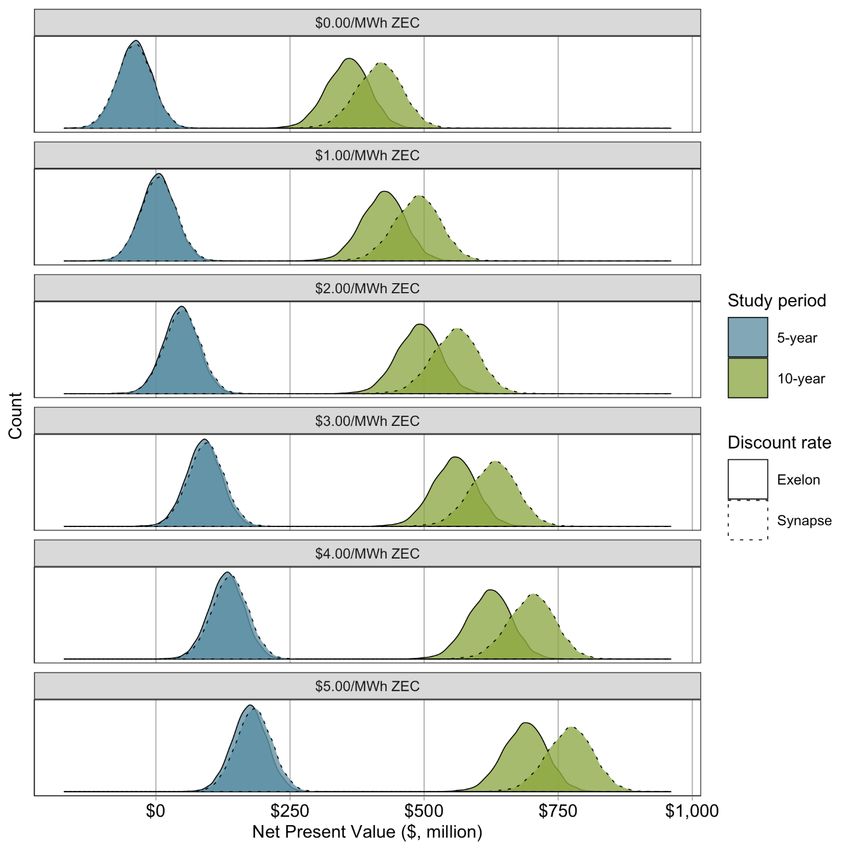
Redacted Version

                                                                                          . This may
contribute to the relative historical and current financial outlook of the four plants since, all things being
equal, higher heat rate plants operate less efficiently than lower heat rate plants . 8

The last time Exelon announced planned nuclear retirements due to insufficient revenues—Exelon
announced its intention to retire the Clinton and Quad Cities plants in 20169—Illinois responded by
passing legislation granting subsidies for the two plants through 2027. This prompted Exelon to rescind
its decision to retire the two plants early. 10

1.2. Historical Revenues
Historical revenues for each plant for the last 10 years are presented in the figures below by energy,
capacity, and other revenues.

Figure 2. Total revenue by plant by calendar year (nominal dollars)

Source: Exelon historical cashflow data.

8 EXC Audit 17.

9 Exelon. “Exelon Announces Early Retirement of Clinton and Quad Cities Nuclear Plants.” June 2, 2016. Availab le at
 https://www.exeloncorp.com/newsroom/clinton-and-quad-cities-retirement.
10 Exelon. “Governor Rauner Joins Hundreds of Community Members, Local Business Leader, Environmental Groups and
   Nuclear Plant Employees for Signing of Future Energy Jobs Bill.” December 7, 2016. Available at
   https://www.exeloncorp.com/newsroom/governor-rauner-signing-of-future-energy-jobs-bill.

Synapse Energy Economics, Inc.                                                         Exelon Illinois Nuclear Fleet Audit   2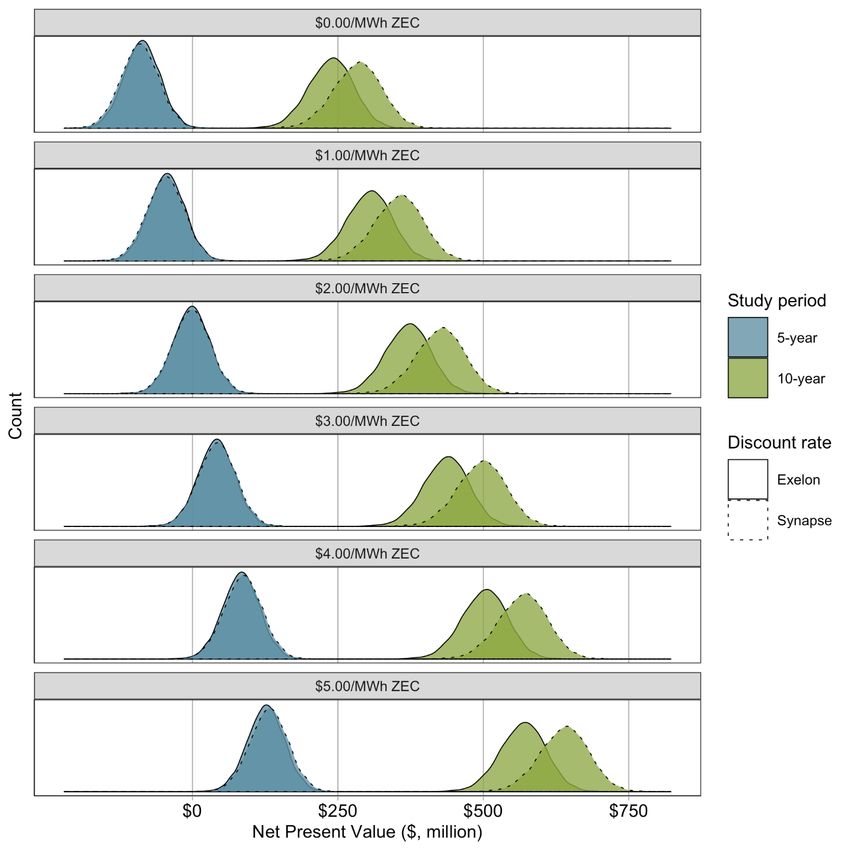
Redacted Version

Figure 3.Capacity revenues by plant overlayed on the corresponding plant’s energy revenues (Nominal $)

Source: Exelon historical cashflow data.
Note: Plant capacity revenues are overlayed (not stacked) against energy revenues; this figure shows that energy revenues have
consistently contributed to a much larger amount of the revenue than capacity revenues.
(*) Capacity and ZEC revenue are only applicable for plants receiving ZEC revenues (Clinton and Quad Cities).

Energy revenues
The area covered by the Commonwealth Edison service territory of Illinois operates within the broader
construct of the PJM region, which includes the movement of wholesale electricity in all or part of 13
states (Delaware, Illinois, Indiana, Kentucky, Maryland, Michigan, New Jersey, North Carolina, Ohio,
Pennsylvania, Tennessee, Virginia, and West Virginia) and the District of Columbia. Overall, PJM serves
65 million people with a peak load of 165,563 MW and with 186,788 MW of generating capacity. 11

The PJM energy market procures electricity to meet consumers’ demands both in real-time (five
minutes) and on a day-ahead (one-day forward) basis. PJM uses locational marginal prices (LMP) to price
energy purchases and sales. The LMP is the clearing price in energy markets based on the cost of
generating the last quantity of electricity needed to meet demand in the moment (and location). The
clearing price is paid to all accepted bidders in that specific location. PJM ensures the lowest production
cost by requiring generators to bid the price and amount of generation at generator-specific locations
(i.e., a generator “bus”) and accepting bids from the lowest offer prices until the accepted amount
meets the demand.

11 PJM. PJM 2019 Annual Report. “Welcome.” 2020 Available at https://services.pjm.com/annualreport2019/welcome.

Synapse Energy Economics, Inc.                                                          Exelon Illinois Nuclear Fleet Audit   3
Redacted Version

Because nuclear units are slower to increase or decrease their energy output and generally run
continuously at maximum output, they tend to bid as price-takers in energy markets. This ensures that
they can continuously sell their energy, regardless of the clearing prices in the day-ahead and real-time
energy markets.

Figure 3 above shows that from 2011 through 2020, the four plants generated          billion in energy
          12
revenues. Overall, energy revenues comprise approximately percent of the units’ revenues. This
portion varies slightly among the four plants. Energy revenues have and continue to represent the
largest portion of total revenues for the six nuclear plants.

Capacity revenues
Capacity revenues represent the next largest portion of total revenues for the six nuclear plants , after
energy. 13 Following a period of                                               as illustrated in Figure 4
below, PJM capacity market revenues for Exelon’s nuclear plants
                                                  .            in PJM capacity market revenues were due
to rising market clearing capacity prices in PJM’s annual Base Residual Auction (BRA) for the COMED
zone, or locational delivery area (LDA). Rising capacity revenues, combined with stable or declining
energy revenues              , resulted in          percent of company total revenue from the PJM
capacity revenues as illustrated in Figure 4 below.

           , capacity market revenues for nearly all plants trended similarly, rising, or falling subject to
the BRA market clearing prices.

Beginning in 2018, however, Quad Cities capacity revenues diverged from all other Exelon nuclear plants
and declined               year over year, while capacity market revenues for all other plants rose
                      year over year. The decline in capacity revenues resulted from Quad Cities failing
to clear the BRA for the 2018/2019 Delivery Year. 14 PJM capacity revenues for Quad Cities for the 2018
calendar year are based on the capacity clearing prices for the BRAs for both the 2017/2018 and
2018/2019 delivery years. 15 The company received payments from January through May based on the
2017/2018 market clearing price and for June through December based on the 2018/2019 capacity
price. Quad Cities again failed to clear the 2019/2020 and the 2020/2021 BRAs, leading to a continued
sharp reduction in capacity market revenues for the plant.

12 EXC Audit 10.

13 EXC Audit 10. The Clinton and a portion of the Quad Cities plants are located in the MISO RTO, and thus do not receive PJM

   capacity market revenues.
14 Capacity market revenues in 2018 would in theory, comprise   percent of revenue in the 2017/2018 BRA delivery year and
     percent of revenue in 2018/2020 BRA, consistent with the PJM delivery year definition of June through May. See
   Appendix C for more details.
15 PJM delivery year is from June 1 st through May 31 st .

Synapse Energy Economics, Inc.                                                        Exelon Illinois Nuclear Fleet Audit       4
Redacted Version
Capacity market revenues for Byron diverged from the other Exelon plants in 2019, when capacity
revenues for the plant year over year, while capacity revenues from all other plants
year over year. Unlike Quad Cities, however, Byron was able to clear a
portion of its capacity offer in the 2019/2020 BRA. We describe the rationale for this below.
In the calendar years 2021 and 2022, capacity market revenue trends for all plants are likely to diverge
from historical trends due to the results of the 2021/2022 BRA presented in Figure 5. This figure shows a
decline in cleared capacity for three of the five Exelon nuclear plants in PJM. In this most recent BRA,
Byron cleared just of its capacity offer, Dresden failed to clear at all, and Braidwood cleared
of its capacity offer. In contrast, Quad Cities’ capacity offer cleared for the first time since the
2017/2018 BRA.
Figure 4. Capacity revenues as a percentage of total revenues by nuclear plant (PJM only)
Source: EXC Audit 10.
Synapse Energy Economics, Inc. Exelon Illinois Nuclear Fleet Audit 5Redacted Version Figure 5. Cleared capacity by plant for each Base Residual Auction (PJM only) Source: Exelon historical capacity market data. The PJM Internal Market Monitor (IMM) reviews the results for each of PJM’s annual capacity auctions. For the 2021/2022 Delivery Year, the IMM states, “Based on the data and this review, the MMU [market monitoring unit] concludes that the results of the 2021/2022 RPM Base Residual Auction were not competitive as a result of economic withholding by resources that used offers that were consistent with the net CONE times B offer cap but not consistent with competitive offers based on the correctly calculated offer cap.”16 Furthermore, for nuclear units participating in the 2021/2022 delivery year auction, the IMM concludes, “Nuclear offer behavior changed in the 2021/2022 RPM Base Residual Auction compared to prior auctions. More nuclear capacity was offered at higher sell offer prices and fewer nuclear MW cleared.” 17 Bidding behaviors Exelon’s bid data 18 from the 2017/2018 BRA through the 2021/2022 BRA suggests that Byron’s and Quad Cities’ inability to clear the market was caused by two primary factors, 16 Monitoring Analytics. August 24, 2018. Analysis of the 2021/2022 RPM Base Residual Auction: Revised. A report prepared by The Independent Market Monitor for PJM, page 3. 17 Id, page 18. These include nuclear units in Ohio, Pennsylvania, and Illinois that did not clear the 2021/2022 Base Residual Auction. 18 EXC Audit 11. Synapse Energy Economics, Inc. Exelon Illinois Nuclear Fleet Audit 6
Redacted Version

                      and                             . The experiences of the two plants provide some
context to understand Exelon’s historical PJM capacity market participation.

While all of Exelon’s plants cleared the 2017/2018 BRA, and the subsequent capacity performance
transition auction, Quad Cities failed to clear the 2018/2019 auction

Another reason for some plants not clearing is

                                                  .

When modeling future years, we have assumed that all Exelon nuclear power plants in the PJM COMED
zone will bid at low prices with the intention to clear the capacity market. This strategy would ensure
that each plant receives full capacity revenues for each unit’s entire firm capacity.

Other revenues
Other revenues such as ancillary services compensation represent the smallest portion of total revenues
for the six nuclear plants.

19 PJM Interconnect. September 17, 2020. PJM Open Access Transmission Tariff. Attachment DD Section 5.12.

20 EXC Audit 44.

21 EXC Audit 44.

Synapse Energy Economics, Inc.                                                     Exelon Illinois Nuclear Fleet Audit   7
Redacted Version 1.3. Separation of Exelon On February 24, 2021, Exelon announced its intention to separate its utility and competitive energy business into two separate companies. 22 We understand that the split will separate the six regulated electric and gas utilities from the competitive generation and energy businesses. Exelon expects the separation to be completed by the first quarter of 2022, subject to regulatory approvals. 23 At this time, we do not have any specific information about the nature of the separation or how the separation will impact the operations of the nuclear plants. Accordingly, we have not made any specific adjustments in our analyses. 2. METHODOLOGY Generally, nuclear plant financial analyses entail settling on a portfolio of uncertain assumptions, which then form the basis of linear trajectories to determine future revenues and costs. This approach places undue importance on those initial choices. The result has led to contentious debates over study timeframes, the appropriateness of assumptions, treatment of uncertainties, and the magnitude of future risks. As an example, determining cost adders necessarily treats operational and market risk as fixed, when in fact these fluctuate over time as circumstances change. We find that various outcomes impacting the future profitability for a nuclear plant are hard to solve directly. To better account for uncertainties and variable outcomes, we incorporated a Monte Carlo simulation that encompassed distribution and probabilities of revenues and costs for the four plants over the next five and 10 years rather than assigning fixed estimates for revenues and costs. The Monte Carlo simulation identified possible results by applying a probability distribution to inputs with inherent uncertainty. Our Monte Carlo simulation then recalculated results 10,000 times, each time using a different set of inputs randomly selected from within minimum and maximum values for our inputs. The simulation then developed a distribution of net present values (NPV) for each of the four plants for the analysis period using Exelon’s discount rate of percent without a subsidy and a Synapse discount rate of percent with a subsidy. The following section details our Monte Carlo analysis methodology and our EnCompass modeling methodology to develop energy and capacity price inputs for the Monte C arlo analysis. 22 Exelon. Exelon to Separate its Utility and Competitive Energy Businesses into Two Industry -Leading Companies. February 24, 2021. Available at https://www.exeloncorp.com/newsroom/exelon-to-separate-its-utility-and-competitive-energy- businesses-into-two-industry-leading-companies 23 Ibid. Synapse Energy Economics, Inc. Exelon Illinois Nuclear Fleet Audit 8
Redacted Version

2.1. Monte Carlo Analysis
Synapse utilized a Monte Carlo analysis to forecast the expected profitability of the four Exelon nuclear
generating stations under a range of market and operational uncertainties. A Monte Carlo model is a
mathematical technique used for evaluating possible outcomes in problems with uncertainty and risk. It
is commonly employed in financial modeling and long-term prediction where the likelihood of various
outcomes in a problem is difficult to resolve with any certainty. Our Monte Carlo analysis involved four
steps:

     1. Develop a predictive model for estimating an outcome (or result)—such as nuclear plant
        profitability—based on a range of inputs (or predictors).

     2. For each input, identify the range and probability of possible values. This may be done
        using historical data, expert judgement, scenario-based assumptions, or a combination
        of these methods.

     3. Run the predictive model, calculating the outcome based on input values selected at
        random from the range of possible values. Repeat this simulation many times to
        produce a large number (e.g., many thousands) of likely outcomes until the distribution
        of outcomes does not change substantially with additional runs.

     4. Evaluate the results of the simulation in order to estimate the likely outcome (e.g.,
        average of all simulations) and impact of uncertainty (e.g., variance, range, or
        probability of simulated values).

In short, a Monte Carlo analysis identifies possible results by applying a probability distribution to inputs
with inherent uncertainty. The simulation recalculates results numerous times, each time using a
different set of inputs randomly selected from within minimum and maximum values.

Synapse’s approach fits within a history of previous studies that have used Monte Carlo methods to
evaluate the financial viability of nuclear power stations under a range of technical, economic, and
policy uncertainty. For example, Wealer et al. 24,25 evaluated economic indicators of current and future
investments in construction and operation of nuclear power plants through Monte Carlo simulations. A
2017 study by Riesz et al. 26 assessed the economic risks for nuclear power generators using Monte Carlo
modeling to quantify the combined effect of uncertainty across a range of nuclear plant cost

24 Wealer, B., Bauer, S., Göke, L., Hirschhausen, C. and Kemfert, C., 2019. Economics of nuclear power plant investment: Monte
   Carlo simulations of generation III/III+ investment projects. Deutsches Institut für Wirtschaftsforschung.
25 Wealer, B., Bauer, S., Hirschhausen, C., Kemfert, C. and Göke, L., 2021. “Investing into third generation nuclear power plants-
   Review of recent trends and analysis of future investments using Monte Carlo Simu lation.” Renewable and Sustainable
   Energy Reviews, 143, p.110836.
26 Riesz, J., Sotiriadis, C., Vithayasrichareon, P. and Gilmore, J., 2017. “Quantifying key uncertainties in the costs of nuclear

   power.” International Journal of Energy Research, 41(3), pp.389-409.

Synapse Energy Economics, Inc.                                                              Exelon Illinois Nuclear Fleet Audit     9
Redacted Version
components. Rode et al. (2001)27 presented a case study comparing the valuation of an existing nuclear
plant using a standard income-capitalization analysis and a Monte Carlo simulation.
Synapse’s Monte Carlo model is designed to capture the impact of market and operational uncertainty
on the economics of Exelon’s power plants. This approach is an alternative to Exelon’s method of
characterizing economic risk. When assessing the future economic viability of its nuclear generating
stations, Exelon incorporates an estimate of market and operating risk alongside its forecasted annual
operating expenses of each plant.
our Monte Carlo analysis identifies a range of probable NPVs, inclusive of uncertainty in
expenses (for example, due to unscheduled outages, unplanned capital projects, and variations in
operating costs) and revenues due to market fluctuations.
Methodology for simulating of nuclear plant NPV cash flows
The Monte Carlo model is designed to perform 10,000 simulations for each plant, outputting a single
estimate of the plant’s NPV for each simulation. The NPV provides a measure of profitability by
aggregating projected revenues and expenditures at a plant over multiple years, with cash flows in
future years discounted by a weighted average cost of capital (WACC). Equation 1 provides the formula
for calculating NPV, where Ct represents the net-cashflows at a plant at time t, and r is the WACC or
discount rate. It is important to draw a distinction between net cashflow and net income. The former is
a measure of the actual cashflow associated with a plant in a year, while the latter takes accrual
schedules into account and is only impacted by the recognized incomes and expenses for a given period.
Functionally, this means that net cash flow includes all capital expenditures, whereas net income would
only include depreciated or amortized capital. The discount factor is calculated using
29
Exelon’s methodology. The exponential term represents the time elapsed since January 1,
2021, as of the start of the third quarter (July 1 st) in each year.
Plant revenues are primarily generated through the energy market and capacity market, though our
model also includes ancillary service revenue. At a high level, expenditures consist of five categories of
27 Rode, D.C., Fischbeck, P.S. and Dean, S.R., 2001. “Monte Carlo methods for appraisal and valuation: a case study of a nuclear
power plant.” The Journal of Structured Finance, 7(3), pp.38-48.
29 EXC Audit 24.
Synapse Energy Economics, Inc. Exelon Illinois Nuclear Fleet Audit 10Redacted Version
cost: operations and maintenance (O&M), overhead, outage, spent fuel, and capital expenditures on
fuel and non-fuel items. The random variation within the Monte Carlo is modeled independently for
many, though not all, of the revenue and expense parameters. After this, the model aggregates net
cashflows and calculates an NPV. For a more detailed description of the methods used to calculate
revenues and expenses and to estimate the associated uncertainty, see reference Appendix F.
Data inputs
The Synapse Monte Carlo simulation estimated the NPV of each nuclear generating station using a
combination of inputs (1) provided by Exelon through discovery and (2) independently prepared by
Synapse. Figure 6 summarizes the input categories and uncertainty distributions we used to estimate
plant-specific revenues and expenses over the study period. We used Exelon’s expected plant
operations and expenses for initial cost inputs to our model. However, we replaced Exelon’s forecasted
energy and capacity revenues using results from our own modeling of the PJM and MISO markets, as
described in Section 2.2. To directly quantify the effect of future market and operational uncertainty, we
incorporated two types of adjustments to our model parameters:
1. Adjustments to Exelon’s forecasted operations, revenues, and expenses where these
parameters do not include the impact of operational risk.
2. Additionally, we defined a range of possible values for inputs that can significantly
impact total revenues and expenses. We create these ranges and associated probability
distributions using historical data provided by Exelon30 or scenario-based
assumptions. 31
Appendix F provides time-variant granular data at the plant level used in the Monte Carlo analysis and a
detailed description of the methods used to prepare the uncertainty distributions .
30 For example, we used 10 years of historical unscheduled plant outage data provided b y Exelon in discovery response to
create a fleet-wide probability distribution of forced outage events and their associated durations.
31 For example, we created an assumed probability distribution that the U.S. Department of Energy revives the nuclear spent
fuel fee in the future.
Synapse Energy Economics, Inc. Exelon Illinois Nuclear Fleet Audit 11Redacted Version
Figure 6. Data inputs and uncertainty distribution for Monte Carlo analysis
Model
Include
Include Uncertainty
Synapse
Input Category Exelon in Monte Uncertainty Distribution
Values or
Values Carlo
Adjustments
Analysis
Probabilistic (non-uniform); based
on 10-year historical distribution of
PJM bus-level prices; incorporates
Energy Revenue No Yes Yes
uncertainty in generation based on
10-year Exelon historical outage
distribution
Normal; based on Synapse
Capacity Revenue No Yes Yes sensitivity analyses of PJM
capacity market
Sensitivity
ZEC Revenue Yes Yes $0/MWh – $16.5/MWh
analysis
Ancillary Revenue Yes No No N/A
Probabilistic (non-uniform); based
on 10-year historical distribution of
O&M Expenses Yes Yes Yes
Exelon O&M costs, including
unscheduled outages
Probabilistic (non-uniform); based
Capital Expenses Yes Yes Yes on 10-year historical distribution of
Exelon capital costs from outages
Probabilistic (non-uniform); based
Outage Expenses Yes Yes Yes on 10-year historical distribution of
Exelon scheduled outage costs
Nuclear Fuel
Yes No No N/A
Expenses
Binary (0 or 1) multiplier with a
probability function for value of 1
Spent Fuel that grows at 3% per year starting
Yes No Yes
Expenses at 0% f or 2021, representative of
U.S. DOE reviving the spent
nuclear f ee in the f uture
Probabilistic (non-uniform); based
Overhead
Yes No Yes on 10-year historical distribution of
Expenses
Exelon overhead costs
Sensitivity
Discount Rate Yes Yes Synapse ( ) or Exelon ( )
analysis
Monte Carlo sensitivity and scenario analysis
Utilizing a Monte Carlo simulation allowed us to evaluate the sensitivity of Exelon’s nuclear plant
profitability to possible future scenarios and different study periods. We estimated the NPV for each
plant across a series of sensitivities and scenarios:
Synapse Energy Economics, Inc. Exelon Illinois Nuclear Fleet Audit 12Redacted Version
• ZEC Rates: Although our Monte Carlo was not designed as an optimization model, it
does include a sensitivity analysis which reports projected NPVs at 15 levels of ZEC
subsidy. The sensitivity analysis can be used to identify the subsidy amount to ensure
positive NPVs at each plant. The first ZEC scenario was for a $0.0/MWh ZEC, which
simulates a business-as-usual scenario in which the plants receive no additional revenue
from ZEC subsidies. The next 12 scenarios analyzed ZECs ranging from $0.5/MWh to
$6.0/MWh, separated by increments of $0.5/MWh. Additionally, we modeled a
$10.0/MWh subsidy and a $16.5/MWh ZEC subsidy to test the effects of larger ZECs on
plant NPVs. The lowest ZEC amount for which 95 percent of all Monte Carlo simulations
were positive was determined to be the required subsidy for each plant.
• Discount rate: Our model computed plant NPV under two discount rates. Our base assumption
for discount rate used Exelon’s current after-tax WACC of . 32 We also included a
percent discount rate to represent returns to shareholders for a lower-risk investment, such as
nuclear plants supported by ZECs or other subsidies to help maintain profitability.
33
• Carbon price: We evaluated plant profitability under scenarios with and without carbon pricing.
Our baseline model incorporated expected plant revenues within the PJM and MISO markets
under a business-as-usual policy scenario in which carbon pricing has not been adopted. To test
the effect of carbon pricing, we used an alternate forecast of plant revenues in which Illinois
implements a carbon price comparable to Regional Greenhouse Gas Initiative (RGGI) carbon
prices in year 2023.
• Study Periods: We calculated NPV over a 5-year and 10-year study period to evaluate
whether the need for a subsidy varies with time. The model first estimated variation
over the full 10-year study period, which runs from 2021 to 2030. When NPVs of the
cash flows were calculated during the final step of each simulation, the model either
took the full 10-year time series of net-cash flow data or just the first five years,
depending on which study period NPV it was calculating. While most of the plants are
fully operational throughout the entire 10-year study period, Dresden has its nuclear
licenses expire before the end of 2030. The license for Dresden Unit 2 will expire in
December 2029, which primarily impacts net cash flows during the final years of the 10-
year study period. Exelon has not announced any plans to extend the license for Unit 2
beyond 2029.
32
33 Exelon. Earnings Conference Call Fourth Quarter 2020. February 24, 2021. See slide 33. Available at
https://investors.exeloncorp.com/static-files/2dda3a5d-b5c9-40d6-829f-da5c2efd6cc9.
Synapse Energy Economics, Inc. Exelon Illinois Nuclear Fleet Audit 13Redacted Version
2.2. EnCompass Modeling
We modeled energy and capacity prices for the nuclear plants using the EnCompass production-cost
model for (a) a base-case scenario that assumes the nuclear plants retire based on current nuclear
license expirations and (b) a carbon-price scenario that introduces a carbon price in Illinois in 2023. We
then used the resulting energy and capacity price forecasts as inputs into the Monte Carlo analysis. The
following describes our modeling methodology. Appendix E provides more detailed information
regarding the EnCompass model inputs incorporated in our analysis.
EnCompass Model
Synapse used the EnCompass model to derive both energy and capacity prices at a zonal level for the
MISO and PJM regions. Developed by Anchor Power Solutions, EnCompass is a single, fully integrated
power system platform that allows for utility-scale generation planning and operations analysis.
EnCompass is an optimization model that covers all facets of power system planning, including the
following:
• Short-term scheduling, including detailed unit commitment and economic dispatch
• Mid-term energy budgeting analysis, including maintenance scheduling and risk analysis
• Long-term integrated resource planning, including capital project optimization and
environmental compliance
• Market price forecasting for energy, ancillary services, capacity, and environmental
programs
EnCompass provides unit-specific, detailed forecasts of the composition, operations, and costs of the
regional generation fleet given the assumptions described in this document. Synapse populated the
model using the EnCompass National Database, created by Horizons Energy. Horizons Energy
benchmarked its comprehensive dataset across the 21 North American Electric Reliability Corporation
(NERC) Assessment Areas and it incorporates market rules and transmission constructs across 76 distinct
zonal pricing points. More information on EnCompass and the Horizons dataset is available at
www.anchor-power.com.
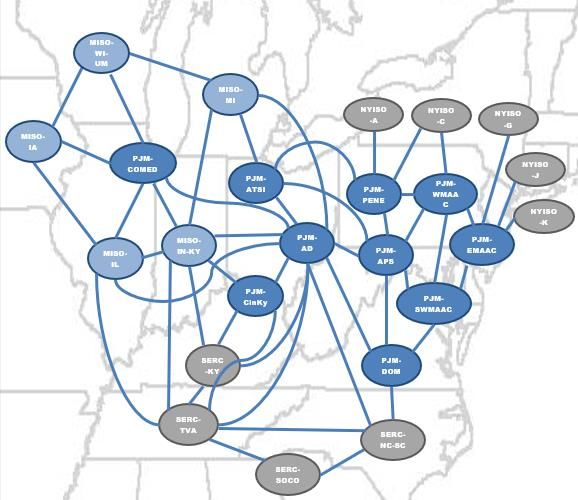
Modeling topology
Exelon’s Illinois nuclear units are located in the PJM-COMED and MISO Illinois zones. Synapse modeled
the PJM and MISO regions to derive both energy and capacity prices at the zonal level for each of the
respective balancing authorities and zones. Each zone is mapped to the regional projections for system
demand and specific generating units are mapped to aggregated geographical regions. The load and
generation within each of the zonal areas are then linked by transmission areas to create an aggregated
balancing area. In addition, each of the balancing authorities is subject to renewable portfolio standards.
The model integrates RGGI compliance for participating states. For further details on input parameters
related to EnCompass modeling, please refer to Appendix E.
Synapse Energy Economics, Inc. Exelon Illinois Nuclear Fleet Audit 14Redacted Version Scenario analysis Synapse analyzed the impacts of two scenarios for energy prices, capacity prices, and carbon dioxide (CO2 ) emissions. The results of these runs are outlined in Section 3.1 and Appendix H. The first scenario, or Baseline Scenario, modeled evaluated the energy price and capacity prices for a 10-year time frame under the assumption that all nuclear units will operate to the end of their current license expiration dates. The second scenario, or Carbon Price Scenario, maintained similar assumptions but also assumed that Illinois fossil fuel-based plants would be subject to a carbon price equivalent to RGGI prices starting in 2023 and that Pennsylvania joins RGGI in 2022. 34 3. RESULTS: BYRON AND DRESDEN 3.1. Monte Carlo Analysis Results Our simulations identified the range of possible NPVs for the future operation of Byron and Dresden. 35 The results represent a span of potential future market and operational conditions inclusive of Exelon’s expected future expenses, Synapse’s forecast of plant revenues, and a range of potential variation that is grounded in 10 years of operating experience and market data for Exelon’s 11 Illinois nuclear units across six plant sites. We included scenarios (a) with ZEC values ranging from $0–$16.5/MWh, (b) with and without carbon pricing, (c) using 5-year and 10-year study periods, and (d) with the Synapse and Exelon discount rates. Figure 7 and Figure 8 present these NPV cash flows for Byron. Results for Dresden are shown in Figure 9 and Figure 10. Compared to Exelon projections found in its discovery responses, our estimates of NPV are higher, primarily due to the differences in energy and capacity revenues . Our Monte Carlo analysis indicated that, in scenarios without carbon pricing, modest subsidies may be needed to ensure positive NPV cash flow in 95 percent of the iterations for the Byron and Dresden plants during the period 2021–2025. For simulations with a ZEC value of $0/MWh, the bottom 20 percent, and 100 percent of economic outcomes for Byron and Dresden, respectively, had negative NPVs in the 5-year analysis with the Exelon discount rate. However, adding a ZEC price of $1.0/MWh results in a positive 5-year NPVs for 95 percent of simulations for Byron. Similarly, a ZEC price of $3.5/MWh was sufficient to create positive 5-year NPVs for Dresden in 95 percent of model runs. No subsidies were required to support Byron and Dresden when we expanded the Monte Carlo study period to the timeframe 2021–2030, as all simulations for both plants resulted in positive NPV cashflows. The scenario with carbon pricing results in positive NPVs for Byron, but negative NPVs for Dresden under the 2021–2025 study period. Additional Carbon Price Scenario results are presented in 34 Pennsylvania Department of Environmental Protection. Regional Greenhouse Gas Initiative. “What’s RGGI” 2021. Available at: https://www.dep.pa.gov/Citizens/climate/Pages/RGGI.aspx. 35 Refer to Appendix G for Monte Carlo analysis results for Braidwood and LaSalle. Synapse Energy Economics, Inc. Exelon Illinois Nuclear Fleet Audit 15
Redacted Version

Appendix H. Taken together, these results suggest that a decision by the State of Illinois to provide
modest (e.g., $1.0 and $3.5/MWh), short-term (e.g., 5-year) ZECs to Byron and Dresden may be
sufficient to keep 95 percent of the expected NPVs positive. Further, a carbon price in the same range as
RGGI, would maintain positive NPVs for Byron for 95 percent of the iterations and would reduce the
subsidy for Dresden to $2.5/MWh to ensure that 95 percent of the Monte Carlo iterations are positive.

Figure 7. Byron net present value cash flow, Baseline Scenario—Monte Carlo simulations

Source: Synapse Energy Economics model—Monte Carlo analysis using Exelon expense forecast with adjustments, Synapse
energy and capacity revenues forecast (Synapse internal production cost and capacity expansion model), and uncertainty
distributions derived from historical market and operational data.

Synapse Energy Economics, Inc.                                                      Exelon Illinois Nuclear Fleet Audit   16
Redacted Version

Figure 8. Byron expected net present value cash flow, Baseline Scenario—Monte Carlo simulations ($, million)
[5th–95th percentile]

                          10-Year Study Period Monte Carlo NPV               5-Year Study Period Monte Carlo NPV
         ZEC
                                         Results                                           Results

                         Synapse Discount          Exelon Discount         Synapse Discount           Exelon Discount
       ($/MWh)
                               Rate                     Rate                     Rate                      Rate

          0.0               127 [40 - 210]           111 [30 - 188]            30 [-34 - 93]             31 [-30 - 92]

          0.5               174 [87 - 257]           154 [73 - 231]            59 [-5 - 122]             58 [-3 - 119]

          1.0              221 [134 - 304]           198 [117 - 275]           87 [23 - 151]             86 [25 - 147]

          1.5              268 [180 - 352]           241 [160 - 319]          116 [52 - 180]             113 [52 - 175]

          2.0              315 [227 - 399]           285 [203 - 362]          145 [81 - 208]             141 [79 - 202]

          2.5              362 [274 - 446]           328 [247 - 406]          173 [109 - 237]           168 [107 - 230]

          3.0              409 [321 - 493]           372 [290 - 449]          202 [138 - 266]           196 [134 - 257]

          3.5              456 [368 - 540]           415 [333 - 493]          231 [166 - 295]           223 [161 - 285]

          4.0              503 [414 - 587]           459 [377 - 536]          259 [195 - 324]           251 [189 - 313]

          4.5              550 [461 - 634]           502 [420 - 580]          288 [223 - 352]           278 [216 - 340]

          5.0              597 [508 - 681]           546 [464 - 624]          317 [252 - 381]           306 [243 - 368]

          5.5              644 [555 - 728]           589 [507 - 667]          345 [280 - 410]           333 [271 - 395]

          6.0              691 [602 - 775]           633 [550 - 711]          374 [309 - 439]           361 [298 - 423]

         10.0             1,066 [976 - 1,152]       981 [897 - 1,060]         603 [537 - 669]           581 [517 - 644]

         16.5            1,676 [1,585 - 1,764]    1,546 [1,461 - 1,626]      976 [908 - 1,043]         938 [873 - 1,003]

Source: Synapse Energy Economics model—Monte Carlo analysis using Exelon expense forecast with adjustments, Synapse
energy and capacity revenues forecast (Synapse internal production cost and capacity expansion model), and uncertainty
distributions derived from historical market and operational data.

Synapse Energy Economics, Inc.                                                      Exelon Illinois Nuclear Fleet Audit    17
Redacted Version Figure 9. Dresden net present value cash flow, Baseline Scenario—Monte Carlo simulations Source: Synapse Energy Economics model—Monte Carlo analysis using Exelon expense forecast with adjustments, Synapse energy and capacity revenues forecast (Synapse internal production cost and capacity expansion model), and uncertainty distributions derived from historical market and operational data. Synapse Energy Economics, Inc. Exelon Illinois Nuclear Fleet Audit 18
Redacted Version

Figure 10. Dresden expected net present value cash flow, Baseline Scenario—Monte Carlo simulations ($,
million) [5th–95th percentile]
   ZEC       10-Year Study Period Monte Carlo NPV Results             5-Year Study Period Monte Carlo NPV Results

 ($/MWh)       Synapse Discount           Exelon Discount Rate           Synapse Discount              Exelon Discount
                     Rate                                                      Rate                         Rate
    0.0           283 [213 - 350]             238 [172 - 300]              -91 [-145 - -38]             -87 [-139 - -36]

    0.5           319 [248 - 386]             271 [205 - 333]              -69 [-123 - -15]             -66 [-118 - -14]

    1.0           355 [283 - 421]             304 [238 - 366]               -47 [-101 - 7]                -44 [-97 - 7]

    1.5           390 [319 - 457]             337 [271 - 399]               -24 [-79 - 29]                -23 [-76 - 29]

    2.0           426 [354 - 493]             370 [303 - 432]                -2 [-57 - 52]                -2 [-54 - 50]

    2.5           461 [390 - 528]             403 [336 - 465]                20 [-34 - 74]                20 [-33 - 71]

    3.0           497 [425 - 564]             436 [369 - 498]                43 [-12 - 96]                41 [-12 - 93]

    3.5           532 [461 - 600]             469 [402 - 531]               65 [10 - 119]                 62 [10 - 114]

    4.0           568 [496 - 635]             502 [435 - 564]               87 [32 - 141]                 84 [31 - 136]

    4.5           603 [532 - 671]             535 [468 - 598]               109 [55 - 163]               105 [52 - 157]

    5.0           639 [567 - 706]             568 [501 - 631]               132 [77 - 186]               126 [73 - 178]

    5.5           674 [602 - 742]             601 [534 - 664]               154 [99 - 208]               148 [95 - 200]

    6.0           710 [638 - 778]             634 [567 - 697]              176 [121 - 230]              169 [116 - 221]

   10.0          994 [922 - 1,063]            898 [831 - 962]              354 [298 - 409]              340 [286 - 392]

   16.5        1,456 [1,382 - 1,526]       1,327 [1,259 - 1,392]           643 [586 - 699]              617 [562 - 671]

Source: Synapse Energy Economics model—Monte Carlo analysis using Exelon expense forecast with adjustments, Synapse
energy and capacity revenues forecast (Synapse internal production cost and capacity expansion model), and uncertainty
distributions derived from historical market and operational data.

Synapse Energy Economics, Inc.                                                       Exelon Illinois Nuclear Fleet Audit   19
Redacted Version
The results of the Monte Carlo modeling indicate that both Byron and Dresden are expected to
experience negative NPVs over the five-year study period and positive NPVs over the 10-year study
period.
Figure 11. Monte Carlo NPVs difference from Exelon NPVs
The gap between Exelon’s forecasts and the Monte Carlo results were caused by several aspects of the
model, but differences in energy and capacity revenue forecasts were the biggest factors. Exelon’s
revenue forecasts are lower than those produced by the EnCompass model, which became the price
inputs for the Monte Carlo model.
As a result, net cash flows were also lower in the Exelon forecasts than
in the Monte Carlo analysis, which in turn led to lower NPVs.
In addition to the revenue differences, the Monte Carlo model contains several elements that likely
contributed to the gap in NPVs. Two of these will tend to lead to lower costs than those projected in the
Exelon forecasts. First, the spent fuel methodology, which factors in a reduced probability that spent
fuel costs will be collected by the U.S. Department of Energy, likely eliminated spent fuel costs in many
of the years included in both the five and 10-year study period. This is particularly true in the earliest
years of the analysis, which are also the years with the largest impact on NPV. Second, the scheduled
outage distribution in the Monte Carlo simulation was more heavily weighted towards shorter outage
duration, meaning that Exelon is likely to complete scheduled outages more quickly than forecast. This
depressed outage costs and allowed Exelon to increase generation. Although these two elements
depress costs, there are other offsetting elements which may have contributed to increased costs.
Namely, unscheduled outages will always lead to cost increases in the event that they occur. Ultimately,
while the spent fuel and scheduled outage cost elements may have contributed to slight depression of
costs, these factors were secondary to revenues in causing the NPV disparity between Exelon and the
Synapse Monte Carlo analysis.
Synapse Energy Economics, Inc. Exelon Illinois Nuclear Fleet Audit 20Redacted Version
Risk
The Illinois ZEC legislation and other
similar ZEC legislation have included
the phrase: “the cost of operational
and market risk that could be avoided
by ceasing operation.” ZEC Applicants
have interpreted the requirement by
including adders for both operational
and market risk to quantify the impact
of lower revenues and/or higher
costs. The use of the adders, in effect,
Our Monte Carlo analysis also incorporated Overhead costs assumes that there is a 100%
attributable to the nuclear plants. Overhead costs are probability that the plants will face
referenced in the 2016 Clean Energy Jobs Act that both higher costs and lower revenues.
established the current Illinois ZECs. Other states have also
included fully allocated overhead costs in their evaluation of Our Monte Carlo analysis diverges
nuclear plant financials. For the purposes of this analysis to from this absolute certainty of the
be consistent with current CEJA legislation and consistent operational and market risk by
with Exelon’s financial analyses, we have included these attempting to quantify the range and
costs. 36 These costs include service company and corporate distribution of possible outcomes
overhead costs. At this time Exelon has indicated that it (negative and positive) for the nuclear
that overhead or service company costs will plants.
when Exelon splits into two separate entities. 37
3.2. Encompass Modeling Results
Figure 12 and Figure 13 below show the modeled energy and capacity prices for the COMED region.
Figure 13 compares the modeled energy prices to the implied prices provided by Exelon for each of the
plants. 38 The key drivers behind the modeled energy prices were the future coal and natural gas prices.
The ComEd region energy price projections were also impacted by the commissioning of two large
natural gas plants, which are expected to start operation within the next three years. The Jackson
Generation and Three Rivers Energy Center plants are expected to start operation in 2022 and 2023,
36 We recognize that overhead costs would be unavoidable for an entit y should it retire a specific plant, and that such overhead
costs would be reallocated to remaining plants within the portfolio. We would agree that an analysis of plants owned by
different entities should only compare avoidable costs.
37 Exe Audit 85.
38 The implied energy price is based on energy revenues divided by generation.
Synapse Energy Economics, Inc. Exelon Illinois Nuclear Fleet Audit 21Redacted Version respectively. 39 In addition, the marginal energy prices were impacted by renewable portfolio standard requirements and availability of lower cost energy resources such as solar and wind in PJM and MISO. The energy forecasts below represent the zonal energy and capacity prices at the PJM-COMED and MISO-IL zones, respectively. 40 For more details on the input assumptions associated with the modeling, see Appendix E. Source: Exelon pricing forecasts and Synapse internal production cost and capacity expansion model . The Synapse capacity price projections are shown in Figure 13. Note that the x-axis labels each delivery year. In recent years, prices in the COMED locational delivery area have been higher than prices in the broader PJM regional transmission organization (RTO) due to import constraints into the COMED locational delivery area. Going into the 2022–2023 delivery year, we project that prices in the COMED zone will no longer separate from the PJM RTO prices due to an increase in transmission capability, a decrease in the load forecast, and the availability of new supply resources in the locational delivery area. 39 Jackson Generation: https://jacksongeneration.com/ and CPV Three Rivers Energy Center: https://www.cpv.com/our- projects/cpv-three-rivers/. 40 The Exelon energy prices also are at the bus level; thus they are generally lower than the COMED zone price presented in the figure. Synapse’s Monte Carlo analysis adjusts for the bus price at each plant. Synapse Energy Economics, Inc. Exelon Illinois Nuclear Fleet Audit 22
Redacted Version

This is likely to cause a decline in capacity prices in the near term. In the longer term, we expect PJM
RTO/ COMED capacity prices to slowly rise.

Figure 13. Historical and Synapse Capacity Price Forecasts for PJM-COMED and PJM RTO by Delivery Year

Source: Exelon pricing forecasts and Synapse internal production cost and capacity expansion model .

In addition to the Baseline Scenario, Synapse modeled a Carbon Price Scenario to use as an input to the
Monte Carlo analysis that was conducted as an alternative to the Baseline Scenario. Figure 14 and Figure
15 below show the comparison of the energy and capacity prices in the PJM-COMED regions between
the Baseline Scenario and the Carbon Price Scenario. The key drivers behind the energy prices for both
scenarios remain the same, however the scenario with a carbon price implemented in Illinois starting in
2023 results in the higher clearing prices within the zone. For further details on the carbon pricing
modeling assumptions, please refer to modeling assumptions in Appendix E.

Synapse Energy Economics, Inc.                                                        Exelon Illinois Nuclear Fleet Audit   23
You can also read