Bacterial degradation activity in the eastern tropical South Pacific oxygen minimum zone - Biogeosciences
←
→
Page content transcription
If your browser does not render page correctly, please read the page content below
Biogeosciences, 17, 215–230, 2020
https://doi.org/10.5194/bg-17-215-2020
© Author(s) 2020. This work is distributed under
the Creative Commons Attribution 4.0 License.

Bacterial degradation activity in the eastern tropical South Pacific
oxygen minimum zone
Marie Maßmig, Jan Lüdke, Gerd Krahmann, and Anja Engel
GEOMAR Helmholtz Centre for Ocean Research Kiel, Düsternbrooker Weg 20, 24105 Kiel, Germany

Correspondence: Anja Engel (aengel@geomar.de)

Received: 13 June 2019 – Discussion started: 17 June 2019
Revised: 24 November 2019 – Accepted: 1 December 2019 – Published: 17 January 2020

Abstract. Oxygen minimum zones (OMZs) show dis-                  that microbial degradation of DOM has a considerable share
tinct biogeochemical processes that relate to microorgan-        in sustaining the OMZ off Peru.
isms being able to thrive under low or even absent oxy-
gen. Microbial degradation of organic matter is expected
to be reduced in OMZs, although quantitative evidence
is low. Here, we present heterotrophic bacterial produc-         1   Introduction
tion (3 H leucine incorporation), extracellular enzyme rates
(leucine aminopeptidase/β-glucosidase) and bacterial cell        In upwelling zones at eastern continental margins, oxygen
abundance for various in situ oxygen concentrations in           minimum zones (OMZs) with hypoxic (< 60 µmol O2 kg−1 ),
the water column, including the upper and lower oxy-             suboxic (< 5 µmol O2 kg−1 ) or even anoxic conditions oc-
cline, of the eastern tropical South Pacific off Peru. Bac-      cur (Gruber, 2011; Thamdrup et al., 2012; Tiano et al.,
terial heterotrophic activity in the suboxic core of the         2014). OMZs have expanded over the past years result-
OMZ (at in situ ≤ 5 µmol O2 kg−1 ) ranged from 0.3 to            ing in an ∼ 3.7 % increase in hypoxic waters at a depth
281 µmol C m−3 d−1 and was not significantly lower than          (200 dbar) between 1960 and 2008 (Stramma et al., 2010).
in waters of 5–60 µmol O2 kg−1 . Moreover, bacterial abun-       One of the largest anoxic water masses in the global ocean
dance in the OMZ and leucine aminopeptidase activity were        (2.4 × 10¹³ m3 ) is located in the eastern tropical South Pa-
significantly higher in suboxic waters compared to waters of     cific and includes the Peruvian upwelling system (Kämpf
5–60 µmol O2 kg−1 , suggesting no impairment of bacterial        and Chapman, 2016; Paulmier and Ruiz-Pino, 2009; Tham-
organic-matter degradation in the core of the OMZ. Never-        drup et al., 2012). There, nutrient-rich water is upwelled and
theless, high cell-specific bacterial production was observed    supports high rates of primary production and accumulation
in samples from oxyclines, and cell-specific extracellular       of organic matter. Biological degradation of organic matter
enzyme rates were especially high at the lower oxycline,         subsequently reduces oxygen below the surface mixed layer
corroborating earlier findings of highly active and distinct     (Kämpf and Chapman, 2016). As a consequence, and sup-
micro-aerobic bacterial communities. To assess the impact of     ported by sluggish ventilation of water masses, a perma-
bacterial degradation of dissolved organic matter (DOM) for      nent OMZ forms between 100 and 500 m depth, with up-
oxygen loss in the Peruvian OMZ, we compared diapycnal           per and lower boundaries, i.e., oxyclines, varying within sea-
fluxes of oxygen and dissolved organic carbon (DOC) and          sonal and inter-annual cycles (Czeschel et al., 2011; Graco
their microbial uptake within the upper 60 m of the water col-   et al., 2017; Kämpf and Chapman, 2016). In austral winter,
umn. Our data indicate low bacterial growth efficiencies of      upwelling and subsequently the nutrient supply to the sur-
1 %–21 % at the upper oxycline, resulting in a high bacterial    face waters increase (Bakund and Nelson, 1991; Echevin et
oxygen demand that can explain up to 33 % of the observed        al., 2008). However, chlorophyll a (Chl a) concentration is
average oxygen loss over depth. Our study therewith shows        highest in austral summer, with the seasonal amplitude be-
                                                                 ing stronger for surface- than for depth-averaged Chl a con-
                                                                 centrations (Echevin et al., 2008). In winter, phytoplankton

Published by Copernicus Publications on behalf of the European Geosciences Union.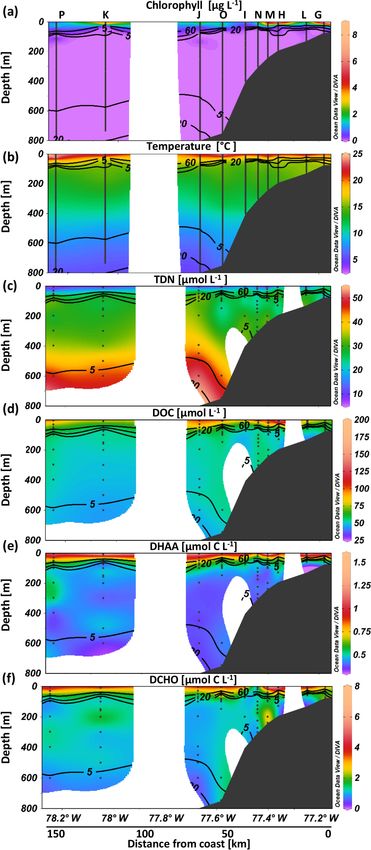
216                                                                         M. Maßmig et al.: Bacterial activity in the ESTP

growth is, next to iron, mainly limited by light due to the        cific waters off Chile, bacterial production and DOM decom-
deeper mixing, whereas in summer macronutrients can be-            position rates did not change in relation to oxygen concentra-
come a limiting factor (Echevin et al., 2008). Further, the        tions (Lee, 1992; Pantoja et al., 2009). Investigations of hy-
El Niño–Southern Oscillation may affect organic-matter cy-         drolysis rates as the initial step of organic-matter degradation
cling in the area since it affects the depth of the oxycline       may help to unravel possible adaptation strategies of bacte-
and therefore the extent of anaerobic processes in the up-         rial communities to suboxic and anoxic conditions (Hoppe et
per water column (Llanillo et al., 2013). During the year of       al., 2002). High extracellular enzyme rates might compensate
this study (2017), neither a strong La Niña nor a strong El        for a putative lower energy yield of anaerobic respiration and
Niño was detected (https://ggweather.com/enso/oni.htm, last        the subsequent biogeochemical effects. However, very few
access: 7 September 2019). However, in January, February           studies have investigated the effect of oxygen on hydrolytic
and March 2017, there was a strong coastal El Niño with en-        rates, so far. Hoppe et al. (1990) did not find differences be-
hanced warming (+1.5 ◦ C) of sea surface temperatures in the       tween oxic and anoxic incubations of Baltic Sea water. In the
eastern Pacific (Garreaud, 2018).                                  Cariaco Basin, hydrolytic rates were significantly higher in
   Within OMZs, enhanced vertical carbon export has been           oxic compared to anoxic water (Taylor et al., 2009). How-
observed (Devol and Hartnett, 2001; Roullier et al., 2014)         ever, this difference did not persist after rates were normal-
and explained by a potentially reduced remineralization of         ized to particulate organic-matter concentration. The depen-
organic matter in suboxic and anoxic waters. This is possibly      dence of hydrolysis rates on organic-matter concentrations
because microbes apply anaerobic respiratory pathways that         described by Taylor et al. (2009) suggests that productivity
yield less metabolic energy compared to aerobic respiration.       may play a role for extracellular enzymatic rates in oxygen-
For instance, denitrification or dissimilatory nitrate reduction   depleted systems. The Peruvian upwelling system displays
to ammonia (DNRA) result only in 99 % or 64 % of the en-           high amounts of labile organic matter (Loginova et al., 2019)
ergy (kJ) per oxidized carbon atom that is produced by aer-        at shallow oxyclines and thus allows for studying effects of
obic respiration (Lam and Kuypers, 2011). Additionally, the        low oxygen on extracellular enzyme rates under substrate-
energy yield available for the production of cell mass seems       replete conditions. In general, combined investigations of ex-
to be less than expected from the chemical equations (Strohm       tracellular enzyme rates, bacterial production (measured by
et al., 2007). Meanwhile, bacteria are mainly responsible for      3 H leucine incorporation) and carbon fluxes sampled at var-

the remineralization of organic matter into nutrients and car-     ious in situ oxygen concentrations are still lacking. These
bon dioxide (CO2 ) in the ocean (Azam et al., 1983). Thus,         data, however, are crucial to inform ocean biogeochemical
microbial activity and consequently organic-matter reminer-        models that aim at a quantification of CO2 uptake and nitro-
alization in suboxic and anoxic waters might be reduced, pos-      gen loss processes in oxygen-depleted areas.
sibly explaining the enhanced export of carbon. As a conse-           We studied bacterial degradation of organic matter in
quence, expanding OMZs could result in increased CO2 stor-         the OMZ off Peru during an extensive sampling campaign
age in the ocean.                                                  in the austral winter 2017. We determined rates of total
   During the degradation process, low molecular-weight            and cell-specific bacterial production (3 H leucine incorpo-
(LMW < 1 kDa) organic compounds can directly be taken up           ration) as well as of leucine aminopeptidase (LAPase) and
by bacteria (Azam et al., 1983; Weiss et al., 1991). How-          β-glucosidase (GLUCase). We estimate bacterial utilization
ever, in the ocean, bioavailable organic matter is commonly        of DOC supplied by diapycnal transport into the OMZ and
in the form of particulate organic matter or high molecular-       discuss the contribution of bacterial degradation activity to
weight (HMW) DOM (Benner and Amon, 2015). To ac-                   the formation and persistence of the OMZ off Peru.
cess this organic-matter pool, bacteria produce extracellu-
lar, substrate-specific enzymes that hydrolyze polymers into
LMW units (Hoppe et al., 2002). Taken up, organic mat-             2     Methods
ter is partly incorporated into bacterial biomass, or respired
to CO2 , which may escape to the atmosphere (Azam et               2.1    Study site and CTD (conductivity, temperature,
al., 1983). Rates of enzymatic organic-matter hydrolysis or               depth) measurements
bacterial production are controlled by the environment, i.e.,
temperature and pH, but can be actively regulated, e.g.,           Samples were taken during the cruises M136 and M138 on
in response to changing organic-matter supply and quality          the R/V METEOR off Peru in April and June 2017, respec-
(Boetius and Lochte, 1996; Grossart et al., 2006; Pantoja et       tively (Fig. 1). Seawater was sampled with 24 Niskin bottles
al., 2009; Piontek et al., 2014). However, the effect of oxy-      (10 L) on a general oceanic rosette system. At each station,
gen concentration, which dictates the respiratory pathway          5 to 11 depths were sampled between 3 and 800 m (Sup-
and thus energy gain, on bacterial production and the expres-      plement, Table S1). Oxygen concentrations, temperature and
sion of extracellular enzymes in aquatic systems is poorly         depth were measured with a Sea-Bird SBE 9-plus CTD sys-
understood. For instance, bacterial production was higher in       tem (Sea-Bird Electronics, Inc., USA). Oxygen concentra-
anoxic lake waters (Cole and Pace, 1995), whereas in the Pa-       tions at each depth were determined with an SBE 43 oxygen

Biogeosciences, 17, 215–230, 2020                                                        www.biogeosciences.net/17/215/2020/
M. Maßmig et al.: Bacterial activity in the ESTP 217
measurements is < 1.1 % and < 3.6 %, and the detection
limit is 1 and 2 µmol L−1 for DOC and TDN, respectively.
At each station replicate, 4 and 16 mL samples for the
analysis of dissolved amino acids (DHAAs) and dissolved
combined carbohydrates (DCHOs) were filtered through a
rinsed Acrodisc® 0.45 µm GHP membrane (Pall) and stored
in combusted vials (8 h, 500 ◦ C) at −20 ◦ C. Replicates were
only analyzed if the first sample analyses resulted in con-
spicuous data. The following DHAAs were analyzed: ala-
nine, arginine, glycine, leucine, phenylalanine, serine, threo-
nine, tyrosine, valine, aspartic acid + asparagine (co-eluted),
glutamine + glutamic acid (co-eluted), γ -aminobutyric acid
and isoleucine. DHAA samples were analyzed with a high-
performance liquid chromatograph (1260 HPLC system,
Aglient Technologies) using a C18 column (Phenomex Kine-
tex) after in-line ortho-phthaldialdehyde derivatization with
mercaptoethanol after Lindroth and Mopper (1979) and
Dittmar et al. (2009) with slight modifications after En-
gel and Galgani (2016). DCHO samples were desalted
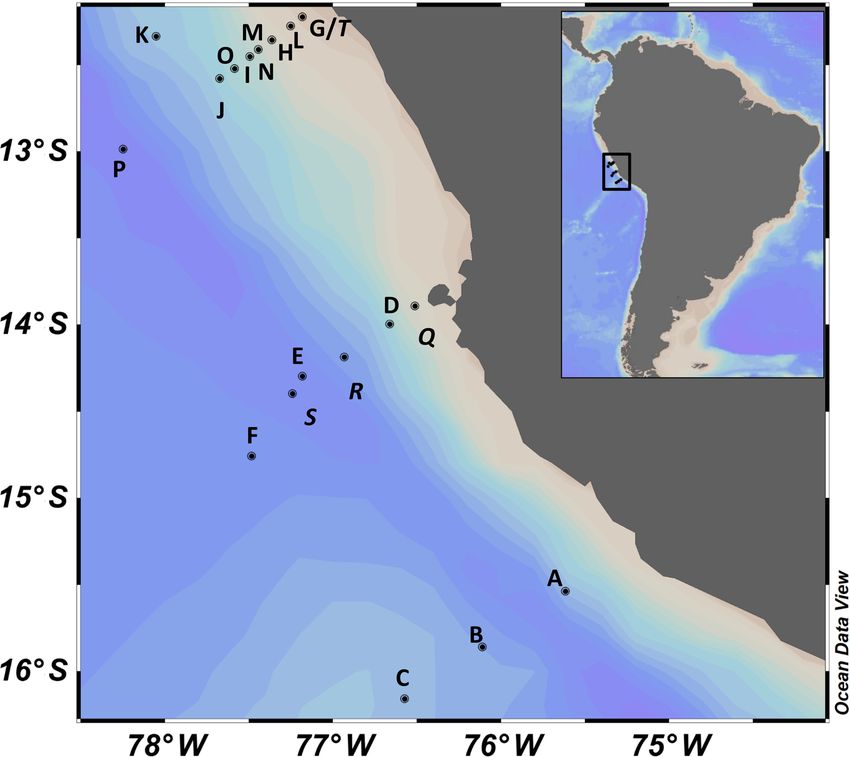
Figure 1. Station map. All presented stations in the eastern tropical
by membrane dialysis (1 kDa, Spectra Por) and analyzed
South Pacific off Peru sampled in 2017. For detailed information
about the stations, see Table S1. with a high-performance anion exchange chromatography
(HPAEC) (DIONEX ICS3000DC) after Engel and Hän-
del (2011). The detection limit of DHAA was 1.4 nmol L−1
sensor, calibrated with Winkler titrations (Winkler, 1888), depending on amino acid and 10 nmol L−1 for DCHO. The
resulting in an overall accuracy of 1.5 µmol kg−1 oxygen. precision was 2 % and 5 % for DHAA and DCHO, respec-
Chl a fluorescence was detected with a WETStar Chl a sen- tively.
sor (WET Labs, USA) and converted to µg L−1 using factors
given by the manufacturer (WET Labs). 2.3 Diapycnal fluxes of oxygen and dissolved organic
carbon
2.2 Dissolved organic carbon, total dissolved nitrogen,
In this study, we calculated DOC and oxygen loss rates
dissolved hydrolyzable amino acids and dissolved
(mmol m−3 d−1 ) from the changes in diapycnal fluxes over
high molecular-weight carbohydrates
depth. Therefore, oxygen and DOC profiles were used (sta-
DOC and total dissolved nitrogen (TDN) samples were taken tions G–T), excluding the mixed layer, defined by tempera-
at all stations, whereas the further analysis of DOC data ture deviating ≤ 0.2 ◦ C from the maximum, but excluding at
was limited to stations with compatible bacterial produc- least the upper 10 m. The diapycnal flux (8S ) was calculated
tion data and turbulence measurements (stations G–T). For for each CTD (Fischer et al., 2013; Schafstall et al., 2010) as-
DOC and TDN 20 mL of seawater was sampled in repli- suming a constant gradient between two sampled depths for
cates, whereas both replicates were only analyzed in the DOC and oxygen:
case of conspicuous data. Samples were filtered through a
8S = −Kρ ∇CS , (1)
syringe filter (0.45 µm glass microfiber GD/X membrane,
Whatman™) that was rinsed with 50 mL sample, into a where ∇CS is the gradient (mol m−4 ). The diapycnal diffu-
combusted glass ampoule (8 h, 500 ◦ C). Before sealing the sivity of mass (Kρ ) (m2 s−1 ) was assumed to be constant
ampoules, 20 µL of 30 % ultrapure hydrochloric acid were (10−3 m2 s−1 ), which is reasonable compared with turbu-
added. Samples were stored at 4 ◦ C in the dark for 3 months lence measurements by a freefalling microstructure probe
until analyses. DOC and TDN were analyzed using a TOC– (see the methods in the Supplement and Fig. 2a). DOC
VCSH with a TNM-1 detector (Shimadzu), applying a high- loss rates (∇8DOC ; mmol m−3 d−1 ) and oxygen loss rates
temperature catalytic oxidation method modified from Sug- (∇8DO ; mmol m−3 d−1 ) were assumed to be equal to the
imura and Suzuki (1988). The instrument was calibrated negative vertical divergence of 8S calculated from the mean
with potassium hydrogen phthalate standard solutions (0 to diapycnal flux profile, implying all other physical supply pro-
416.7 µmol C L−1 ) (Merck 109017) and a potassium nitrate cesses to be negligible.
standard solution (0–57.1 µmol N L−1 ) (Merck 105065). The
instrument blank was examined with reference seawater stan-
dards (Hansell laboratory RSMAS University of Miami).
The relative standard deviation (RSD) between repeated
www.biogeosciences.net/17/215/2020/ Biogeosciences, 17, 215–230, 2020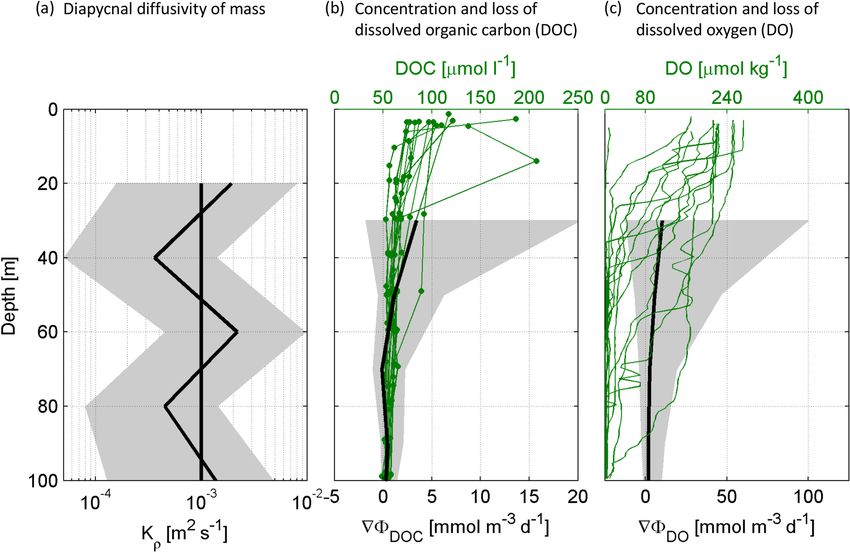
218                                                                          M. Maßmig et al.: Bacterial activity in the ESTP

2.4   Bacterial abundance                                           The decadal logarithm of in situ bacterial production
                                                                    (log10 BPinsitu ) was then calculated from the decadal loga-
Bacterial abundance was sampled in replicates at each sta-          rithm of measured bacterial production during incubations
tion, whereas replicates were only analyzed in exceptions.          (log10 BPincubation ). Therefore, we applied three different fac-
Abundance was determined by flow cytometry after Gasol              tors (F ) depending on in situ Chl a concentration as proposed
and Del Giorgio (2000) from 1.6 mL sample, fixed with               by López-Urrutia and Morán (2007), with F being −0.583,
0.75 µL 25 % glutaraldehyde on board and stored at −80 ◦ C          −0.5 and −0.42 (fgC cell−1 d−1 eV) for < 0.5, 0.5–2 and
for a maximum of 3 months until analyses. Prior to analy-           > 2 µg Chl a L−1 , respectively:
sis samples were thawed and 10 µL Flouresbrite® fluorescent
beads (Polyscience, Inc.) and 10 µL Sybr Green (Invitrogen)         log10 BPinsitu [fgC cell−1 d−1 ] =
(final concentration: 1× of the 1000× Sybr Green concen-
                                                                      log10 BPincubation [fgC cell−1 d−1 ]
trate) were added to 400 µL sample. Cells were counted on a
FACS Calibur (Becton Dickinson), calibrated with TruCount              + δT [eV−1 ] × F [fgC cell−1 d−1 eV].                     (3)
Beads™ (BD) with a measurement error of 2 % RSD.
                                                                    The text, figures, equations and statistical results always
2.5   Bacterial production, oxygen demand and growth                refer to temperature-corrected in situ bacterial production.
      efficiency                                                    Temperature-corrected bacterial production and original bac-
                                                                    terial production measured during incubation can be com-
For bacterial production, the incorporation of radioac-             pared in Table S2.
tive labeled leucine (3 H) (specific activity 100 Ci mmol−1 ,          The bacterial oxygen demand (BOD; mmol O2 m−3 d−1 )
Biotrend) was measured (Kirchman et al., 1985; Smith and            is the amount of oxygen needed to fully oxygenize or-
Azam, 1992) at all depths of stations G–T as replicates.            ganic carbon that has been taken up and not transformed
For this, the radiotracer at a saturating final concentration       into biomass by bacterial production (mmol C m−3 d−1 ). The
of 20 nmol L−1 was added to 1.5 mL of sample and in-                BOD was calculated as the difference between the estimated
cubated for 3 h in the dark at 13 ◦ C. Controls were poi-           bacterial DOC uptake and the bacterial production applying
soned with trichloracetic acid. Samples were measured with          a respiratory quotient (cf) of 1 (Eq. 4) (Del Giorgio and Cole,
a liquid scintillation counter (Hidex 300 SL, TriathalerTM,         1998).
FCI). Samples taken at in situ oxygen concentrations of
< 5 µmol kg−1 were incubated under anoxic conditions by             BOD = (DOC uptake − bacterial production) × cf               (4)
gentle bubbling with gas (0.13 % CO2 in pure N2 ). Samples
from oxic waters were incubated with head space, without            The bacterial DOC uptake was calculated under two differ-
bubbling. All samples were shaken thoroughly in between;            ent assumptions: (i) the DOC uptake by bacteria equals the
therefore, the bubbling of just one treatment would not have        DOC loss rate over depth or (ii) the bacterial growth ef-
any effect. 3 H-leucine uptake was converted to carbon units        ficiency (BGE) follows the established temperature depen-
applying a conversion factor of 1.5 kg C mol−1 leucine (Si-         dence (BGE = 0.374[±0.04] − 0.0104[±0.002]T , ◦ C), re-
mon and Azam, 1989). An analytical error of 5.2 % RSD               sulting in a BGE between 0.1 and 0.3 in the depth range of
was estimated with triplicate calibrations. Samples with an         10–60 m and an in situ temperature of 14 to 19 ◦ C (Rivkin
SD (standard deviation) > 30 % between replicates were ex-          and Legendre, 2001), and it can be used to estimate the bac-
cluded.                                                             terial DOC uptake from bacterial production (Eq. 5).
   The incubation of samples at a constant temperature of
                                                                                               bacterial production
13 ◦ C resulted in deviations of max. 11 ◦ C between incuba-        bacterial DOC uptake =                                       (5)
tion (Tincubation ) and in situ temperatures (Tinsitu ). In order                                      BGE
to estimate in situ bacterial production from measured bac-         2.6   Extracellular enzyme rates
terial production during incubations, measured temperature
differences were taken into account following the approach          Potential hydrolytic rates of LAPase and GLUCase were de-
of López-Urrutia and Morán (2007). First, the temperature           termined with fluorescent substrate analogs (Hoppe, 1983).
difference between Tinsitu and Tincubation (δT ) was computed       L-leucine-7-amido-4-methylcoumarin (Sigma Aldrich) and
in electron volt (eV−1 ), after Tinsitu and Tincubation (K) had     4-methylumbelliferyl-β-D-glucopyranoside (Acros Organ-
been multiplied with the Boltzmann’s constant k(8.62 ×              ics) were added in final concentrations of 1, 5, 10, 20, 50,
10−5 eV K−1 ):                                                      80, 100 and 200 µmol L−1 in black 69 well plates (Costar)
                                                                    and kept frozen for at most 1 d until replicates of 200 µL sam-
                              1                                     ple were added. After 0 and 12 h of incubation at 13 ◦ C in the
δT [eV−1 ] =
              Tincubation [K] × k [eV K−1 ]                         dark, fluorescence was measured with a plate reader fluorom-
                           1                                        eter (FLUOstar Optima, BMG labtech) (excitation: 355 nm;
            −                               .                (2)    emission: 460 nm). An error of 2 % RSD was defined using
              Tinsitu [K] x k [eV K−1 ]

Biogeosciences, 17, 215–230, 2020                                                         www.biogeosciences.net/17/215/2020/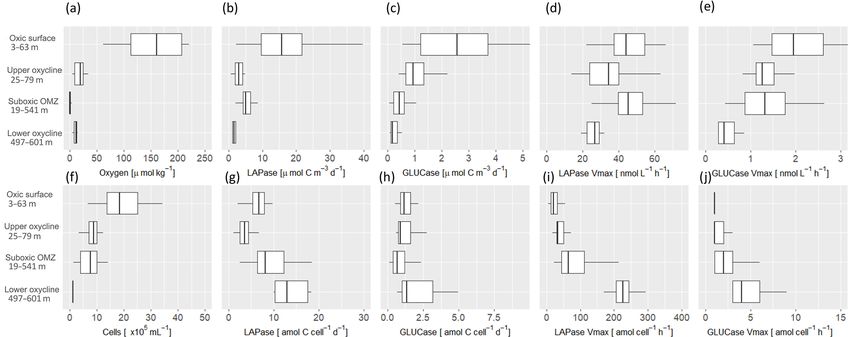
M. Maßmig et al.: Bacterial activity in the ESTP                                                                                      219

the calibration with triplicates. Blanks with MilliQ were per-    Under the assumption that the increase in rates with tem-
formed to exclude an increase in substrate decay over time.       perature was linear, measured enzyme rates were adapted
   Samples were collected in replicates (n = 2) at stations       to in situ temperature, with EERinsitu (nmol L−1 h−1 ) and
A–K and incubated directly after sampling under oxygen            EERincubation being the in situ extracellular enzyme rates and
conditions resembling in situ oxygen conditions. For sam-         extracellular enzyme rates during incubation, respectively:
ples > 5 µmol in situ O2 kg−1 incubations were conducted
under atmospheric oxygen conditions. Samples < 5 µmol in          δT [◦ C] = Tinsitu [◦ C] − Tincubation [◦ C],                       (7)
situ O2 kg−1 were incubated in a gastight incubator that had      EERinsitu [nmol L   −1 −1
                                                                                        h     ] = EERincubation [nmol L−1 −1
                                                                                                                          h       ]
two openings to fill and flush it with gas. For our experiment        + EERincubation [nmol L   −1 −1
                                                                                                   h         ◦ −1
                                                                                                        ]×F [ C               ◦
                                                                                                                    ] × δT [ C].      (8)
the incubator was flushed and filled with N2 to reduce oxy-
gen concentrations. Still, control measurements occasionally      The text, figures, equations and statistical results always re-
revealed oxygen concentrations of 8 to 40 µmol O2 kg−1 . Ad-      fer to the temperature-corrected in situ extracellular enzyme
ditionally, samples were in contact with oxygen during pipet-     rates. Temperature-corrected extracellular enzyme rates and
ting and measurement. To investigate the influence of the         original extracellular enzyme rates measured during incuba-
different incubation methods we additionally incubated sam-       tion can be compared in Table S2.
ples > 5 µmol in situ O2 kg−1 under reduced oxygen concen-
trations. On average incubations under reduced oxygen con-        2.7    Data analyses
centration yielded 2 %–27 % higher values than those incu-
bated under atmospheric oxygen conditions. However, the           Data were plotted with Ocean Data View 4.74 (Schlitzer,
observed trends over depth remained similar (see discussion       2016), MATLAB (8.3.0.532 (R2014a)) and R version 3.4.2
in the Supplement).                                               using the package ggplot2 (Wickham, 2009; R Core Team,
   Calibration     was      conducted      with     7-amino-4-    2017). Statistical significances between different regimes
methylcoumarin (2 nmol L−1 to 1 µmol L−1 ) (Sigma                 (see Table S2 for mean and SD within different regimes and
Aldrich) and 4-methylumbelliferone (Sigma Aldrich)                statistical results) were tested with a Wilcoxon test (W ) and
(16 nmol L−1 to 1 µmol L−1 ) in seawater at atmospheric           correlation with the Spearman rank correlation (S) in R ver-
oxygen concentrations and under N2 atmosphere.                    sion 3.4.2 (R Core Team, 2017) using the following R pack-
   Maximum reaction velocity (Vmax ) at saturating substrate      ages: FSA, car and multcomp (Ogle, 2017; Horthorn et al.,
concentrations was calculated using both replicates at once,      2008; Fox and Weisberg, 2011). For this, extracellular en-
with the simple ligand binding function in SigmaPlot™ 12.0        zyme data of stations A–K and bacterial production data of
(Systat Software Inc., San Jose, CA). Values for Vmax with        stations G–T were used, since not all parameters could be
an SD > 30 % were excluded from further analyses. The             sampled at all depth. Diapycnal fluxes of DOC and oxygen
degradation rate (δ) (µmol C m−3 d−1 ) of DHAA by LA-             were calculated with MATLAB (8.3.0.532 (R2014a)) and
Pase and DCHO by GLUCase was calculated after Piontek             the Toolbox Gibbs SeaWater (GSW) Oceanographic Toolbox
et al. (2014):                                                    (3.05) (McDougall and Barker, 2011).
                                                                     Samples were categorized into different oxygen regimes.
     hr · c                                                       Due to the sensitivities of oxygen measurements, we did
δ=          ,                                              (6)
     100                                                          not distinguish between anoxic and suboxic regimes but de-
where hr (% d−1 ) is the hydrolysis turnover at 103 µmol m−3      fined the suboxic “OMZ” oxygen regime by a threshold
substrate concentration and c is the carbon content of DHAA       ≤ 5 µmol O2 kg−1 (Gruber, 2011). We defined the oxycline
(µmol C m−3 ). Measurements of hr with an SD between du-          as one regime (> 5 to < 60 µmol O2 kg−1 ) including the up-
plicates of more than 30 % were excluded. The same pro-           per and lower oxycline or separated it into “low_hypoxic”
cedure was conducted with the carbon content of dissolved         (> 5 to < 20 µmol O2 kg−1 ) and “high_hypoxic” (> 20 to
hydrolyzable leucine, instead of DHAA, to account for varia-      < 60 µmol O2 kg−1 ) regimes, representing important thresh-
tions in leucine concentrations, which is the main amino acid     olds of oxygen concentrations for biological processes (Gru-
hydrolyzed by LAPase.                                             ber, 2011). Oxygen concentrations > 60 µmol O2 kg−1 were
   Similar to bacterial production, in situ extracellular en-     defined as “oxic”. Moreover, we partly differentiated be-
zyme rates were estimated based on extracellular enzyme           tween oxygen regimes situated above and below the OMZ
rates measured during incubation. To account for the differ-      (see Table S2 for results).
ences between in situ and incubation temperatures a correc-
tion factor (F ) was applied based on differences in extra-       3     Results
cellular enzyme rates after additional incubations at 22.4 ◦ C
next to the regular incubations at 13 ◦ C at five stations dur-   3.1    Biogeochemistry of the Peruvian OMZ
ing the cruises. The fluorescence signals at different sub-
strate concentrations increased on average by a factor of 0.05    During our two cruises to the Peruvian upwelling system
and 0.03 (◦ C−1 ) for GLUCase and LAPase, respectively.           (Fig. 1), the maximum Chl a concentration was higher and

www.biogeosciences.net/17/215/2020/                                                            Biogeosciences, 17, 215–230, 2020
220 M. Maßmig et al.: Bacterial activity in the ESTP
temperatures were warmer in April compared to June 2017, text) and original bacterial production measured during in-
probably representing seasonal variability. Chl a concentra- cubation (Table S2).
tion reached up to 11 and 4 µg L−1 within the upper 25 m Overall, bacterial abundance ranged from 1 to 49 ×
in April and June, respectively. Still, average Chl a concen- 105 cells mL−1 , with the highest abundance observed at the
trations at a depth < 10 m (M136: 3.1 ± 2.6 µg L−1 ; M138: surface and close to the sediment. Cell abundance in the oxy-
2.8±1.3 µg L−1 ) were not significantly different between the clines (1–16×105 cells mL−1 ) was significantly lower than in
two cruises. At depths > 50 m, Chl a concentration was gen- the OMZ core (1–25×105 cells mL−1 ) (Fig. 4c). A sharp de-
erally below the detection limit (Figs. 3a and S1 in the Sup- crease in bacterial abundance was observed below the OMZ.
plement). At a depth < 10 m the water was warmer in April Estimates for the in situ degradation rate of DHAA by
(21.3±1.6 ◦ C) than in June (17.6±0.6 ◦ C) (Figs. 3b, S1). An LAPase take into account the available concentrations of
oxygen concentration > 100 µmol kg−1 was observed in the DHAA and varied between 0.7 and 39.7 µmol C m−3 d−1 .
surface mixed layer. Oxygen decreased steeply with depth, LAPase degradation rates observed within the OMZ core
reached suboxic concentrations (< 5 µmol kg−1 ) at > 60 ± (5.5 ± 2.1 µmol C m−3 d−1 ) were significantly higher than in
24 m (Figs. 2c, 4a, 5a and S1) and fell below the detection the oxyclines (3.1 ± 2.3 µmol C m−3 d−1 ) (Fig. 5b). To ex-
of Winkler titration. For further analysis and within the text, clude an influence of changing DHAA composition over
in situ oxygen concentrations < 5 µmol O2 kg−1 are referred depth, LAPase activity was also calculated using in situ
to as “suboxic”. The shallowest depth with suboxic oxygen concentrations of dissolved hydrolyzable leucine instead of
concentrations was 14 m in April (station Q) and 29 m in total DHAA. Degradation rates of dissolved hydrolyzable
June (station D), probably reflecting that station Q was sit- leucine by LAPase (0.01–1.92 µmol C m−3 d−1 ) showed the
uated closer to the shore than station D. Oxygen increased same trend with significantly higher rates in suboxic wa-
again to up to 15 µmol kg−1 at > 500 m (Figs. 4a, 5a and S1). ters than in the oxyclines. Thus, differences in the molec-
TDN concentrations increased with depth from 18 ± 8 and ular composition of DHAA had no influence on spatial
22 ± 7 µmol L−1 within the upper 20 m in April and June, re- degradation patterns being higher in suboxic waters than
spectively, and reached a maximum of 54 µmol L−1 at 850 m in the upper oxycline. In contrast, degradation rates of
(Fig. 3c). DOC decreased with depth from 94 ± 37 µmol L−1 DCHO (> 1 kDa) were slightly reduced within the suboxic
and 69 ± 12 µmol L−1 in the upper 20 m in April and June, waters (0.69 ± 1.30 µmol C m−3 d−1 ) compared to the oxy-
respectively, to lowest values of 37 µmol L−1 at 850 m. The clines (1.1 ± 1.0 µmol C m−3 d−1 ) (Fig. 5c). Since degrada-
steepest gradient in DOC concentration was observed in the tion rates were calculated by multiplying enzyme rates and
upper 20–60 m (Figs. 2b and 3d) during both cruises. carbon concentrations of DCHO and DHAA at in situ depth,
differences in carbon concentrations are important for fur-
ther interpretation. In situ carbon concentrations of DHAA
3.2 Bacterial production and enzymatic activity
were similar between the OMZ core (0.53 ± 0.1 µmol C L−1 )
and the oxycline (0.57 ± 0.2 µmol C L−1 ). In contrast, in
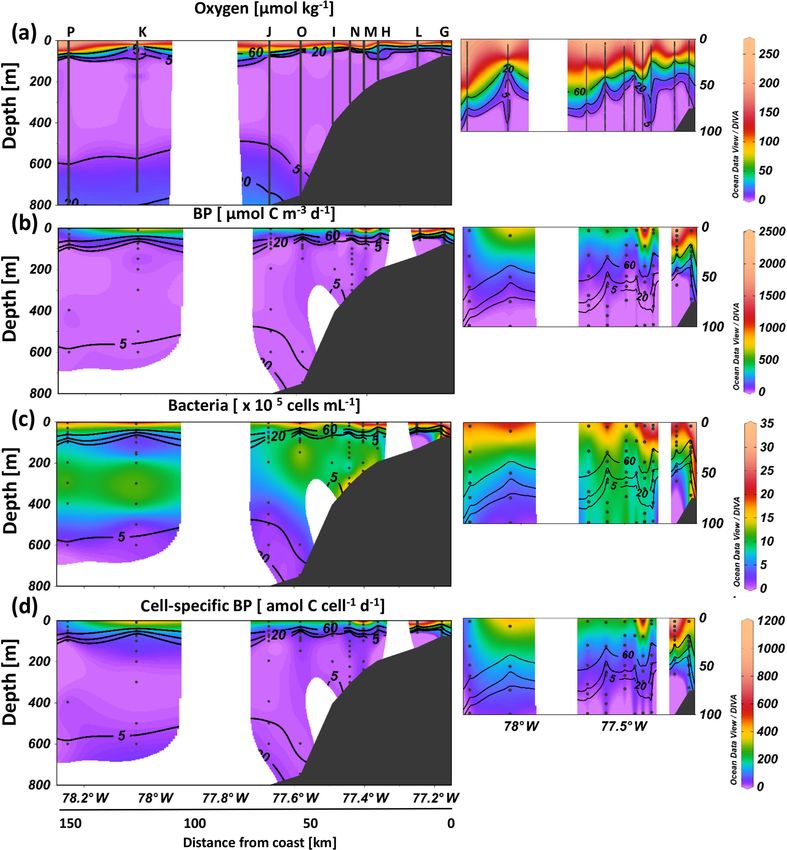
Bacterial production varied strongly throughout the study re- situ carbon concentrations of DCHO were reduced within
gion and ranged from 0.2 to 2404 µmol C m−3 d−1 (Fig. 4b), the OMZ core (1.3 ± 0.4 µmol C L−1 ) compared to the oxy-
decreased in general from surface to depth (except for the cline (1.5 ± 0.6 µmol C L−1 ) (Fig. 3e, f), suggesting that cal-
most coastal station), and showed significantly higher rates culated differences between degradation rates may be in-
in the oxygenated surface compared to the OMZ (Fig. 4b). fluenced by different carbon concentrations. Potential hy-
At the most coastal station (G) bacterial production remained drolytic rates at saturating substrate concentration (Vmax ) of
high near the bottom depth of 75 m (280 µmol C m−3 d−1 at LAPase ranged between 9 and 158 nmol L−1 h−1 and were ∼
72 m) (Fig. 4b). Bacterial production did not differ signifi- 30 times lower for GLUCase. LAPase Vmax was significantly
cantly between the oxyclines and the suboxic core waters, higher within the suboxic waters (50 ± 21 nmol L−1 h−1 )
neither offshore (suboxic: 0.3–127 µmol C m−3 d−1 ; oxy- compared to the oxycline (36 ± 20 nmol l−1 h−1 ), and GLU-
clines: 1–304 µmol C m−3 d−1 ) nor at the most coastal sta- Case Vmax was more similar within the suboxic waters
tions (G and T) (suboxic: 146–281 µmol C m−3 d−1 ) (oxy- (1.6 ± 1.5 nmol L−1 h−1 ) compared to the oxycline (1.2 ±
cline: 74–452 µmol C m−3 d−1 ) (see Table S2 for all sta- 0.6 nmol L−1 h−1 ) (Fig. 5d, e). Trends between oxygen
tistical results). Further, no significant correlation was ob- regimes were similar between temperature-corrected extra-
served between bacterial production and oxygen at in cellular enzyme rates (presented throughout the text) and
situ < 20 µmol O2 kg−1 concentration. Additionally, signifi- extracellular enzyme rates measured during incubation (Ta-
cantly lower bacterial production was observed within the ble S2).
lower oxycline (0.7–3.3 µmol C m−3 d−1 ) compared to the To investigate the physiological effects of suboxia, we
core OMZ (0.3–281 µmol C m−3 d−1 ) even though oxygen normalized bacterial production and enzymatic rates to
increased from < 5 to 15 µmol kg−1 (Fig. 4a, b). Trends be- cell abundance. Cell-specific production ranged between
tween oxygen regimes were similar between temperature- 1 and 1120 amol C cell−1 d−1 (Fig. 4d). In contrast to to-
corrected bacterial production (presented throughout the tal production, cell-specific production was significantly
Biogeosciences, 17, 215–230, 2020 www.biogeosciences.net/17/215/2020/M. Maßmig et al.: Bacterial activity in the ESTP 221
Figure 2. Measured concentrations and calculated proxies for the change in dissolved organic carbon (DOC) and dissolved oxygen (DO)
flux over depth for stations G–T: The average diapycnal diffusivity of mass (Kρ ) over depth with confidence interval and the constant Kρ
(1 × 10⁻³ m2 s−1 ) that was used for further calculations (a). Concentrations of DOC in the upper 100 m and the resulting change in DOC
flux over depth (∇8) (b). Concentrations of DO in the upper 100 m and the resulting change in DO flux over depth (∇8) (c).
higher at the oxyclines compared to suboxic core waters assumed that the loss of DOC over depth equalled the bacte-
at the offshore stations (suboxic: 1–102 µmol C m−3 d−1 ; rial uptake implying that the DOC is subsequently incorpo-
oxyclines: 6–219 µmol C m−3 d−1 ). At the most coastal sta- rated as bacterial biomass (bacterial production) or respired
tions (G and T) cell-specific rates were more similar be- to CO2 ; (Eq. 4) (ii) the amount of DOC taken up by bac-
tween suboxic waters and the oxyclines (suboxic: 129– teria was determined by the measured bacterial incorpora-
135 µmol C m−3 d−1 ) (oxycline: 72–284 µmol C m−3 d−1 ). tion of carbon (bacterial production) and a constant ratio be-
Further, cell-specific bacterial production was slightly cor- tween carbon that is taken up and carbon that is incorporated
related (Spearman rank correlation = 0.36) to oxygen con- as biomass (bacterial production) (Eq. 5) (see Sect. 2.5 for
centrations at ≤ 20 µmol O2 kg−1 , and as long as the most details). This ratio (BGE), was here assumed to be 10 % or
coastal stations (G and T) were included, this correla- 30 %, based on the empirical equation by Rivkin and Legen-
tion was significant (Fig. 4d, Table S2). A detailed view dre with an in situ temperature that varied between 14 and
at total- and cell-specific bacterial production in depen- 19 ◦ C (Rivkin and Legendre, 2001).
dence of in situ oxygen concentrations reveals a stronger For total average DOC loss (∇8DOC ), we calculated a
increase in cell-specific bacterial production, especially at range of 1.13–3.40 mmol C m−3 d−1 , with loss rates decreas-
< 10 µmol O2 kg−1 at different stations (Fig. S2). ing most strongly below the shallow mixed layer down to
Cell-specific degradation rates of DHAA increased with 40 m (Table 1, Fig. 2c). Following the first (i) assumption, all
depth and yielded significantly higher rates at the lower oxy- DOC that was lost over depth was taken up by bacteria and
cline compared to all shallower depths. Cell-specific LAPase the measured bacterial production represents the fraction of
Vmax , GLUCase Vmax and the GLUCase degradation rate DOC that was incorporated as biomass. Consequently, the re-
showed the same trends; however, for the latter this trend was maining DOC that has been taken up, in other words the dif-
not significant (Fig. 5g–j, Table S2) ference between DOC loss and bacterial production (0.03–
0.71 mmol C m−3 d−1 ), was respired to CO2 and represents
3.3 Bacterial contribution to the loss of dissolved the bacterial oxygen demand to account for the DOC loss
organic carbon and oxygen in the oxycline (BODε ) (0.98–3.36 mmol O2 m−3 d−1 ) (Eq. 4). Following
this calculation, the BGE would vary between 1 %–21 % and
We calculated the loss of oxygen and DOC during physi- 2 %–13 % in the depth range of MLD–40 and 40–60 m, re-
cal transport from below the mixed layer depth (MLD; 10– spectively, being on average almost constant over the two dif-
32 m) to 60 m based on observed changes in diapycnal fluxes ferent depth ranges (6.6 % and 5.0 %). (ii) Applying a BGE
(Eq. 1, Fig. 2b, c). We estimated the bacterial contribution in the range of 10 % and 30 % and the measured bacterial
to this loss using two different approaches (Table 1): (i) we
www.biogeosciences.net/17/215/2020/ Biogeosciences, 17, 215–230, 2020M. Maßmig et al.: Bacterial activity in the ESTP
www.biogeosciences.net/17/215/2020/
Table 1. Estimates of oxygen and DOC loss over depth based on in situ physical observations and bacterial rate measurements. Oxygen and DOC loss rates (mmol m−3 d−1 ) were
estimated from the change in oxygen and DOC fluxes over depth. The bacterial uptake of DOC (mmol m−3 d−1 ) was calculated from bacterial production (mmol m−3 d−1 ) based on a
growth efficiency of 10 % and 30 % (DOC uptakeϕ ). The bacterial oxygen demand (BOD, mmol m−3 d−1 ) and bacterial growth efficiency (BGEε , %) were calculated from bacterial
production and the assumption that DOC loss can be completely explained by bacterial uptake (BODε ) or estimated based on a BGE of 10 % and 30 % (BODϕ ).
Depth Oxygen loss DOC loss DOCuptakeϕ 10 DOC uptakeϕ 30 Bacterial production BODε BODϕ 10 BODϕ30 BGEε
avg avg avg min max avg min max avg min max avg min max avg min max avg min max avg min max
MLD–40 10.23 3.4 2.22 0.35 7.10 0.74 0.12 2.37 0.22 0.03 0.71 3.17 2.68 3.36 2.00 0.31 6.39 0.52 0.08 1.66 6.55 1.02 20.92
40–60 5.55 1.13 0.56 0.25 1.46 0.19 0.08 0.49 0.06 0.03 0.15 1.07 0.98 1.10 0.51 0.23 1.32 0.13 0.06 0.34 5.00 2.26 12.97
Figure 3. Biotic and abiotic conditions at selected stations ex-
emplary for the sampling conditions. Chlorophyll (a), tempera-
ture (b), total dissolved nitrogen (TDN) (c), dissolved organic car-
bon (DOC) (d), carbon content of dissolved hydrolyzable amino
acids (DHAA) (e) and carbon content of high molecular-weight dis-
solved carbohydrates (DCHO) (f) over depth at different stations
Biogeosciences, 17, 215–230, 2020
from on- to offshore off Peru.
222M. Maßmig et al.: Bacterial activity in the ESTP 223
Figure 4. Bacterial growth activity at different in situ oxygen concentrations from on- to offshore off Peru during April 2017 (M136). Oxygen
concentrations (a), total bacterial production (BP) (b), bacterial abundance (c) and cell-specific BP (d) over the upper 800 m depth with a
zoom in the upper 100 m (small plots).
production, the calculated bacterial DOC uptakeϕ was 0.08– trations. Moreover, no significant increase in bacterial pro-
7.10 mmol C m−3 d−1 . Hence, the respiration of DOC to CO2 duction was observed at the lower oxycline, when oxygen
accounted for a BODϕ of 0.06–6.39 mmol O2 m−3 d−1 (Ta- concentration increased again (Fig. 4b). Decreasing bacterial
ble 1). production with depth has also been observed for fully oxy-
genated regions in the Atlantic (Baltar et al., 2009) and the
equatorial Pacific (Kirchman et al., 1995) and has been ex-
4 Discussion plained by a decrease in the amount of bioavailable organic
matter over depth.
We investigated bacterial degradation of DOM by measur- The hypothesis of reduced bacterial degradation activity
ing bacterial production as an estimate for organic carbon within the OMZ also implies reduced extracellular enzyme
transformation into biomass as well as rates of extracellu- rates for the hydrolysis of organic matter. The extracellu-
lar hydrolytic enzymes to provide information on the initial lar enzyme rates of our study have to be interpreted care-
steps of organic-matter degradation (Hoppe et al., 2002). We fully since incubation was not fully anoxic and the remain-
expected reduced rates of organic-matter degradation within ing oxygen might have biased the results. Still, we assume
oxygen-depleted waters, since reduced bacterial degrada- that most extracellular enzymes were present at the time of
tion activity might explain enhanced carbon fluxes in sub- sampling and thus oxygen contamination during the incuba-
oxic and anoxic waters (Devol and Hartnett, 2001). How- tions did not strongly influence the rate measurements. In
ever, although bacterial production decreased with depth our study, neither GLUCase nor LAPase Vmax were reduced
(Fig. 4b), this decrease was not related to oxygen concen-
www.biogeosciences.net/17/215/2020/ Biogeosciences, 17, 215–230, 2020224 M. Maßmig et al.: Bacterial activity in the ESTP Figure 5. Extracellular enzyme rates at different in situ oxygen concentrations during April and June 2017 (M136, M138). Oxygen con- centrations (a), degradation rates of dissolved amino acids (DHAA) by leucine-aminopeptidase (LAPase) (b), degradation rates of high molecular-weight dissolved carbohydrates (DCHO) by β-glucosidase (GLUCase) (c), total potential LAPase rates (Vmax ) (d), GLUCase Vmax (e), cell abundance (f), cell-specific degradation rates DHAA by LAPase (g), cell-specific degradation rates of DCHO by GLUCase (h), cell-specific LAPase Vmax (i) and cell-specific GLUCase Vmax (j) at different oxygen regimes off Peru. within the suboxic waters compared to the oxyclines irre- degradation of amino-acid-containing organic matter in low- spective of incubation conditions (Figs. 5d, e, S3 and S4). oxygen waters. Indicators of protein decomposition, i.e., LA- Thus, our findings show no evidence for reduced organic- Pase Vmax and the degradation rate of DHAA by LAPase, matter degradation in suboxic waters and are in good agree- were more pronounced within the suboxic waters (Fig. 5b, ment with studies, which report similar bacterial degrada- d). Therefore, observed LAPase rates are in line with the hy- tion rates for oxic and suboxic waters (Cavan et al., 2017; pothesis of preferential degradation of nitrogen compounds Lee, 1992; Pantoja et al., 2009). Consequently, the hypoth- under suboxia. However, simultaneous rate measurements esis of enhanced carbon export in OMZ waters due to re- of protein hydrolysis, nitrate reduction (e.g., denitrification) duced organic-matter degradation seems fragile and alterna- and anammox are needed to prove an indirect stimulation of tive explanations for enhanced carbon export efficiency, e.g., anammox by protein hydrolysis via denitrification. A close reduced particle fragmentation due to zooplankton avoiding coupling between anammox and nitrate reducing bacteria has hypoxia (Cavan et al., 2017) may be more likely. Likewise, a previously been shown for wastewater treatments. There, ni- reduced degradation of particulate organic carbon in suboxic trate reducers directly take up organic matter excreted by the waters as is often assumed in global ocean biogeochemical anammox bacteria which in turn benefit from the released ni- models may have to be reconsidered (Ilyina et al., 2013). trite by respiratory nitrate reduction (Lawson et al., 2017). In Within OMZs dissolved nitrogen fuels processes such the Pacific, denitrifiers and anammox bacteria are separated as denitrification or anaerobic ammonium oxidation (anam- in space and time (Dalsgaard et al., 2012), potentially weak- mox) and is reduced to, e.g., dinitrogen gas that evades to ening a direct inter-dependency. the atmosphere. Current estimates result in 20 %–50 % of To investigate physiological effects of suboxia, we normal- the total oceanic nitrogen loss occurring in OMZs (Lam ized bacterial production and enzymatic rates to cell abun- and Kuypers, 2011). Meanwhile, a preferential degradation dance and found higher cell-specific bacterial production of amino-acid-containing organic matter in suboxic waters near the oxycline compared to suboxic waters and highest compared to oxic waters has been suggested (Van Mooy et cell-specific enzyme rates at the lower oxycline (Figs. 4d, al., 2002). The degradation of nitrogen compounds by het- 5g–j). Higher cell-specific bacterial production at oxic– erotrophic bacteria (e.g., denitrifiers) in suboxic waters en- anoxic interfaces in the water column has previously been ables the release of ammonia and nitrite and subsequently reported for the Baltic Sea (Brettar et al., 2012). Baltar et may support anammox, an autotrophic anaerobic pathway al. (2009) showed increasing cell-specific enzymatic rates (Babbin et al., 2014; Kalvelage et al., 2013; Lam and and decreasing cell-specific bacterial production, with in- Kuypers, 2011; Ward, 2013). This interaction between den- creasing depth in the subtropical Atlantic and related this pat- itrifiers and anammox bacteria could fuel the loss of nitro- tern to decreasing organic-matter lability. In our study, differ- gen to the atmosphere. Our data indeed showed enhanced ences in cell-specific bacterial production between suboxic Biogeosciences, 17, 215–230, 2020 www.biogeosciences.net/17/215/2020/
M. Maßmig et al.: Bacterial activity in the ESTP                                                                               225

waters and the oxycline did not persist at the most coastal           Heterotrophic bacteria are the main users of marine DOM
stations (G and T). This indicates the stimulation of bac-         (Azam et al., 1983; Carlson and Hansell, 2015) and respon-
terial activity, including anaerobic respiratory processes, by     sible for ∼ 79 % of total respiration in the Pacific Ocean (Del
the high input of labile organic matter. Therefore, our study      Giorgio et al., 2011), proposing that heterotrophic bacteria
suggests that a possible impairment of cell-specific bacterial     drive organic matter and oxygen cycling in the ocean and
production under suboxia is reduced by the supply of or-           significantly contribute to the formation of the OMZ. Un-
ganic matter. However, this hypothesis is restricted to a very     der the assumption that the calculated loss of DOC during
limited number of samples and should be tested in further          diapycnal transport (< 60 m) is caused solely by bacterial
studies. While labile organic matter is decreasing with depth      uptake and subtracting the amount of carbon channeled into
(e.g., Loginova et al., 2019), TDN (Fig. 3c), especially inor-     biomass production, our study verifies the importance of bac-
ganic nitrogen, is increasing with depth. Thus, high concen-       terial DOC degradation for the formation of the OMZ. We es-
trations of inorganic nitrogen at the lower oxycline are avail-    timated a BOD (0.98–3.36 mmol O2 m−3 d−1 ) that is in line
able for heterotrophic and chemoautotrophic energy gains.          with earlier respiration measurements in the upper oxycline
For instance, the co-occurrence of nitrate reduction, which        off Peru (Kalvelage et al., 2015) and represents 18 %–33 %
was still detected at 25 µmol O2 L−1 , and micro-aerobic res-      of the oxygen loss over depth, implying a rather low average
piration might have stimulated cell-specific production or the     BGE (6.5 % and 5.0 %) (Table 1). Calculating the bacterial
accumulation of especially active bacterial species (Kalve-        uptake of DOC from production rates and a more conser-
lage et al., 2011, 2015).                                          vative BGE between 10 % and 30 % as previously suggested
   The depth distribution of cell-specific and total bacte-        (Rivkin and Legendre, 2001) for the in situ temperature of 14
rial production was different (Figs. 4b, d and S2); cell-          to 19 ◦ C, 3 %–209 % of the DOC loss and 1 %–62 % of oxy-
specific production was significantly reduced in suboxic wa-       gen loss could be attributed to bacterial degradation of DOM.
ters, while total production was more similar in suboxic wa-       The first approach reveals an average BGE (6.5 % and 5.0 %)
ters compared to the oxycline. This suggests that lower cell-      that is still within the range of previous reports for upwelling
specific production was compensated by higher cell abun-           systems of the Atlantic (< 1 %–58 %) and northeastern Pa-
dance within the suboxic waters (Fig. 4c), resulting in an         cific (< 10 %) (Alonso-Sáez et al., 2007; Del Giorgio et al.,
overall unhampered bacterial organic-matter cycling in the         2011). The high variability in BGE is a topic of ongoing re-
OMZ core. One reason for the accumulation of cells within          search. Until now 54 % of the variability could be explained
the OMZ might be reduced predation, suggesting the OMZ             by variations in temperature (Rivkin and Legendre, 2001).
core as an ecological niche for slowly growing bacteria.           Our data suggest that oxygen availability may be another
Reduced grazing by bacterivores thus preserves bacterial           control of BGE leading to rather low BGE in low-oxygen
biomass in suboxic waters from entering into the food chain.       waters. This is especially indicated by a low but rather con-
This way of bacterial biomass preservation has been sug-           stant average BGE (6.5 % and 5.0 %), which we estimated
gested as a possible explanation for enhanced carbon preser-       for the water column down to 60 m depth under the assump-
vation in anoxic sediments by Lee (1992) and may also ex-          tion that all DOC that is lost over depth can be attributed to
plain our observations for the anoxic water column.                bacterial uptake. A low BGE might be explained by a bacte-
   In general, bacterial community composition in OMZs has         rial community that has higher energetic demands but in re-
been shown to be strongly impacted by oxygen. In the OMZ           turn is adapted to variable oxygen conditions. Additionally,
near the shelf off Chile, Arctic96BD-19 and SUP05 domi-            the BGE decreases with an increasing carbon-to-nitrogen ra-
nate heterotrophic and autotrophic groups in hypoxic waters        tio of the available substrate (Goldman et al., 1987). In the
(Aldunate et al., 2018). Next to the appearance of autotrophic     OMZ off Peru the ratio between DOC and dissolved organic
bacteria that are related to sulfur (e.g., SUP05) or nitrogen      nitrogen is frequently high (∼ 12 to 16) (Loginova et al.,
cycling (e.g., Planctomycetes), bacteria related to cycling of     2019) and might further contribute to the low BGE. High
complex carbohydrates have also been discovered in OMZs            respiration rates induced by bacterial DOC degradation con-
(Callbeck et al., 2018; Galán et al., 2009; Thrash et al., 2017)   tribute to sustaining the OMZ, besides oxygen consumption
and may explain the unaltered high potential (Vmax ) of the        by bacteria that hydrolyze and degrade particulate organic
extracellular enzymes GLUCase and heterotrophic bacterial          matter (Cavan et al., 2017). Another, but likely minor con-
production in suboxic waters in our study (Figs. 5e, 4b). For      tribution to overall respiration is made by zooplankton and
instance, SAR406, SAR202, ACD39 and PAUC34f have the               higher trophic levels (e.g., Kiko et al., 2016). Additionally,
genetic potential for the turnover of complex carbohydrates        physical processes such as an intrusion of oxygen-depleted
and anaerobic respiratory processes in the Gulf of Mexico          waters by eddies, upwelling or advection may add to the oxy-
(Thrash et al., 2017). Consequently, our findings of active        gen and DOC loss over depth (Brandt et al., 2015; Llanillo et
bacterial degradation of DOM are supported by molecular            al., 2018; Steinfeldt et al., 2015).
biological studies. Still, simultaneous measurements of bac-          Uncertainties of our assumption that the loss of DOC is
terial degradation and production have to be combined with         caused solely by bacterial uptake include other processes po-
molecular analysis in future studies off Peru.                     tentially contributing to DOC removal but not taken into con-

www.biogeosciences.net/17/215/2020/                                                          Biogeosciences, 17, 215–230, 2020
226                                                                          M. Maßmig et al.: Bacterial activity in the ESTP

sideration here, like DOC adsorption onto particles, DOC up-        try of organic matter suggest a general dominance of den-
take by eukaryotic cells or the physical coagulation of DOC         itrification in relation to anammox and relate variable ra-
into particles, e.g., by the formation of gel-like particles such   tios between these two processes to the stoichiometry of lo-
as transparent exopolymer particles and Coomassie stain-            cally available organic matter (Babbin et al., 2014; Ward,
able particles (Carlson and Hansell, 2015; Engel et al., 2004,      2013). Our study points towards a widespread occurrence
2005). Moreover, temporal variations in diapycnal fluxes            of heterotrophic anaerobic processes such as denitrification
may be large, as indicated by the confidence interval of so-        or sulfate reduction (Canfield et al., 2010) in the Peruvian
lute fluxes (Fig. 2b, c) during this study and by 2 to 10 times     OMZ, since the method applied here for measuring bacte-
lower DOC and oxygen loss rates during other seasons (Logi-         rial production is restricted to heterotrophs. Our rates for
nova et al., 2019). However, our study is the first combin-         bacterial production within the suboxic waters averaged to
ing physical and microbial rate measurements and gives esti-        37 µmol C m−3 d−1 (0.3–281 µmol C m−3 d−1 ).
mates for carbon and oxygen losses in the upwelling system             We compared bacterial production, i.e., rates of carbon in-
off Peru and can help improve current biogeochemical mod-           corporation, with denitrification rates previously reported for
els by constraining bacterial DOM degradation.                      the South Pacific. Therefore, we converted 1 mol of reduced
   Loginova et al. (2019) conducted similar physical rate           nitrogen that was measured by Dalsgaard et al. (2012) and
measurements in the same study area with ∼ 2 and ∼ 10               Kalvelage et al. (2013) to 1.25 mol of oxidized carbon after
times lower DOC and oxygen loss in the upper ∼ 40 m com-            the reaction equation given by Lam and Kuypers (2011). This
pared to our study. Differences in loss rates were mainly           calculation indicates that on average ≤ 19 µmol C m−3 d−1
caused by a ∼ 10 times higher diapycnal diffusivity of mass         are oxidized by denitrifying bacteria in the eastern tropical
in our study. This may have been caused by weaker stratifica-       Pacific (Dalsgaard et al., 2012; Kalvelage et al., 2013).
tion in the upper 100 m depth or differences in the turbulence         The amount of carbon oxidized by denitrification based
conditions. Loginova et al. (2019) estimated a contribution         on the studies of Dalsgaard et al. (2012) and Kalvelage et
of bacterial DOM degradation to oxygen loss (38 %) based            al. (2013) can be converted into bacterial production ap-
on the loss of labile DOC (DHAA and DCHO). This value               plying a BGE. The average temperature-dependent BGE
agrees well with our estimates of 18 %–33 % of total oxygen         was 20 %. A BGE of 20 % agrees well with other stud-
loss, calculated under the assumption that DOC loss is solely       ies (Del Giorgio and Cole, 1998). Assuming a BGE of
attributed to bacterial degradation. However, the comparison        20 %, the denitrification rates of Dalsgaard et al. (2012)
of DOC and oxygen loss within each study revealed differ-           and Kalvelage et al. (2013) suggest a bacterial produc-
ent patterns. Loginova et al. (2019) found a loss of DOC that       tion of ≤ 5 µmol C m−3 d−1 , equivalent to only about 14 %
clearly exceeded the loss of oxygen within the upper ∼ 40 m.        of total average heterotrophic bacterial production in sub-
Hence, the respiration of DOC could fully explain the ob-           oxic waters determined in our study. For the sum of
served oxygen loss in that study. In our study, more oxygen         anaerobic carbon oxidation rates including denitrification,
than DOC was lost over depth (Table 1). This loss of oxygen         DNRA and simple nitrate reduction, 109 µmol C m−3 d−1
needs additional explanations such as the degradation of par-       (6–515 µmol C m−3 d−1 ) may be expected for the Peruvian
ticulate organic matter and physical mixing processes. One          shelf, with the reduction of nitrate to nitrite representing
reason for the observed differences between the two studies         the largest proportion (2–505 µmol C−1 m−3 d−1 ), based on
that have been conducted in the same region might be sea-           the relative abundance of the different N-functional genes
sonality. The study by Loginova et al. (2019) took place in         (Kalvelage et al., 2013). These anaerobic respiration mea-
austral summer, whereas our data were gained during aus-            surements are equivalent to a bacterial production of ∼
tral winter. Water temperature was quite similar during both        27 µmol C m−3 d−1 (1–129 µmol C m−3 d−1 ) and are thus
studies, probably due to the coastal El Niño 1 month before         lower than our direct measurements of bacterial produc-
our sampling campaign (Garreaud, 2018). Still, the study            tion rates. Moreover, the reduction of nitrate, could not be
by Loginova et al. (2019) included more stations with high          detected at every depth and incubation experiments partly
Chl a concentrations (∼ 8 µg L−1 ), as typical for the austral      showed huge variations over depth (Kalvelage et al., 2013),
summer, indicating a more productive system with more la-           whereas we were able to measure bacterial production in
bile DOM (DCHO and DHAA). The prevalence of more la-                every sample. The same calculation can be repeated as-
bile DOM might explain the higher contribution of microbial         suming a BGE of 6 %, which is the average BGE within
DOM respiration to oxygen loss in the study by Loginova et          this study based on DOC loss and bacterial production. As-
al. (2019).                                                         suming a BGE of 6 %, the estimated 109 µmol C m−3 d−1
   In oxygen-depleted waters of the Peruvian upwelling sys-         that are respired by anaerobic carbon oxidation (Kalvelage
tem, the chemoautotrophic process of anammox has been               et al., 2013) would represent 94 % of the carbon uptake.
assumed to dominate anaerobic nitrogen cycling (Kalvelage           Consequently, 7 µmol C m−3 d−1 , i.e., 6 % of the carbon up-
et al., 2013), with lower but more constant rates compared          take, is incorporated into the bacterial biomass. A bacte-
to more sporadically occurring heterotrophic denitrification        rial biomass production of 7 µmol C m−3 d−1 is even lower
(Dalsgaard et al., 2012). Studies based on the stoichiome-          than the bacterial production of 27 µmol C m−3 d−1 , based

Biogeosciences, 17, 215–230, 2020                                                         www.biogeosciences.net/17/215/2020/
You can also read


