The stress-sensing domain of activated IRE1α forms helical filaments in narrow ER membrane tubes
←
→
Page content transcription
If your browser does not render page correctly, please read the page content below
bioRxiv preprint doi: https://doi.org/10.1101/2021.02.24.432779; this version posted February 24, 2021. The copyright holder for this preprint
(which was not certified by peer review) is the author/funder, who has granted bioRxiv a license to display the preprint in perpetuity. It is made
                                                available under aCC-BY 4.0 International license.

            The stress-sensing domain of activated IRE1α forms helical filaments in
                                 narrow ER membrane tubes
               Stephen D. Carter1†#, Ngoc-Han Tran2†#, Ann De Mazière3, Avi Ashkenazi4, Judith
                             Klumperman3, Grant J. Jensen1,5*#, Peter Walter2,6*#

     1
       Division of Biology and Biological Engineering, California Institute of Technology, Pasadena, CA, USA; 2
     Department of Biochemistry and Biophysics, University of California, San Francisco, CA, USA; 3 Section Cell
     Biology, Center for Molecular Medicine, University Medical Center Utrecht, Utrecht, Netherlands; 4 Cancer
     Immunology, Genentech, Inc., South San Francisco, CA, USA; 5 Department of Chemistry & Biochemistry, Brigham
     Young University, Provo, UT, USA; 6 Howard Hughes Medical Institute, University of California at San Francisco,
     San Francisco, CA, USA
     *
         Correspondence to: G.J.J.: jensen@caltech.edu; P.W.: peter@walterlab.ucsf.edu
     †
         Authors contributed equally
     #
      In the spirit of equal contribution, the order of co-first and co-corresponding authors will be
     switched for publication. Author order was determined by coin flip.

     The signaling network of the unfolded protein response                                      demand (2). The three branches
     (UPR) adjusts the protein folding capacity of the                                           of the metazoan UPR, named
     endoplasmic reticulum (ER) according to need. The most                                      after their pivotal ER-resident
     conserved UPR sensor, IRE1α, spans the ER membrane                                          sensors (IRE1 (3, 4), PERK, and
     and activates through oligomerization. IRE1α oligomers                                      ATF6), activate in response to
     accumulate in dynamic foci. We determined the in-situ                                       disruptions in protein folding
     structure of IRE1α foci by cryogenic correlated light and                                   homeostasis, characterized by
     electron microscopy (cryo-CLEM), combined with electron                                     an accumulation of unfolded
     cryo-tomography (cryo-ET) and complementary immuno-                                         proteins within the ER lumen.
     electron microscopy. IRE1α oligomers localize to a network                                  This condition, known as ER
     of narrow anastomosing ER tubes (diameter ~28 nm) with                                      stress,    triggers    corrective
     complex branching. The lumen of the tubes contains                                          cellular measures or, if the
     protein filaments, likely composed of linear arrays of                                      defect cannot be corrected,
     IRE1α lumenal domain dimers, arranged in two                                                apoptotic cell death (5).
     intertwined, left-handed helices. Our findings define a                                     The life/death decision made
     previously unrecognized ER subdomain and suggest                                            after UPR activation involves a
     positive feedback in IRE1 signaling.                                                        molecular timer in which IRE1
                                                                                                 activation initially provides
     Introduction                                                                                cytoprotective outputs but then
                                                                                                 attenuates      even      under
     The vast majority of secreted and transmembrane proteins                                    conditions where ER stress
     mature in the endoplasmic reticulum (ER), which provides a                                  remains unmitigated (6). IRE1
     specialized folding compartment with unique biochemical and                                 attenuation thus predisposes the
     proteomic characteristics (1). To ensure proper folding, a                                  cell to apoptosis as a
     network of quality control pathways, collectively termed the                                consequence of persistent,
     unfolded protein response (UPR), continuously monitors ER                                   unopposed PERK signaling (7,
     folding status and adjusts its capacity according to cellular                               8). Therefore, IRE1 signaling in

                                                                                                                                            1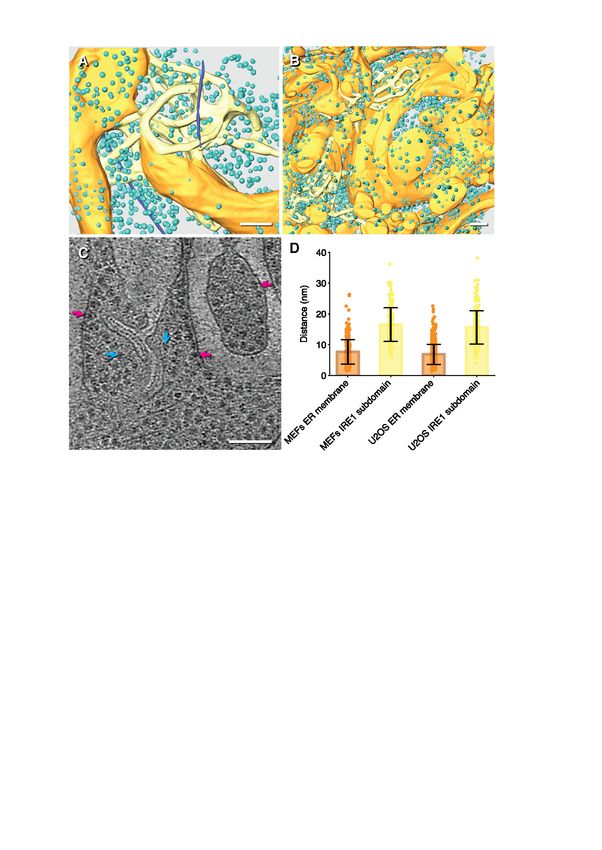
bioRxiv preprint doi: https://doi.org/10.1101/2021.02.24.432779; this version posted February 24, 2021. The copyright holder for this preprint
(which was not certified by peer review) is the author/funder, who has granted bioRxiv a license to display the preprint in perpetuity. It is made
                                                available under aCC-BY 4.0 International license.

     particular and UPR signaling in general sit at a                      crystal structures (23-25). Both oligomerization
     junction of cellular homeostasis and cell death.                      of the kinase/RNase domains in vitro and
     Maladaptive UPR signaling is a hallmark of                            formation of foci in cells correlate with high
     many diseases, including cancer, diabetes, and                        enzymatic activity (25).
     neurodegeneration (9).                                                We and others have shown that IRE1α foci are
     Mammalian IRE1 has two paralogs (10), IRE1α                           entities with complex morphology and dynamic
     and IRE1β. IRE1α is the major isoform                                 behaviors (26, 27). Foci comprise two distinct
     expressed in most cell types. It is an ER-                            populations of IRE1α (27). A small fraction of
     transmembrane protein bearing an ER-stress                            clustered molecules rapidly exchanges with the
     sensing domain on the ER lumenal side and                             pool of dispersed IRE1α in the ER membrane,
     kinase/ribonuclease (RNase) effector domains                          while the majority are diffusionally constrained
     on the cytosolic side (3, 4, 11). IRE1α’s                             to a particular cluster and remain there until that
     lumenal domain (LD) is bound by the ER-                               cluster’s eventual dissolution. When foci
     lumenal HSP70-like chaperone BiP, which                               disappear at late timepoints of stress, their
     dissociates upon ER stress (12). IRE1α-LD then                        constituent IRE1α molecules are efficiently
     binds directly to accumulated unfolded                                recycled back into the ER network rather than
     proteins, which triggers its oligomerization (13,                     degraded. The foci are therefore not phase-
     14). Oligomerization of the LD in turn drives                         separated liquid condensates but resemble
     the juxtaposition of IRE1α’s cytosolic                                higher-order arrangements whose assembly and
     kinase/RNase domains, which activate after                            disassembly are likely regulated by distinct
     trans-autophosphorylation (15). Lipid stress                          mechanisms.        However,     the    molecular
     can likewise induce IRE1 activation through                           principles that explain IRE1α’s complex
     oligomerization, bypassing a need for the LD                          dynamics during ER stress and the functional
     (16, 17). IRE1α’s activated RNase domain                              consequences of its different assembly states
     initiates the non-conventional splicing of its                        remain a mystery.
     substrate XBP1 mRNA (18). Spliced XBP1
     mRNA is translated to produce the potent                              Results
     transcription factor XBP1s that upregulates
     hundreds of genes to restore ER homeostasis. A                        IRE1α oligomers localize to specialized ER
     second consequence of IRE1α RNase                                     regions with complex topology
     activation, termed RIDD (regulated IRE1-
     dependent mRNA decay), is the selective                               Leveraging recent advances in in situ structural
     degradation of a spectrum of ER-bound                                 determination of protein complexes in their native
     mRNAs (19). RIDD reduces the protein folding                          cellular environment (28, 29), we applied cryo-
     burden in the ER and initiates other protective                       CLEM to determine the ultrastructure of IRE1α
     effects (7, 20), thus synergizing with XBP1                           foci in mammalian cells. To this end, we
     mRNA splicing to alleviate ER stress and                              constructed stable cell lines that express
     preserve cell viability.                                              fluorescently tagged human IRE1α under control
                                                                           of an inducible promoter (14, 27). We grew cells
     Upon UPR induction, a fraction of IRE1
                                                                           directly on fibronectin- or collagen-coated gold
     molecules cluster into large oligomers that are
                                                                           EM grids to 15% confluency and induced IRE1α
     visible as discrete foci by fluorescence
                                                                           expression. We next promoted ER stress with
     microscopy (21, 22). This extensive
                                                                           tunicamycin, which blocks N-linked protein
     oligomerization is consistent with the
                                                                           glycosylation in the ER lumen, thereby activating
     observation that IRE1’s lumenal and cytosolic
                                                                           IRE1α. We added blue fluorescent nanospheres to
     domains form dimers and higher-order
                                                                           the grids as positional markers and plunge-froze
     oligomers in vitro, also observed in various

                                                                                                                                            2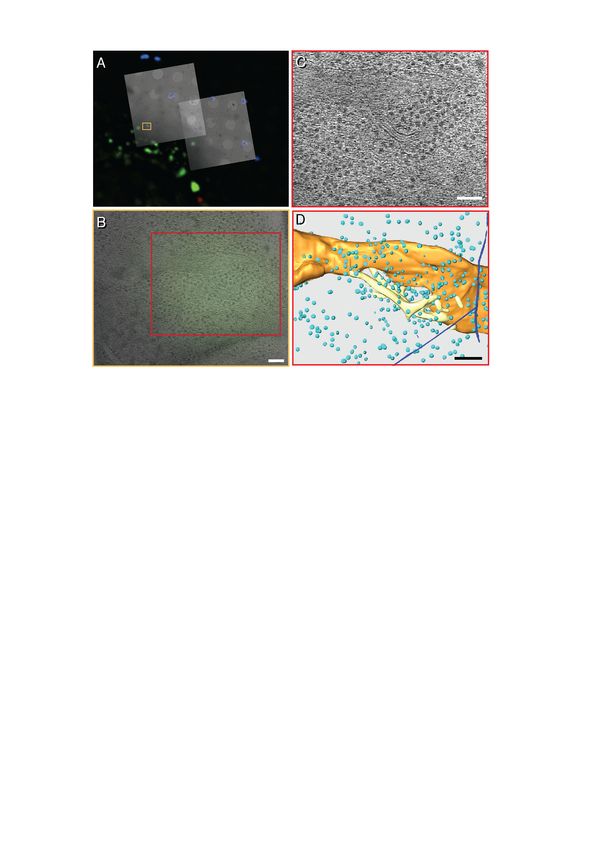
bioRxiv preprint doi: https://doi.org/10.1101/2021.02.24.432779; this version posted February 24, 2021. The copyright holder for this preprint
(which was not certified by peer review) is the author/funder, who has granted bioRxiv a license to display the preprint in perpetuity. It is made
                                                available under aCC-BY 4.0 International license.

                                                                                                   protein, the stressed cells
                                                                                                   exhibited       strong       auto-
                                                                                                   fluorescence at liquid nitrogen
                                                                                                   temperature (77 K) as previously
                                                                                                   observed (32), which hindered
                                                                                                   identification of IRE1α foci (Fig.
                                                                                                   S1). To overcome this hurdle,
                                                                                                   we      fused     IRE1α to     the
                                                                                                   exceptionally bright fluorescent
                                                                                                   protein mNeonGreen (mNG).
                                                                                                   This experimental refinement
                                                                                                   revealed spots emitting high
                                                                                                   fluorescence in the green but
                                                                                                   much lower fluorescence in the
                                                                                                   red and blue channels (Fig.1A).
                                                                                                   Spots meeting these criteria were
                                                                                                   absent in control cells expressing
                                                                                                   IRE1α not fused to mNG (Fig.
                                                                                                   S1), while auto-fluorescent spots
                                                                                                   with high green, blue and red
                                                                                                   signals were abundant in both
                                                                                                   samples. Thus, plotting the ratio
                                                                                                   of green/red and green/blue
                                                                                                   fluorescence intensity allowed
                                                                                                   us to exclude non-specific
                                                                                                   signals (Fig. S1) in order to
                                                                                                   identify     IRE1α-mNG        foci
                                                                                                   reliably.
                                                                                             We next imaged IRE1α foci by
                                                                                             cryo-CLEM combined with
     Figure 1 | IRE1α oligomers localize to specialized ER regions with complex topology. cryo-ET. To this end, using
     (A) Fluorescent profiles imaged at liquid nitrogen temperature for stressed cells grown
     on EM grids and expressing IRE1α-mNG. White arrow denotes the fluorescent spot nanospheres, grid features, cell
     corresponding to the tomogram depicted in (B-D). Blue arrow: 500 nm fluorescent boundaries and other landmarks
     nanosphere. “N”: Nucleus. Scale bar = 6 µm. (B) Correlation of fluorescence image
     with a representative z slice (C) of the tomogram showing examples of narrow
                                                                                             (such as ice), we located the
     membrane tubes (black arrows) connected to general ER network at junctions (green same IRE1α foci with the
     arrows) and to each other at three-way junctions (magenta arrows). The tomogram electron microscope that we had
     was manually segmented for 3D visualization in (D), where normal ER membranes are
     depicted in orange and constricted membranes colocalizing with IRE1α-mNG signal
                                                                                             previously identified with the
     are yellow. (E) A representative z slice from a higher resolution tomogram obtained light microscope and then
     in stressed U2OS-IRE1α-mNG cells. (arrows color code same as (C)). (F) manual recorded tilt-series. Across 9
     segmentation of region shown in (E) with constricted membranes shown in yellow and
     other membranes shown in orange at 50% transparency. Scale bars for B-F = 100 nm.
                                                                                             tomograms obtained from
     Densities corresponding to ribosomes and cytoplasmic densities in (D) and (F) are mouse embryonic fibroblasts
     omitted for clarity. See Fig. S4.                                                       (MEFs), fluorescent IRE1α foci
     the samples in a mixture of liquid ethane/propane at 77 K (30).                         consistently     localized     to
     To localize IRE1α foci, we first imaged the frozen grids on a                           specialized  regions  of  the ER
     fluorescent light microscope fitted with a liquid nitrogen sample that display                             a     network
     chamber (31). In our initial studies with an IRE1α-GFP fusion                           of     remarkably         narrow,

                                                                                                                                            3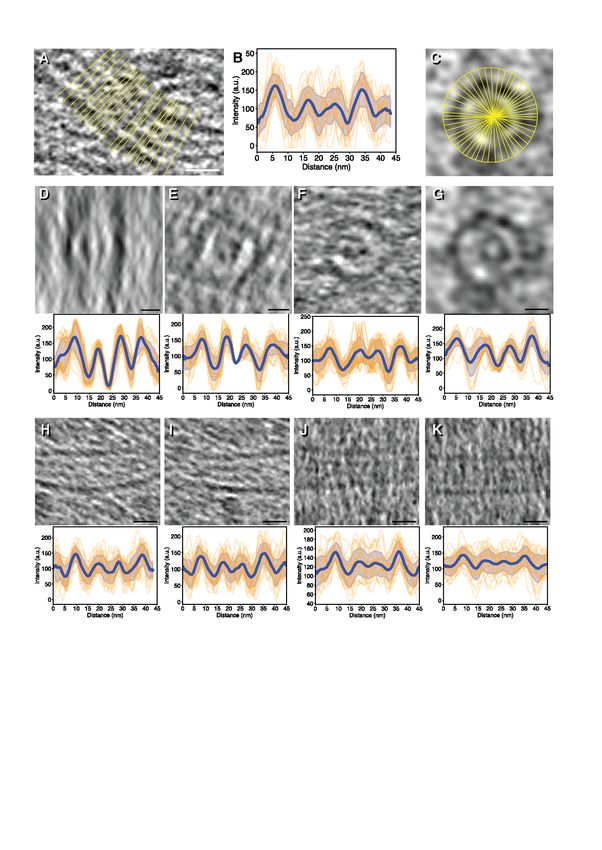
bioRxiv preprint doi: https://doi.org/10.1101/2021.02.24.432779; this version posted February 24, 2021. The copyright holder for this preprint
(which was not certified by peer review) is the author/funder, who has granted bioRxiv a license to display the preprint in perpetuity. It is made
available under aCC-BY 4.0 International license.
anastomosing tubes (Fig. 1B- to segment the tomograms (33), we confirmed the basic features of
D and Fig. S2-3) with an the manual 3D reconstructions without subjective bias (Fig. S6).
average diameter of 28 ± 3 Taken together, IRE1α foci localize to a highly specialized ER
nm (± standard deviation). region, henceforth termed the “IRE1α subdomain”.
As visualized in segmented
three-dimensional (3D) Orthogonal methods reveal IRE1α subdomains
reconstructions, the tubes To validate our discovery of IRE1α subdomain tubes with
frequently connect with each alternative approaches, we performed conventional and immuno-
other by three-way junctions electron microscopy on HEK293 cells expressing IRE1α-GFP
and to surrounding ER fusion protein (22). In ER-stressed HEK293 cells, electron
structures, forming a micrographs of chemically fixed, stained and Epon-embedded
topologically complex yet thin sections exhibit thin membrane tubes and networks of
continuous membrane comparable topology to those seen in the cryo-tomograms (Fig.
surface (Fig. 1D, Supp Fig. S7) and unlike anything seen in un-stressed, control cells. These
S2-3). Unlike the structures are infrequently observed and stained more strongly in
surrounding ER, the narrow their lumenal space than the surrounding ER, suggesting the
anastomosing tubes presence of a high protein density inside and likely represent
colocalized with IRE1α foci IRE1α subdomains.
are devoid of bound
ribosomes (Fig. S4).
To confirm these results and
obtain higher resolution
images, we used human
osteosarcoma U-2 OS cells
that likewise express
inducible IRE1α-mNG (27).
Compared to MEFs, U-2 OS
cells spread more and
therefore contain expansive
thin regions that enhance the
resolution of cryo-ET
imaging. We imaged tilt
series from 8 IRE1α-mNG
foci at slightly higher
magnification (33,000x for
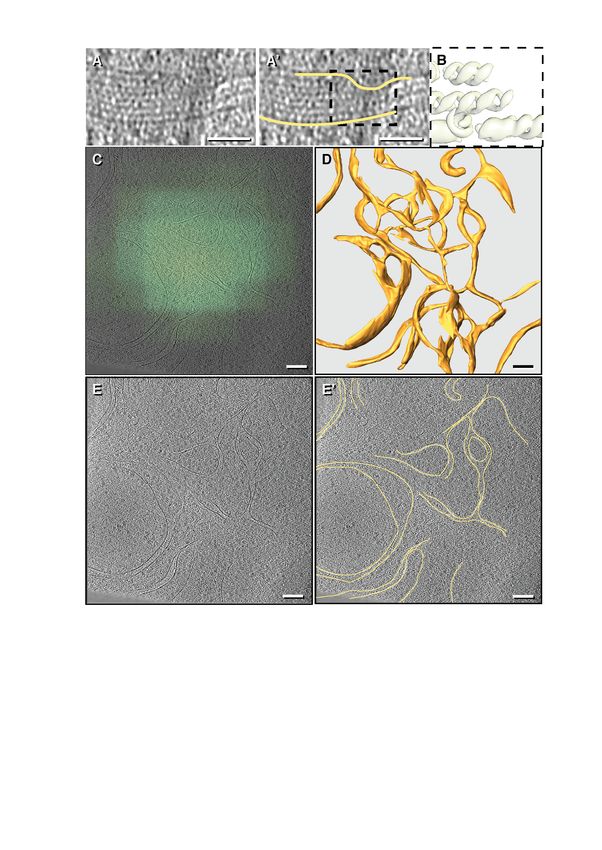
Figure 2 | Orthogonal immuno-electron microscopy reveals IRE1α subdomains. (A, A’)
U-2 OS cells vs. 22,000x for Representative micrograph of cells expressing IRE1α-GFP but not subjected to ER
MEFs). We again observed stress induction by Tunicamycin (Tm). Gold particles recognizing IRE1α-GFP epitope
thin anastomosing tubes with (via binding to anti-GFP primary antibody) sparsely label general ER structures. Scale
bar = 100 nm. In A’, orange: ER sheet/tubule membranes (B, B’) Representative
similar characteristics as micrograph of cells treated with Tm where gold particles recognizing IRE1α-GFP
those in MEFs, including the epitope densely localizes to a region enriched in narrow membranes of 26 ± 2 nm
absence of bound ribosomes, diameter. Scale bar = 100 nm. In B’, blue: mitochondrion, orange: ER sheet/tubule
membranes, red: plasma membrane, yellow: narrow IRE1α subdomain membranes.
three-way junctions and Histograms of inter-gold particle distances measured in micrographs from non-stressed
connections to adjacent ER samples (C) and stressed samples (D) reveal a population of densely clustered gold
(Fig. 1E-F and Fig. S4-5). particles enriched with ER stress induction. Zoomed in view showing longitudinal (E,
E’) and end-on (F, F’) tube cross-sections with ~28 nm diameter close to gold particles.
Using neural network- Scale bar = 20 nm. A ring-like density within the lumenal space is clearly visible in F
enhanced machine learning (segmented in teal)
4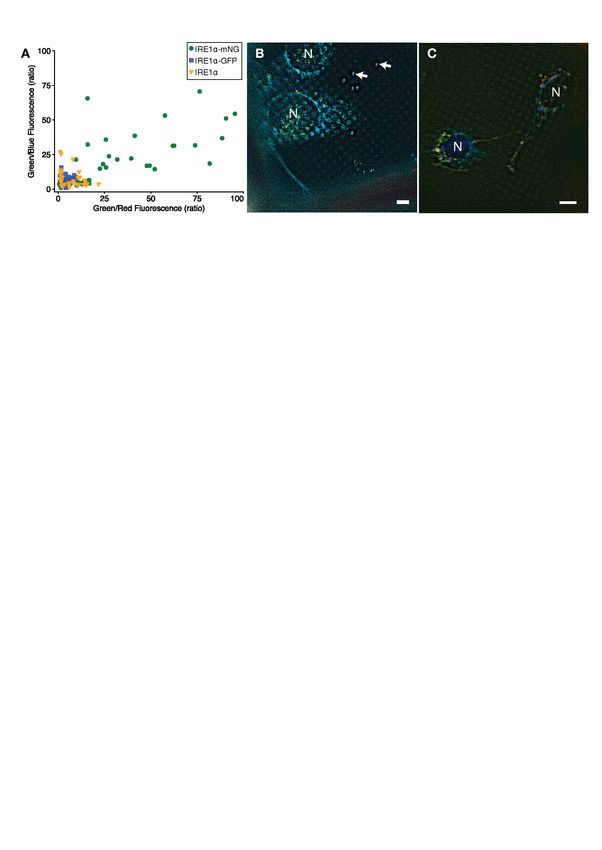
bioRxiv preprint doi: https://doi.org/10.1101/2021.02.24.432779; this version posted February 24, 2021. The copyright holder for this preprint
(which was not certified by peer review) is the author/funder, who has granted bioRxiv a license to display the preprint in perpetuity. It is made
                                                available under aCC-BY 4.0 International license.

     To directly identify IRE1α foci in electron                             inner rings measure 9 ± 0.5 nm in diameter and
     micrographs, we next performed immunogold                               are enclosed by membrane tubes that are
     labeling of ultrathin cryosections of HEK293                            approximately 28 ± 1 nm diameter (Fig. 3C).
     cells expressing IRE1α-GFP. As above, we
     induced ER stress with tunicamycin to drive                             Strikingly, in the tomograms of U-2 OS cells,
     activated IRE1α into foci. In non-stressed                              the lumenal densities show sufficient
     cells, gold particles specific to IRE1α-GFP                             substructure to reveal two intertwined helices
     sparsely label large regions of the cell with                           (Fig. 3D-F’). This helical feature is most
     visible ER (Fig. 2A-A’ and Fig. S8). By                                 clearly seen in IRE1α subdomain tubes in
     contrast, in stressed cells we observed clusters                        which the top and bottom cross sections show
     of gold particles in regions of much higher                             equidistant parallel angled lines of opposite
     membrane complexity (Fig. 2B-B’, 2E-F’and                               directionalities, whereas the middle cross
     Fig. S8). In these regions, we observed narrow                          section shows helical features (Fig. 3D-G).
     membrane tubes of similar diameter (~28 nm)
     as both longitudinal and transverse cross                               Sub-tomogram averaging resolves flexible
     sections. Quantification of the inter-particle                          IRE1α-LD double helices
     distances between samples revealed a clear                              To determine the 3D structure of the lumenal
     difference in gold particle density (Fig. 2C-D),                        double-helical   density,    we     extracted
     reflecting a population of clustered IRE1α -                            subvolumes along the membrane tubes for
     GFP molecules in stressed cells that is absent
     in non-stressed control cells. This observation
     is consistent with previous data that show that
     IRE1α molecules, which uniformly distributed
     in the ER during homeostasis, aggregate in foci
     of dozens of IRE1α molecules during ER stress
     induction (22, 26, 27). Notably, we observed a
     distinct lumenal density inside the membrane
     tubes, which is circular in transverse cross
     sections (Fig. 2E-F’).

     IRE1α subdomain membrane tubes contain
     lumenal helical filaments.
     Consistent with the density observed in
     immunogold labeling experiments, we                                     Figure 3 IRE1α subdomain membrane tubes contain
                                                                             lumenal protein densities. Representative examples of a
     observed regular densities in the lumen of the                          longitudinal cross-section (A, A’) and an end-on cross-section
     IRE1α subdomain tubes in cryogenic                                      (B, B’) obtained in MEFs-IRE1-mNG cells revealing
     tomographic reconstructions, which we                                   membrane density (yellow) surrounding lumenal protein
                                                                             density (teal). Scale bar = 20 nm. Intensity line plots across
     interpret as oligomers of IRE1α-LD. In our                              subdomain tubes are aligned, plotted and averaged across 9
     MEF-derived tomograms, the lumenal                                      cross-sections and plotted as a function of distance in (C). Blue
     densities resemble train tracks that in                                 line with shaded error of the mean is the averaged trace for all
                                                                             plots. Distance separation of peak maxima are indicated for
     longitudinal sections run parallel to the                               peaks representing membrane densities (yellow) and those
     membranes (Fig. 3A-A’). Closed rings roughly                            representing protein densities (teal). (D-F’) show an example
     concentric with the enclosing tube membrane                             of lumenal protein densities with helical features obtained in
                                                                             U2OS-IRE1-mNG cells viewed as top (D, D’), middle (E, E’)
     are clearly visible in instances where IRE1α                            and bottom (F, F’) sections. Scale bars = 20 nm. G) Schematic
     subdomain tubes are imaged parallel to the                              of an idealized double helix to illustrate how the cryo-
     beam direction (Fig. 3B-B’ and Fig. S9). The                            tomogram slices in D-F would intercept as planes and give
                                                                             rise to the corresponding densities segmented in D’-F’.

                                                                                                                                            5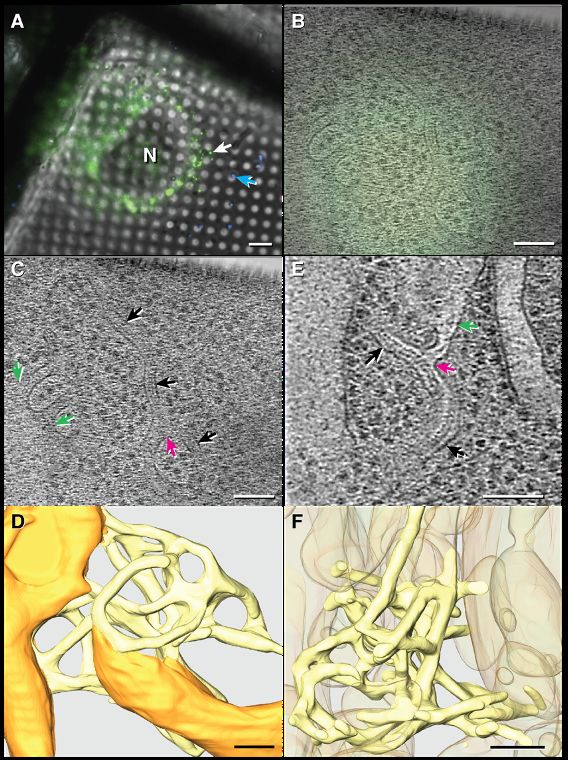
bioRxiv preprint doi: https://doi.org/10.1101/2021.02.24.432779; this version posted February 24, 2021. The copyright holder for this preprint
(which was not certified by peer review) is the author/funder, who has granted bioRxiv a license to display the preprint in perpetuity. It is made
                                                available under aCC-BY 4.0 International license.

     subtomogram averaging, using the EMAN2 tomogram                                               its inactive dimeric form. We
     processing workflow (Fig. S10). The resulting electron density                                chose to begin with the former
     map obtained by averaging of 653 subvolumes portrayed a                                       and used SWISS-MODEL
     double helix composed of two equidistant intertwined strands                                  homology modeling to predict
     with a pitch of 17 nm in each individual strand (Fig. 4A, B and                               a homologous human IRE1α-
     Fig. S10). Analysis of sequential cross sections revealed that                                LD structure based on the
     the double helices are left-handed (Fig. 4A). The handedness                                  yeast structure (Fig. S11) (34).
     was confirmed by subtomogram averaging of ribosomes in the                                    The resulting model retains
     same tomograms (data not shown). This double helical                                          similarity in secondary and
     structure is reminiscent of the unit cell of the S. cerevisiae                                tertiary structure compared to
     IRE1-LD crystal structure ((23) PDB ID: 2BE1), in which two-                                  the (inactive) human IRE1α-
     fold symmetrical head-to-head IRE1-LD dimers arrange into                                     LD but contains rearranged
     helical filaments by forming tail-to-tail contacts. Two such                                  elements at the tail-ends of the
     yeast IRE1-LD filaments intertwine in left-handed double                                      homodimer (Fig. S11-12). We
     helices.                                                                                      next fit the modeled head-to-
                                                                                                   head IRE1α-LD dimer into our
     With fluorescence, immunogold labeling, and structural (left-
                                                                                                   double-helical map as a rigid
     handed intertwined helices) evidence that the regular density in
                                                                                                   body and modified the tail-to-
     the tubes is IRE1α-LD, we endeavored to interpret its structure
                                                                                                   tail dimer interface so that the
     in light of existing atomic models. The two most relevant
                                                                                                   polymer would exhibit the
     structures are (i) the crystal structure of the active, polymeric
                                                                                                   same helical pitch observed in
     yeast IRE1-LD, which forms intertwined left-handed helices
                                                                                                   the tomograms (Fig. 4C-D and
     like those in the cryo-tomograms but with different pitch (38
                                                                                                   Figs. S13). We maintained
     nm); and (ii) the crystal structure of the human IRE1α-LD in
                                                                                                   both      head-to-head       and
                                                                                                   modified tail-to-tail interfaces
                                                                                                   in propagating the array of
                                                                                                   dimers to occupy the helical
                                                                                                   map. The resulting model
                                                                                                   contains approximately six
                                                                                                   dimers per turn in each helical
                                                                                                   filament       (Fig.      4E-F),
                                                                                                   consistent with the S.
                                                                                                   cerevisiae LD crystal structure
                                                                                                   (Fig. S14) but with a
                                                                                                   compressed pitch (17 nm vs.
                                                                                                   38 nm in the yeast crystal
     Figure 4 |Sub-tomogram averaging resolves flexible IRE1α-LD double helices.                   structure). We conclude that
     (A-B) Electron density map obtained by sub-tomogram averaging of 653                          an      IRE1α-LD        polymer
     subvolumes in U2OS-IRE1-mNG tomograms with indicated distances for helical
     pitch and width. (C, D) Semi-transparent masked average of one strand of the
                                                                                                   accounts well for the regular
     double helix fitted with modeled IRE1α lumenal oligomer (E, F) using Chimera’s                density, including in the
     “fit-in-map” function. 77% of the structure fit within this density. (B, D and F) are         details of its thin ribbon-like
     rotation of (A, C, E) by 90 degree along X axis. (F) 5 dimers of IRE1α-cLD are fitted
     into masked single-strand map, but approximately 6 dimers are required to complete
                                                                                                   shape. By analogy to the yeast
     one full turn. (G) An isosurface of the averaged density mapped back on to the cryo-          LD structure, we fit the human
     tomogram at a highly curved region and fitted with a helix of the modeled IRE1α               LD into the density with its
     lumenal structure using a range of interface angles to accommodate curvature. (H)
     A histogram of measured radii of curvature observed for 25 nm segments along                  putative unfolded protein
     IRE1α subdomain network.                                                                      binding groove facing towards

                                                                                                                                            6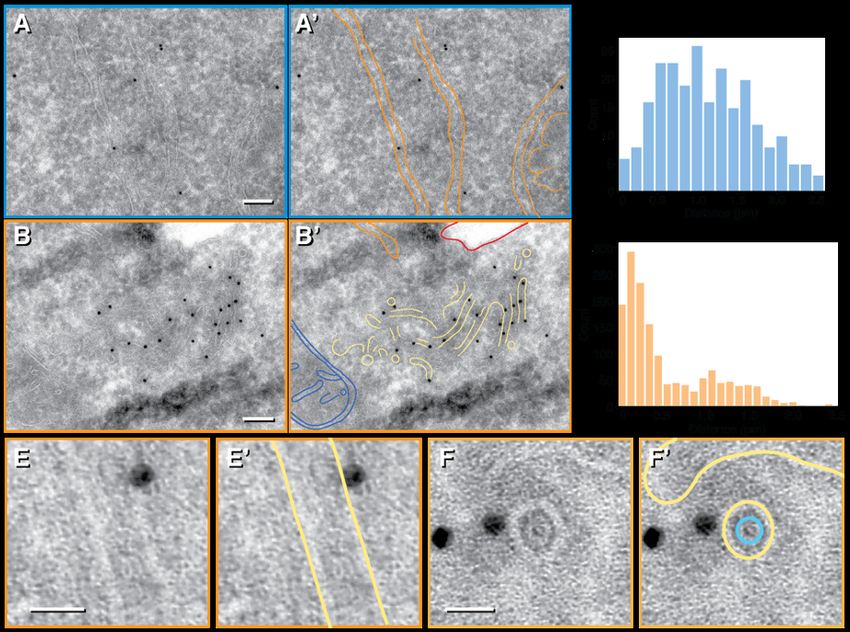
bioRxiv preprint doi: https://doi.org/10.1101/2021.02.24.432779; this version posted February 24, 2021. The copyright holder for this preprint
(which was not certified by peer review) is the author/funder, who has granted bioRxiv a license to display the preprint in perpetuity. It is made
                                                available under aCC-BY 4.0 International license.

     Figure 5 | IRE1α-LD helices can accommodate a range of distance from membrane. (A, A’) An instance of ordered IRE1α-LD
     helices not completely enveloped by narrow membrane tubes. Arrow in A indicates a membrane fenestration. ER: lumenal space;
     M: mitochondrion. Scale bar = 100 nm. (B, B’) Side view along indicated plane obtained by 90-degree rotation along X axis.
     Scale bar = 20 nm. (C) Diagram of IRE1α domain architecture drawn to approximate scale. cLD: core lumenal domain (a.a. 19-
     390), L-linker: lumenal linker (a.a. 391-443), TM: transmembrane helix (a.a. 444-464), C-linker: cytoplasmic linker (a.a. 465-
     570), KD: kinase domain (a.a. 571-832), RD: ribonuclease domain (a.a. 835-964). Scale bar = 10 nm. (D) Dimensions of IRE1α-
     LD helices within IRE1 subdomain lumenal space. (E, F) Schematics for alternative TM domain and L-linker arrangements within
     the narrow subdomain tubes. There are 24 monomers per turn for the double helices, but only 12 TM and L-linker domains are
     shown for clarity. (G) Model for TM and L-linker arrangement for helices not completely surrounded by membrane as seen in B
     the membrane; however, at the current
     resolution this assignment must be considered                           IRE1α-LD helices and IRE1α subdomains
     tentative because no secondary structural                               are flexible
     features are resolved that would support this                           Further examination of the tomograms
     orientation. Likewise, the details of the subunit                       revealed infrequent instances in which lumenal
     contacts remain uncertain.                                              double helices are irregularly spaced from the
                                                                             tubular membranes (Fig. S16). In one case, we
     Mapping the averaged subvolumes back onto                               observed helices that are not completely
     the cryo-tomograms (Fig. 4G) allowed us to                              enclosed by membrane tubes but instead are
     generate a volumetric map for IRE1α-LD                                  positioned on the lumenal face of a flat ER
     within an IRE1α subdomain. The resulting                                membrane (Fig. 5A-B’).
     distribution of double-helical filaments
     showed that the helices are not stiff but curve                         The helically arranged IRE1α core-LDs (cLD)
     to varying degree (Fig. 4H and Fig. S15),                               are each attached via a 52-amino acid linker to
     ranging from straight segments (radius of                               IRE1α’s transmembrane domains, which in
     curvature > 175 nm) to segments bent with                               turn are connected to the cytosolic
     radii approaching 25 nm. This bending                                   kinase/RNase domains (Fig. 5C). In IRE1α
     indicates     that      IRE1α-LDs,         their                        subdomain tubes, the linker domain could
     oligomerization interfaces, and/or inter-strand                         either be in a compacted or an extended
     connections must undergo conformational                                 conformation to bridge the 5.9 nm distance
     rearrangements that can accommodate the                                 between the helix and the membrane (Fig. 5D;
     observed range of curvatures.                                           and Fig. 5E-F, respectively). By contrast, when
                                                                             IRE1α-cLD helices are attached to a flat ER

                                                                                                                                            7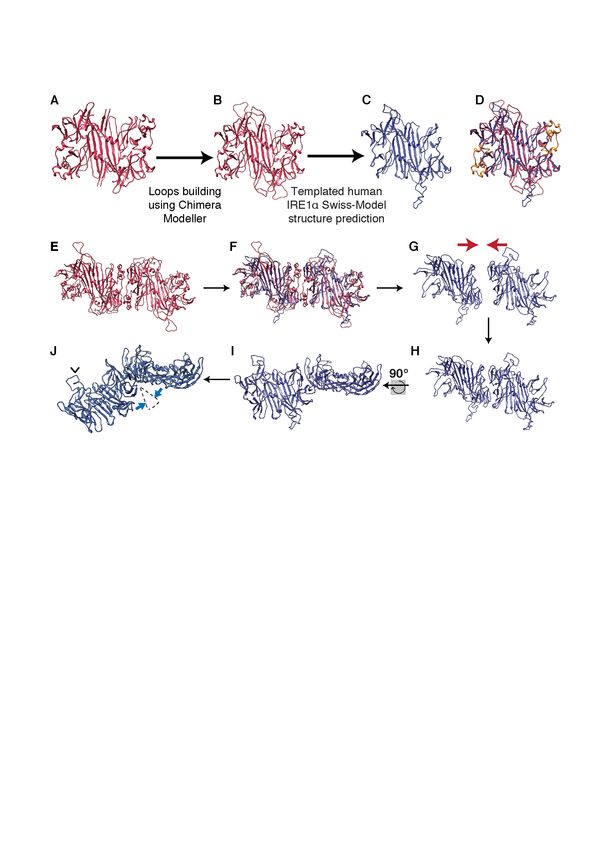
bioRxiv preprint doi: https://doi.org/10.1101/2021.02.24.432779; this version posted February 24, 2021. The copyright holder for this preprint
(which was not certified by peer review) is the author/funder, who has granted bioRxiv a license to display the preprint in perpetuity. It is made
                                                available under aCC-BY 4.0 International license.

     membrane surface on one side only as shown                              membrane tubes, which in 18 out of 20 have a
     in Fig. 5A-B, their linker domains must                                 consistent diameter of ~28 nm and contain
     accommodate         the    different    distance                        lumenal protein density consistent with the
     requirements imposed by the positioning of                              helical reconstruction. By contrast, no such
     individual IRE1α-cLD monomers to reach the                              structures were observed in adjacent and
     nearest membrane surface, likely conforming                             random regions of the cell, including those
     to a range of compaction (Fig. 5G). One                                 emitting high autofluorescence; (ii) orthogonal
     consequence of this arrangement is that IRE1α                           analysis by immunogold-staining of thin
     kinase/RNase domains on the cytosolic side of                           sections revealed IRE1α localization to
     the membrane are brought into even closer                               similarly-narrow tubes; (iii) the double-helical
     proximity and hence experience a higher local                           architecture closely resembles that observed in
     concentration (we estimate it likely exceeding                          the crystal structure of yeast IRE1-cLD (23);
     1 mM, see Methods) than in the tubes, in which                          and (iv) the reconstructed helical volume has
     the membrane surface surrounding the helices                            the same flat ribbon-like shape and dimensions
     is ~4-fold larger than the contact surface of the                       as IRE1α-cLD oligomers.
     helices attached to a flat membrane sheet.                              The accumulation of IRE1α within these
                                                                             specialized structures explains recent
     Discussion                                                              observations that IRE1α foci contain a readily
     The ER is formed from a single continuous                               exchanging periphery and a diffusionally
     membrane that is dynamically differentiated                             constrained core (27). We surmise that the two
     into a plethora of pleomorphic subdomains                               distinct populations represent (i) IRE1α
     (35), including the nuclear envelope, smooth                            molecules located at the subdomain junctions
     tubules, tubular matrices (36), ribosome                                where the 28 nm tubes merge with the main ER
     studded flat sheets, ER exit domains, inter-                            and (ii) those located deeper in the interior of
     organellar contact sites (37), and ER-phagic                            the narrow tubes. IRE1α molecules at helix
     whorls (38). Using cryo-CLEM to inspect                                 ends located near the tube mouths can readily
     IRE1α fluorescent puncta at macromolecular                              dissociate, and new IRE1α molecules can
     resolution, we found that UPR activation leads                          associate; they thus represent a freely
     to the formation of previously unrecognized                             exchanging pool at the foci’s periphery. By
     “IRE1α      subdomains”,       comprised     of                         contrast, IRE1α molecules at the foci’s core are
     topologically heterogeneous assemblies of                               physically trapped in regularly arrayed helices;
     anastomosing ~28 nm membrane tubes. Inside                              they thus represent a non-exchangeable pool.
     the highly constricted lumenal spaces of this                           The confinement of IRE1α in the
     labyrinthine network, IRE1α-LDs assemble                                anastomosing IRE1α subdomains suggests
     into ordered double-helical filaments. Our use                          functional consequences for the regulation of
     of cryo-CLEM and cryo-ET to visualize IRE1α                             IRE1 signaling. The presence of just a single
     oligomers directly in intact cells demonstrates                         unfolded protein molecule in each 100 nm-
     the power of in situ structural biology,                                long cylinder segment amounts to an effective
     providing insight into the supramolecular                               concentration of ~40 µM, which is in the same
     arrangements of molecules in their native                               order of magnitude as the affinity measured for
     environment.                                                            IRE1-unfolded protein binding in vitro (13,
     Four independent lines of evidence support our                          14). Thus a few unfolded protein molecules
     conclusion that the observed helical densities                          trapped inside the tubes would saturate IRE1α
     indeed correspond to oligomerized IRE1α-                                LD with activating ligand, triggering a positive
     LDs: (i) In 20 out of 20 fluorescent foci                               feedback loop that effectively locks IRE1α into
     analyzed by EM, we observed narrow                                      its activated state. This effect is due to the

                                                                                                                                            8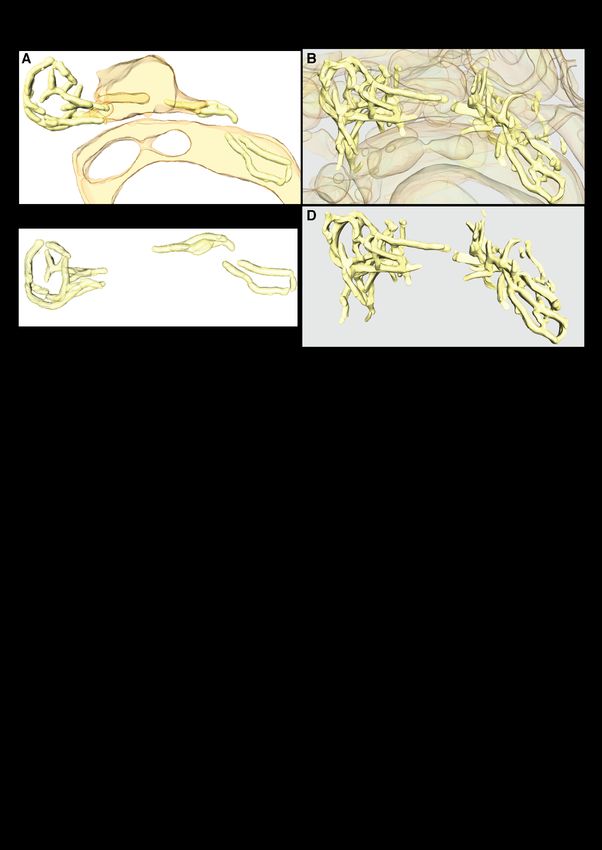
bioRxiv preprint doi: https://doi.org/10.1101/2021.02.24.432779; this version posted February 24, 2021. The copyright holder for this preprint
(which was not certified by peer review) is the author/funder, who has granted bioRxiv a license to display the preprint in perpetuity. It is made
                                                available under aCC-BY 4.0 International license.

     enormous concentration IRE1α experiences                                protrusions, which then fuse with adjacent ER,
     upon foci formation. Without UPR activation,                            or from IRE1α-LD filaments pushing ridge-
     IRE1α-mNG is distributed over the ER surface                            like deformations into flat ER membranes,
     at about 10 molecules per µm2 (27). By                                  which then separate from the flat ER following
     contrast, inside IRE1α subdomains, it is                                membrane         fission/fenestration      (41).
     enriched 1500-fold to 15,000 molecules per                              Alternatively, IRE1α filament polymerization
     µm2 of ER membrane (Methods). Moreover,                                 could constrict existing ER tubes to form
     based on decreased diffusional freedom due to                           IRE1α subdomains or stabilize pre-existing
     the complex membrane architecture (39) and                              narrow membrane tubes (42) into subdomain
     IRE1α LD’s helical assembly, IRE1α                                      tubes with regular ~28 nm diameter. In support
     subdomains stabilize the oligomeric state. In                           of the latter model, in 2 out of 20 of our
     an IRE1α subdomain, we estimate that the                                tomograms, we observed strong IRE1α-mNG
     local concentration of IRE1α’s LD inside the                            signal in regions with thin and irregular
     tubes and IRE1α cytosolic domains on the                                membrane tubes, but no ordered lumenal
     tubes’ cytosolic surface approaches 5 mM and                            filaments (Fig. S16). Such structures may
     200 µM, respectively. These concentrations                              represent an intermediate state, captured after
     well-exceed the range of affinities measured in                         IRE1α’s preferential localization but preceding
     vitro for purified IRE1 domain oligomerization                          helix formation.
     (25, 40).                                                               Our discovery of the IRE1α subdomain raises
     The resemblance to the crystal structure of the                         intriguing possibilities with regard to how
     yeast IRE1 cLD is remarkable: this structure                            recruitment of IRE1α into these highly
     likewise reveals two intertwined, equidistant                           specialized ER structures could serve
     left-handed helices with 12 LDs per turn and                            regulatory functions in the UPR. Its high
     strand, albeit 2.2-fold more stretched out along                        concentration into long-lived topologically
     the central axis. It will certainly be interesting                      distinct structures may scaffold assembly of
     to repeat this work with yeast cells to see if the                      downstream effectors, as previously proposed
     differences are species-specific or due to                              (9), and/or affect the selection of IRE1α
     artefacts of crystallization conditions. Given                          mRNA substrates in switching between XBP1
     that two helices of the IRE1α-LDs are                                   splicing and RIDD activities (19). Such
     equidistantly intertwined, there may be bridges                         regulation may thus profoundly affect the
     between them, perhaps formed from                                       life/death decision that the UPR makes in
     unresolved regions of the cLD or linker                                 response to a breakdown in ER protein folding
     domains, and/or bound unfolded protein                                  homeostasis and hence be of crucial
     chains. We find it equally remarkable that                              importance in designing UPR-centered
     IRE1α helices are observed both in the narrow                           therapies in protein folding disorders.
     membrane tubes of the IRE1α subdomain as
     well as, albeit more rarely, lying flat on the                          Acknowledgements
     lumenal side of ER sheets. Thus, the lumenal                            We thank Margaret Elvekrog, Ariane Briegel,
     IRE1α linker domains must accommodate a                                 Diego Acosta-Alvear, Richard Fetter, Suzanne
     range of distances separating IRE1α-cLD from                            van Dijk, Stefan Niekamp and Vladislav Belyy
     the    membrane        surface.     These     two                       for their advice and technical assistance. We
     topologically distinct arrangements of IRE1α-                           thank Greg Huber, Robert Ernst, Adam Frost
     cLD helices may co-exist or could be temporal                           and Jodi Nunnari for insightful discussions.
     precursors of one another.
                                                                             Funding
     IRE1α subdomains could form by IRE1α-LD
     filaments pushing finger-like ER membrane

                                                                                                                                            9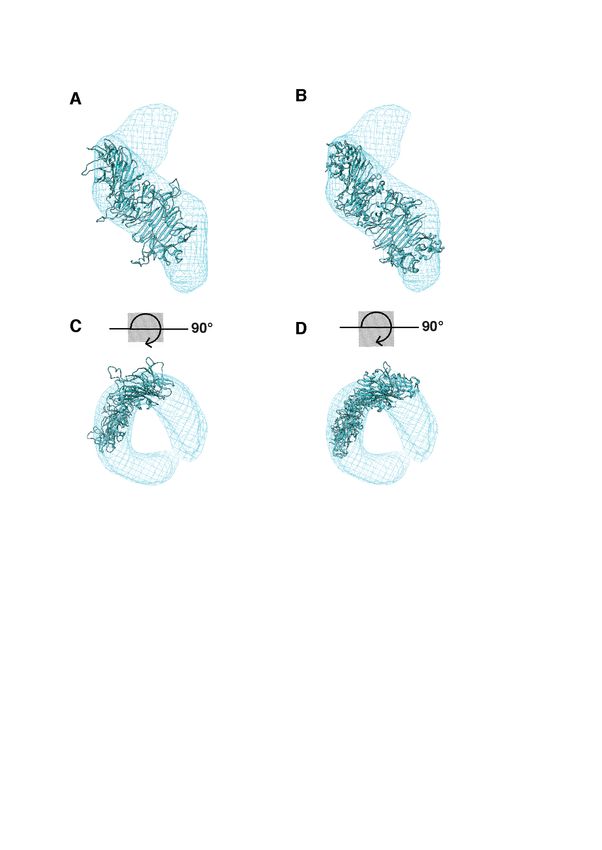
bioRxiv preprint doi: https://doi.org/10.1101/2021.02.24.432779; this version posted February 24, 2021. The copyright holder for this preprint
(which was not certified by peer review) is the author/funder, who has granted bioRxiv a license to display the preprint in perpetuity. It is made
                                                available under aCC-BY 4.0 International license.

     This work was supported in parts by NIH                                 cultured in high glucose DMEM media
     grants P50 AI150464 and R35 GM122588 to                                 supplemented with 10% tetracycline-free fetal
     GJJ and NIH R01-GM032384 to PW. NHT is                                  bovine serum (FBS; Takara Bio), 6 mM L-
     supported by the National Science Foundation                            glutamine,          and        100         U/ml
     Graduate Research Fellowship. JK is                                     penicillin/streptomycin. All cell lines used in
     supported by the Dutch Research Council                                 the study tested negative for mycoplasma
     NEMI research program project number                                    contamination when assayed with the
     184.034.014. ADM received salary from                                   Universal Mycoplasma Detection Kit (ATCC
     Genentech, Inc. PW is an Investigator of the                            30-1012K). To minimize autofluorescence, the
     Howard Hughes Medical Institute.                                        same culture media without phenol red was
                                                                             used to grow cells for grid preparation
     Author contributions
                                                                             (32). Prior to cell plating, gold Quantifoil
     AA, JK, PW and GJ, conceived of the study.                              London finder grids (EMS R2/2 LF-Au-NH2)
     NHT, SDC, PW and GJ designed cryo-CLEM                                  were UV treated to sterilize and coated with
     experiments. NHT and SDC generated and                                  cell adhesion matrix. For MEFs-IRE1-mNG
     screened grids. SDC performed the cryo-                                 cell line, grids were coated in droplets of 500
     CLEM/cryo-ET and subtomogram averaging                                  µg/mL Fibronectins (Sigma-Aldrich S5171-
     and generated IRE1α subdomain models,                                   .5MG) for 5 minutes on each side, washed in
     neural network-derived segmentations and                                PBS, blotted and air-dried. For U2OS-IRE1-
     movies.     NHT      performed      manual                              mNG cell line, grids were coated with ~4
     segmentation, quantification of IRE1α                                   mg/mL undiluted Collagen type I (Corning
     subdomain dimension and calculations. ADM                               354236) droplets for 20 minutes, washed in
     performed      Epon-embedded       electron                             PBS, blotted and air-dried. Cells were seeded
     microscopy and immunogold labeling                                      at 15% confluence and allowed to adhere for 8
     experiments. NHT and SDC prepared figures.                              hours and induced with Doxycycline (500 nM)
     NHT, SDC, PW and GJ wrote the manuscript.                               for 6 or 18 hours for MEFs and U-2 OS cell
     Competing interests                                                     lines, respectively. ER stress was then induced
                                                                             by treatment with 1.5 µg/mL of Tunicamycin
     The authors declare no competing interests.                             for 2 hours.
     Data and materials availability                                         Immediately prior to being plunge frozen, 3 µl
     The codes used for data quantification and                              of a beads suspension was added to the grids.
     plots in this paper are freely available at                             The bead suspension was made by a 1:1
     https://github.com/han-tran/IRE1. The final                             dilution of 500 nm blue (345/435 nm)
     sub-tomogram        averaged      maps       and                        polystyrene fluorospheres (Phosphorex) with a
     representative tomograms can be accessed at                             3:1 concentrated solution of 20 nm:5 nm
     EMDB entry ID EMD-23058. All raw and                                    colloidal gold (Sigma Aldrich) blocked with
     processed data are available upon request. All                          bovine serum albumin. The gold beads served
     cell lines and plasmids used in this paper are in                       as fiducial markers for cryo-tomogram
     the Walter lab depository and are available                             reconstruction while the blue fluorospheres
     upon request.                                                           served as landmarks for registering cryogenic
                                                                             fluorescence microscopy images collected
     Materials and Methods                                                   from different channels as well as with cryo-
     Cell culture and grid preparation                                       EM projection images for cryo-CLEM (32).
                                                                             Residual media and bead suspension were
     Previously described MEFs-IRE1-mNG and                                  blotted manually from the back side with
     U2OS-IRE1-mNG cell lines (14, 27) were                                  Whatmann paper #40 in 90% humidity. Grids

                                                                                                                                          10
bioRxiv preprint doi: https://doi.org/10.1101/2021.02.24.432779; this version posted February 24, 2021. The copyright holder for this preprint
(which was not certified by peer review) is the author/funder, who has granted bioRxiv a license to display the preprint in perpetuity. It is made
available under aCC-BY 4.0 International license.
are plunge-frozen in liquid ethane/propane were typically 200-500 nm thick were located
mixture using a Vitrobot Mark IV (FEI, in the TEM using methods described
Hillsboro, OR). Plunge-frozen grids were previously. Tilt series were then recorded of
subsequently loaded into Polara EM cartridges these areas using UCSF Tomography (43) or
(FEI) (31). Cryo-EM cartridges containing SerialEM (44) software at a magnification of
frozen grids were stored in liquid nitrogen and 27,500× (Polara) and 34,000× (Polara). This
maintained at ≤−150 °C throughout the corresponds to a pixel size of 3.712 Å (MEFs)
experiment including cryogenic fluorescence or 3.260 Å (U2O2), respectively, at the
microscopy imaging, cryo-EM imaging, specimen level and was found to be sufficient
storage and transfer. for this study. Each tilt series was collected
from −60° to +60° with an increment of 1° in
Fluorescence imaging and image processing
an automated fashion at 4–10 µm underfocus.
The EM cartridges were transferred into a The cumulative dose of one tilt-series was
cryo-FLM stage (FEI Cryostage), modified to between 80 and 150 e−/Å2. The tilt series was
hold Polara EM cartridges (31), and mounted aligned and binned by 4 into 1k x 1k using the
on a Nikon Ti inverted microscope. The grids IMOD software package (45) , and 3D
were imaged using a 60X extra-long-working- reconstructions were calculated using the
distance air-objective (Nikon CFI S Plan Fluor simultaneous reconstruction technique (SIRT)
ELWD 60X NA 0.7 WD 2.62–1.8 mm). implemented in the TOMO3D software
Images were recorded using a Neo 5.5 sCMOS package (46), or weighted back projection
camera (Andor Technology, South Windsor, using IMOD. Noise reduction was performed
CT) using a 2D real-time deblur deconvolution using the non-linear anisotropic diffusion
module in the NIS Elements software from (NAD) method in IMOD (45), typically using
AutoQuant (Nikon Instruments Inc., Melville, a K value of 0.03–0.04 with 10 iterations.
NY). The 2D real-time deconvolution
Segmentation and isosurface generation
algorithm estimates a PSF using several factors
such as sample thickness, noise levels in the Segmentation and isosurface rendering were
image, background subtraction and contrast performed in Amira (Thermo Scientific). For
enhancement. All fluorescence images lower resolution tomograms from MEFs cells,
(individual channels) were saved in 16-bit the segmentation was done all manually using
grayscale format. IRE1α-mNG was visualized the brush, lasso, and thresholding tools
with a FITC filter. Blue fluorospheres were combined with interpolation and surface
visualized with a DAPI filter. Red smoothing. For higher resolution tomograms
autofluorescence was imaged using an from U2-OS cells, the ER, IRE1α subdomains
mCherry filter. and vesicles were segmented manually.
Cytoskeletal components and ribosomes were
EM imaging
segmented using the TomoSeg CNN module in
Cryo-EM grids previously imaged by cryo-LM EMAN2 (33).
were subsequently imaged by electron cryo- Conventional electron microscopy
tomography using a FEI G2 Polara 300 kV
HEK293 stable cells expressing IRE1-GFP,
FEG TEM (FEI) equipped with an energy filter
unstressed or treated with tunicamycin, were
(slit width 20 eV for higher magnifications;
fixed with 2.5 % glutaraldehyde, 2%
Gatan, Inc.), and a 4 k × 4 k K2 Summit direct
paraformaldehyde in 0.1 M Sorenson’s
detector (Gatan, Inc.) in counting mode.
phosphate buffer (PB), pH 7.4, for 2 h at room
First, cellular areas containing the fluorescent temperature. After storage in 1% PFA, 0.1 M
bodies of interest in suitably-thin areas that PB at 4 °C for about 1 week and rinsing in 0.1
11bioRxiv preprint doi: https://doi.org/10.1101/2021.02.24.432779; this version posted February 24, 2021. The copyright holder for this preprint
(which was not certified by peer review) is the author/funder, who has granted bioRxiv a license to display the preprint in perpetuity. It is made
available under aCC-BY 4.0 International license.
M PB, the cells were postfixed with 1 % OsO4 In U2OS cells each tilt series was collected
and 1.5 % K3Fe(CN)6 in 0.07 M PB, stained en from −60° to +60° with an increment of 1°in
bloc in aqueous 0.5 % uranyl acetate, an automated fashion using SerialEM at 4–6
dehydrated in acetone and embedded in Epon. µm underfocus. The image pixel size used for
Ultrathin plastic sections were stained with subtomogram averaging was 6.52 Å (binned
uranyl acetate and lead citrate and examined in by 2). Subsequent subtomogram averaging
a JEOL JEM-1010 electron microscopy. was performed by the EMAN2 tomography
Quantification of the diameters of IRE1a pipeline (49). Initially unbinned tilt-series
subdomain tubes and ER cisterns was were automatically aligned and reconstructed
performed using Fiji software (47). using EMAN2. In total, 3 cryo-tomograms
were generated to provide a sufficient number
Immuno-electron microscopy
of particles for further processing. Particles
HEK293 cells stably expressing IRE1-GFP, were picked using EMAN2 particle picking
untreated or treated with tunicamycin, were software using a box size of 56x56x56 pixels.
fixed using 4 % PFA in 0.1 M PB for 2 h at Briefly model points were placed every 10 nm
room temperature, then overnight at 4 °C. along the length (approximately one helical
Subsequently, the fixation was continued by turn), of the oligomer present inside the
replacing the initial fixative with 1 % PFA in membrane tube. Particles of various
0.1 M PB for several days. The samples were orientations were picked, including top-views
then rinsed in PBS, blocked with 0.15 % glycin and side-views. In total 653 model points were
in PBS, scraped in 1% gelatin in PBS, pelleted, picked. CTF estimation and correction was
and embedded in 12 % gelatin. Small blocks of performed by EMAN2. An initial model was
pellet were cryoprotected with 2.3 M sucrose, then generated in C1 with all 653 particles in 5
mounted on aluminum pins and frozen in iterations. The iteration 5 map was aligned to
liquid nitrogen. Ultrathin cryosections were the symmetry axis and was used as an initial
cut at -120 °C, placed on copper carrier grids, model for subtomogram refinement using C2
thawed and immunolabeled as previously and D2 symmetry. The first iteration D2 map
described (48). In brief, the sections were generated in subtomogram refinement was
incubated with blocking buffer containing fish used as a reference for a sub-tilt refinement
skin gelatin (Sigma-Aldrich, G7765) and step using helical symmetry in 5 iterations. The
acetylated BSA (Aurion, 900.022) and helical symmetry parameters were as follows;
immunolabeled with biotinylated goat anti- C symmetry = 2, rotation about the Z axis =
GFP antibody (Rockland, 600-106-215) at 45°, nsym = 2.5, and tz = 5. The map produced
1:300, followed by rabbit anti-biotin antibody by iteration 5 includes 80% of the best aligned
(Rockland, 100-4198) at 1:10000. particles and is shown in figure S10. To focus
Subsequently, the sections were incubated on one strand of the helix, an automatic mask
with Protein A-conjugated 10 nm gold was generated to improve alignment in 5
particles (Cell Microscopy Core, University iterations. The one-stranded map produced by
Medical Center Utrecht, the Netherlands), iteration 5 includes 80% of the best aligned
stained with uranyl acetate followed by a particle and is shown in figure 4. The particles
methylcellulose-uranyl acetate mixture, and were split into two subsets and resolution is
examined in a JEOL JEM-1010 electron measured by the Fourier shell correlation of
microscope. Quantification of the diameters of these two density maps. The correct hand of
IRE1a subdomain tubes and ER cisterns was the final map was determined by EMAN2. The
performed using Fiji software (47)). particles were mapped back into the cryo-
Subtomogram averaging tomogram by EMAN2 using a pKeep of 0.6.
12bioRxiv preprint doi: https://doi.org/10.1101/2021.02.24.432779; this version posted February 24, 2021. The copyright holder for this preprint
(which was not certified by peer review) is the author/funder, who has granted bioRxiv a license to display the preprint in perpetuity. It is made
available under aCC-BY 4.0 International license.
Model prediction multiple line plots across each subdomain
cross section. The resulting averaged plates
A schematic illustrating the model building
were subsequently aligned and averaged as
process has been included in Fig. S11. SWISS-
shown in Fig. 3C. Quantification of radii of
MODEL was used to predict the human active
curvature was performed by dividing IRE1α
form of IRE1α, based on the human sequence
subdomain tubes clearly visible in XY planes
and the S. cerevisiae IRE1-LD crystal structure
into tiling 25 nm segments, excluding
(PDB:2BE1) as a template. To prepare the
junctions. Circles with diameters in increments
template for SWISS-MODEL, the missing
of 50 nm were then manually fitted to each
loops in the crystal structure were built using
segment to yield estimates of the radius of
Modeller in Chimera (50).
curvature. N = 274.
Dimer-dimer interface generation
Calculations
Two predicted model IRE1α dimers were Calculations of IRE1 domain concentration
superimposed onto the S. cerevisiae IRE1-LD assumes IRE1α subdomain tubes to be perfect
crystal structure dimer-dimer in Chimera. The cylinders of 28.3 nm diameter measured from
S. cerevisiae IRE1-LD crystal structure dimer- membrane centers with a membrane thickness
dimer was then omitted, leaving a gap between of 37.5 Å (51). Each 100 nm segment of such
the two predicated human IRE1α dimers. A cylinder contains 139 IRE1-LD monomers,
new interface was modelled in Chimera by approximated from a pitch of 173 Å with 24
translating one dimer along one axis until the monomers per turn. The volume occupied by
gap was filled. To accommodate the new IRE1α-LD is calculated by using a
dimer-dimer interface in the double-helical glycosylated MW of 49196 g/mol and a
map, the angle between the two dimers was density of 1.35 g/mL (52), yielding a volume
made more acute to approximately 45° (the rise of 8.41 X 10³ nm3 occupied by 139 IRE1-LD
of the helix). The resulting dimer was then monomers and 3.87 X 10⁴ nm3 void volume. In
placed into the map using the fit-to-map this void volume, a single substrate molecule
function in Chimera. The remainder of the has a concentration of 43 µM. IRE1 density
helix was then built whilst maintaining the fold change upon stress are approximated from
same dimer-dimer interface throughout the 139 monomer per 0.008890 µM2 and
helix. contrasting to earlier calculations (25). IRE1-
Quantifications LD concentration is extracted from the
molarity of 139 units as 2.31 x 10⁻²² mole /
IRE1α subdomain tube diameters were 4.7144* 10-20 L. IRE1 cytosolic domain
measured by drawing lines between the center concentrations are estimated from the
of each membrane density perpendicular to approximate volume experienced by this
tube membranes. Regions less than 30 nm domain (1.05X10⁶ nm3 which assumes the
away from a junction are excluded. Tube domain extends 44 nm from the membrane due
diameters for 12 representative tomograms to a stretched cytosolic linker + KR domain
were quantified as 409 measurements. height from crystal structures). The fold
Distributions of immunogold particles shown compaction for the KR domain from full
in Fig. 2 were generated by manually distribution along cylindrical tubes to a flat ER
extracting the X-Y coordinates of each gold membrane compares the experienced volume
particle and using a python script to measure between a hollow cylinder as above and a
all pairwise distances and plotting the distance column trapezoid with a volume of 2.49X10⁵
distribution. Line intensity plots shown in Fig. nm3, which yielded the ~4 fold increase.
3 were generated by averaging and aligning
13bioRxiv preprint doi: https://doi.org/10.1101/2021.02.24.432779; this version posted February 24, 2021. The copyright holder for this preprint
(which was not certified by peer review) is the author/funder, who has granted bioRxiv a license to display the preprint in perpetuity. It is made
available under aCC-BY 4.0 International license.
References autophosphorylation complex and implications for the
unfolded protein response. EMBO J. 30, 894–905 (2011).
1. A. Helenius, T. Marquardt, I. Braakman, The 16. R. Volmer, K. van der Ploeg, D. Ron, Membrane lipid
endoplasmic reticulum as a protein-folding compartment. saturation activates endoplasmic reticulum unfolded protein
Trends Cell Biol. 2, 227–231 (1992). response transducers through their transmembrane domains.
2. G. E. Karagöz, D. Acosta-Alvear, P. Walter, The Proc Natl Acad Sci U S A. 110, 4628–4633 (2013).
Unfolded Protein Response: Detecting and Responding to 17. K. Halbleib, K. Pesek, R. Covino, H. F. Hofbauer, D.
Fluctuations in the Protein-Folding Capacity of the Wunnicke, I. Hänelt, G. Hummer, R. Ernst, Activation of the
Endoplasmic Reticulum. Cold Spring Harb Perspect Biol. 11 Unfolded Protein Response by Lipid Bilayer Stress. Mol Cell.
(2019), doi:10.1101/cshperspect.a033886. 67, 673-684.e8 (2017).
3. K. Mori, W. Ma, M. J. Gething, J. Sambrook, A 18. M. Calfon, H. Zeng, F. Urano, J. H. Till, S. R. Hubbard,
transmembrane protein with a cdc2+/CDC28-related kinase H. P. Harding, S. G. Clark, D. Ron, IRE1 couples endoplasmic
activity is required for signaling from the ER to the nucleus. reticulum load to secretory capacity by processing the XBP-1
Cell. 74, 743–756 (1993). mRNA. Nature. 415, 92–96 (2002).
4. J. S. Cox, C. E. Shamu, P. Walter, Transcriptional 19. J. Hollien, J. S. Weissman, Decay of endoplasmic
induction of genes encoding endoplasmic reticulum resident reticulum-localized mRNAs during the unfolded protein
proteins requires a transmembrane protein kinase. Cell. 73, response. Science. 313, 104–107 (2006).
1197–1206 (1993). 20. D. Bae, K. A. Moore, J. M. Mella, S. Y. Hayashi, J.
5. I. Tabas, D. Ron, Integrating the mechanisms of Hollien, Degradation of Blos1 mRNA by IRE1 repositions
apoptosis induced by endoplasmic reticulum stress. Nat Cell lysosomes and protects cells from stress. J Cell Biol. 218,
Biol. 13, 184–190 (2011). 1118–1127 (2019).
6. J. H. Lin, H. Li, D. Yasumura, H. R. Cohen, C. Zhang, 21. T. Aragón, E. van Anken, D. Pincus, I. M. Serafimova,
B. Panning, K. M. Shokat, M. M. Lavail, P. Walter, IRE1 A. V. Korennykh, C. A. Rubio, P. Walter, Messenger RNA
signaling affects cell fate during the unfolded protein response. targeting to endoplasmic reticulum stress signalling sites.
Science. 318, 944–949 (2007). Nature. 457, 736–740 (2009).
7. M. Lu, D. A. Lawrence, S. Marsters, D. Acosta-Alvear, 22. H. Li, A. V. Korennykh, S. L. Behrman, P. Walter,
P. Kimmig, A. S. Mendez, A. W. Paton, J. C. Paton, P. Walter, Mammalian endoplasmic reticulum stress sensor IRE1 signals
A. Ashkenazi, Opposing unfolded-protein-response signals by dynamic clustering. Proc Natl Acad Sci U S A. 107, 16113–
converge on death receptor 5 to control apoptosis. Science. 16118 (2010).
345, 98–101 (2014). 23. J. J. Credle, J. S. Finer-Moore, F. R. Papa, R. M. Stroud,
8. T.-K. Chang, D. A. Lawrence, M. Lu, J. Tan, J. M. P. Walter, On the mechanism of sensing unfolded protein in
Harnoss, S. A. Marsters, P. Liu, W. Sandoval, S. E. Martin, A. the endoplasmic reticulum. Proc Natl Acad Sci U S A. 102,
Ashkenazi, Coordination between Two Branches of the 18773–18784 (2005).
Unfolded Protein Response Determines Apoptotic Cell Fate. 24. J. Zhou, C. Y. Liu, S. H. Back, R. L. Clark, D. Peisach,
Mol Cell. 71, 629-636.e5 (2018). Z. Xu, R. J. Kaufman, The crystal structure of human IRE1
9. C. Hetz, K. Zhang, R. J. Kaufman, Mechanisms, luminal domain reveals a conserved dimerization interface
regulation and functions of the unfolded protein response. Nat required for activation of the unfolded protein response. Proc
Rev Mol Cell Biol. 21, 421–438 (2020). Natl Acad Sci U S A. 103, 14343–14348 (2006).
10. X. Z. Wang, H. P. Harding, Y. Zhang, E. M. Jolicoeur, 25. A. V. Korennykh, P. F. Egea, A. A. Korostelev, J.
M. Kuroda, D. Ron, Cloning of mammalian Ire1 reveals Finer-Moore, C. Zhang, K. M. Shokat, R. M. Stroud, P.
diversity in the ER stress responses. EMBO J. 17, 5708–5717 Walter, The unfolded protein response signals through high-
(1998). order assembly of Ire1. Nature. 457, 687–693 (2009).
11. C. Sidrauski, P. Walter, The transmembrane kinase 26. D. Ricci, I. Marrocco, D. Blumenthal, M. Dibos, D.
Ire1p is a site-specific endonuclease that initiates mRNA Eletto, J. Vargas, S. Boyle, Y. Iwamoto, S. Chomistek, J. C.
splicing in the unfolded protein response. Cell. 90, 1031–1039 Paton, A. W. Paton, Y. Argon, Clustering of IRE1α depends
(1997). on sensing ER stress but not on its RNase activity. The FASEB
12. A. Bertolotti, Y. Zhang, L. M. Hendershot, H. P. Journal. 33, 9811–9827 (2019).
Harding, D. Ron, Dynamic interaction of BiP and ER stress 27. V. Belyy, N.-H. Tran, P. Walter, Quantitative
transducers in the unfolded-protein response. Nat Cell Biol. 2, microscopy reveals dynamics and fate of clustered IRE1α.
326–332 (2000). Proc Natl Acad Sci USA. 117, 1533–1542 (2020).
13. B. M. Gardner, P. Walter, Unfolded proteins are Ire1- 28. S. Asano, B. D. Engel, W. Baumeister, In Situ Cryo-
activating ligands that directly induce the unfolded protein Electron Tomography: A Post-Reductionist Approach to
response. Science. 333, 1891–1894 (2011). Structural Biology. J Mol Biol. 428, 332–343 (2016).
14. G. E. Karagöz, D. Acosta-Alvear, H. T. Nguyen, C. P. 29. S. D. Carter, J. I. Mamede, T. J. Hope, G. J. Jensen,
Lee, F. Chu, P. Walter, An unfolded protein-induced Correlated cryogenic fluorescence microscopy and electron
conformational switch activates mammalian IRE1. Elife. 6 cryo-tomography shows that exogenous TRIM5α can form
(2017), doi:10.7554/eLife.30700. hexagonal lattices or autophagy aggregates in vivo. PNAS.
15. M. M. U. Ali, T. Bagratuni, E. L. Davenport, P. R. 117, 29702–29711 (2020).
Nowak, M. C. Silva-Santisteban, A. Hardcastle, C. 30. W. F. Tivol, A. Briegel, G. J. Jensen, An improved
McAndrews, M. G. Rowlands, G. J. Morgan, W. Aherne, I. cryogen for plunge freezing. Microsc Microanal. 14, 375–379
Collins, F. E. Davies, L. H. Pearl, Structure of the Ire1 (2008).
14You can also read