Using viral load and epidemic dynamics to optimize pooled testing in resource-constrained settings
←
→
Page content transcription
If your browser does not render page correctly, please read the page content below
RESEARCH ARTICLES

                                                                                                                     Cite as: B. Cleary et al., Sci. Transl. Med.
                                                                                                                         10.1126/scitranslmed.abf1568 (2021).
CORONAVIRUS

Using viral load and epidemic dynamics to optimize pooled
testing in resource-constrained settings
Brian Cleary1*†, James A. Hay2,3*†, Brendan Blumenstiel1, Maegan Harden1, Michelle Cipicchio1, Jon Bezney1,
Brooke Simonton1, David Hong4, Madikay Senghore2, Abdul K. Sesay5, Stacey Gabriel1, Aviv Regev6,7,8*‡, Michael
J. Mina1,2,3,9*
1Broad Institute of MIT and Harvard, Cambridge, MA 02142 USA. 2Centre for Communicable Disease Dynamics, Department of Epidemiology, Harvard T.H. Chan School of

Public Health, Boston, MA, 02115 USA. 3Department of Immunology and Infectious Diseases, Harvard T.H. Chan School of Public Health, Boston, MA, 02115 USA. 4Wharton
Statistics, University of Pennsylvania, Philadelphia, PA 19104 USA. 5Medical Research Council Unit The Gambia at London School of Hygiene and Tropical Medicine, PO Box

                                                                                                                                                                          Downloaded from http://stm.sciencemag.org/ by guest on April 17, 2021
273, Banjul, The Gambia. 6Klarman Cell Observatory, Broad Institute of MIT and Harvard, Cambridge, MA 02142 USA. 7Department of Biology, Massachusetts Institute of
Technology, Cambridge, MA 02142 USA. 8Howard Hughes Medical Institute, Chevy Chase, MD, 20815 USA. 9Department of Pathology, Brigham and Women’s Hospital,
Harvard Medical School, Boston, MA 02120, USA.
†
    These authors contributed equally to this work.
‡
 Current address: Genentech, 1 DNA Way, South San Francisco, CA, 94080 USA.
*Corresponding author. Email: bcleary@broadinstitute.org (B.C.), jhay@hsph.harvard.edu (J.A.H.), aregev@broadinstitute.org (A.R.), mmina@hsph.harvard.edu
(M.J.M.)

Virological testing is central to severe acute respiratory syndrome coronavirus 2 (SARS-CoV-2)
containment, but many settings face severe limitations on testing. Group testing offers a way to increase
throughput by testing pools of combined samples; however, most proposed designs have not yet addressed
key concerns over sensitivity loss and implementation feasibility. Here, we combined a mathematical model
of epidemic spread and empirically derived viral kinetics for SARS-CoV-2 infections to identify pooling
designs that are robust to changes in prevalence, and to ratify sensitivity losses against the time course of
individual infections. We show that prevalence can be accurately estimated across a broad range, from
0.02% to 20%, using only a few dozen pooled tests, and using up to 400 times fewer tests than would be
needed for individual identification. We then exhaustively evaluated the ability of different pooling designs
to maximize the number of detected infections under various resource constraints, finding that simple
pooling designs can identify up to 20 times as many true positives as individual testing with a given budget.
We illustrate how pooling affects sensitivity and overall detection capacity during an epidemic and on each
day post infection, finding that only 3% of false negative tests occurred when individuals are sampled
during the first week of infection following peak viral load, and that sensitivity loss is mainly attributable to
individuals sampled at the end of infection when detection for limiting transmission has minimal benefit.
Crucially, we confirmed that our theoretical results can be translated into practice using pooled human
nasopharyngeal specimens by accurately estimating a 1% prevalence among 2,304 samples using only 48
tests, and through pooled sample identification in a panel of 960 samples. Our results show that
accounting for variation in sampled viral loads provides a nuanced picture of how pooling affects sensitivity
to detect infections. Using simple, practical group testing designs can vastly increase surveillance
capabilities in resource-limited settings.

INTRODUCTION                                                                           lifted, sufficient testing of populations with meaningful cov-
   The ongoing pandemic of severe acute respiratory syn-                               erage has proven difficult. (2–7) Disruptions in the global sup-
drome coronavirus 2 (SARS-CoV-2), a novel coronavirus, has                             ply chains for testing reagents and supplies, as well as on-the-
caused over 83 million reported cases of coronavirus disease                           ground limitations in testing throughput and financial sup-
2019 (COVID-19) and 1.8 million reported deaths between De-                            port, restrict the usefulness of testing–both for identifying in-
cember 2019 and January 2021. (1) Although wide-spread vi-                             fected individuals and to measure community prevalence and
rological testing is essential to inform disease status and                            epidemic trajectory. Although these issues have been at the
where outbreak mitigation measures should be targeted or                               fore in even the highest-income countries, the situation is

First release: 22 February 2021                                          stm.sciencemag.org              (Page numbers not final at time of first release) 1
even more dire in low-income regions of the world. Cost bar- individual identification (diagnostics) and prevalence estima-
riers alone mean it is often simply not practical to prioritize tion (population surveillance). To do this, we used realistic
community testing in any useful way, with the limited testing simulated viral load data at the individual level over time,
that exists necessarily reserved for the healthcare setting. representing the entire time course of an epidemic to gener-
These limitations urge new, more efficient, approaches to ate synthetic data that reflects the true distribution of viral
testing to be developed and adopted both for individual diag- loads in the population at any given time of the epidemic. We
nostics and to enable public health epidemic control and con- then used these data to derive optimal pooling strategies for
tainment efforts. different use cases and resource constraints in-silico. In par-
Group or pooled testing offers a way to increase efficiency ticular, we show how evaluating viral loads provides substan-
by combining samples into a group or pool and testing a tial efficiency gains in prevalence estimates, enabling robust
small number of pools rather than all samples individually. public health surveillance where it was previously out of
(8–10) For classifying individual samples, including for diag- reach. Last, we demonstrate the approach using discarded de-
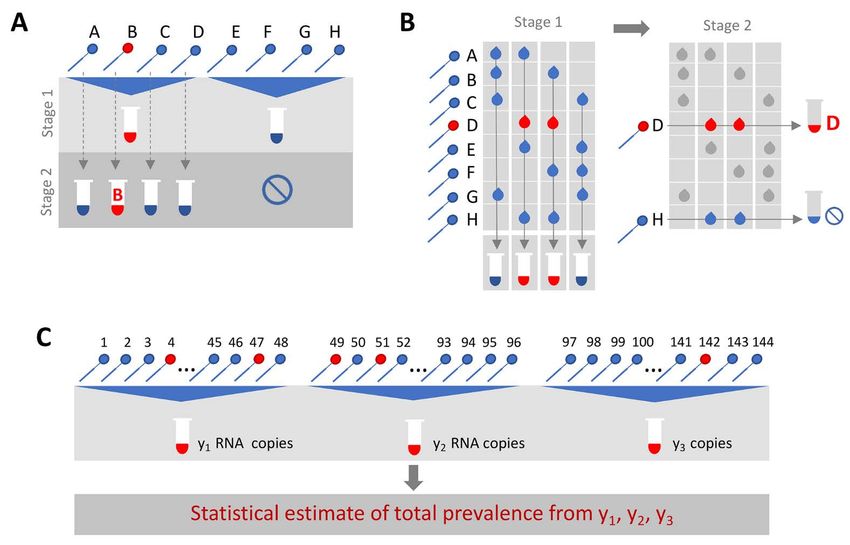
nostic testing, the principle is simple: if a pool tests negative, identified human nasopharyngeal swabs initially collected
then all of the constituent samples are assumed negative. If a for diagnostic and surveillance purposes.
Downloaded from http://stm.sciencemag.org/ by guest on April 17, 2021
pool tests positive, then the constituent samples are puta-
RESULTS
tively positive and must be tested again individually or in
mini-pools (Fig. 1A). Further efficiency gains are possible Modelling a synthetic population to assess pooling de-
through combinatorial pooling, where instead of testing signs
every sample in every positive pool, each sample is instead To identify optimal pooling strategies for distinct scenar-
represented across multiple pools and potential positives are ios, we required realistic estimates of viral loads across epi-
identified based on the pattern of pooled results (Fig. 1B). (9, demic trajectories. We developed a population-level
10) mathematical model of SARS-CoV-2 transmission that incor-
Simple pooling designs can also be used to assess preva- porates empirically measured within-host virus kinetics, and
lence without individual specimen identification (Fig. 1C). It used the model to simulate population-level viral load distri-
has already been shown that the frequency of positive pools butions representing real data sampled from population sur-
can allow estimation of the overall prevalence. (11) However, veillance, either using nasopharyngeal swab or sputum
we ask here if prevalence estimates can be honed by consid- samples (Fig. 2). These simulations generated a synthetic, re-
ering quantitative viral loads measured in each positive pool, alistic epidemic with a peak daily per incidence of 19.5 per
rather than simply using binary (positive / negative) results, 1,000 people, and peak daily prevalence of RNA positivity (vi-
where the viral RNA load measurement from a pool is pro- ral load greater than 100 virus RNA copies per ml) of 265 per
portional to the sum of the diluted viral loads from each pos- 1,000 (Fig. 2D). We used these simulation data to evaluate
itive sample in the pool. An extreme, albeit less precise, optimal group testing strategies at different points along the
example of this is the quantitation of viral loads in epidemic curve for diagnostic as well as public health surveil-
wastewater as a metric for whole community prevalence. (12) lance, where the true viral loads in the population are known
Although the literature on theoretically optimized pooling fully.
designs for COVID-19 testing has grown rapidly, formal in- Improved testing efficiency for estimating prevalence
corporation of biological variation (such as viral loads) or We developed a statistical method to estimate prevalence
general position along the epidemic curve has received little of SARS-CoV-2 based on cycle threshold (Ct) values measured
attention. (13–16) Crucially, test sensitivity is not a fixed from pooled samples, potentially using far fewer tests than
value, but depends on viral load, which can vary by many or- would be required to assess prevalence based on number of
ders of magnitudes across individuals and over the course of positive samples identified. We used our synthetic viral load
an infection, with implications for appropriate intervention data to assess inferential accuracy under a range of sample
and the interpretation of a viral load measurement from a availabilities and pooling designs. Because RNA extraction
sample pool. (17–19) Further, the distribution of viral loads in and PCR efficiency can vary from lab to lab depending on the
surveillance testing is also sensitive to the course in the epi- methods used, and within lab from batch to batch, we intro-
demic (growth versus decay) which will thus also affect the duced substantial variability in our simulations in the con-
measured test sensitivity. (20) version from viral load to Ct value to capture the multiple
Here, we comprehensively evaluated designs for pooled levels of uncertainty. In practice, this uncertainty can be re-
testing of SARS-CoV-2 while accounting for epidemic dynam- fined by focusing on a single assay within a single lab.
ics and variation in viral loads arising from viral kinetics and Across the spectrum of simulated pools and tests we
extraneous features such as sampling variation. We demon- found that simple pooling allows accurate estimates of prev-
strate efficient, logistically feasible pooling designs for alence across at least four orders of magnitude, ranging from
First release: 22 February 2021 stm.sciencemag.org (Page numbers not final at time of first release) 2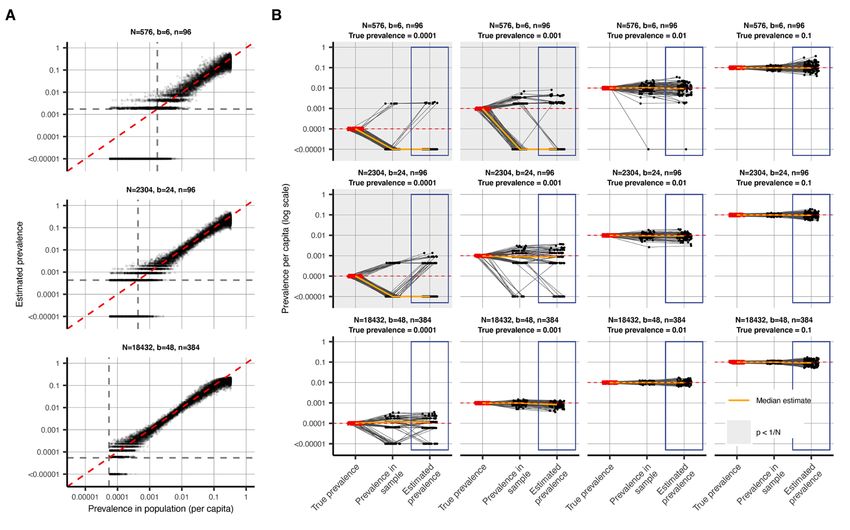
0.02% to 20%, with up to 400-times efficiency gains (in other         pooling, the number of pools that each sample is placed into
words, 400 times fewer tests) for prevalence estimation than          (fig. S3A-C).
would be needed without pooling (Fig. 3). For example, in a               There is a less intuitive relationship between sensitivity
population prevalence study that collects ~2,000 samples, we          and prevalence as it changes over the course of the epidemic.
accurately estimated infection prevalences as low as 0.05% by         Early in an epidemic there is an initial dip in sensitivity for
using only 24 qPCR tests overall (24 pools of 96 samples each;        both individual and pooled testing (Fig. 4A). Early on during
Fig. 3A; fig. S1). Because the distribution of Ct values may dif-     exponential growth of an outbreak, in a random sample of
fer depending on the sample type (sputum vs. swab), the in-           infected individuals, a relatively greater fraction of positives
strument, and the phase of the epidemic (growth vs. decline,          will be sampled early in their infection and thus closer to
fig. S2), the method should be calibrated in practice to viral        their peak viral load. Later on, there is an increasing mixture
load data (Ct values) specific to the laboratory and instru-          of newly infected with individuals at the tail end of their in-
ment as well as the population under investigation.                   fections, and thus with lower viral loads at the time of sam-
    Estimation error arises in two stages: sample collection          pling. We found that as a result, sensitivity of pooled testing
effects, and as part of the inference method (Fig. 3B). Error         increases at peak prevalence because samples with lower vi-

                                                                                                                                           Downloaded from http://stm.sciencemag.org/ by guest on April 17, 2021
from sample collection became less important with increas-            ral loads, which would otherwise be missed due to dilution,
ing numbers of positive samples, which occurred with in-              are more likely to be ‘rescued’ by coexisting in the same pool
creasing population prevalence or by increasing the total             with high viral load samples and thus ultimately get individ-
number of tested samples (Fig. 3B; fig. S2). At very low prev-        ually retested (at their undiluted or less diluted concentra-
alence, small sample sizes (N) risk missing positives alto-           tion) during the validation stage. During epidemic decline,
gether or becoming biased by false positives. We found that           fewer new infections arose over time in our simulated data
accuracy in prevalence estimation was greatest when popula-           and therefore a randomly selected infected individual was
tion prevalence is greater than 1/N and that when this condi-         more likely to be sampled during the recovery phase of their
tion was met, partitioning samples into more pools always             infection, when viral loads are lower (fig. S4D). Overall sensi-
improved accuracy (fig. S2). In summary, very accurate esti-          tivity is therefore lower during epidemic decline, as more in-
mates of prevalence can be attained using only a small frac-          fected individuals have viral loads below the limit of
tion of the tests that would be needed in the absence of              detection. During epidemic growth (up to day 108 in the sim-
pooling.                                                              ulation), we found that overall sensitivity of RT-PCR for indi-
Pooled testing for individual identification                          vidual testing was 85%, whereas during epidemic decline
    We next analyzed effectiveness of group testing for iden-         (from day 168 onward) it was 60% (fig. S5A). Mean sensitivity
tifying individual sample results at different points along the       of RT-PCR for individual testing was ~75% across the whole
epidemic curve with the aim of identifying simple, efficient          epidemic. We note that in practice, sensitivity is likely higher
pooling strategies that are robust across a range of preva-           than estimated here, because individuals are not sampled en-
lences (Fig. 1A,B). Using the simulated viral load data, we           tirely at random but instead tend to be enriched with symp-
evaluated a large array of pooling designs in silico (table S1).      tomatic people sampled nearer to peak viral loads. Together,
Based on our models of viral kinetics and given a PCR limit           these results describe how sensitivity is affected by the com-
of detection of 100 viral copies per ml, we first estimated a         bination of epidemic dynamics, viral kinetics, and pooling de-
baseline sensitivity of conventional (non-pooled) PCR testing         sign when individuals are sampled randomly from the
of 85% during the epidemic growth phase: 15% of the time we           population.
sampled an infected individual with a viral load greater than             We found that on average most false negatives arose in
1 but below the LOD of 100 viral copies per mL, (Fig. 4A),            our simulations from individuals sampled seven days or more
which largely agrees with reported estimates. (21, 22) This es-       after their peak viral loads, or around seven days after what
timate reflects sampling during the latent period of the virus        is normally considered symptom onset: these samples ac-
(after infection but prior to significant viral growth) or in the     counted for ~75% of false negatives in swab samples collected
relatively long duration of low viral titers during viral clear-      during epidemic growth, and ~96% in swab samples during
ance.                                                                 epidemic decline. This reflects that the majority of time spent
    Sensitivity of pooled tests, relative to individual testing, is   in the PCR positive state is usually post-infectious, and the
affected by the dilution factor of pooling and by the popula-         asymmetry highlights differences in prevalence of more re-
tion prevalence – with lower prevalence resulting in generally        cent versus older infections during epidemic growth versus
lower sensitivity as positives are diluted into many negatives        decay. Only ~3% of false negative swab samples arose from
(Fig. 4A). The decrease in sensitivity is roughly linear with         individuals tested during the first week following peak viral
the log of the dilution factor employed, which largely depends        load during epidemic growth, and only ~1% during epidemic
on the number and size of the pools and, for combinatorial            decline – (peak titers usually coincide with symptom onset,

First release: 22 February 2021                           stm.sciencemag.org       (Page numbers not final at time of first release)   3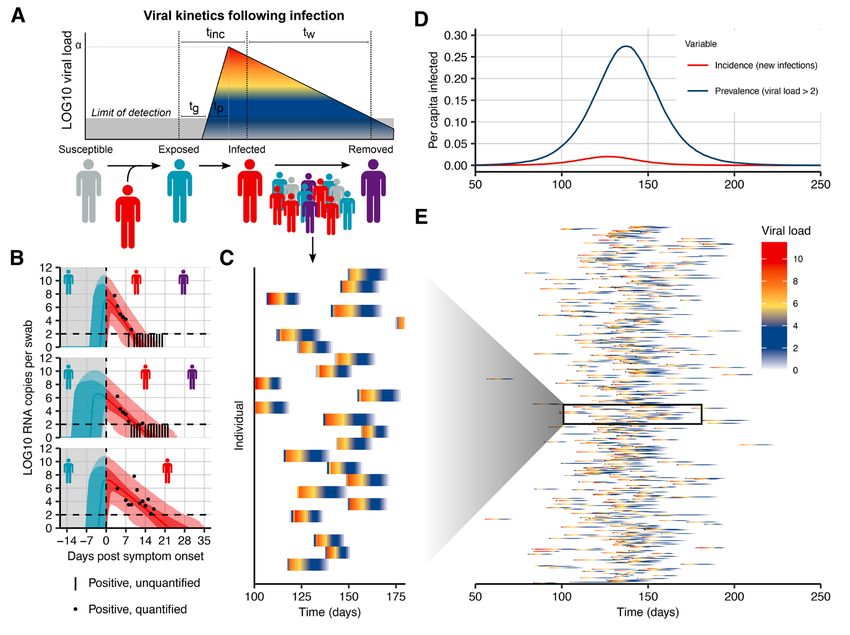
as reflected in our simulation) – and thus most false negatives    very similar (for example, using the same number of samples
were from individuals with the least risk of onward transmis-      and pools, but a different number of pools per sample; fig.
sion (fig. S3D,E). (19)                                            S7). Furthermore, we evaluated the same strategies during a
    The lower sensitivity of dilutional pooled testing is coun-    50-day window of epidemic decline (days 190-250) and found
terbalanced by gains in efficiency. When prevalence is low,        that similar pooling strategies were optimally effective, de-
efficiency is roughly the number of samples divided by the         spite lower overall sensitivity as described above (fig. S5).
number of pools, as there are rarely putative positives to test    Pooled testing in a sustained, multi-wave epidemic
individually. However, the number of validation tests re-              Modeling the time evolution of viral load distributions
quired will increase as prevalence increases, and designs that     and prevalence in sustained or multiple epidemic phases is
are initially more efficient will lose efficiency (Fig. 4B). In    important to understanding realistic performance of pooled
general, we found that at very low population prevalence the       testing for SARS-CoV-2 and other respiratory viral diseases.
use of fewer pools each with larger numbers of specimens of-       Building on our results above, we next simulated an epidemic
fers relative efficiency gains compared to larger numbers of       with an initial wave, followed by a decline phase and subse-
smaller pools, as the majority of pools will test negative. How-   quently another growth phase (fig. S8A).

                                                                                                                                        Downloaded from http://stm.sciencemag.org/ by guest on April 17, 2021
ever, as prevalence increases, testing a greater number of             Using this simulated epidemic, we first assessed how
smaller pools pays off as more validations will be performed       pooled testing for prevalence estimation would be affected by
on fewer samples overall (Fig. 4B). For combinatorial designs      multiple waves. Because the results for a single epidemic
with a given number of total samples and pools, splitting          peak (fig. S2) demonstrated that it is best to match training
each sample across fewer pools resulted in modest efficiency       data for calibrating viral load distributions with the same
gains (dashed versus solid lines in Fig. 4B).                      phase in which the distributions will be used to estimate
    To address realistic resource constraints, we integrated       prevalence that is, to match training data from growth phase
our analyses of sensitivity and efficiency with limits on daily    with application during growth phase, and decline with de-
sample collection and testing capacity to maximize the num-        cline), we asked if viral loads observed during a first wave of
ber of positive individuals identified. We analyzed the total      epidemic growth are appropriate training data for prevalence
number of samples screened and the fold increase in the            estimation during a second growth phase. We found that
number of positive samples identified relative to individual       models using either training phase had low, nearly identical,
testing for a wide array of pooling designs evaluated over a       degrees of error when predicting prevalence in the second
period of 50 days during epidemic spread (days 40-90 where         growth phase (fig. S8B).
point prevalence reaches ~2.5%; Fig. 4C,D). Because preva-             We next evaluated pooled testing for sample identification
lence changes over time, the number of validation tests may        under the two-wave epidemic model. Our results above
vary each day despite constant pooling strategies. Thus, tests     demonstrated a difference in sensitivity between growth and
saved on days requiring fewer validation tests can be stored       decline in a single-wave epidemic, driven by a shift in the vi-
for days where more validation tests are required.                 ral load distribution sampled on any given day, which is in
    Across all resource constraints considered, we found that      turn driven by viral kinetics and a shifting bias in the time
effectiveness ranged from one (when testing every sample in-       relative to infection at which individuals are sampled (20). In
dividually is optimal) to 20 (that is, identifying 20x more pos-   an epidemic model with two waves there is a dip in sensitivity
itive samples on a daily basis compared with individual            over the transition from the first growth to decline phase, fol-
testing within the same budget; Fig. 4D). As expected, when        lowed by a rise in sensitivity during the second growth phase
capacity to collect samples exceeds capacity to test, group        (fig. S9A). The reduction in sensitivity for pooled testing com-
testing becomes increasingly effective. Simple pooling de-         pared to individual testing is relatively consistent across epi-
signs were most effective when samples are in moderate ex-         demic time for any given pooling design, demonstrating
cess of testing capacity (2-8x), whereas increasingly complex      robustness to more complicated epidemic dynamics. Moreo-
combinatorial designs became the most effective when the           ver, the changes in sensitivity are quantitative reflections of
number of samples to be tested greatly exceeded testing ca-        growth rate, so that the lower growth rate of the second
pacity. Additionally, when prevalence was higher (sample           growth phase results in a lower sensitivity than the first
prevalence from 1.03% to 9.90%), the optimal pooling designs       phase, due to more samples being from individuals with
shifted toward combinatorial pooling, and the overall effec-       lower viral loads (fig. S9A).
tiveness decreased – but still remained up to 4x more effec-           The model also allowed us to assess any impacts on sam-
tive than individual testing (fig. S6). Our results were           ple identification resulting from different epidemic dynamics
qualitatively unchanged when evaluating the effectiveness of       in each period, for example during initial epidemic growth
pooling sputum samples, and the optimal pooling designs un-        with a high basic reproductive number (2.5) and a large sus-
der each set of sample constraints were either the same or         ceptible population, compared with a second growth phase

First release: 22 February 2021                         stm.sciencemag.org      (Page numbers not final at time of first release)   4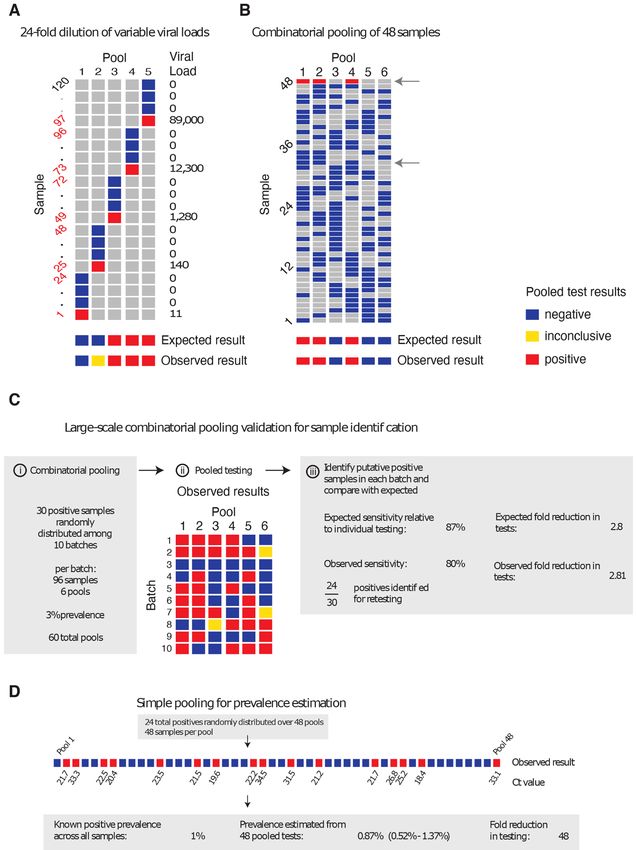
with smaller basic reproductive number (1.5) and a smaller         plates, then delivered to our lab for pooling. Many of these
susceptible population (due to past infections). We found          samples went through multiple freeze-thaw cycles, likely
that pooled testing for sample identification remained advan-      leading to degradation of some viral RNA, which may have
tageous throughout the modeled time series, with very simi-        contributed to the reduced sensitivity that we observed rela-
lar optimal pooling strategies under the same array of             tive to predicted levels.
resource constraints considered above (fig. S9B,C). Together,          To further validate our methods for prevalence estima-
these results demonstrate generalizability to sustained or         tion, we created a large study representing 2,304 samples
multiple wave epidemics, and robustness to changes in viral        with a (true) positive prevalence of 1%. We aimed to deter-
load distributions from different epidemic growth rates.           mine how well our methods would work to estimate the true
Pilot and validation experiments                                   prevalence using 1/48th the number of tests compared to test-
    We validated our pooling strategies using anonymized           ing samples individually. To do this, we randomly assigned
clinical nasopharyngeal swab specimens. To evaluate simple         24 distinct positive samples into 48 pools, with each pool con-
pooling across a range of inputs, we diluted 5 nasopharyngeal      taining 48 samples (table S3; to create the full set of pools,
clinical swab samples with viral loads of 89000, 12300, 1280,      we treated some known negatives as distinct samples across

                                                                                                                                        Downloaded from http://stm.sciencemag.org/ by guest on April 17, 2021
140, and 11 viral RNA copies per ml, respectively, into 23 neg-    separate pools). By using the measured viral loads detected
ative nasopharyngeal swab samples (pools of 24). The results       in each of the pools, our methods estimated a prevalence of
matched the simulated sampling results: the first three pools      0.87% (compared to the true prevalence of 1%) with a boot-
were all positive, the fourth was inconclusive (negative on N1,    strapped 95% confidence interval of 0.52% - 1.37% (Fig. 5D),
positive on N2), and the remaining pool was negative (Fig.         and did so using 48x fewer tests than without pooling. This
5A, table S2). These results are as expected because the Emer-     degree of accuracy was in line with our expectations from our
gency Use Authorization (EUA)-approved assay used has a            simulations. Notably, the inference algorithm applied to
limit of detection of ~100 virus copies per ml, such that the      these data used viral load distributions calibrated from our
last two specimens fell below the limit of detection given a       simulated epidemic, which in turn had viral kinetics cali-
dilution factor of 24 (0.46 and 5.8 virus copies per ml once       brated to samples collected and tested on another continent,
pooled).                                                           demonstrating robustness of the training procedure.
    We next tested combinatorial pooling, first using only a       DISCUSSION
modest pooling design. We split 48 samples, including 1 pos-           Our results show that group testing for SARS-CoV-2 can
itive sample with a viral load of 12,300, into 6 pools with each   be a highly effective tool to increase surveillance coverage
sample spread across three different pools. The method cor-        and capacity when resources are constrained. For prevalence
rectly identified the three pools containing the positive spec-    testing, we found that fewer than 40 tests can be used to ac-
imen (Fig. 5B, table S2). One negative sample was included in      curately infer prevalences across four orders of magnitude,
the same 3 pools as the positive sample; thus, 8 total tests (6    providing large savings on the number of tests required. For
pools + 2 validations) were needed to accurately identify the      individual identification, we determined an array of designs
status of all 48 samples, a 6x efficiency gain, which matched      that optimize the rate at which infected individuals were
our expectations from the simulations.                             identified under constraints on sample collection and daily
    We next performed two larger validation studies. To vali-      test capacities. These results provide pooling designs that
date combinatorial pooling, we used anonymized samples             maximize the number of positive individuals identified on a
representing 930 negative and 30 distinct positive specimens       daily basis, while accounting for epidemic dynamics, viral ki-
(3.1% prevalence), split across 10 batches of 96 specimens         netics, viral loads measured from nasopharyngeal swabs or
each (table S3). For each batch of 96, we split the specimens      sputum, and practical considerations of laboratory capacity.
into 6 pools and each specimen was spread across 2 pools               Although our experiments suggest that pooling designs
(Fig. 5C; see table S4 for sample allocation and table S6 for      may be beneficial for SARS-CoV-2 surveillance and identifi-
pooled test results). For this combinatorial pooling design        cation of individual specimens, there are substantial logisti-
and prevalence, our simulations suggested that we would ex-        cal challenges to implementing theoretically optimized
pect to identify ~26 out of 30 known positives (~87%) and          pooling designs. Large-scale testing without the use of pool-
would see a 2.81x efficiency gain – using only 35% of the num-     ing already requires managing thousands of specimens per
ber of tests compared to no pooling. We identified 24 of the       day, mostly in series. Pooling adds complexity because sam-
30 known positives (80%) and, indeed, required 35% fewer           ples must be tracked across multiple pools and stored for po-
tests (341 vs 960, a 2.8x efficiency gain). Regarding the          tential re-testing. These complexities can be overcome with
slightly reduced sensitivity, we note that positive samples and    proper tracking software (including simple spreadsheets)
negative samples were accumulated over a longer period of          and standard operating procedures in place before pooling
time by the Broad’s testing facility, aggregated into separate     begins. Such procedures can mitigate the risk of handling

First release: 22 February 2021                         stm.sciencemag.org      (Page numbers not final at time of first release)   5
error or specimen mix-up. handled separately). With individual testing, effectively 20.4
In addition, expecting laboratories to regularly adapt their individuals (24 available tests * 85% sensitivity) would be
workflow and optimize pool sizes based on prevalence may screened per day. On the other hand, with the pooling strat-
not be feasible in some settings. (8, 15) A potential solution is egy identified under these constraints (N=192, b=12, q=3),
to follow a simple, fixed protocol that is robust to a range of one could effectively screen 202.57 individuals per day, on av-
prevalences. We provide an example spreadsheet (data file erage (192 individuals screened per batch * 68% sensitivity *
S1) guiding a technician receiving 96 labeled samples to cre- average of 1.55 batches run per day). Therefore, despite sub-
ate 6 pools, enter the result of each pool, and be provided a stantially reduced sensitivity, the pooling strategy would
list of putative positives to be retested. identify about 10x as many infected individuals. Given the
For certain viscous sample types (for example saliva or unused technician capacity, the logistical cost (in our experi-
sputum) the process of pooling samples may be challenging. ence it takes one person ~1.5 hours to pool 192 samples by
Whereas robotic pooling with small volumes of viscous sam- hand in an unoptimized workflow, though there are other
ples is error-prone, manual pipetting can be reliable. Our de- costs to consider) is very likely outweighed by the positive
signs can accommodate both robotic or manual pipetting, benefits on infection control.
Downloaded from http://stm.sciencemag.org/ by guest on April 17, 2021
though pooling may still be a challenge for viscous samples Furthermore, the specimens most likely to be lost due to
compared to swabs in viral transport media or similar. In dilution are those samples with the lowest viral loads already
these cases, pre-treating samples with proteinase K can addi- near the limit of detection. Although there is a chance that
tionally make samples easier to pipette (as is done with Sali- the low viral load samples missed are on the upswing of an
vaDirect) and increase retention of viral RNA by degrading infection – when identifying the individual would be maxi-
nucleases. (23) Overall, our results are largely applicable to a mally beneficial – the asymmetric course of viral titers over
variety of sampling landscapes in which viral loads are deter- the full duration of positivity means that most false negatives
mined. However, individual laboratories will of course need would arise from failure to detect late-stage, low-titer indi-
to determine which approach is best suited for their own pur- viduals who are less likely to be infectious. (19) Optimal strat-
poses. egies and expectations of sensitivity should also be
Depending on the purpose of testing and resources avail- considered alongside the phase of the epidemic and how sam-
able, enhancing efficiency at the expense of sensitivity must ples are collected, as this will dictate the distribution of sam-
be considered. We recommend validation of the selected pled viral loads. For example, if individuals are under a
pooling strategy to identify potential differences in predicted regular testing regimen, and therefore likely to be removed
versus observed sensitivity as demonstrated here, which may from the tested population before reaching the long tail of
be unacceptable if the aim is clinical testing rather than over- low viral loads at the end of infection, or are tested due to
all throughput. However, we found that the most efficient recent exposure or symptom onset, then viral loads at the
pooling designs were the same when using swab- or sputum- time of sampling will typically be higher, leading to higher
calibrated simulations, suggesting that the ideal strategies sensitivity in spite of dilution effects.
were robust to misspecification in overall sensitivity. For For individual identification, errors may arise when a pos-
prevalence testing, accurate estimates can be obtained using itive sample is split into multiple pools, but only some of
relatively few tests if individual identification is not the aim. those pools test positive (see Supplementary Materials and
For individual testing, although identifying all positive sam- Methods for an example and further discussion). For an error
ples that are tested is of course the objective, increasing the tolerance, e, error correction is possible by allowing a puta-
number of specimens tested when sacrificing sensitivity may tive positive to be in up to e negative pools, where e>0 will
be a crucially important trade-off. result in higher sensitivity but also more putative positives
As an example of how to evaluate the allocation of limited and lower efficiency. The optimal error tolerance can be de-
resources in the context of reduced sensitivity and enhanced rived analytically in terms of the independent error rate r
efficiency, consider our experience with a laboratory in The (that is, rates of PCR failure not related to low viral load, di-
Gambia. Simplifying a bit, the resource constraints being lution or other systemic effects). (24) With a conservative es-
faced were a limited capacity for sample collection (several timate of the rate of independent PCR failure, r, of(16)) have more complicated pooling designs with samples symptomatic patients. Although some features of viral trajec-
split into more pools (q=6 or more). An alternative to individ- tories, such as viral waning, differ between symptomatic and
ually testing all putative positives would be to simply re-test asymptomatic individuals, population-wide data suggest that
each pool (optionally re-pooling samples before re-testing). the range of Ct values do not differ based on symptom status.
Whether to do so or not would be a choice made by each lab, (19, 35) Furthermore, we have assumed a simple hinge func-
similar to decisions about whether to re-test samples with tion to describe viral kinetics. Different shapes for the viral
failed controls or inconclusive results. Furthermore, error kinetics trajectory may become apparent as more data be-
correction does not address the primary source of error: low come available. Nonetheless, our simulated population distri-
viral load, below the LOD and possibly due to dilution, which bution of Ct values is comparable to existing data and we
is a systemic problem affecting all pools with a given sample. propagated substantial uncertainty in viral kinetics parame-
Testing throughput and staffing resources should also be ters to generate a wide range of viral trajectories. For preva-
considered. If a testing facility can only run a limited number lence estimation, the MLE framework requires training on a
of tests per day, it may be preferable to process more samples distribution of Ct values. Such data can be available based on
at a slight cost to sensitivity. Back-logs of individual testing past tests from a given laboratory, but care should be taken
Downloaded from http://stm.sciencemag.org/ by guest on April 17, 2021
can result in substantial delays in returning individual test to use a distribution appropriate for the population under
results, which can ultimately defeat the purpose of identify- consideration. For example, training the virus kinetics model
ing individuals for isolation - potentially further justifying on data skewed toward lower viral loads (as would be ob-
some sensitivity losses. (25, 26) Choosing a pooling strategy served during the tail end of an epidemic curve) may be in-
will therefore depend on target population and availability of appropriate when the true viral load distribution is skewed
resources. For testing in the community or in existing senti- higher (as might be the case during the growth phase of an
nel surveillance populations (for example antenatal clinics), epidemic curve). Nevertheless, we used our simulated distri-
point prevalence is likely to be low (therefore be up to laboratories and policy makers to decide infection to peak, and virus decline rates across infected in-
where these designs are feasible. Substantial coordination dividuals (Fig. 2A&B; fig. S10). (18) By incorporating esti-
will therefore be necessary to make group testing practical mated biological variation in virus kinetics, this model allows
but investing in these efforts could enable community screen- random draws each representing distinct within-host virus
ing where it is currently infeasible and provide epidemiolog- trajectories. We then simulated infection prevalence during a
ical insights that are urgently needed. SARS-CoV-2 outbreak using a deterministic Susceptible-Ex-
posed-Infected-Removed (SEIR) model with parameters re-
MATERIALS AND METHODS
flecting the natural history of SARS-CoV-2 (Fig. 2D). For each
Study design simulated infection, we generated longitudinal virus titers
The aim of this study was to understand the potential ef- over time by drawing from the distribution of fitted virus ki-
fectiveness of pooled testing for SARS-CoV-2 infection identi- netic curves, using distributions derived using either naso-
fication and prevalence estimation in a population where pharyngeal swab or sputum data (fig. S4). All estimated and
prevalence and viral loads evolve over time. The study in- assumed model parameters are shown in table S5, with model
cluded both simulation-based experiments where the effec- fits shown in fig. S10. Posterior estimates and Markov chain
tiveness of different pooling strategies was evaluated against
Downloaded from http://stm.sciencemag.org/ by guest on April 17, 2021
Monte Carlo trace plots are shown in fig. S11 and fig. S12. We
known inputs, and laboratory experiments using previously accounted for measurement variation by transforming viral
tested nasopharyngeal swab specimens to validate our pro- loads into Ct values under a range of Ct calibration curves,
posed pooling designs. simulating false positives with 1% probability, and simulating
In the modeling experiments, we simulated a SARS-CoV- sampling variation. We assumed a limit of detection (LOD) of
2 outbreak in a large population roughly the size of a small 100 RNA copies / ml.
US state (12,500,000 individuals), ensuring that there were at
Estimating prevalence from pooled test results
least 100 unique infected individuals early in the epidemic at
We adapted a statistical (maximum likelihood) frame-
prevalence as low as 0.001%. For each tested pooling design
work initially developed to estimate HIV prevalence with
and day of the outbreak, we randomly sampled individuals
pooled antibody tests to estimate prevalence of SARS-CoV-2
from the simulated population to generate in silico sample
using pooled samples. (41, 42) The framework accounts for
pools with known viral loads. We repeated this sampling pro-
the distribution of viral loads (and uncertainty around them)
cess across independent trials until 2,500 positive individuals
measured in pools containing a mixture of negative and po-
had been sampled across all trials, or until 200,000 trials had
tentially positive samples. By measuring viral loads from mul-
been run.
tiple such pools, it is possible to estimate the prevalence of
In the laboratory validation trials of our pooling designs,
positive samples without individual testing.
human nasopharyngeal swab specimens with previously-de-
We evaluated prevalence estimation under a range of
termined positive or negative status were randomly assigned
sample availabilities (N total samples; N=288 to ~18,000) and
a sample ID within a validation experiment – for example,
pooling designs. We varied the pool size of combined speci-
one of 2,304 sample IDs in the large prevalence study, or one
mens (n samples per pool; n=48, 96, 192, or 384) and the
of 960 IDs in the large identification study – without regard
number of pools (b=6, 12, 24, or 48). For each combination,
for their positivity status. Once IDs were assigned, samples
we estimated the point prevalence from pooled tests on ran-
were distributed to pools according to pre-specified pooling
dom samples of individuals drawn during epidemic growth
designs. Samples with pre-determined inconclusive status
(days 20-120) and decline (days 155-300). Because the data
were not included. The study followed all relevant ethical
was realistic but simulated, we used ground truth prevalence
guidelines for the use of discarded patient specimens. An ex-
in the population and, separately, in the specific set of sam-
empt protocol for the study was approved by the Broad Insti-
ples collected from the overall population to assess accuracy
tute ORSP.
of our estimates (see for example Fig. 3B). We calculated es-
Simulation model of infection dynamics and viral load timates for 100 entirely distinct epidemic simulations.
kinetics
Pooled tests for individual sample identification
We developed a population-level mathematical model of
Using the same simulated population, we evaluated a
SARS-CoV-2 transmission that incorporates realistic within-
range of simple and combinatorial pooling strategies for in-
host virus kinetics. Full details are provided in the supple-
dividual positive sample identification. In simple pooling de-
mentary Materials and Methods, but we provide an overview
signs, each sample is placed in one pool, and each pool
here. First, we fit a viral kinetics model to published longitu-
consists of some pre-specified number of samples. If a pool
dinally collected viral load data from nasopharyngeal swab
tests positive, all samples that were placed in that pool are
and sputum samples using a Bayesian hierarchical model
retested individually (Fig. 1A). For combinatorial pooling,
that captures the variation of peak viral loads, delays from
each sample is split into multiple, partially overlapping pools
First release: 22 February 2021 stm.sciencemag.org (Page numbers not final at time of first release) 8(Fig. 1B). (9, 10) Every sample that was placed in any pool that Fig. S1. Population prevalence (left) or prevalence in sample (right) against maximum
tested negative is inferred to be negative, and the remaining likelihood prevalence estimates.
Fig. S2. Prevalence estimation can depend on training and application period.
samples are identified as potential positives. Here, we con- Fig. S3. Sensitivity of sample identification relative to dilution factor and time since
sider a very simple form of combinatorial testing, where iden- peak viral load.
tified potential positive samples are individually tested in a Fig. S4. Simulated viral loads.
validation stage. Fig. S5. Group testing for sample identification during epidemic decline.
Fig. S6. Effectiveness of optimal testing design under resource constraints at high
A given pooling design is defined by three parameters: the prevalence.
total number of individuals to be tested (N); the total number Fig. S7. Effectiveness of optimal testing design under resource constraints using
of pools to test (b); and the number of pools a given sample sputum data.
is included in (q). For instance, if we have 50 individuals (N) Fig. S8. Evaluation of pooled testing in a sustained, multi-wave epidemic.
Fig. S9. Evaluation of pooled testing for sample identification in the multi-wave
to test, we might split the 50 samples into four pools (b) of 25 epidemic shown in fig. S8A.
samples each, where each sample is included in two pools. Fig. S10. Model fits to swab viral loads.
Note that, by definition, in simple pooling designs each sam- Fig. S11. Posterior distributions of estimated parameters fitted to swab and sputum
ple is placed in one pool (q=1). data.
Fig. S12. Markov chain Monte Carlo trace plots from fitting to swab and sputum data.
Downloaded from http://stm.sciencemag.org/ by guest on April 17, 2021
To identify optimal testing designs under different re- Fig. S13 qPCR calibration curve using standard viral RNA copies.
source constraints, we systematically analyzed a large array Table S1. List of all group test designs for sample identification.
of pooling designs under various sample and test kit availa- Table S2. Cycle threshold values from qPCR on pooled samples with variable viral
bilities. We evaluated different combinations of between 12 load.
Table S3. Positive sample distribution within validation pools.
and ~6,000 available samples/tests per day. The daily testing Table S4. Pool design for combinatorial test with 96 samples.
capacity shown is the daily average, though we assume that Table S5. Description of all parameters used in the viral kinetics and transmission
there is some flexibility to use fewer or more tests day to day models.
(in other words, that there is a budget for period of time un- Table S6. RT-qPCR results for pooling validations.
Data file S1. 96-sample pooling template. (Excel)
der evaluation). References (43–45)
For each set of resource constraints, we evaluated designs
REFERENCES AND NOTES
that split N samples between 1 to 96 distinct pools, and with 1. Weekly epidemiological update - 5 January 2021 (available at
samples included in q=1 (simple pooling), 2, 3, or 4 (combi- https://www.who.int/publications/m/item/weekly-epidemiological-update---5-
natorial pooling) pools (table S1). To ensure robust estimates january-2021).
(especially at low prevalences of less than 1 in 10,000), we 2. World Health Organization (WHO), Critical preparedness, readiness and response
actions for COVID-19, World Heal. Organ. (2020).
repeated each simulated pooling protocol at each time point 3. M. P. Cheng, J. Papenburg, M. Desjardins, S. Kanjilal, C. Quach, M. Libman, S.
in the epidemic up to 200,000 times. Dittrich, C. P. Yansouni, Diagnostic Testing for Severe Acute Respiratory
In each scenario, we calculated: the sensitivity to detect Syndrome-Related Coronavirus 2: A Narrative Review. Ann. Intern. Med. 172, 726–
positive samples when they existed in the pool; the efficiency, 734 (2020). doi:10.7326/M20-1301 Medline
4. K. S. Y. Yoo JH, Chung MS, Kim JY, Ko JH, Kim Y, Kim YJ, Kim JM, Chung YS, Kim
defined as the total number of samples tested divided by the HM, Han MG, Report on the epidemiological features of coronavirus disease 2019
total number of tests used; the total number of identified true (covid-19) outbreak in the republic of korea from january 19 to march 2, 2020, J.
positives (total recall); and the effectiveness, defined as the Korean Med. Sci. (2020), doi:10.3346/jkms.2020.35.e112.
total recall relative to individual testing. 5. V. J. Lee, C. J. Chiew, W. X. Khong, Interrupting transmission of COVID-19: Lessons
from containment efforts in Singapore. J. Travel Med. 27, taaa039 (2020).
Pilot experiments doi:10.1093/jtm/taaa039 Medline
For validation experiments of our simulation-based ap- 6. D. F. Gudbjartsson, A. Helgason, H. Jonsson, O. T. Magnusson, P. Melsted, G. L.
proach, we used fully de-identified, discarded human naso- Norddahl, J. Saemundsdottir, A. Sigurdsson, P. Sulem, A. B. Agustsdottir, B.
Eiriksdottir, R. Fridriksdottir, E. E. Gardarsdottir, G. Georgsson, O. S.
pharyngeal specimens obtained from the Broad Institute of Gretarsdottir, K. R. Gudmundsson, T. R. Gunnarsdottir, A. Gylfason, H. Holm, B. O.
MIT and Harvard. In each experiment, sample aliquots were Jensson, A. Jonasdottir, F. Jonsson, K. S. Josefsdottir, T. Kristjansson, D. N.
pooled before RNA extraction and qPCR and pooled speci- Magnusdottir, L. le Roux, G. Sigmundsdottir, G. Sveinbjornsson, K. E. Sveinsdottir,
mens were tested using the EUA-approved SARS-CoV-2 assay M. Sveinsdottir, E. A. Thorarensen, B. Thorbjornsson, A. Löve, G. Masson, I.
Jonsdottir, A. D. Möller, T. Gudnason, K. G. Kristinsson, U. Thorsteinsdottir, K.
performed by the Broad Institute CLIA laboratory. qPCR cy- Stefansson, Spread of SARS-CoV-2 in the Icelandic Population. N. Engl. J. Med.
cle threshold values were calibrated to a standard curve of 382, 2302–2315 (2020). doi:10.1056/NEJMoa2006100 Medline
known viral RNA copies (fig. S13). The protocol and specifics 7. N. C. Grassly, M. Pons-Salort, E. P. K. Parker, P. J. White, N. M. Ferguson, K. Ainslie,
of each pooling approach are described in full detail in the M. Baguelin, S. Bhatt, A. Boonyasiri, N. Brazeau, L. Cattarino, H. Coupland, Z.
Cucunuba, G. Cuomo-Dannenburg, A. Dighe, C. Donnelly, S. L. van Elsland, R.
Supplementary Materials and Methods. FitzJohn, S. Flaxman, K. Fraser, K. Gaythorpe, W. Green, A. Hamlet, W. Hinsley, N.
Imai, E. Knock, D. Laydon, T. Mellan, S. Mishra, G. Nedjati-Gilani, P. Nouvellet, L.
Okell, M. Ragonnet-Cronin, H. A. Thompson, H. J. T. Unwin, M. Vollmer, E. Volz, C.
SUPPLEMENTARY MATERIALS
Walters, Y. Wang, O. J. Watson, C. Whittaker, L. Whittles, X. Xi; Imperial College
stm.sciencemag.org/cgi/content/full/scitranslmed.abf1568/DC1
COVID-19 Response Team, Comparison of molecular testing strategies for
Materials and Methods
COVID-19 control: A mathematical modelling study. Lancet Infect. Dis. 20, 1381–
First release: 22 February 2021 stm.sciencemag.org (Page numbers not final at time of first release) 91389 (2020). 10.1016/S1473-3099(20)30630-7 Medline tests: Theory, design and application. IEEE Trans. Inf. Theory 57, 7057–7067
8. R. Dorfman, The Detection of Defective Members of Large Populations. Ann. Math. (2011). doi:10.1109/TIT.2011.2148691
Stat. 14, 436–440 (1943). doi:10.1214/aoms/1177731363 25. D. B. Larremore, B. Wilder, E. Lester, S. Shehata, J. M. Burke, J. A. Hay, M. Tambe,
9. D. Du, F. K. Hwang, F. Hwang, Combinatorial group testing and its applications M. J. Mina, R. Parker, Test sensitivity is secondary to frequency and turnaround
(World Scientific, 2000). time for COVID-19 surveillance, medRxiv, 2020.06.22.20136309 (2020).
10. E. Porat, A. Rothschild, in Lecture Notes in Computer Science (including subseries 26. A. D. Paltiel, A. Zheng, R. P. Walensky, Assessment of SARS-CoV-2 Screening
Lecture Notes in Artificial Intelligence and Lecture Notes in Bioinformatics), Strategies to Permit the Safe Reopening of College Campuses in the United
(2008). States. JAMA Netw. Open 3, e2016818 (2020).
11. E. Centre for Disease Prevention, Methodology for estimating point prevalence of doi:10.1001/jamanetworkopen.2020.16818 Medline
SARS-CoV-2 infection by pooled RT-PCR testing (2020; 27. S. Riley, K. Ainslie, O. Eales, B. Jeffrey, C. Walters, C. Atchison, P. Diggle, D. Ashby,
https://www.ecdc.europa.eu/en/publications-data/methodology-estimating- C. Donnelly, G. Cooke, W. Barclay, H. Ward, G. Taylor, A. Darzi, P. Elliott,
point-prevalence-sars-cov-2-infection-pooled-rt-pcr). Community prevalence of SARS-CoV-2 virus in England during May 2020: REACT
12. F. Wu, J. Zhang, A. Xiao, X. Gu, W. L. Lee, F. Armas, K. Kauffman, W. Hanage, M. study, medRxiv, 2020.07.10.20150524 (2020).
Matus, N. Ghaeli, N. Endo, C. Duvallet, M. Poyet, K. Moniz, A. D. Washburne, T. B. 28. K. B. Pouwels, T. House, J. V Robotham, P. Birrell, A. B. Gelman, N. Bowers, I.
Erickson, P. R. Chai, J. Thompson, E. J. Alm, SARS-CoV-2 Titers in Wastewater Are Boreham, H. Thomas, J. Lewis, I. Bell, J. I. Bell, J. Newton, J. Farrar, I. Diamond, P.
Higher than Expected from Clinically Confirmed Cases. mSystems 5, e00614-20 Benton, S. Walker, Community prevalence of SARS-CoV-2 in England: Results
(2020). doi:10.1128/mSystems.00614-20 Medline from the ONS Coronavirus Infection Survey Pilot, medRxiv,
13. C. A. Hogan, M. K. Sahoo, B. A. Pinsky, Sample Pooling as a Strategy to Detect 2020.07.06.20147348 (2020).
Downloaded from http://stm.sciencemag.org/ by guest on April 17, 2021
Community Transmission of SARS-CoV-2. JAMA 323, 1967–1969 (2020). 29. E. Lavezzo, E. Franchin, C. Ciavarella, G. Cuomo-Dannenburg, L. Barzon, C. Del
doi:10.1001/jama.2020.5445 Medline Vecchio, L. Rossi, R. Manganelli, A. Loregian, N. Navarin, D. Abate, M. Sciro, S.
14. C. R. Bilder, P. C. Iwen, B. Abdalhamid, J. M. Tebbs, C. S. McMahan, Tests in short Merigliano, E. De Canale, M. C. Vanuzzo, V. Besutti, F. Saluzzo, F. Onelia, M.
supply? Try group testing. Significance (Oxford, England) 17, 15–16 (2020). Pacenti, S. G. Parisi, G. Carretta, D. Donato, L. Flor, S. Cocchio, G. Masi, A.
Medline Sperduti, L. Cattarino, R. Salvador, M. Nicoletti, F. Caldart, G. Castelli, E. Nieddu,
15. R. Ben-Ami, A. Klochendler, M. Seidel, T. Sido, O. Gurel-Gurevich, M. Yassour, E. B. Labella, L. Fava, M. Drigo, K. A. M. Gaythorpe, A. R. Brazzale, S. Toppo, M.
Meshorer, G. Benedek, I. Fogel, E. Oiknine-Djian, A. Gertler, Z. Rotstein, B. Lavi, Y. Trevisan, V. Baldo, C. A. Donnelly, N. M. Ferguson, I. Dorigatti, A. Crisanti, Z.
Dor, D. G. Wolf, M. Salton, Y. Drier; Hebrew University-Hadassah COVID-19 Cucunubá, G. Cuomo-Dannenburg, B. A. Djafaara, C. A. Donnelly, I. Dorigatti, S. L.
Diagnosis Team, Large-scale implementation of pooled RNA extraction and RT- van Elsland, R. FitzJohn, S. Flaxman, K. A. M. Gaythorpe, W. D. Green, T. Hallett, A.
PCR for SARS-CoV-2 detection. Clin. Microbiol. Infect. 26, 1248–1253 (2020). Hamlet, D. Haw, N. Imai, B. Jeffrey, E. Knock, D. J. Laydon, T. Mellan, S. Mishra, G.
doi:10.1016/j.cmi.2020.06.009 Medline Nedjati-Gilani, P. Nouvellet, L. C. Okell, K. V. Parag, S. Riley, H. A. Thompson, H. J.
16. N. Shental, S. Levy, V. Wuvshet, S. Skorniakov, B. Shalem, A. Ottolenghi, Y. T. Unwin, R. Verity, M. A. C. Vollmer, P. G. T. Walker, C. E. Walters, H. Wang, Y.
Greenshpan, R. Steinberg, A. Edri, R. Gillis, M. Goldhirsh, K. Moscovici, S. Sachren, Wang, O. J. Watson, C. Whittaker, L. K. Whittles, X. Xi, N. M. Ferguson, A. R.
L. M. Friedman, L. Nesher, Y. Shemer-Avni, A. Porgador, T. Hertz, Efficient high- Brazzale, S. Toppo, M. Trevisan, V. Baldo, C. A. Donnelly, N. M. Ferguson, I.
throughput SARS-CoV-2 testing to detect asymptomatic carriers. Sci. Adv. 6, Dorigatti, A. Crisanti; Imperial College COVID-19 Response Team; Imperial College
eabc5961 (2020). doi:10.1126/sciadv.abc5961 Medline COVID-19 Response Team, Suppression of a SARS-CoV-2 outbreak in the Italian
17. L. Zou, F. Ruan, M. Huang, L. Liang, H. Huang, Z. Hong, J. Yu, M. Kang, Y. Song, J. municipality of Vo’. Nature 584, 425–429 (2020). doi:10.1038/s41586-020-
Xia, Q. Guo, T. Song, J. He, H. L. Yen, M. Peiris, J. Wu, SARS-CoV-2 viral load in 2488-1 Medline
upper respiratory specimens of infected patients. N. Engl. J. Med. 382, 1177–1179 30. Q.-L. Jing, M.-J. Liu, Z.-B. Zhang, L.-Q. Fang, J. Yuan, A.-R. Zhang, N. E. Dean, L.
(2020). doi:10.1056/NEJMc2001737 Medline Luo, M.-M. Ma, I. Longini, E. Kenah, Y. Lu, Y. Ma, N. Jalali, Z.-C. Yang, Y. Yang,
18. R. Wölfel, V. M. Corman, W. Guggemos, M. Seilmaier, S. Zange, M. A. Müller, D. Household secondary attack rate of COVID-19 and associated determinants in
Niemeyer, T. C. Jones, P. Vollmar, C. Rothe, M. Hoelscher, T. Bleicker, S. Brünink, Guangzhou, China: A retrospective cohort study. Lancet Infect. Dis. 20, 1141–1150
J. Schneider, R. Ehmann, K. Zwirglmaier, C. Drosten, C. Wendtner, Virological (2020). 10.1016/s1473-3099(20)30471-0 Medline
assessment of hospitalized patients with COVID-2019. Nature 581, 465–469 31. W. Li, B. Zhang, J. Lu, S. Liu, Z. Chang, C. Peng, X. Liu, P. Zhang, Y. Ling, K. Tao, J.
(2020). doi:10.1038/s41586-020-2196-x Medline Chen, The characteristics of household transmission of COVID-19. Clin. Infect. Dis.
19. M. Cevik, M. Tate, O. Lloyd, A. E. Maraolo, J. Schafers, A. Ho, SARS-CoV-2, SARS- 71, 1943–1946 (2020). 10.1093/cid/ciaa450 Medline
CoV, and MERS-CoV viral load dynamics, duration of viral shedding, and 32. Y.-T. Huang, Y.-K. Tu, P.-C. Lai, Estimation of the secondary attack rate of COVID-
infectiousness: A systematic review and meta-analysis. The Lancet Microbe 2, 19 using proportional meta-analysis of nationwide contact tracing data in Taiwan.
e13–e22 (2021). doi:10.1016/S2666-5247(20)30172-5 Medline J. Microbiol. Immunol. Infect. S1684-1182(20)30143-2 (2020).
20. J. A. Hay, L. Kennedy-Shaffer, S. Kanjilal, M. Lipsitch, M. J. Mina, Estimating doi:10.1016/j.jmii.2020.06.003 Medline
epidemiologic dynamics from single cross-sectional viral load distributions, 33. Y. Liu, R. M. Eggo, A. J. Kucharski, Secondary attack rate and superspreading
medRxiv, 2020.10.08.20204222 (2020). events for SARS-CoV-2. Lancet 395, e47 (2020). doi:10.1016/S0140-
21. T. C. Williams, E. Wastnedge, G. McAllister, R. Bhatia, K. Cuschieri, K. Kefala, F. J. 6736(20)30462-1 Medline
Hamilton, I. Johannessen, I. F. Laurenson, J. Shepherd, A. Stewart, D. Waters, H. 34. L. Hamner, P. Dubbel, I. Capron, A. Ross, A. Jordan, J. Lee, J. Lynn, A. Ball, S.
Wise, K. Templeton, Sensitivity of RT-PCR testing of upper respiratory tract Narwal, S. Russell, D. Patrick, H. Leibrand, High SARS-CoV-2 Attack Rate
samples for SARS-CoV-2 in hospitalised patients: A retrospective cohort study. Following Exposure at a Choir Practice - Skagit County, Washington, March 2020.
medRxiv 5, 2020.06.19.20135756 (2020). MMWR Morb. Mortal. Wkly. Rep. 69, 606–610 (2020).
doi:10.12688/wellcomeopenres.16342.1 doi:10.15585/mmwr.mm6919e6 Medline
22. I. Arevalo-Rodriguez, D. Buitrago-Garcia, D. Simancas-Racines, P. Zambrano- 35. N. J. Lennon, R. P. Bhattacharyya, M. J. Mina, H. L. Rehm, D. T. Hung, S. Smole, A.
Achig, R. Del Campo, A. Ciapponi, O. Sued, L. Martinez-García, A. W. Rutjes, N. Woolley, E. S. Lander, S. B. Gabriel, Comparison of viral levels in individuals with
Low, P. M. Bossuyt, J. A. Perez-Molina, J. Zamora, False-negative results of initial or without symptoms at time of COVID-19 testing among 32,480 residents and
RT-PCR assays for COVID-19: A systematic review. medRxiv 15, e0242958 staff of nursing homes and assisted living facilities in Massachusetts, medRxiv,
(2020). Medline 2020.07.20.20157792 (2020).
23. C. Vogels, D. E. Brackney, C. C. Kalinich, I. M. Ott, N. Grubaugh, A. Wyllie, 36. M. Papaiakovou, J. Wright, N. Pilotte, D. Chooneea, F. Schär, J. E. Truscott, J. C.
SalivaDirectTM: RNA extraction-free SARS-CoV-2 diagnostics V.5, (2020), Dunn, I. Gardiner, J. L. Walson, S. A. Williams, D. T. J. Littlewood, Pooling as a
doi:10.17504/protocols.io.bkjgkujw. strategy for the timely diagnosis of soil-transmitted helminths in stool: Value and
24. M. Cheraghchi, A. Hormati, A. Karbasi, M. Vetterli, Group testing with probabilistic reproducibility. Parasit. Vectors 12, 443 (2019). doi:10.1186/s13071-019-3693-3
First release: 22 February 2021 stm.sciencemag.org (Page numbers not final at time of first release) 10You can also read