Of Health Our Picture - Tama tū, tama ora Tama noho, tama mate - ProCare
←
→
Page content transcription
If your browser does not render page correctly, please read the page content below

Our Picture
of   Health
     Tama tū, tama ora
     Tama noho, tama mate
     “Those who choose to take action will be well”

                                                      Our Picture of Health   I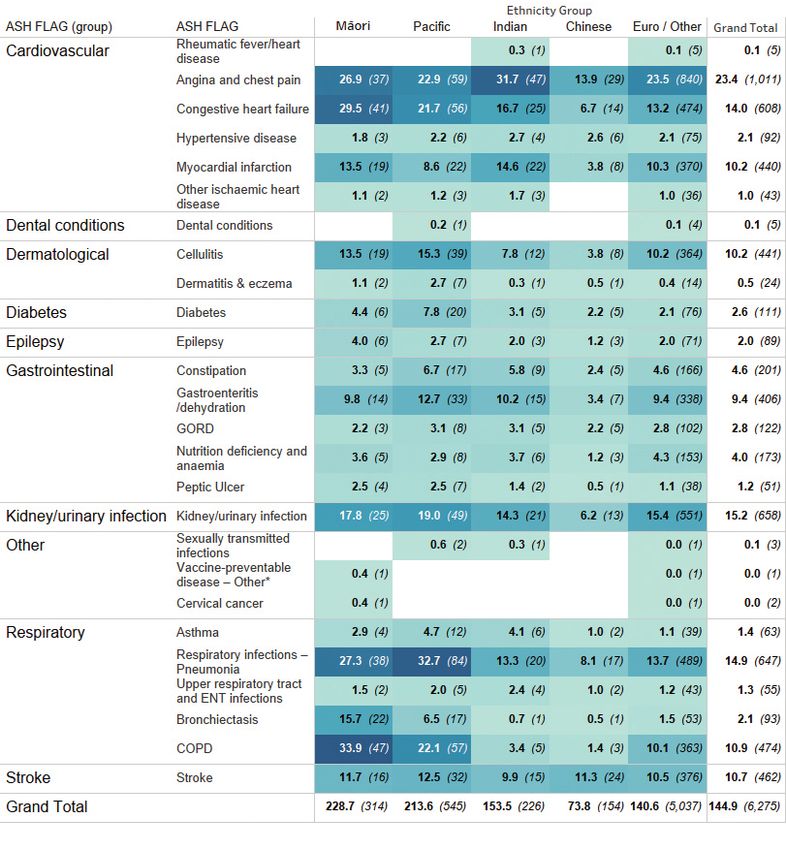
Disclaimer
Information within the report may be freely used provided the source is acknowledged. Every effort has been made to
ensure the information in this report is correct. ProCare and the author will not accept any responsibility for information
which is incorrect and where action has been taken as a result of the information in this report.
This report was commissioned by ProCare Networks Ltd.
Author, Susan Wells
Published in May 2018 by ProCare Networks Ltd.
Suggested citation: Wells S. Our Picture of Health, needs assessment of the ProCare network enrolled population.
ProCare Networks Ltd, Auckland 2018.

                                                                                                                Our Picture of Health   1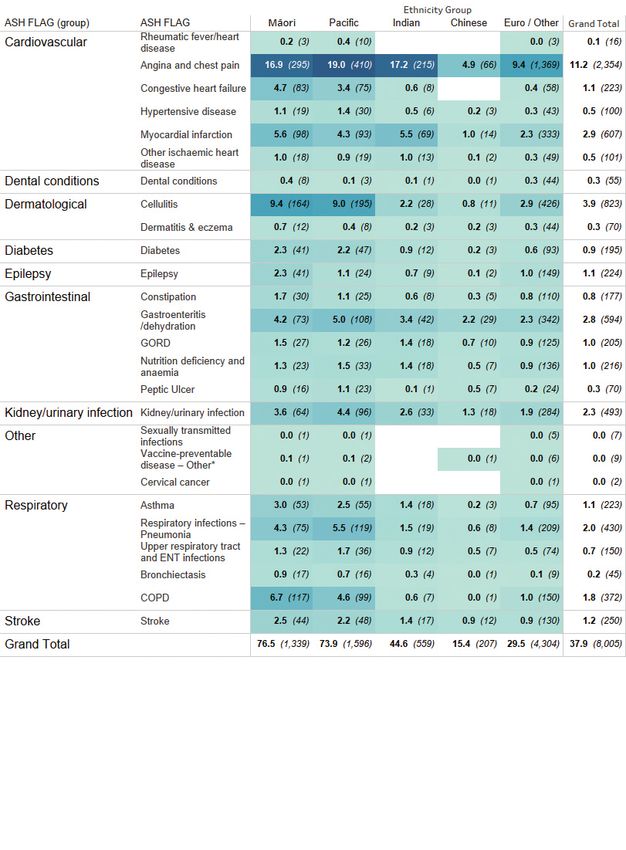
Foreword
The ProCare vision is ‘that every New Zealander has the right to live well’.
To achieve this vision, we first have to understand the health needs of our population, which is why we have, for the first time,
conducted a comprehensive health needs analysis - Our Picture of Health.
We developed Our Picture of Health because as a PHO, responsible for the health of our enrolled population, we first had to
understand the key challenges we face, and where the gaps lie, so that we may set the future direction of our PHO.
With the data articulating the needs of our population, we now have the information to form the basis of a population health
strategy, with a focus on improving equity. This strategy will in turn drive future investment in funded programmes and service
delivery that meets the needs identified in Our Picture of Health.
It is about focus where it is needed most, rather than increasing workloads, to ensure we are doing the right things to reduce
inequity and improve the health of our population.
With this in mind, we know it is important we continue to innovate to meet the changing needs of our population today and into
the future. Our commitment is to work closely with you, to ensure your voice and experience in providing care to your patients is
heard and informs the further development of policy, strategies and new programmes that aim to serve our population.
There are still many gaps in our knowledge as much of what is important and matters to people is not measured or easy to
measure. While acknowledging this, we have identified things that we can do as health practitioners that would make a difference
to the health of the population in terms of wellbeing, morbidity and mortality. The report though, starkly reveals that we need to
do better to close the gap in outcomes for Māori and Pacific people in particular.
We recognise that clinical care is just one aspect of achieving positive health and wellbeing and respect the fundamental role that
people play in managing their own health, whilst also acknowledging the life long relationship that some people have with their
general practice and our role as patient advocates. Working in partnership with organisations, agencies and our communities to
impact the social determinants of health will be important as we work to redress the inequities.
We would like to acknowledge Associate Professor Sue Wells, for her dedication and commitment in creating the report, along with
our own data and analytics team.
We hope that your practice will benefit from the information in Our Picture of Health. That identification of sub populations in the
report, will help you focus your own activities towards meeting the specific needs of your enrolled patients.

     Tevita Funaki			                                                   Dr Harley Aish
     CHAIRMAN                                                           CHAIRMAN
     PROCARE NETWORKS LIMITED                                           PROCARE HEALTH LTD

2   Our Picture of Health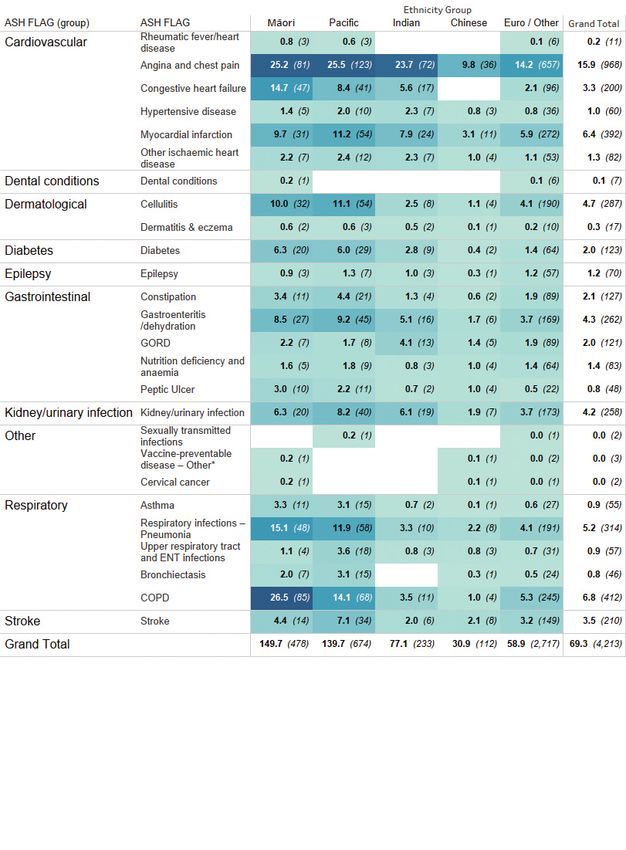
Table of Contents
Executive Summary....................................................... 4 Other CVD conditions and renal disease
Read coding in CIS........................................................ 43
Key findings............................................................... 4
Diabetes................................................................... 44
Conclusion................................................................. 6
Diabetes clinical indicators..................................... 46
Introduction.................................................................... 7
Cancer...................................................................... 48
Methods........................................................................... 8
Gout.......................................................................... 49
Domain 1: ProCare’s population................................... 9
Asthma..................................................................... 50
Age groups and sex.................................................. 11
Chronic obstructive pulmonary disease................ 51
ProCare ethnicity composition compared
to Auckland Region and NZ census data................ 15 Mental Health.......................................................... 52
Ethnicity composition of enrolled ProCare Polypharmacy.......................................................... 55
patients by DHB of practice..................................... 15
Domain 6: Preventive care - immunisations.............. 56
ProCare patients domiciled in
8 month immunisation target................................. 56
Auckland regional DHBs.......................................... 16
2 year immunisations.............................................. 57
Socioeconomic status............................................. 17
Flu vaccination......................................................... 58
Household occupancy............................................. 18
Cervical screening................................................... 59
Coding of Iwi............................................................ 18
Domain 7: Patient experience and
Domain 2: Practices and providers............................. 19
engagement in health care.......................................... 60
Full Time Equivalent GPs and nurses..................... 19
Patient experience survey....................................... 60
Average GP and nurse FTE/1000 of
Patient portals......................................................... 62
domiciled patients by DHB..................................... 20
Domain 8: Hospitalisations - acute and
Domain 3: Access and utilisation................................ 22
elective services........................................................... 63
Very low cost access practices................................ 22
Inpatient volumes................................................... 63
Location of VLCA practices and domicile
Age standardised admission rates.......................... 65
of high needs patients............................................. 23
Ambulatory Sensitive Hospitalisations...................... 69
GP and nurse visits.................................................. 24
ASH annual volumes and length of stay................. 69
Visit frequency by low cost access.......................... 26
ASH rates per 1000 by condition and age group.... 71
Who does not visit in two years?............................. 28
ASH rates per 1000 by condition,
Domain 4: Risk factors................................................. 30
age group and ethnicity.......................................... 72
BMI........................................................................... 30
ED visits......................................................................... 79
Smoking................................................................... 32
ED visit volumes by discharge type............................ 79
Smoking indicators of care..................................... 33
ED visit volumes by DHB of practice and
Blood pressure and cholesterol.............................. 34 ED service...................................................................... 79
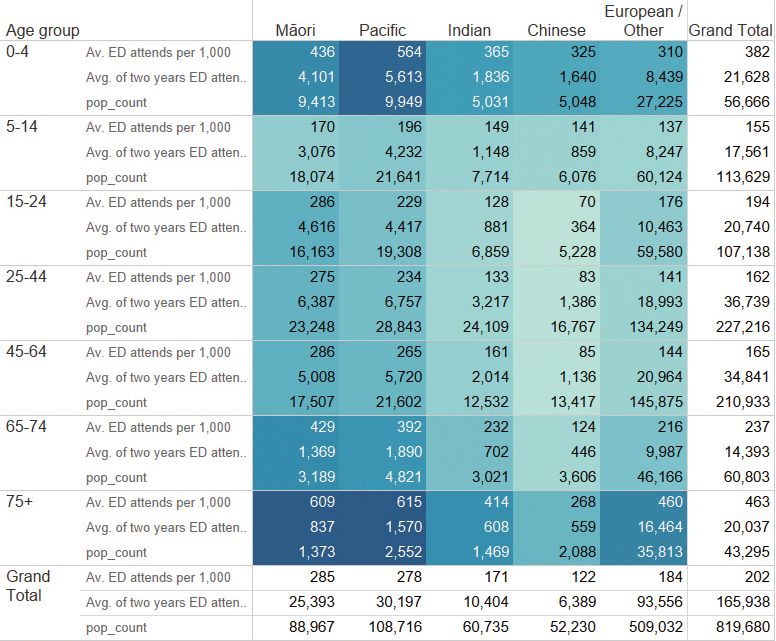
CVD risk assessment................................................ 35 Age specific rates of ED visits by ethnicity.............. 80
CVD Risk................................................................... 35 Age standardised rates by ethnicity........................ 81
Medical management of very high CVD Age standardised rates of ED attendance
risk ≥ 20% (Dual therapy)........................................ 37 by NZDep Quintile................................................... 82
Domain 5: Long term condition prevalence............... 38 Practice age standardised ED attendance rate
by deprivation and DHB catchment of practice..... 83
Cardiovascular disease (CVD) prevalence.............. 38
Population risk modelling........................................... 84
CVD Read Coding in general practice records........ 40
Calibration of the population risk model............... 85
Medical management of Ischaemic CVD
(Triple therapy)........................................................ 42 References..................................................................... 86
Our Picture of Health 3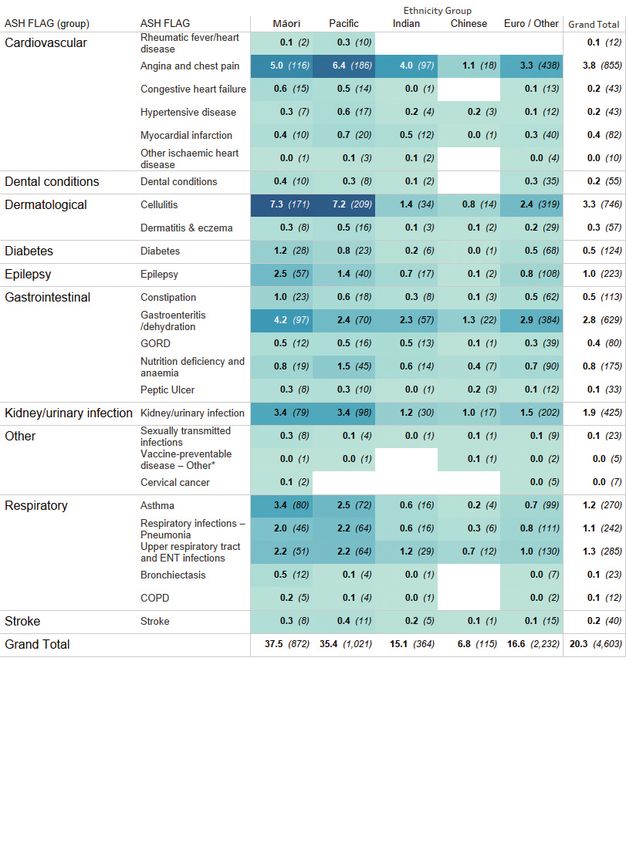
Executive summary
ProCare is a large primary health organisation (PHO) serving over 170 practices and more than 800,000 enrolled patients. The
purpose of this report is to take a population health approach by providing a systematic assessment of ProCare’s enrolled
population health needs. Traditionally District Health Boards (DHBs) have conducted health needs analyses (HNAs) for their
respective populations in order to prioritise service funding and planning. However, to our knowledge this is the first
comprehensive HNA undertaken by a PHO whose enrolled patients span three regional DHB catchments.
We have extracted data from a series of clinical and administrative datasets and conducted simple descriptive analyses stratified
by population group (eg, patient domicile, practice location, age, gender, prioritised ethnicity, socioeconomic deprivation)
depending on the clinical question. The report covers ProCare’s enrolled population as at 1 January 2017
and describes:
    • sociodemographic characteristics
    • practice sizes by GP and nurse full time equivalents (FTE)
    • access and utilisation of general practices
    • preventive care measures
    • risk factors for long term conditions
    • the burden of established long term conditions
    • medical management according to evidence-based best practice
    • the ability for patients to engage with their health and health care providers via patient portals
    • patient experience measures
    • use of secondary care services (emergency department visits, total and ambulatory sensitive hospitalisations) and;
    • population risk modelling; identifying populations at highest risk of a hospital admission in the next six months.

Key findings
Demography, practice and access
As at 1 January 2017, ProCare had 824,735 enrolled patients, making up 51% of Auckland region’s population and 17% of
New Zealand’s population.
ProCare is responsible for the largest Māori (89,912) and Pacific (109,239) communities of any PHO in New Zealand and the
largest high needs population in New Zealand (263,173). It is also responsible for the largest Asian population of any
PHO (176,469).
Overall 22% of ProCare’s enrolled population are less than 15 years old and 5% are 75+ years old.
The majority of ProCare’s Māori (61%) and Pacific (75%) peoples live in the most socioeconomically deprived areas of Auckland.
Small practices (fewer than four FTE GPs) make up 79% of ProCare practices and care for 56% of the total enrolled population.
ProCare has on average one GP FTE per 1,694 patients (0.59 FTE /1000 patients). This is a slightly higher enrolled patient ratio
than the New Zealand average of one GP FTE per 1,650 patients (0.61/1000 patients).
Variation in ProCare’s nursing workforce is marked with small practices having an average 0.37 FTE vs 0.95 FTE in large practices.
In 2016 more than 2.4 million GP and nurse consultations were recorded – a conservative estimate as nursing visits are unreliably
recorded. Overall 80.5% of the enrolled ProCare population were seen in the previous two years (19.5% had not visited in two
years).
ProCare patients saw their GP on average 2.9 times per year. People classified as being ‘high needs’ (Māori, Pacific and those
residing in New Zealand Deprivation Index Quintile 5 [NZDep Q5], the most deprived areas in the Auckland region) saw their GP
3.0 times per year. This group comprises 29% of the population and utilises 30% of GP visits. This pattern raises issues relating to
equity of access given observed health need.
By visit frequency:
    • 50% of patients had between zero and three GP visits/year
    • 75% of patients had fewer than eight GP visits/year
    • 5% had 18 or more visits/year.
Thirty-four percent of high needs population (Māori, Pacific and NZDep Q5) were not enrolled in very low cost access (VLCA)
practices.

4   Our Picture of Health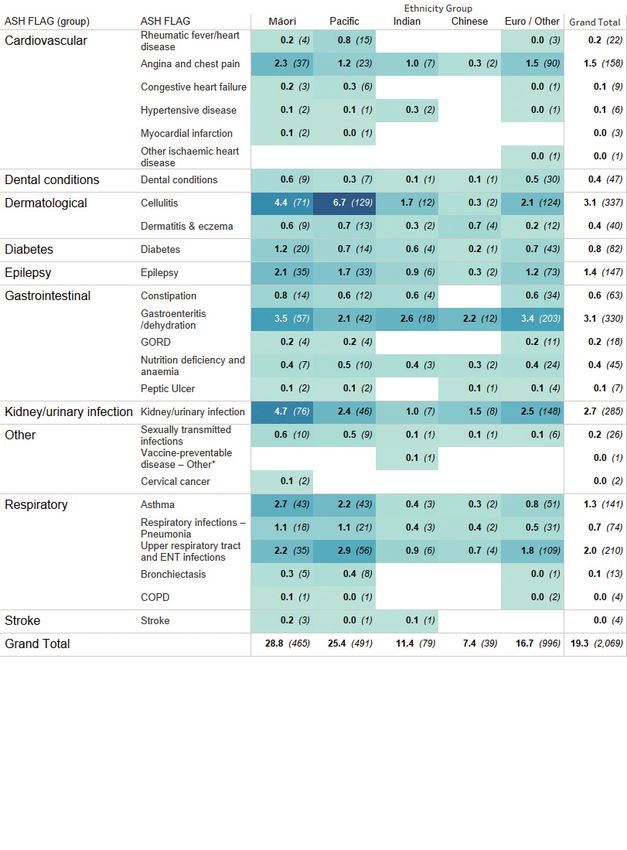
Preventive care, risk factors and long term conditions
Overall 93% and 92% had completed 8 month and 2 year immunisations respectively. Three percent of eligible children had
one or more immunisations recorded as declined by their caregivers; the highest rate of declining for Māori children (5%).
Only 57% of patients over 15 years had a recorded Body Mass Index (BMI). Of these, only about one third were within a healthy
weight range. The majority of Pacific (78%) and Māori (51%) people were recorded as obese or morbidly obese.
ProCare has a lower smoking prevalence (9%) than that reported for New Zealand overall (17%) suggesting that data quality
issues may be present or reporting bias. Reported smoking prevalence is one in five Māori, one in eight Pacific and one in 15
European and Others.
Most (92%) of ProCare’s eligible population have had a cardiovascular (CVD) risk assessment in the last five years. The biggest
gap in CVD risk assessment was for younger Māori, Pacific and Indian men aged 35-44 years. This is 73%, 81% and 83%
respectively.
About half of people at a very high five-year CVD risk (≥ 20%) were receiving recommended dual therapy (blood pressure
lowering and lipid lowering medications).
Large Read coding gaps were found for long term conditions compared to national prevalence estimates for ischaemic stroke,
peripheral vascular disease, haemorrhagic stroke, heart failure, renal failure, cancers, COPD and mental health but not for
ischaemic heart disease, gout and asthma.
Fifty-five percent of people classified as having a prior CVD event were receiving recommended triple therapy (blood pressure
lowering, lipid lowering medications and antiplatelet or anticoagulant medication).
As at 1 January 2017 ProCare had more than 45,000 patients with diabetes; a prevalence of 6% - similar to national and
regional estimates. For these people:
    • The prevalence was highest among Pacific (14%) and Indian (13%) people
    • 78% of Māori and Pacific people with diabetes were obese or morbidly obese compared to 47% European/Other,
      33% Indian and 12% Chinese
    • About 70% had adequate blood pressure control
    • Across average measurements for HbA1c, eGFR and ACR including overt diabetic nephropathy (ACR≥30) Māori and
      Pacific patients recorded the least favourable clinical indicators
    • If microalbuminuria or overt diabetic nephropathy were recorded as present, over a quarter of patients were not
      receiving ACE or ARB therapy.
Overall there were more than 10,500 patients over the age of 65 years who were on 8-10 medications and more than 4,500 on
11+ medications.
As at Quarter 2 2017, approximately 15% of ProCare patients have registered and used a patient portal.

Hospitalisations and ED visits
In 2015 and 2016, ProCare patients had more than 180,000 acute and elective hospital admissions per year with over 500,000
bed days.
The average age standardised acute admission rate is 228/1000 patients/year. Acute admission rates were highest among
those practices serving higher deprivation areas although there was marked practice variation even after controlling for
deprivation. Practices within the Waitemata District Health Board (WDHB) catchment had a higher overall acute admission
rate. This observation was unexpected and warrants further investigation into underlying causes.
Ambulatory sensitive hospitalisation (ASH) rates were highest for patients aged 0-4 years, 65-74 years and 75+ years. Māori
and Pacific patients had 50% higher ASH rates than European/Other with particularly high rates among those aged 65 years or
older. Pacific children (0-4 years) had twice the ASH hospitalisation rate of their European counterparts. Across all age groups
Chinese had the lowest ASH rates.
For the 0-4 age group, respiratory infections and asthma were the biggest causes for ASH admissions. Cardiovascular disease
(heart and stroke), kidney disease, respiratory infections and COPD dominated ASH rates for older age groups.
On average Auckland regional emergency departments (EDs) had 165,940 attendances per year from ProCare patients of
whom nearly 60% were routinely discharged from care. ED attendance was highest among patients who resided in more
deprived areas. When stratified by NZ Deprivation index quintile, Māori and Pacific ED attendance was higher than that of
other ethnic groups.
The Sapere population risk model for an acute admission in the next six months estimated that about 5% of ProCare’s
population are at high risk (greater than 1 in 10 chance of an admission in the next six months).

                                                                                                               Our Picture of Health   5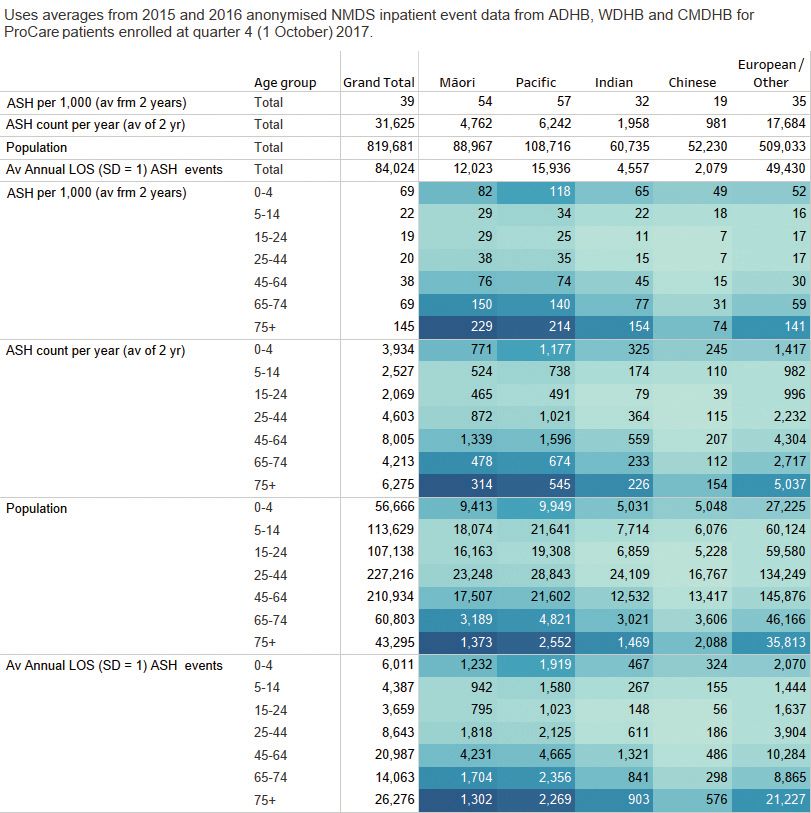
Conclusion
“Without data, you’re just another person with an opinion.” W Edwards Deming
This is the first such report undertaken by ProCare. It provides a baseline of key information and offers practical insights
into what a picture of population health looks like from a PHO perspective, what the easy wins might be, what primary care
information systems offer and where are the key gaps in information quality, evidence based provider processes, and patient
outcomes. The depth and breadth of available practice and patient collated data has huge potential to support learning from
data and clinical quality improvement.
This report shows that ProCare has significant challenges to address. In particular there is a need to accelerate Māori and
Pacific health gain.
Enormous variation exists across all data and all strata of health indicators raising many questions regarding underlying
causes. Some of the challenges presented are specific to the organisation, others are shared by healthcare organisations
throughout New Zealand and internationally. These include a rapidly growing and aging patient population, significant ethnic
health inequities, general practice and nurse workforce issues, medical IT advancement, and new models of primary care
calling for consumer co–design. However, all this must be viewed within the understanding that health services contribute
to an estimated 20% of population health, the remaining 80% coming from socioeconomic and other environmental
determinants. This calls for significant sustained partnerships across other sectors and advocacy for the health of our
populations.
The next step is translating ‘Our Picture of Health’ into “so what”? What is it telling us regarding ProCare existing plans
and processes, the effectiveness of our current services, are they targeted according to population need, where are the
gaps, what should be prioritised, what should we be doing differently?
These questions form the next phase of our work developing a population health strategy; a road map for change which takes
a quality improvement approach together with our patients (and their families and whānau) and our practices.

6   Our Picture of Health
Introduction
The purpose for preparing this report was to take a population health approach by providing a systematic assessment of
ProCare’s enrolled population health needs.
Population health means the health outcomes of defined populations – groups, families and communities – and the
distribution of outcomes within populations.1 It also means that health equity – the avoidable or remediable differences
in health between population groups – is a core part of understanding population health. Failure to avoid or overcome
inequities infringes on fairness and human rights.
The health of a population is influenced by a wide range of factors (see model below); what we are born with (genes and
hereditary factors), what we do (lifestyle behaviours such as alcohol, smoking, diet and activity), socioeconomic factors
(such as employment, education, housing), clinical care (access and quality of care and where we live (built environment,
environmental quality). It has been estimated that clinical care contributes only about 20% of the influence on population
health, 80% coming from all the other determinants.2 Therefore improving population health requires many different
interventions and approaches such as those advocated by the Ottawa Charter; healthy public policy, community advocacy
and action, reorienting health services to meet the needs of patients and their whānau, developing personal skills and
supporting each other in communities.3

                                       Dalgren and Whitehead Model [Picture source: https://www.kingsfund.org.uk/]

            —ori health gain
Accelerate Ma
The Treaty of Waitangi is the founding document of Aotearoa New Zealand between Māori and the Crown. However, our
colonial history helped to pre-determine social and economic inequities between New Zealand European and Māori resource
and asset bases. New Zealand’s governing structures and our underlying value systems maintained these inequities. The
current state of Māori health has been directly and indirectly influenced by this positioning and has become ‘normalised’ into
New Zealand’s social constructs and organisations including its health system.
A broad population health approach has the potential to lose focus on Māori equity when it presents Māori health inequities
alongside those of Pacific and other high needs people living in the most socioeconomically deprived neighbourhoods. This
results in tensions regarding the splitting of the equity focus of this report and its recommendations. We have endeavoured
to describe results related to Māori health equity as a priority. This report provides the basis of a more focused investigation,
drilling down into key areas likely to impact on Māori health and inform ProCare’s Māori Health Strategy. This is an area of
ongoing work and improvement for ProCare.

                                                                                                                     Our Picture of Health   7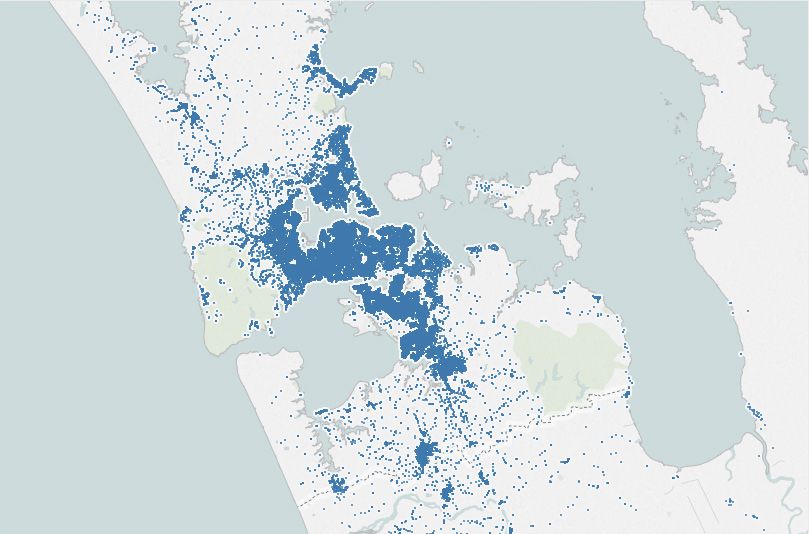
Clinical quality improvement
This report offers levers for change or action – supporting the proactive application of strategies and interventions for
defined cohorts of individuals within our enrolled population. The data allow us to benchmark how we are performing
against the dimensions of ProCare’s Quality Quadrant. It provides an evidence base for many of the performance indicators
noted in the current Outcomes and Quality Framework that contribute to the national strategic priorities outlined in the
System Level Measures Framework (SLMF).

            ProCare Quality Quadrant

      Experience                        Health
        of Care                        Outcomes

                             Patient
                            Focused
                              Care

         Use of                        Workforce
        Resource

Methods
The health needs analysis aimed to describe the distributions of clinical measures and patient health outcomes of the
ProCare enrolled population as at 1 January 2017 according to age, sex, ethnicity (Māori, Pacific, Indian, Chinese and
European and Other ethnicity groups) and socioeconomic deprivation (New Zealand Deprivation Index quintile).
The data came from a variety of sources:
     • The ProCare enrolled patient Age-Sex register/ Clinical Performance Indicators (CPI) dataset is extracted by the
       company Karo for national administrative and system performance reasons. This includes 177 practices and their
       enrolled patients (824,735). While East Tamaki Health Care functions as an independent entity, for historical reasons,
       the ProCare Age-Sex register also includes some East Tamaki Health Care practices within Auckland and Waitemata
       District Health Board Catchment. The combined Age-Sex register is used for demography purposes in the health
       needs analysis
     • The Clinical Intelligence System (CIS) has data from 110 ProCare practices’ patient management systems and
       includes 389,778 patients (47%)
     • The DrInfo dataset includes data extracted from specific clinical queries developed by DrInfo software; 144 practices
       use DrInfo and includes 671,163 patients (81%)
     • The Customer Relationship Management (CRM) system is a ProCare database filled in by individual practices and
       used to calculate GP and nursing work force full time equivalent (FTE)
     • ProCare has participated in the PREDICT cohort study since its inception in 2002.12 From this dataset over 250,000
       patients have had their CVD, CVD risk and diabetes status assessed by ProCare GPs and practice nurses. Anonymised
       summary statistics have been provided by the University of Auckland for prevalence estimates
     • The Ministry of Health National Minimum dataset (NMDS) for the years 2015 and 2016 included data for total acute
       and elective hospitalisations, ambulatory sensitive hospitalisations and emergency department visits
     • The Patient Experience Survey aggregated data was provided by the Health Quality and Safety Commission
     • Patient portal information was derived from portal vendors.
Data is displayed in tables and graphs. Limitations are noted as relevant. Pratice-level variation is displayed anonymously.
As age structures and population sizes of ethnicity groups differ markedly, comparisons between groups are described by
age-specific rates and where relevant, age-standardised by the direct method to the World Health Organisation population.

8   Our Picture of Health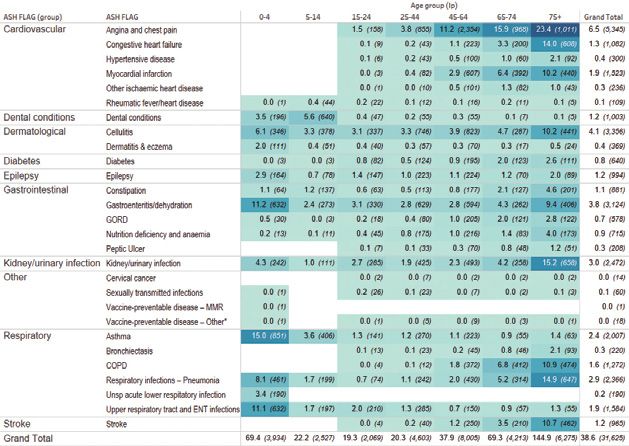
Domain 1: ProCare’s population

177
 PRACTICES
                                      824,735
                                       ENROLLED         PATIENTS
 AS AT 1 JAN 2017                      AS AT 1 JAN 2017

               c.51     %
               (1,632,100)
                               Of estimated
                               Auckland regional
                               DHB population
                                                                           c.17    %
                                                                           (4,693,000)
                                                                                           Of estimated
                                                                                           New Zealand
                                                                                           population

 24.4%              Of our patients are Māori or
                    Pacific (as at 1 July 2017)

New Zealand’s largest network
of primary healthcare professionals

Table 1. ProCare enrolled patients by District Health Board (DHB) of practice

                                    DHB of Practice

 Total ProCare enrolled pop         Auckland                   Waitemata                  Counties Manukau
                                    (ADHB)                     (WDHB)                     (CMDHB)

 824,735                            366,689 (44%)              262,644 (32%)              195,402 (24%)

By DHB of practice, 44% of enrolled ProCare patients go to practices within ADHB, 32% to practices within WDHB and
24% to practices within CMDHB catchment.

                                                                                                           Our Picture of Health   9
PROCARE POPULATION
AS AT 1 JAN 2017
(N = 824,735) ProCare is responsible
for the largest Māori and
Māori Pacific communities in
11% (89,912)
New Zealand.
Pacific
13% (109,239)
ProCare also has the
% Indian
7.5 (62,072)
largest enrolled high-
needs patient population
Chinese in New Zealand.
6.5% (53,618)
European/
263,173
62 % Other
(509,894)
ProCare is responsible for the largest Māori (89,912) and Pacific (109,239) communities of any PHO in New Zealand. Collectively,
Māori, Pacific and those residing in New Zealand Deprivation Index Quintile 5 [NZDep Q5] are defined as a ‘high needs patient
population’. ProCare cares for more than a quarter of a million (263,173) people who meet this definition.
ProCare practices care for significant Pacific and Asian subgroups as well as Middle Eastern, Latin American and African ethnic
groups (Table 2). As at 1 January 2017, the population counts of these groups are described below. ProCare has the largest
Asian population of any PHO (176,469) in New Zealand. It is possible that some Fijian Indian people may be misclassified in the
enrolled population age-sex register as Fijian rather than of Indian ethnicity.
Table 2. ProCare enrolled patients within Pacific, Asian and Middle Eastern, Latin American and
African (MELAA) subgroups
Pacific Subgroups N Asian subgroups N MELAA subgroups N
Samoan 47,606 Indian 62,072 Middle Eastern 8,075
Tongan 21,335 Chinese 53,618 Latin American 2,951
Cook Islander 16,445 South East Asian 20,018 African 5,481
Fijian 11,079 Other Asian 40,761
Niuean 6,487
Tokelauan 607
Other Pacific 5,680
For this HNA, ethnic groups were prioritised in the following order; Māori, Pacific, Indian, Chinese and a combined European
and Other ethnicities group (henceforth called European/Other or shortened to Euro/Other in Tables and Figures). The Other
ethnicities group include Middle Eastern, Latin American and African (MELAA) subgroups and South East Asian and Other Asian.
10 Our Picture of HealthAge groups and sex
The ProCare patient population is made up of 48% men and 52% women.
ProCare has a very similar age group pattern as the Auckland region and the total New Zealand DHB population (2013
Census).
Overall 22% are less than 15 years old and 5% are 75+ years old.
Each five year age group is approximately 7% of the total ProCare population up until the age of 60 years dropping
thereafter to 5% at 60-65 years down to 1-2% over 80 years. However, the age and sex structure of ethnic groups differ
markedly.
Population age pyramids were constructed to visualise the age/sex structures of Māori, Pacific, Indian, Chinese and
European/Other ethnic groups (Fig 1). Each step represents five year age bands with the exception of 85 years and over.
The blue bars represent men and orange bars, women. The x-axis for European/Other ethnicity differs from Māori,
Pacific, Indian and Chinese due to the population count being so much greater. Māori and Pacific populations are
relatively younger (0-24 years) compared to Indian, Chinese and European/Other and have relatively fewer older
members aged 65 and over compared to European/Other.
Fig 1. Population age pyramids for men and women for Māori, Pacific, Indian, Chinese
and European/Other ethnic groups
Total Maori
TOTAL MĀORI
85 and over
80 to 84 yrs
75 to 79 yrs
70 to 74 yrs
65 to 69 yrs
AGE BAND (YEARS) Blue = male, Orange = female
60 to 64 yrs
55 to 59 yrs
50 to 54 yrs
45 to 49 yrs
40 to 44 yrs
35 to 39 yrs
30 to 34 yrs
25 to 29 yrs
20 to 24 yrs
15 to 19 yrs
10 to 14 yrs
5 to 9 yrs
0 to 4 yrs
6000 4000 2000 0 2000 4000 6000
M F
NUMBER OF PEOPLE
Our Picture of Health 11Total Pacific
TOTAL PACIFIC
85 and over
80 to 84 yrs
75 to 79 yrs
70 to 74 yrs
65 to 69 yrs
AGE BAND (YEARS) Blue = male, Orange = female
60 to 64 yrs
55 to 59 yrs
50 to 54 yrs
45 to 49 yrs
40 to 44 yrs
35 to 39 yrs
30 to 34 yrs
25 to 29 yrs
20 to 24 yrs
15 to 19 yrs
10 to 14 yrs
5 to 9 yrs
0 to 4 yrs
6000 4000 2000 0 2000 4000 6000
M F
NUMBER OF PEOPLE
12 Our Picture of HealthTotal INDIAN
TOTAL Indian
85 and over
80 to 84 yrs
75 to 79 yrs
70 to 74 yrs
65 to 69 yrs
AGE BAND (YEARS) Blue = male, Orange = female
60 to 64 yrs
55 to 59 yrs
50 to 54 yrs
45 to 49 yrs
40 to 44 yrs
35 to 39 yrs
30 to 34 yrs
25 to 29 yrs
20 to 24 yrs
15 to 19 yrs
10 to 14 yrs
5 to 9 yrs
0 to 4 yrs
6000 4000 2000 0 2000 4000 6000
M F
NUMBER OF PEOPLE
Total CHINESE
TOTAL Chinese
85 and over
80 to 84 yrs
75 to 79 yrs
70 to 74 yrs
65 to 69 yrs
60 to 64 yrs
AGE BAND (YEARS) Blue = male, Orange = female
55 to 59 yrs
50 to 54 yrs
45 to 49 yrs
40 to 44 yrs
35 to 39 yrs
30 to 34 yrs
25 to 29 yrs
20 to 24 yrs
15 to 19 yrs
10 to 14 yrs
5 to 9 yrs
0 to 4 yrs
6000 4000 2000 0 2000 4000 6000
M F
NUMBER OF PEOPLE
Our Picture of Health 13Total Euro/Other
TOTAL EURO/OTHER
85 and over
80 to 84 yrs
75 to 79 yrs
70 to 74 yrs
65 to 69 yrs
60 to 64 yrs
GE BAND (YEARS) Blue = male, Orange = female
55 to 59 yrs
50 to 54 yrs
45 to 49 yrs
40 to 44 yrs
35 to 39 yrs
30 to 34 yrs
25 to 29 yrs
20 to 24 yrs
15 to 19 yrs
10 to 14 yrs
5 to 9 yrs
0 to 4 yrs
25000 20000 15000 10000 5000 0 5000 10000 15000 20000 25000
M F
NUMBER OF PEOPLE
14 Our Picture of HealthProCare ethnicity composition compared to
Auckland Region and NZ census data
The ProCare ethnicity distribution closely reflects the total Auckland regional distribution which has higher proportions of
Asian and Pacific people and lower Māori and European proportions than the total NZ population (Table 3).
Table 3. ProCare ethnicity composition compared to the Auckland region, census and
population projection data
Total ProCare Auckland region New Zealand 2018 NZ pop
N (column %) projection
1 Jan 2017 Census 2013 Census 2013
Ethnicity N=824,735 N= 1,431,195 N= 4,442,100 N= 4,738,400
Māori 11% 10.1% 15.6% 16.1%
Pacific 13% 13.7% 7.8% 8.2%
Indian 7.5 %
Chinese 6.5%
Total Asian 21% 21.5% 12.2% 14.6%
European/Other 54.5% 54.7% 74.6% 72.3%
Ethnicity composition of enrolled ProCare patients
by DHB of practice
The ethnicity composition within ProCare practices varies markedly depending on DHB catchment (Table 4). Those located
within Counties Manukau have 19% Māori and 19% Pacific enrolled patients compared with only 6% and 13% respectively
in practices located within ADHB. Similarly the Indian population makes up only 3% of enrolled population in ProCare
Waitemata practices compared with 10% in Counties Manukau and 9% in Auckland practices.
Table 4. Ethnicity composition within ProCare practices by District Health Board catchment
DHB of practice
Total ProCare Auckland Waitemata Counties Manukau
(ADHB) (WDHB) (CMDHB)
Ethnicity N =824,735(col %) N =366,689 (col%) N=262,644 (col%) N= 195,402 (col%)
Māori 89,912 (11%) 22,828 (6%) 29,349 (11%) 37,735 (19%)
Pacific 109,239 (13%) 49,026 (13%) 23,221 (9%) 36,992 (19%)
Indian 62,072 (7.5%) 34,681 (9.5%) 6,530 (2.5%) 18,861 (10%)
Chinese 53,618 (6.5%) 28,474 (7.8%) 18,410 (7%) 6,734 (3.4%)
European/Other 509,894 (62%) 231,680 (63%) 183,134 (70%) 95,080 (49%)
Total 100% 100% 100% 100%
Our Picture of Health 15ProCare patients domiciled in Auckland regional DHBs
Many patients travel across DHB catchments to go to their preferred GP. Travel distances may be 50kms or more e.g. from
Pukekohe to Takapuna. While Table 4 reflects where enrolled patients’ practices are located, this does not necessarily reflect
their place of residence. Overall ProCare patients reside in and make up 56% of Auckland District Health Board (ADHB)
catchment population, 50% of Waitemata District Health Board (WDHB) and 42% of Counties Manukau Health (CMDHB).
Table 5. Ethnicity composition of ProCare enrolled patients by their place of residence
according to District Health Board catchment
ADHB ProCare WDHB ProCare CMDHB ProCare
(2016/17) patients (2016/17) patients (2016/17) patients
domiciled domiciled in domiciled in
in ADHB WDHB CMDHB
Total N N (%ADHB) Total N N (%WDHB) Total N N (%CMDHB)
Total pop 510,450 283,942 (56%) 597,510 298,668 (50%) 541,080 227,517 (42%)
Māori 41,856 19,584 (47%) 59,751 30,350 (51%) 86,032 39,367 (46%)
Pacific 54,108 34,211 (63%) 42,423 27,443 (65%) 114,168 47,427 (42%)
Indian 38,000* 24,406 (64%) 21,000* 13,505 (64%) 56,690** 24,044 (42%)
Chinese 52,257* 20,873 (40%) 39,860* 21,895 (55%) 43,180** 10,765 (25%)
European/ 324,229 194,686 (60%) 434,476 205,475 (47%) 241,010 105,914 (44%)
Other
* Personal communication Lifeng Zhou Waitemata DHB and author of International Benchmarking of Asian Health Outcomes 2017 (may be undercount as
population projections to 2016/17 underestimated Asian population growth)
**Extrapolated from CMDHB Asian Health Plan (total Asian 127,000 of which 47% are Indian and 34% Chinese)
16 Our Picture of HealthSocioeconomic status
Socioeconomic status is commonly assessed using the New Zealand Deprivation Index Score (NZDep2013), which is a
measure assigned to a patient’s area of residence at the time of national Census.4 NZDep2013 provides a deprivation score
for each meshblock in New Zealand. Meshblocks are the smallest geographical area defined by Statistics New Zealand,
with a population of around 60–110 people. The score is based on nine variables from the 2013 Census relating to income,
home ownership, employment, qualifications, family structure, housing, access to transport and communications.
For these analyses, quintiles (one least deprived to five most deprived) are shown for the total ProCare population and by
ethnicity.
Table 6. ProCare enrolled population according to NZDep Index quintile and ethnic group
Total ProCare Māori Pacific Indian Chinese Euro/Other
NZDep2013 N (%) N (%) N (%) N (%) N (%) N (%)
Quintile 1 195,528 (24) 9,228 (10) 5,337 (5) 7,339 (12) 14,911 (28) 158,713 (31)
Quintile 2 175,522 (21) 11,398 (13) 8,809 (8) 11,155 (18) 15,456 (29) 128,704 (25)
Quintile 3 148,944 (18) 13,716 (15) 13,030 (12) 13,299 (21) 11,102 (21) 97,797 (19)
Quintile 4 136,904 (17) 18,271 (20) 23,684 (22) 17,017 (27) 7,632 (14) 70,300 (14)
Quintile 5 158,424 (19) 36,573 (41) 57,829 (53) 12,859 (21) 4,067 (8) 47,096 (9)
Missing 9,413 (1) 726 (1) 550 (1) 403 (1) 450 (1) 7,284 (1)
Total N 824,735 89,912 109,239 62,072 53,618 509,894
Overall, the ProCare population is evenly distributed by quintile of deprivation (range 17-24%) but this is largely driven by
the combined population of European and Other ethnicities. Marked differences emerge by ethnic group with the majority
of Euro/Other living in least deprived quintiles 1 and 2 (56%) compared with the majority of Māori (61%) and Pacific (75%)
peoples living in the most deprived quintiles 4 and 5.
Fig 2. ProCare enrolled population according to NZDep Index quintile and ethnic group
60%
53%
50%
41%
40%
30%
PERCENTAGE
27%
22% 21%
20%
20%
14% 14%
9%
10% 8%
0%
Māori Pacific Indian Chinese Euro/Other
Q1 Q2 Q3 Q4 Q5
Our Picture of Health 17Household occupancy
There is a strong link between housing and health - mainly for respiratory disease and mental health.5
Aucklanders are currently facing a housing crisis. House prices have become unaffordable, available rental properties are
scarce in many suburbs, state houses are fully occupied and increased overcrowding is being reported by StatsNZ.
While subject to differential reporting by country, New Zealand is recorded as having the worst homelessness in the OECD,
an estimated 40,000 (24,000 people in Auckland) living on the streets or in emergency housing or substandard shelters
without homes. http://www.newshub.co.nz/home/politics/2017/07/nz-s-homelessness-the-worst-in-oecd-by-far.html
We measured household occupancy to evaluate the extent of this issue using eight or more people residing at the same
residential address as a proxy threshold for overcrowding. While this estimate excluded nursing homes and aged residential
care addresses, we were unable to exclude occupants of high rise apartments.
Of the total ProCare population 38,060 (4.5%) of the population were living in homes with a household occupancy of eight or
more (average number per house 11 people). Overcrowding was worse in South Auckland (7%). Further analysis is required
to investigate overcrowding by ethnicity and age.
Table 7. Household occupancy of eight or more by DHB catchment
Total ProCare ADHB WDHB CMDHB
824,735 366,689 262,644 195,402
Household occupancy eight or more 38,060 13,210 (4%) 11,555 (4%) 13,295 (7%)
(People)
Household occupancy eight or more 3,598 1,059 1,198 1,341
(Homes)
Coding of iwi
As part of meeting Cornerstone standards for the Royal New Zealand College of GPs (RNZCGP), some practices have
conducted iwi coding in addition to collecting patients’ self-identified ethnicity.
We sought to gain some measure of this using Clinical Intelligence System (CIS) data aggregated from 110 ProCare practices
with 389,778 patients (47% total population). A preliminary investigation of the IWI CODE field from MedTech revealed a mix
of 137 numeric codes and two free text codes (NGA, NGAP). The numeric codes were matched with the list of StatsNZ iwi
codes.
There were 41,242 Māori identified in the CIS data of whom over 1 in 4 (28%) also had an iwi code.
In total 12,044 recordings of iwi were identified. As expected, the top six iwi represented in this coding were Ngāpuhi, Tainui
and Ngāti Porou followed by Tūhoe, Te Arawa and Ngāti Whātua.
Table 8. Iwi coding within Clinical Intelligence System data (110 Practices)
Total Māori Pacific Indian Chinese Euro/Other
Iwi code recorded in 12,044 11,481 (95%) 199 4 2 358
MedTech
Māori have specific information needs that reflect te ao Māori and Māori aspirations for community and iwi development.
Guidance for the ongoing collection and interpretation of iwi information will in future be undertaken by ProCare Māori
Advisory Committee, ProCare’s Māori providers and Māori community stakeholders.
18 Our Picture of HealthDomain 2: Practices and providers
This domain looks at the general practices and providers who care for ProCare’s enrolled patients.
Full time equivalent GPs and nurses
Table 9 below outlines the number of full time equivalent (FTE) GPs and nurses as of 1 January 2017. This data is from
156/177 ProCare practices, as rest home or residential village medical clinics, East Tamaki Health Care (ETHC) practices and
four practices with incomplete data have been excluded. By FTE category the mean enrolled population, minimum and
maximum patient count (range) and proportion of the total population is given.
Table 9. Size of ProCare practices according to GP and nurse full time equivalents (FTE)
and enrolled patients
GP FTE per Practice (N) Mean Range Min. Range Max. Total Pop FTE per 1FTE/pts
practice enrolled (%) 1000
patients
0-1.9 FTE 73 2,251 600 6,433 164,354 0.55 1FTE/1818
(23%)
2-3.9 FTE 51 4,643 1,673 11,364 236,799 0.59
(33%)
4-6.9 FTE 26 8,471 6,352 13,113 220,253 0.62
(31%)
7+ FTE 6 15,656 11,523 19,443 93,938 0.59
(13%)
Grand Total 156* 4,586 600 19,443 715,344 0.59 1FTE/1694
Nurse FTE/
practice
0-1.9 FTE 84 2,556 600 4,995 214,707 0.37** 1FTE/2703
(30%)
2-3.9 FTE 42 5,241 996 11,364 220,103 0.51
(31%)
4-6.9 FTE 23 8,166 2,992 14,648 187,828 0.58
(26%)
7+ FTE 7 13,244 6,532 19,443 92,706 0.95
(13%)
Grand Total 156* 4,586 600 19,443 715, 344 0.54 1FTE/1852
* rest home or residential village medical clinics, ETHC practices and four practices with clearly incomplete data have been excluded
**13 practices appear to have 0 nurse FTE
Small practices (those with fewer than four GP FTE) make up 79% of ProCare practices and care for 56% of the total
enrolled population. These small practices also have fewer than four nurse FTEs per practice with 13 practices having no
nurse recorded in the customer relationship management (CRM) system which is updated quarterly. The ProCare practice
engagement team was consulted regarding data validity and confirmed that FTE reports by practice were as expected.
ProCare has on average 1 GP FTE per 1,694 patients (0.59 FTE /1000 patients). This is a slightly higher enrolled patient
ratio (or slightly less GP FTE) than the Ministry of Health reported New Zealand average of one GP FTE per 1,650 patients
(0.61/1000 patients).
The variation in nursing workforce is marked between the smallest and largest ProCare practices; small practices having an
average 0.37 nurse FTE vs 0.95 nurse FTE in large practices.
Our Picture of Health 19The overall practice average nurse FTE/1,000 is 0.54 (equivalent to one nurse FTE to 1,852 patients). The only external
comparison practice average nurse FTE/1,000 data that was found was from a Medical Assurance Society report (MAS
HealthyPractice®Subscriber Analysis Report, January 2014) from 551 practices around New Zealand (one nurse FTE to 1,959
patients [0.51/1,000] and one GP FTE per 1,663 patients [0.60/1,000]). According to this report, compared to 551 practices
around New Zealand, ProCare has more nurse FTE/1,000.
There is currently no data indicating the number of nurse practitioners, health navigators/coaches and health care assistants
within ProCare practices. This is a gap in information that could guide work undertaken by the Patient Services Team and
Equity Team regarding healthcare provider scope of practice, expansion of skills, capability and needs.
Average GP and nurse FTE/1,000 of domiciled patients by DHB
An analysis was undertaken to calculate the average GP FTE/1,000 of domiciled patients by Auckland regional DHB
catchment. While practices may be located in a specific DHB catchment, this analysis is problematic as they often have
enrolled patients who are domiciled in all three DHB areas and also patients who are domiciled in other regions. Therefore
the FTE has been apportioned by the size of the domiciled population within each practice. For example, Table 10 describes
Practice X with 6.8 GP FTE. This practice is located in central Auckland and has a total population of 10,378 patients who
reside mostly in ADHB or WDHB but a small proportion who also live in CMDHB and regions beyond.
Table 10. Explanatory table of FTE split by patient domicile for an individual central Auckland practice
ADHB WDHB CMDHB Other DHB Total enrolled pop
Practice X 7,273 2,507 483 115 10,378
6.8 GP FTE split 4.77 1.64 0.32 0.08
For the 156 ProCare practices included in the initial FTE tables, the average GP and nurse FTE/1,000 of domiciled patients by
DHB is shown in Table 11.
Table 11. GP and nurse FTE split by patient domicile
ADHB WDHB CMDHB Other
GP FTE /1,000 0.61 0.57 0.58 0.59
1 GP FTE/1,639 1 GP FTE/1,754 1 GP FTE/1,724 1 GP FTE/1,694
patients patients patients patients
Nurse FTE /1,000 0.48 0.51 0.66 0.62
1 nurse FTE/2,083 1 nurse FTE/1,961 1 nurse FTE/1,515 1 nurse FTE/1,613
patients patients patients patients
GP FTE in ADHB is the same as the national average, but slightly lower in the other DHB catchments. Nurse FTE in Counties
Manukau is much higher than the other DHB regions and the MAS report of 551 New Zealand practices (average nursing FTE
0.51/1,000).
20 Our Picture of HealthFigures 3. and 4. represent the variation in GP and nurse FTE across the network practices ordered by FTE/1,000 enrolled
patients with blue bars representing those practices with above average FTE and orange representing those below this
average.
Fig 3. GP full time equivalents (FTE) per 1,000 patients by practice
Above average
Below average
GP FTE/1000 ENROLLED PATIENTS
Average 0.59
PROCARE PRACTICES
Fig 4. Nurse full time equivalents (FTE) per 1,000 patients by practice
Above average
Below average
NURSE FTE/1000 ENROLLED PATIENTS
Average 0.54
PROCARE PRACTICES
Our Picture of Health 21Domain 3: Access and utilisation
Very Low Cost Access practices
From October 2009, the Ministry of Health brought into effect a Very Low Cost Access (VLCA) payment as a strategy to
improve access to primary care for high needs patients. The payment was limited to PHOs and contracted general practices
meeting the eligibility criteria of 50% high needs population (defined as Māori, Pacific or New Zealand Deprivation Index
quintile 5), and currently charging or prepared to reduce their fees to:
• zero fees for children 0–12 years
• $12 maximum for children 13–17 years
• $18 maximum for adults 18 years and over.
VERY LOW COST ACCESS
55 (VLCA) PRACTICES
ProCare has 55 VLCA practices (inclusive of ETHC practices):
• 19 within ADHB catchment
• 11 in WDHB
• 25 in CMDHB
• 310,411 (38%) of the ProCare population is enrolled in a VLCA practice
• Of these 310, 411 patients just over half (55% mean) were classified as being of high needs.
Who is missing out?
Of the total 263,173 classified as being high needs (Māori, Pacific or Q5) across the whole of ProCare, 66% were enrolled in a
VLCA practice. Therefore 89,844 (34%) high needs patients are missing out on VLCA subsidies.
66 % Of high-needs patients (263,173)
are enrolled in VLCA practices, so...
34% Of high-needs patients (89,844)
are missing out on VLCA subsidies
Conversely there are 137,062 patients who are not ‘high needs’ but are enrolled in VLCA practices.
22 Our Picture of HealthLocation of VLCA practices and domicile of high needs patients
Figure 5. shows two Auckland regional maps showing the domicile of high needs patients and the location of VLCA practices.
Ideally these two maps would be superimposed on each other. Three notable areas that appear to be inadequately serviced
by VLCA practices are Silverdale-Whangaparoa, the North Shore and Franklin areas.
Fig 5. Auckland regional map showing domicile of high needs patients (Māori, Pacific
and NZDep Quintile 5) compared to location of VLCA practices
HIGH NEEDS POPULATION DISTRIBUTION
VCLA PRACTICE DISTRIBUTION
Our Picture of Health 23GP and nurse visits
Table 12 describes visits for all enrolled patients rather than total consults per practice (i.e. enrolled and casual patients). It also
focuses on patients being seen in the practice that they are enrolled in so total visits per patient may be a little higher because
a ProCare network enrolled patient may also visit another practice. GP and nurse visits include all capitation/general medical
services (GMS) visits in the last 12 months with a second row assigned to other visits types (e.g. ACC). Note that newly enrolled
patients will have fewer visits recorded in the last 12 months. An important consideration is that nursing visits are reported to be
unreliably recorded. Future work is needed to quantify how unreliable the recording of nurse visit is especially if we are moving
to new models of care such as Health Care Home or Mental Health Stepped Care Model.
Table 12. GP and practice nurse visits recorded in the last 12 months by ethnic group
Total pop All high Māori Pacific Other Q5 Indian Chinese Euro/
needs Q1-4 Q1-4 Other
Q1-4
732,198 215,783 74,998 86,650 54,135 33,269 47,348 435,798
GP mean (sd) visits/yr 2.9 (3.5) 3.0 (3.8) 2.9 (3.7) 2.8 (3.6) 3.3 (4.1) 3.1 (3.4) 2.1(2.8) 2.9 (3.5)
GP visits last 12 2,006,442 603,033 203,417 226,832 172,784 100,415 96,325 1,206,669
months (capitation/
GMS)
GP visits last 12 92,507 34,552 11,328 15,501 7,723 3,300 5,311 49,344
months - Other
Total GP/ 2,098,949 637,585 214,745 242,333 180,507 103,715 101,636 1,256,013
other visits
*Nurse mean visits/yr 0.4 0.5 0.6 0.6 0.4 0.4 0.2 0.4
*Nurse and other 307,375 115,247 44,001 47,741 23,505 12,573 9,380 170,175
visits last 12 months
*Nurse visits last 12 4,562 1,703 681 692 330 109 97 2,653
months-Other
*Total nurse/other 311,937 116,950 44,682 48,433 23,835 12,682 9,477 172,828
visits
* 160 practices included in these analyses (ETHC practices and rest home/residential village clinics have been excluded). Nurse recording unreliable.
On average, the total enrolled population see their GP 2.9 times a year with high needs populations (Māori, Pacific and Other
ethnic groups living in NZDep Quintile 5) seeing their GP three times a year. The high needs populations make up 29% of the
population and utilise 30% of GP visits. Total visit frequency (GP and nurse) is similar across ethnic groups except for Chinese
patients who have a lower frequency of visiting in the previous 12 months than all other ethnic groups.
PROCARE PRACTICES – NUMBER OF VISITS
On average, general On average, high-needs
patients see their GP patients see their GP
2.9 times a year 3.0 times a year
24 Our Picture of HealthBox and Whisker plot of a funded GP visit (capitation/GMS)
in the previous 12 month per patient by ethnicity
Figure 6. is a Box and Whisker plot of GP visits (capitation/GMS) in the last 12 months by ethnic group. The grey rectangles at
the bottom of the plots represent percentiles of patients having a funded GP visit (capitation/GMS) in the previous 12 months.
The top of the grey rectangles is the 75th percentile and the the dark line above the rectangle represents the 95th percentile.
The blue lines are called the ‘whiskers’ and represent the range of per patient visits e.g. from 0 to 165 visits for a Māori patient
and 0 to 214 for a European/Other patient.
Fig 6. Box and Whisker plot of a funded GP visit (capitation/GMS) in the previous 12 month
per patient by ethnicity
220
214
200
PATIENT VISIT FREQUENCY IN THE PREVIOUS 12 MONTHS
180
160 165
140
120 125
120
110 108
100
97
80
60
40
95
20 percentile
0
Māori Pacific Indian Chinese Euro/Other
RANGE OF VISITS FOR TOTAL POPULATION
(0-214 VISITS)
50 %
From this plot we can see that there is little ethnic group variation in per person
funded GP visits (capitation/GMS).
• 50% of patients will have between zero and three funded GP visits/year
• 75% of patients will have less than eight funded GP visits/year of patients will have
• 5% will have 18 or more visits/year. Future work needs to characterise
the sociodemographic and morbidity patterns of this 5% of patients to
determine how best to support them.
MORE
THAN 3 FUNDED
GP VISITS A YEAR
IN 2016
MORE THAN 2.4 million Nurse & GP consultations
Our Picture of Health 25Visit frequency by low cost access
As visit frequency may be determined by cost, further analyses were conducted separating per patient visit frequency by
VLCA enrolment.
Table 13. GP and practice nurse visits recorded in the last 12 months stratified by VLCA
or non-VLCA practice and ethnic group
Total pop Māori Pacific Other Q5 Indian Chinese Euro/
Q1-4 Q1-4 Other
Q1-4
504,719 35,674 25,095 26,997 18,723 35,900 362,330
Non-VLCA GP mean (sd) visits/yr 2.8 (3.4) 2.9 (3.7) 2.9 (3.6) 3.3 (4.1) 2.9 (3.3) 2.1 (2.7) 2.8 (3.4)
practices
GP visits last 12 months 1,368,474 97,507 69,522 86,045 52,914 72,172 990,314
114
(capitation/GMS)
GP visits last 12 months - 59,867 5,530 3,530 4,138 2,176 2,462 42,031
Other e.g. ACC
Total GP/other visits 1,428,341 103,037 73,052 90,183 55,090 74,634 1,032,345
*Nurse mean visits/yr 0.3 0.3 0.2 0.4 0.3 0.2 0.3
*Nurse and other visits 155,845 10,824 5,691 9,881 5,149 6,830 117,470
last 12 months
*Nurse visits last 12 2,947 281 162 80 44 75 2,305
months - Other e.g. ACC
*Total nurse/other visits 158,792 11,105 5,853 9,961 5,193 6,905 119,775
Total pop Māori Pacific Other Q5 Indian Chinese Euro/
Q1-4 Q1-4 Other
Q1-4
227,479 339,324 61,555 27,138 14,546 11,448 73,468
VLCA GP mean (sd) visits/yr 2.9 (3.7) 2.8 (3.8) 2.8 (3.6) 3.3 (4.2) 3.3 (3.6) 2.4 (3.2) 3.0 (3.6)
practices
GP visits last 12 months 637,968 105,910 157,310 86,739 47,501 24,153 216,355
46
(capitation/GMS)
GP visits last 12 months - 32,640 5,798 11,971 3,585 1,124 2,849 7,313
Other e.g. ACC
Total GP/other visits 670,608 111,708 169,281 90,324 48,625 27,002 223,668
*Nurse mean visits/yr 0.7 0.9 0.7 0.5 0.5 0.2 0.7
*Nurse and other visits last 151,530 33,177 42,050 13,624 7,424 2,550 52,705
12 months
*Nurse visits last 12 1,615 400 530 250 65 22 348
months - Other e.g. ACC
*Total nurse/other visits 153,145 33,577 42,580 13,874 7,489 2,572 53,053
* 160 practices included in these analyses (ETHC practices and rest home/residential village clinics have been excluded). Nurse recording unreliable.
26 Our Picture of HealthOverall there was no difference in GP visit rate between VLCA and non-VLCA practices for high-needs patients although
there was a tendency for Indian, Chinese and European/other (non-high needs) populations to visit more frequently in VLCA
practices. However, recorded nurse visits in VLCA practices were 2-3 fold greater for all ethnic groups except for Chinese.
Age is an important predictor of visit frequency in the last 12 months due to increasing co-morbidities with advancing age.
Mean GP and nurse visits by VLCA enrolment were also analysed by age groups 45-64 years and 65 years and over. The
following observations were found:
• GP and nurse visit frequency increased with age in both non VLCA and VLCA practices
• Overall visits were more frequent in VLCA practices especially recorded nurse visits
• Within VLCA and non-VLCA practices, Māori, Pacific and other patients living in the most deprived quintile of NZ
Deprivation Index saw their GP more than European and Other patients
• Māori, Pacific and other patients living in the most deprived quintile of NZ Deprivation Index saw their GP slightly more
if enrolled in a VLCA practice than their counterparts enrolled in a non-VLCA practice.
Table 14. GP and practice nurse visits recorded in the last 12 months to VLCA or non-VLCA practices
by age and ethnic group
Low cost Age Total Māori Pacific Other Indian Chinese Euro/
access group pop Q5 Q1-4 Q1-4 Other
years Q1-4
Non-VLCA 45-64 Count 138,876 7,539 5,393 6,670 3,807 8,772 106,695
practices
GP mean (sd) visits/yr 2.9 (3.1) 3.6 (4.1) 3.6 (3.8) 3.6 (3.3) 3.6 (3.9) 2.0 (2.4) 2.8 (3.0)
114
Nurse mean 0.4 0.5 0.4 0.4 0.5 0.2 0.4
65+ Count 71,832 2,079 1,895 3,992 1,378 3,305 59,183
GP mean (sd) visits/yr 5.3 (4.7) 6.1 (5.3) 5.6 (4.7) 6.2 (5.6) 5.2 (4.0) 3.5 (3.2) 5.3 (4.6)
Nurse mean 0.7 0.8 0.4 0.9 0.6 0.3 0.7
VLCA 45-64 Count 54,254 7,560 12,336 6,599 3,443 3,399 20,917
practices
GP mean (sd) visits/yr 3.6 (3.9) 4.1 (4.5) 4.0 (4.1) 3.9 (4.2) 4.3 (3.9) 2.4 (3.0) 3.2 (3.5)
46
Nurse mean 0.9 1.4 1.2 0.6 0.8 0.2 0.8
65+ Count 24,808 1,992 4,423 3,769 1,297 1,750 11,577
GP mean (sd) visits/yr 5.7 (5.1) 6.6 (5.7) 5.9 (5.5) 6.0 (5.6) 5.9 (4.6) 4.0 (3.9) 5.6 (4.8)
Nurse mean 1.4 2.5 1.6 0.9 1.2 0.5 1.5
Our Picture of Health 27You can also read