The AMA Prescription for Private Health Insurance - Australian ...
←
→
Page content transcription
If your browser does not render page correctly, please read the page content below
The AMA Prescription for Private Health Insurance
Introduction..................................................................................................... 2
AMA’s Call for action...................................................................................... 4
Background..................................................................................................... 5
  Private Health Insurance – a key part of public health policy............................ 5
  Private Health Insurance – demographic dilemma............................................ 5
  Private Health Insurance – no longer affordable?............................................. 7
  Community rating – a fair system for all, when all are part of the system........ 8
A Reform Agenda........................................................................................... 9
  1. Private Health Insurance Premium Rebate................................................... 9
  2. Lifetime Health Cover loading................................................................... 11
  3. Youth Discounts....................................................................................... 14
  4. Minimum Private Health Insurance Returns............................................... 16
  5. Transparency and Out of Pocket costs....................................................... 20
  6. Regulation of Private Health Insurers......................................................... 25
  7. Medicare Levy Surcharge.......................................................................... 27
Conclusion..................................................................................................... 28
List of Figures................................................................................................ 29
Acknowledgements...................................................................................... 30

INTRODUCTION
Private health insurance is in trouble.
Even before the impact of the COVID-19 pandemic has been fully realised, private health insurance was in trouble.
Membership has fallen continuously for the last 19 quarters or almost 5 years1, and none of the Government’s recent
reforms have reversed this decline. Younger people continue to drop their private hospital insurance, while people over
65 years are taking it up in increasing numbers, further jeopardising the stability of the system.
Demographic shifts have created a trend which places upward pressure on premiums for those who maintain their
insurance, leading the Australian Prudential Regulation Authority (APRA) to state that private health insurance is in a
‘stable but serious condition, with that stability under threat’2. The AMA is concerned that the likely financial impact
resulting from the COVID-19 pandemic including unemployment, underemployment and a slowing economy, will result
in even more young people giving up their insurance, increasing pressure on an already unstable system.
To stem the exodus of policy holders, we need to increase the value and decrease the pressure on premiums, at the
same time. This is a difficult task in a complex policy environment, where multiple policy levers over many years have
been introduced - but are no longer fit for purpose.
The policy settings to support private health insurance in Australia are not set and forget. Demographics, wages, chronic
disease, technology and health care all change, and we need to respond to these changes to ensure Australia’s private
health system remains stable. To fix the private health system careful reform will be required both in the short and long
term. In the short term, all the policy levers operated by Government will need to be recalibrated.
It is not an impossible task. Utilising publicly available data the AMA has developed a list of policy prescriptions to
improve the health of the system. Some of these policy proposals will require further modelling and development
by Government, due to the limitations of publicly available data. But some of these steps can be undertaken by the
Government in the forthcoming October budget.
Each proposal has one of two ultimate goals – to either make private health insurance more affordable for those who
currently cannot afford it, or to improve its value proposition for consumers, and the wider health system.

Impact of the COVID-19 pandemic
Businesses across all industries have been affected by the COVID-19 response. Almost half of all businesses have been
affected directly by government restrictions, and almost 70 per cent have suffered a reduction in demand. Business and
consumer confidence are at record lows3.

1 https://www.apra.gov.au/sites/default/files/2020-05/Quarterly%20private%20health%20insurance%20statistics%20March%202020.pdf
2 https://www.apra.gov.au/news-and-publications/apra-member-geoff-summerhayes-speech-to-members-health-directors-professional
3 https://grattan.shinyapps.io/covid-econ-tracker/ Business activity viewed 2 July 2020

                                                                                                                                 2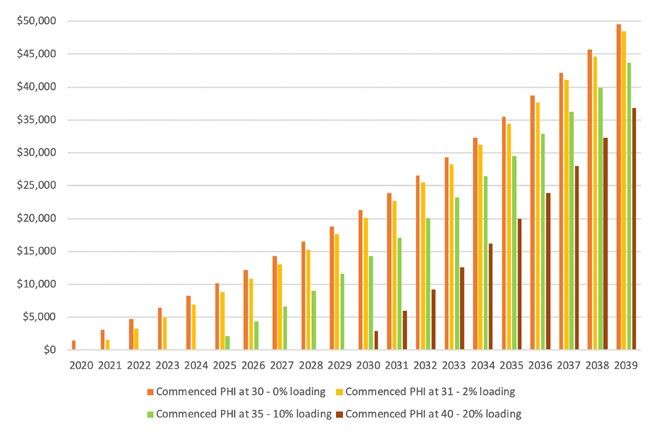
2.7 million people either lost their jobs or lost hours of work in April. The official unemployment rate reported by the
Australian Bureau of Statistics for May had increased to 7.1% but is likely to climb higher4. Also reported in the May
statistics is the underemployment rate, currently sitting at 13.1%5. It is likely to be several months before the full extent
of the employment shock is known, let alone how long the road to recovery will be.
The COVID-19 pandemic has disrupted routine hospital services globally. This was also the case in Australia when on
1 April 2020 all nonurgent elective procedures in both the public and private sector were cancelled due to the concerns
around the level of personal protective equipment and the continued depletion of the National Medical Stockpile6. This
announcement saw the surgery levels plummet across Australia immediately, with significant impact on the viability of
private hospitals.
Private health insurers responded to the pandemic by delaying their premium increases for at least six months and
offering hardship provisions for any customers adversely affected by the pandemic7. But cancelling elective surgery
impacted the value proposition for private health insurance products, and even in the early stages of this pandemic,
recently released private health insurance quarterly statistics indicate that more people have turned their back on
private hospital products8.
The Commonwealth Government announced the easing of elective surgery restrictions from 27 April and further
on May 15. Elective surgery has been resumed in an incremental and cautious way starting with the most critical
surgeries. However, postponing elective surgery during the pandemic in Australia has created a backlog of almost
400,000 cases9 10.
In global terms Australia has been among the better countries in its management and reduction of COVID-19 spread.
This effective management allowed some jurisdictions in Australia to wind back restrictions and restore our lives to
their ‘normal’ settings, while other jurisdictions have maintained or even tightened their controls in the face of a
second wave of infections. Either way, the effects of the pandemic will be felt for some time to come. The International
Monetary Fund (IMF) has warned Australia could be one of the worst-hit economies in the Asian region, with the
Australian economy forecast to shrink 4.5% this year11.
This economic impact will be felt by many, if not all Australians. Reductions in employment and in wages are likely
to translate into Australians having to cut back on expenditure – this may translate to more people forgoing private
health insurance as they struggle to make ends meet.The AMA believes that the policy prescription we have outlined
below will help to counter this trend. It is critical that we do reverse the decline of private health insurance. For without
a strong private hospital sector, our public hospitals will be placed under an increased burden for elective surgeries.
The AMA’s series of Public Hospital report cards12 highlight how waiting times are getting longer and performance
continues to decline year on year.
The AMA believes that our policy recommendations are viable and need urgent consideration for this year’s
Commonwealth Government budget. Our recommendations reflect a deep understanding of why private health
insurance has started to fail, the demographic changes we have undergone in the last decade, and the interplay with
economic factors such as health inflation, wages growth and emerging technology.
The AMA also understands that this is not the end of the story. It is also time for all of us in the private health sector to
set aside our differences and work together. As a sector we need to address underlying issues in order to make private
health insurance sustainable into the future. The changes to policy, outlined in this paper do not comprise the complete
answer. They are the beginning of a process. Further reform and engagement with all players will be crucial, and the
AMA stands ready to lead the medical profession in that effort.

4 https://grattan.shinyapps.io/covid-econ-tracker/ Jobs and unemployment viewed 2 July 2020
5 Labour Force, Australia, May 2020 statistics released 18/6/2020 https://www.abs.gov.au/ausstats/abs@.nsf/7d12b0f6763c78caca257061001cc588
   a8e6e58c3550090eca2582ce00152250!OpenDocument#:~:text=Australia’s%20seasonally%20adjusted%20estimate%20of,0.7%20pts%20to%2013.1%25%3B
6 https://www.health.gov.au/news/australian-health-protection-principal-committee-ahppc-advice-to-national-cabinet-on-24-march-2020
7 https://www.privatehealthcareaustralia.org.au/health-funds-committed-to-providing-financial-relief-for-members-impacted-by-covid-19/
8 https://www.apra.gov.au/sites/default/files/2020-05/Quarterly%20private%20health%20insurance%20statistics%20March%202020.pdf
9 https://www.afr.com/policy/health-and-education/australia-faces-a-backlog-of-400-000-elective-surgery-cases-20200515-p54ta5
10 https://bjssjournals.onlinelibrary.wiley.com/doi/abs/10.1002/bjs.11746
11 https://www.imf.org/en/Countries/AUS viewed 2 July 2020
12 https://ama.com.au/ama-public-hospital-report-card-2019

                                                                                                                                              3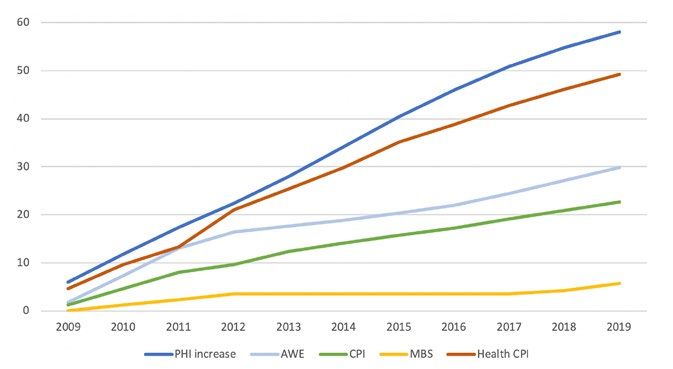
AMA’S CALL FOR ACTION
Premium rebate restored
Restore the private health insurance rebate for targeted groups to make private health hospital insurance affordable for
younger Australians and those in the workplace on lower incomes.

Medicare Surcharge Levy
The Government should reconsider the MLS levels and thresholds, in order to determine what settings are required to
deliver on the policy intent, in a coordinated way with all future reforms.

Minimum payout
A minimum amount returned to the health consumer for every premium dollar paid. There needs to be a standardised
return that is higher than the current private health insurance industry average right now.

Lifetime Health Cover loading
Review of the Lifetime Health Cover loading and penalties – especially the starting age to make it an easy choice for
Australians to stay in private health insurance for life. Review the way in which penalties ramp up for late entrants who
join later in life and pay premiums just before they are most likely to claim.

Youth Discounts
Government youth discounts need to be enhanced and promoted. They also need to be aligned with our
recommended change to Lifetime Health Cover loadings and premium rebate increases for targeted sections of
the community.

Transparency and out of pocket costs
There needs to be a higher standard of transparency applied to health insurer policy documentation to clarify insurer
policy benefit entitlements. Under policy fine print, benefit entitlements change according to the patient’s choice of
doctor(s), choice of treating hospital, timing of treatment and insurer hospital/doctor contracting strategies. Private
health insurance benefit variability generated by these factors is not addressed by Gold, Silver, Bronze and Basic.
The AMA considers transparency essential to restoring consumer confidence in private health insurance.

Regulation of Private Health Insurers
The AMA calls for the establishment of an independent, well resourced, statutory body to regulate the legal conduct of
the private health insurance industry. Although we have a well-resourced Ombudsman, a greater level of oversight will
help instil confidence in the system, especially during periods of policy change.

                                                                                                                            4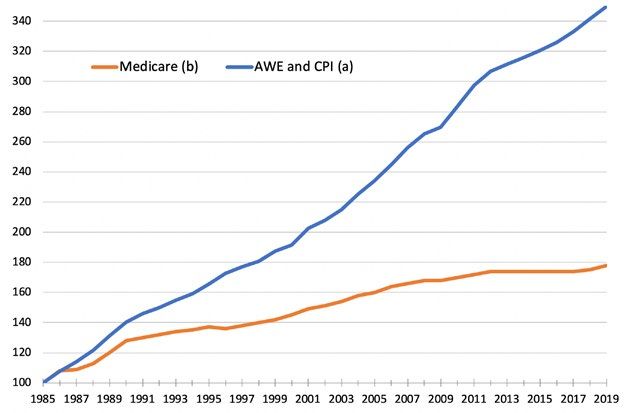
BACKGROUND
Private Health Insurance – a Key Part of Public Health Policy
The unique balance between the public and private sectors makes the Australian health system one of the best in
the world. The AMA supports a system where the public and private sectors work side by side to provide high quality
health care for Australians.
The decline in private health insurance membership is threatening the delicate balance of our combined public and
private hospital capacity. The determination of governments to go on underfunding our public hospitals relative to
demand is pushing public hospitals to the brink, as they struggle to cope with demand for public hospital treatments13.
In 2017-18 private hospitals boosted the number of elective surgeries available to Australian patients – providing nearly
60 per cent of all elective surgery admissions14. Private health insurance is critical in this equation providing patients
with affordable access to a private hospital, choice of practitioner, and often shorter treatment waiting times.
For Government, private health insurance provides a mechanism to co-fund a large number of hospital treatments
to expand total hospital capacity in response to the treatment needs of an ageing, sicker and increasing
Australian population.
Private Health Insurance – Demographic Dilemma
Despite the incentives and subsidies for private health insurance, in recent years the total number of people with
private hospital insurance has fallen. APRA data shows the proportion of the population with private hospital insurance
has dropped from 47.4 per cent in the June quarter of 2015, to 43.8 per cent by March 2020 – 19 quarters of
continuous decline15.
While total decline in private health hospital insurance is 3.6 per cent in a nearly five-year period, the impact on private
health insurance stability is exacerbated further by the changing composition of the insured pool. As younger people
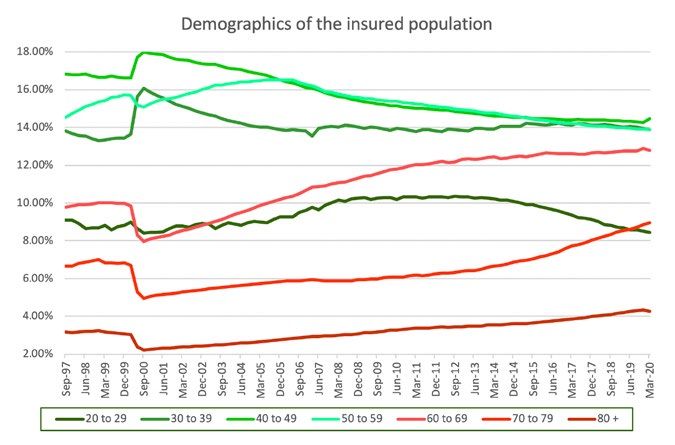
drop their private hospital insurance, people in older cohorts over 65 years are taking it up in increasing numbers.
Those in age groups between 25 and 34 are a full 6 per cent lower in 2018 than in 2015. At the same time, older
Australians 75 and older have increased their membership by 3 per cent, while those 85 and older have increased their
membership by 2 per cent, as demonstrated in Figure 1.
On current trends, without any intervention, APRA predict the level of hospital cover to drop another 1.6 per cent,
or 184,000 hospital policy holders by 2025. Importantly, APRA anticipate a further 345,000 persons in the 20-34
age group to drop private health insurance while an additional 298,000 new members in the 70-84 age cohort are
expected to join16 17.
13 Australian Institute of Health and Welfare shows access to public elective and emergency treatments are getting worse not better. Over the recent four-year period
from 2014-15 to 2018-19 the volume of public elective surgery per 1,000 population has stagnated - increasing by just 0.5 per cent on average.
14 Australian Institute of Health and Welfare (AIHW) 2019. Australian Hospital Statistics: Admitted Patient Care 2017-18 Table 4.2, viewed 3 July 2020, https://www.aihw
gov.au/reports/hospitals/admitted-patient-care-2017-18/data
15 https://www.apra.gov.au/sites/default/files/2020-05/Quarterly%20private%20health%20insurance%20statistics%20March%202020.pdf
16 Estimates based on APRA quarterly statistics, analysis provided by Pioneering Economics.
17 https://www.apra.gov.au/news-and-publications/apra-member-geoff-summerhayes-speech-to-members-health-directors-professional
5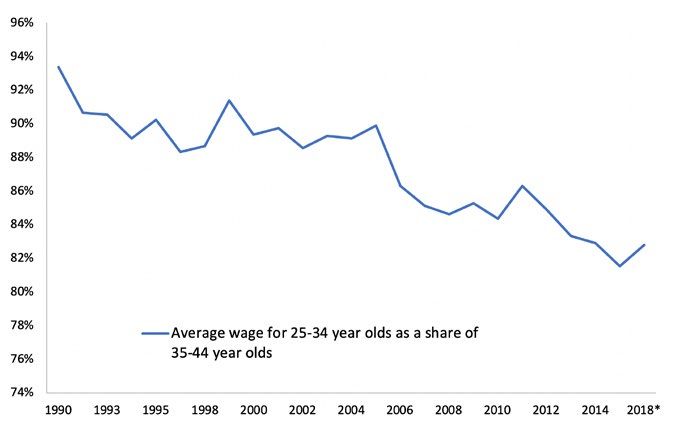
Figure 1: Age groups as a percentage of the insured population18

This is a critical point and is a large part of the rationale for the AMA’s policy recommendations. These demographic
shifts create a private health insurance membership pool skewed towards older patients. Analysis completed for the
AMA indicates in the year to December 2018, Australians aged 55-64 received around 88 per cent of the overall
insured person average benefits, while those aged 65-74 received around 160 per cent of the average. The figures at
this point then increase dramatically – those aged 75-84 received 260 per cent, while those who have insurance and
are 85 years or older received a staggering 310 per cent of the average benefits19.
The greater the mix of older Australians in the insured pool, the greater the claims and the greater the premiums.
As premiums increase, they price out of the market those least able to afford it – including large number of younger
Australians, and families. The rate of premium escalation may also undermine the effectiveness of current Lifetime
Health Cover settings as delayed private hospital insurance purchase with a ten-year premium penalty becomes
increasingly rational for older people.

18 Source: Private health insurance membership trends Mar 2020 https://www.apra.gov.au/quarterly-private-health-insurance-statistics
19 Source: APRA, https://www.apra.gov.au/quarterly-private-health-insurance-statistics, private_health_insurance_membership_and_benefits_statistics_december_2018.xlsx,
   “AUSTRALIA” worksheet, Page 2, “Hospital Treatment and General Treatment Combined”

                                                                                                                                                                          6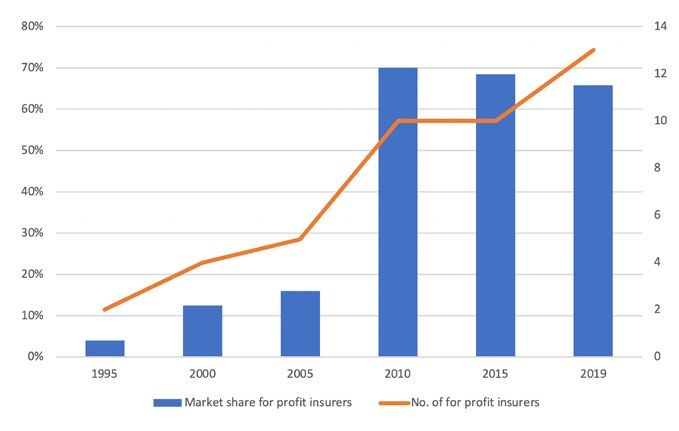
Private Health Insurance – No Longer Affordable?
AMA’s analysis indicates the combined effect of the decline in younger members and the increased uptake of cohorts
aged 65 years and older, and the general ageing of the population means premiums were approximately 5 per cent
higher in 2018 than they would have been if the membership profile in 2015 had been maintained.
Whether private health insurance is affordable is not just how much premiums rise, but how that relates to wages.
Our analysis indicates the decline in the proportion of insured young people, especially cohorts 25-29 and 30-34, has
occurred at the same time as low wages growth for these cohorts. As a result, the gap each year widens between the
health insurance premiums people face, and their wages – bearing in mind the increased cost of living and housing
pressure this group also face.
Outside the ageing demographic and changing mix of insured Australians, one of the other reasons for premium
increases is that health inflation typically outstrips the consumer price index, and average weekly earnings. In addition,
there has been a reduction in funding for the private health system by the Australian Government (and following that,
insurers) via the Medical Benefits Schedule (MBS). The change to a lower indexation rate for the MBS, and then the
MBS freeze, has compounded the impact on the funding of patient services. Past research conducted by the AMA20
has shown how the shift to the current indexation method for the MBS (known as WCI5), generated consistently lower
indexation rates than what was required. For example, between 2000-01 to 2002-03, Average Weekly Ordinary Time
Earnings was around 5.2 per cent while, WCI5 was an average of 2.3 per cent. In just two years this indexation gap
created a cumulative difference of around 8.5 per cent.
Figure 2: Percentage growth of wages, MBS and private health insurance premiums

PHI increase – increase in premiums:
https://www1.health.gov.au/internet/main/publishing.nsf/Content/0B815BFEB8EDECA7CA257BF000195929/$File/
Premium-Round-Individual-Insurer-Average-Premium-Increases%E2%80%931997-to-2020.pdf
AWE – Average Weekly Earnings: 6302.0 - Average Weekly Earnings, Australia 2009-2019
MBS – Medical Benefit Schedule: https://feeslist.ama.com.au/resources-ama-gaps-poster
CPI – Consumer Price Index and Health CPI – Health Consumer Price Index: ABS data 2009 - 2019 6401.0 - Consumer
Price Index, Australia

20 https://ama.com.au/sites/default/files/documents/160604_Indexation_of_MBS_Rebates_FINAL.pdf

                                                                                                                             7
What does this mean for the consumer?
As illustrated in Figure 2, it means that in addition to premiums increasing at a rate faster than wages, the difference
between increasing costs and the MBS rebate generates out of pocket medical gaps. This is effectively a cost shift
from Government to healthcare providers and privately insured patients. This is because what insurers pay towards a
patient’s procedure is both based on, and built upon, the MBS. If there is less Commonwealth Government funding
going towards each MBS item funded under private health insurance, there is less money going towards the patient’s
procedure. Likewise, we have seen insurers link their own indexation rates for their contribution towards medical
services to the MBS. Meaning the other payer in the system, the insurer, has also been “under-indexing” in many cases
and passing these costs onto the patients and clinicians.
Community rating – a fair system for all, when all are part of the system
Not all private health insurance systems around the world are as compassionate and work in the interest of the
consumer as Australia’s.
Our private health insurance system is unique in this regard and the envy of many, due to the fact it is underpinned by
community rating. Patients can transfer between insurers without penalty, patients cannot be excluded outright from
joining a policy or charged premium penalties on the basis of their health status, previous claims history, gender or
genetic predisposition to disease.
Community rating is enacted through the Private Health Insurance Act 2007. The Government introduced the
Community Rating System because it was viewed as unfair that someone with a higher number of claims in the past,
a poorer health status, or simply by virtue of their age, should be discriminated against via pricing for the same level of
insurance coverage. It works by spreading the risk, and thus the cost, equally among members of the community.
Of course, this makes private health insurance (with its goal of providing health services) unlike other types of insurance
such as car and life insurance, which are generally risk-rated. Community rating means health insurers must:
charge everyone the same premium for the same product
provide cover to anybody who seeks it
not charge different premiums based on:
° past or likely future health;
° claims history; or
° age related health risk, pre-existing condition, gender, race or lifestyle.
Community rating works best when people join the private hospital insurance pool early and remain insured. However,
recent years have shown that when there is a reduction in young people in the insurance pool, and an increase in older
people and higher claim rates, it can push up the price of insurance for everyone.
The AMA strongly supports community rating, and the below policy proposals are designed to restore affordability
and improve value for all policy holders, without abandoning the key protections in private health insurance that
Australians value.
8A REFORM AGENDA
Any reform agenda is going to require all the players in the private health system to work together to reverse the
decline we are seeing. The below reform agenda is not just about increased Government funding.
But having diagnosed both an affordability, and an increasing outlays issue, this paper does seek to re-examine how the
existing Government policy levers can be recalibrated to stop this spiral. It also prescribes additional action Government
can, and should, take. The paper then moves to consider how the non-government players in the private health system
can contribute to more efficient service delivery, reduce unnecessary cost or return greater value to the patient and
policy holder.
Only by all stakeholders working together will meaningful, integrated and lasting reform achieve the positive outcome
the community deserves. The paper therefore proposes reforms that are more extensive than published to date.
1. Private Health Insurance Premium Rebate
Current Policy
The Commonwealth Government introduced the Private Health Insurance Rebate on 1 January 1999, to support people
in taking out private health insurance, providing a non-income tested financial support for individuals and families via a
30 per cent reimbursement of premiums paid, or a 30 per cent premium reduction.
The Government has since introduced means testing of the rebate and it has lowered the maximum rebate a policy
holder can get. Through a complex, inadequate indexation process, the Government lowered the maximum rebate a
policy holder under 65 can receive from 30 per cent to 24.808 per cent, as of April 2020.
The Commonwealth’s original estimate of the rebate was $1.09 billion in 1999-2000; $1.8 billion in 2000-01; $1.27
billion in 2001-02 and $1.36 billion in 2002-0321. By 2015-16 this had risen to $6.2 billion21. However, the introduction
of means-testing, indexation and the recent decline in the take up of private health insurance policies, have slowed
this growth considerably. While spending on the rebate was projected to increase to $6.8 billion in 2021-22, the actual
growth in the last few years has not matched projections and in 2019-20 was $6.17 billion22. As a result of these policy
decisions by Government, the average rebate had fallen to 25.3 per cent across all ages and income tiers.
The obvious public policy question to ask is – does the Government still get value from the rebate? Does supporting
Australians to take out private health insurance generate a better outcome for the whole health system?
Private households contribute out of pocket expenses and excess payments, adding an additional $1.29 billion
per annum to the $12.9 billion in hospital premiums paid. Meaning households contribute $14.2 billion in private
contributions to their own health23.
21 https://www.aph.gov.au/Parliamentary_Business/Committees/Senate/Community_Affairs/Completed_inquiries/1999-02/pubhosp/report/c05
22 From budget papers 2014-5 to 2019-20 https://www.health.gov.au/resources/publications/health-portfolio-budget-statements-2019-20
23 Based on the analysis of Pioneering Economics
9This says that private health insurance members contribute $3.78 of additional care delivered for every $1 that the
Government directs to the rebate for hospital treatment.
But sadly, it is not that simple. The private system encourages those who can afford it, to take out private health
insurance. Under a public only model, increased taxation would need to be on everyone. And as economists have
pointed out, raising taxes on an economy causes what is known as a ‘dead weight loss’. Put simply, extra taxation
slows down the spending capacity of an individual, slows demand, and by extension, has a measurable negative
economic impact. The ANU estimates in an Australian context this loss to be $0.34 for every $1 in tax collected through
income tax24.
Of course, there might be some efficiencies by having a single government administrator in a public hospital only
environment, such as lower administration costs and no profits (or retained earnings), and these have been factored
into this analysis. But even so, the net effect is an additional welfare loss of $3.1 billion based on financial year
2017-18, or around 16%, if the government were to become the sole funder of care.
Put simply it means that the public only model would not be as cost effective for government, or society. And of
course, for those unlucky sick individuals there are additional losses of waiting in queues, losing their choice of doctor
and choice of care delivery setting. There are also flow on losses of potential lost earnings while awaiting treatment.
These costs are significant and grow with the length of public hospital waiting times.
Future Policy Direction
Lifting the rebate from the current base rates up to 30 per cent for those aged under 65 and for those aged 65-69 will
have a significant impact on Government rebate expenditure. Lifting the base rebate from 25.06 per cent to 30 per
cent will lift the average rebate for this cohort from 22.5 per cent to 26.9 per cent. For those aged 65-69 it will increase
from 27.8 per cent to 28.5 per cent, while the 70+ cohort will remain unchanged.
Applying the higher rebate only to hospital policies will cost approximately $640 million based on June 2019
membership. This cost will increase, if done in conjunction with other policies that increase membership (which is the
goal), which is likely.
If the target membership rate was to increase by an assumed flat 5 per cent for all under 65 cohorts, this would add a
further $415 million to the cost of the rebate. But importantly, the AMA analysis indicates it would add an additional
675,000 paying members and add approximately $1.5 billion in additional premium revenue to the sector.
Additional members to the insurance pool will of course assist in putting downwards pressure on the premiums
themselves, and start to generate benefits for insurers, the Government and consumers. The analysis prepared for the
AMA suggests that in this scenario, the benefits paid out against the $1.5 billion revenue would only be $850 million –
which would potentially allow premiums to fall by around 3 per cent.
Given the limited public data and difficulty in assessing price sensitivity for potential members, there needs to be
additional work to establish a likely up-take of private health insurance given this rebate change. One option is to
further support those on lower incomes who are also in younger age cohorts.
24 Based on the analysis of Pioneering Economics
102. Lifetime Health Cover loading
Current Policy
Lifetime Health Cover (LHC) is a Government initiative that started on 1 July 2000. It was designed to encourage people
to take out hospital insurance earlier in life and encourage them to maintain it. People who do not take out hospital
cover before the 1st of July following their 31st birthday, but then decide to take out hospital cover later in life, will pay
a 2 per cent loading on top of their premium for every year they are aged over 30. LHC loadings only apply to hospital
cover, and the maximum loading that can be applied is 70 per cent, and once you have paid the loading for 10 years of
continuous cover, it is removed.
The four years of decreasing hospital treatment coverage between June 2015 to March 2020, translates to 52,96525
less people insured – which considering population growth over the period, and an increase in older people taking out
insurance, is clearly problematic. Not only are young professionals dropping out of private health insurance up to age
34 years, due to lack of affordability and low wages growth, there is some risk LHC penalties (which take effect from
age 30), could begin to lock them out of private health insurance long term, rather than encourage them to “get in”
before the penalties start.
Figure 3: Annual growth in average weekly earnings26 and nominal GDP27, 2011-2018
25 https://www.apra.gov.au/quarterly-private-health-insurance-statistics Private health insurance statistical trends March 2020 viewed 30 July 2020
26 ABS, 6302.0 Average Weekly Earnings, Australia, Nov 2018
27 ABS, 5206.0 Australian National Accounts: National Income, Expenditure and Product
11More simply, what was once a signal to buy into insurance when you turn 30 may now be acting as a barrier– for if you
aren’t in a position to buy insurance until the age of 35 (due to starting a career later and low wages growth), you’ll
face some significant penalties under LHC at a time when many young people are also saving to buy a house, repaying
Higher Education Contribution Scheme (HECS) debt and raising children. It is not surprising that younger people are
questioning the value of private health insurance. When considering the cost of paying for insurance at this period of
their lives, versus the costs they incur taking up insurance later and paying the LHC loading – over a long period it is
economically better (by almost $13,000) to delay private health insurance, as illustrated in Figure 4.
This also points to a bigger issue at the other end of the demographic – the LHC penalties do not appear to be
deterring older people joining up far later, and for the purposes/intent of claiming as soon as the waiting period is
complete – which undermines the basis of how insurance should operate.
Figure 4: Increased cumulative cost of hospital insurance starting at 30 or if delaying commencement until 40
Cumulative cost for under 65 single silver insurance purchased in NSW, hospital cover only (average cost from 4
different insurers), increasing 5% annually with no rebate applied28.
Case Study: Under current LHC settings Mary delays taking out private health insurance until age 50 when she
knows she is more likely to need hospital treatment, and will pay a 40 per cent premium loading for ten years (2
per cent premium loading for each year after age 30). This means joining at age 50 incurs an effective four years
additional premium penalty. This tells us that current LHC settings make it financially attractive for some older
cohorts to avoid paying premiums from age 30 and delay private health insurance purchase until later in life and
only pay a relatively short period of premium penalties when their likelihood of claiming is high. This defeats the
LHC objective to pay community rated premiums from age 30 in return for community rated premiums later in life
when high cost health treatments are far more likely.
28 This figure is based on the work of the ABC https://mobile.abc.net.au/news/2018-07-06/cost-of-hospital-insurance-if-delaying-beyond-age-30/9944322?pfm=sm-*
12Future Policy Direction
LHC is a valuable Government incentive that supports our community rated private health insurance system.
But the LHC loadings should be recalibrated to line up with the age of decision when more people have the income
to afford private health insurance. It should be a clear signal to those who can afford private health insurance that
they should take it out. Consideration should be given to whether the starting age for LHC is appropriate, or whether
it needs to be raised from 30 to a point where it can again act as an incentive for early purchase rather than a barrier.
To the extent young people still purchase private hospital insurance after 30, the current LHC penalty revenue to
Government would fall. This cost is more than outweighed by the benefits of restoring more people in their early 30s to
the private health insurance pool.
Noting the influx of older members to the pool, clearly current LHC settings are no longer protecting the community
rating system by acting as an incentive to take out insurance earlier in life and keep it. One option is to revisit
projections as to what a policy holder would have paid in premiums in those years where insurance was not held
and use this to better inform varying LHC rates for each age cohort. There are significant revenue opportunities here
for Government.
Such modelling, updated to account for the cost of premiums today, as well as the changing demographics (such as
current wages growth) would reinvigorate LHC for the current economic environment. Revised policy settings, tailored
to each age bracket, would ensure LHC again offers a strong incentive to join before the cut-off age, but also a strong
disincentive to join at older ages. Government, as the holder of more complete data on historical LHC movements,
should consider modelling alternative models against the updated demographic information.
Combatting the COVID impact
The AMA believes that the economic impacts of the COVID pandemic are likely to increase the number of
Australians relinquishing their private health insurance in the short term. But as the economy recovers, we need
to reduce any impediments to people wanting to return to private health insurance. The AMA believes that the
Commonwealth Government should consider providing a window of opportunity (for example 12 months) where
anyone who drops insurance now due to financial difficulties can rejoin later without being penalised by losing
Lifetime Health Cover.
133. Youth Discounts
Current Policy
While the AMA strongly supports community rating (combined with risk equalisation) supported by LHC, it does
mean that younger Australians pay higher premiums than if they were to be “risk rated”, while older Australians pay
premium rates that are more affordable than they would be if risk rated. The affordability proposition is increasingly
under threat for younger Australians under 35.
Data from the ABS29 ‘Employee Earnings, Benefits and Trade Union Membership, Australia’ publication from 1990 to
2013, and supplemented by the ABS Employee Earnings and Hours Publication for 2014, 2016 and 201830 shows a
persistent decline in the proportion of full-time wages of 25-34 year-olds receive relative to the full-time wages of 35-
44 year-olds (shown in Figure 5). The average wage for a 25-34 year-old has fallen from 93 per cent of a 35-44 year-
olds wage in 1990, to 83 per cent in 2018. Overall wage growth is slow and younger workers are getting less of what
little wages growth there is.
The Government through its latest reforms recognised that the largest fall in private health insurance has been in the
20-29 year-olds31. While seeking to protect community rating, the Government introduced a new policy lever - youth
discounts for insurance premiums – essentially a “reverse” LHC.
Figure 5: Average wage for 25-34 year-olds as a share of wages of 35-44 year-olds
29 ‘Employee Earnings, Benefits and Trade Union Membership, Australia’ publication from 1990 to 2013, and supplemented by the ABS Employee Earnings and Hours
Publication for 2014, 2016 and 2018
30 Employee Earnings and Hours publication for 2016 and 2018 has age groups 21-34 rather than 25-34. Estimates have been adjusted using the 2014 EEH publication
relative wage of 21-24 year olds to 25-34 year olds.
31 Figure 4 ACCC Report to the Australian Senate 1 July 2017- to 30 June 2018 https://www.accc.gov.au/system/files/1494_Private-Health-Insurance.pdf
14Under the reforms, insurers can offer a discount of 2 per cent on premiums for every year someone is under 30, up to a
maximum of 10 per cent for people aged 18 to 25 (Figure 6). Once a policy holder has an age-based discount, they will
retain that discount rate until they turn 41, if they remain on the same policy. These discounts will then be gradually
phased out after a policy holder turns 4132.
Figure 6: Age discounts the insurers can offer (introduced in 2019)
Your age Max discount
29 2%
28 4%
27 6%
26 8%
18–25 10%
Future Policy Direction
Whilst it is still too early to really determine the effect of this policy initiative, the AMA believes that the wages data for
this cohort indicates a clear need for greater promotion of it.
Furthermore, if the Government were to increase the age of LHC loading from 30 to 35, it would make sense to
increase, and align the age which the ‘youth discount’ applies to match this. If the Government does consider changing
the rate of LHC across different age cohorts, again, consideration could be given to more aggressive discounts under
the youth discount policy.
Is it time to change the dependent age on family policies?
The proportion of young adults living in the parental home has been growing over time. In 2001, 47.2% of men
aged 18 to 29 and 36.5% of women aged 18 to 29 were living with their parents, while in 2017, 56.4% of men
and 53.9% of women in this age range were living with their parents33. All these results suggest that young adults
in Australia today are taking more time before leaving education and entering living and working arrangements
that have long defined adulthood. If we look at raising both the LHC and the youth discount age, it would make
sense to also consider changing the dependent age on family policies which currently covers dependent children
until they turn 25.
Health insurers themselves have recently flagged this as an idea as well calling for this age to be raised to 3034.
The AMA believes that the Government should undertake detailed modelling on this policy setting to determine
what the best age defining a dependent on a family policy is.
32 https://www.health.gov.au/resources/publications/private-health-insurance-reforms-discount-for-18-to-29-year-olds
33 The Household, Income and Labour Dynamics in Australia Survey: Selected Findings from Waves 1 to 17p 112 https://melbourneinstitute.unimelb.edu.au/__data/assets
pdf_file/0011/3127664/HILDA-Statistical-Report-2019.pdf
34 https://membershealth.com.au/members-health-calls-for-higher-children-and-dependent-ages-on-family-health-insurance-policies/
154. Minimum Private Health Insurance Returns
Current Policy
Private health insurers will generally aim to set premium levels to cover the expected costs of benefits (that is, coverage
paid for members’ medical treatment), plus the fund’s management costs. As a result, if management expenses as
a proportion of payments are higher, a smaller proportion of premiums is being spent on treatment. Naturally, such
calculations are complex, but it is likely that a greater proportion of premiums being paid towards benefits is one
indicator of value and return on investment.
Management expenses comprise the amount of premiums per policy that are used to manage the business of the fund.
All funds have management expenses and depending on their position in the market and whether they are “for profit”,
they can have varying marketing costs, salaries, overheads and profit margins that need to be built into these expenses.
Currently there is no policy regarding the amount of premiums (consumer and Government investment combined to
purchase a policy) that should be returned in the form of health services. It is worth bearing in mind, past AMA Private
Health Insurance Report Cards have highlighted, there can be a considerable variation in the percentage of hospital
charges covered across Australian and between funds, and likewise for medical fees. The same can be said for the
percentage of funds returned overall as benefits.
There has also been a marked change in the last decade regarding the composition of private health insurance
companies as illustrated in Figure 7. Private health insurers have moved from primarily not-for-profit organisations, to
the current situation where almost 70 per cent of the insured population are now covered by for-profit funds (although
we are seeing a small drift away from the larger for profits in recent times)35 36.
This shift to larger for-profit insurers has been accompanied by a move from funds acting as passive payers to ‘active
funders’ – in some cases as reported in the media, producing sizable profits from the sector for shareholders and
executive remuneration.
35 Table 3 https://patch.australiancentre.muhosting.com.au/publication/private-health-insurance-in-australia-policy-reform-approaches-towards-greater-competition-and
efficiency-to-improve-health-system-performance-2/
36 https://www.apra.gov.au/operations-of-private-health-insurers-annual-report
16Figure 7: Changes in market share of for-profit health insurance funds – 1995 to 2019
In 2017-18 private health insurers collected in total $17.3 billion in revenue for hospital treatment, $12.9 billion in
hospital premiums, and a further $4.37 billion via the Government rebate. Funds paid out $15.19 billion in benefits,
$1.5 billion (8.9 per cent on average) in administration expenses and $520 million in profit (retained earnings for
not-for-profits).
There is high degree of variability in how much each insurer pays for their benefits and their administrative expenses.
Figure 8 shows the amount returned to consumers by insurers in terms of benefits. Across the industry premium
income paid in benefits varies from 78.1 per cent through to 104.2 per cent. Not unsurprisingly, on average the
forprofit funds returned 83.07 per cent of members contributions as benefits, whilst the not for profit funds returned
89.98 per cent. There is also a large variation in what each fund pays in terms of their administrative costs.
17Figure 8: Benefits and managements expenses by insurance fund37.
Benefits as Management expenses Surplus (- Loss) from health
Fund Name
% of contributions as % of contribution income insurance
For Profit Funds
Australian Unity 81.1% 10.7% 8.2%
BUPA 86.2% 7.8% 6.1%
CBHS Corporate n/a n/a n/a
CUA Health 85.7% 9.3% 5.1%
Doctors’ Health 82.0% 9.9% 8.1%
GU Health Corporate 74.8% 14.2% 11.0%
Health.com.au 88.6% 6.2% 5.2%
Medibank 83.6% 8.3% 8.1%
MO Health n/a n/a n/a
NIB 81.8% 11.2% 6.9%
Onemedifund 78.6% 8.7% 11.8%
QCH 87.7% 10.5% 1.8%
Transport Health 83.7% 13.1% 3.2%
83.07% 9.99%
Not for Profit Funds
ACA 88.5% 12.1% - 0.6%
CBHS 93.5% 8.4% - 1.9%
CDH 79.5% 14.9% 5.7%
Defence Health 90.6% 6.2% 3.2%
Emergency Services 98.4% n/a n/a
GMHBA 86.4% 11.9% 1.7%
HBF 87.3% 11.3% 1.5%
HCF 89.7% 9.7% 0.6%
HCI 86.5% 10.4% 3.1%
Health Partners 87.7% 10.0% 2.3%
HIF 90.8% 12.7% - 3.5%
Latrobe 89.4% 10.1% 0.5%
MDHF 88.8% 8.5% 2.7%
Navy Health 88.4% 9.5% 2.1%
Nurses and Midwives 125.6% 19.2% - 44.8%
Peoplecare 89.4% 9.7% 1.1%
Phoenix 88.2% 9.0% 2.8%
Police Health 90.6% 6.7% 2.7%
Reserve Bank 82.2% 12.4% 5.4%
RT Health Fund 84.9% 13.8% 1.2%
St Lukes 89.3% 11.2% - 0.5%
Teacher’s Health 91.0% 7.4% 1.7%
TUH 88.8% 8.7% 2.6%
Westfund 84.0% 12.8% 3.2%
89.98% 10.72%
90+ 85+ 80+ 75+
13+% 12% 11% 10% 9% 8% 7% 6%
.>-2% -2 to -1% -1 to 0% 0 to 2% 2 to 4% 4 to 6% 6 to 8% >8%
37 Data from Table 6 https://www.ombudsman.gov.au/publications/reports/state-of-the-health-funds/all-reports/docs/2019-state-of-the-health-funds-report
18Future Policy Direction
Negative media coverage about the lack of value in private health insurance, coupled with a focus on the profit margins
of the for-profit providers has, to some degree, further eroded the perceived value of private health insurance in the
eyes of the community. This is something that needs to be urgently addressed, especially if Government is called upon
to invest additional taxpayer funds in the private health system. Australians will need assurances that their investment,
via the Government, is going to be returned in the form of appropriate coverage for services, when it is needed.
Furthermore, there is an argument that with the standardisation of clinical categories, and the reforms to standardise
and simplify policies across the entire industry via gold, silver and bronze, that Government increasingly has a role
in promoting private health insurance, which it could expand further. Therefore, a reduction in marketing and
administration costs by each fund trying to replicate this could be expected, especially since policies are now easier
to explain.
The current system based on APRA data indicates a payout ratio of 88 per cent. The AMA suggests that increasing the
target to a higher figure such as 90 per cent, and mandating it across the industry, would build confidence in the eyes
of consumers, return a greater share of funds to patients, and provide justification to the taxpayer for the additional
Government funding outlined in the rest of this paper.
195. Transparency and Out of Pocket costs
Current Policy
There has been ongoing, sustained debate about out of pocket costs, their impact on patients and on the value
proposition of private health insurance more broadly. In some cases, these out of pockets have either been egregious,
or have involved booking fees – both of which the AMA condemns, and agrees further action is required.
But in other cases, out of pockets can be caused by a range of factors, beyond just the practitioner fee. These have
been outlined in detail in the AMA’s Private Health Insurance Report Card38. These can include:
varying private health insurance benefit schedules;
different payment rates in different regions or states;
the linking of gap payments to facility contracts;
different policy details and fine print;
the operation of gap and known gap rates; and
inadequate indexation of the MBS and consequently, insurance benefit schedules.
When Medicare was established, the MBS was roughly commensurate with the AMA fee level for doctors’ services.
Overtime however, there has been a clear separation between the two, with the resulting difference going a large way
to explaining some of the out of pocket concerns consumers now face.
Figure 9: Economic indices from 1986 showing the gap between MBS and Average Weekly Earnings/
Consumer Price Index.
(a) Index comprising of Average Weekly Earnings (AWE) and Consumer Price Index (CPI) (70:30) reflecting the average
cost structures in medical practices.
(b) Index of Medicare fees as determined by the Commonwealth Government.
38 https://ama.com.au/article/ama-private-health-insurance-report-card-2019
20Exacerbating this issue is that private health insurers use the MBS rebate level as the starting point to set their own
benefit amounts, on top of the MBS. Those private health insurance rebates all vary significantly. The latest AMA report
card showed that the rebates for the same procedure could vary by nearly $600 dollars, and nearly 40 per cent39, across
different funds and different states and territories40. Indexation across funds, and within a funds schedule also varies,
and in many cases were also frozen alongside the MBS.
Yet to date, the issue of out of pockets has primarily been blamed on doctors41, despite APRA statistics continuing
to highlight that the overwhelming majority of medical services are carried out under a ‘no’ or ‘known gap’ billing
arrangement (97.5 per cent)42. Clearly, the majority of medical practitioners continue to faithfully bill at the varying fees
set by the insurers.
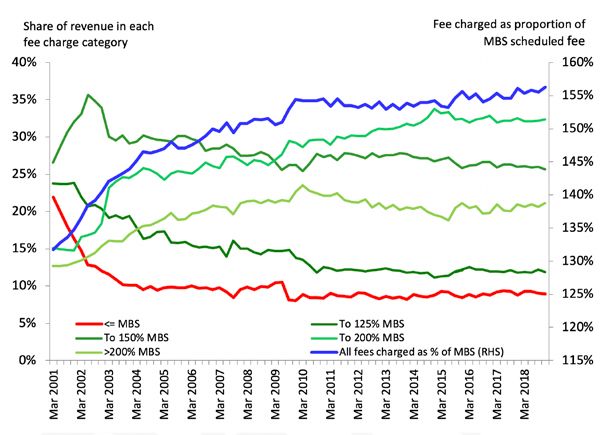
A doctor’s fee combined with an inadequate policy can lead to an out of pocket experience for a private health
insurance member. Aggregate data on all private health insurance charges shows that fees charged as a proportion of
the MBS scheduled fee have risen from 154 per cent in December 2010 to 156 per cent in December 2018.
Fees charged under a ‘no-gap’ policy have remained consistent between 135 per cent and 140 per cent of the MBS
scheduled fee since 201043, starting at 136.7 per cent in December 2010 and rising marginally to 137.4 per cent in
December 2018. This demonstrates remarkable restraint by medical practitioners, considering the freeze in the MBS
during almost half of this time period.
Fees charged are higher for policies without a no or known gap provision. They have increased for those without a
no-gap or known-gap, from 246 per cent of the MBS scheduled fee in December 2010 to 258 per cent in December
2018. The increase in the share of policies without no-gap or known-gap provisions, could lead to an increase in
the complaints about out-of-pocket experiences. Fee disclosure from doctors and policy transparency from insurers
combined are needed to address this issue.
39 Table 3 https://ama.com.au/article/ama-private-health-insurance-report-card-2019
40 Table 4 https://ama.com.au/article/ama-private-health-insurance-report-card-2019
41 https://grattan.edu.au/news/how-greedy-doctors-make-private-health-insurance-more-painful/
42 https://www.apra.gov.au/sites/default/files/2020-05/Quarterly%20private%20health%20insurance%20statistics%20March%202020.pdf
43 https://www.apra.gov.au/quarterly-private-health-insurance-statistics, Private health insurance medical gap statistics
21Figure 10: Fees charged in private health insurance relative to the MBS, 2001-2018
Pressure in the private health insurance system actually stems from an overarching pressure building from inadequate
MBS indexation. Prior to the indexation change in 1996, we can see the fees charged were closely aligned with the
MBS scheduled fee. After this time, every time there is a spike in wage growth, such as the introduction of the GST, or
the mining boom, there is an associated spike in the fee charged relative to the MBS. The long term solution must be to
base MBS indexation on average wages or some combination of wages and CPI in the general economy.
Analysis of Medicare data back to 1985 highlights some of the broader issues. On average, doctors’ fees have increased
relative to the MBS. The increase in fees charged by doctors on average have been a direct response to inadequate
indexation of Medicare as discussed earlier.
22Figure 11: Doctors fee charged as a proportion of the MBS scheduled fee
But medical practices have to work hard to ensure their patients can access the wide number of no gap or known gap
schemes from the full range of insurers, medical practitioners must have multiple fee schedules (sometimes up to 17
different rates) for the same procedure, simply to comply with the different rebates paid by health funds to meet their
no gap requirements for that one procedure, to make sure that patients are not left out of pocket.
Even when a customer has a Gold Level Policy with a chosen insurer – this can still deliver them significant out of
pocket costs. The below example (where a doctor bills a flat fee based on the costs of delivering a quality service) tries
to highlight this variation.
Figure 12: Example - Uncomplicated baby delivery with a medical specialist fee of $2025 (Figures correct as
at 30 June 2020)
MBS No. 16519 MBS Fee: $705.05 Benefit: 75% = $528.80
Insurer Insurer A Insurer B Insurer C Insurer D
Insurer rebate $2058.95 $1575.75 $1630.30 $2068.15
Insurer pays $1,496.20 $176.25 $1,101.50 $1,496.20
Medicare pays $528.80 $528.80 $528.80 $528.80
Patient pays 0 $1,319.95 $394.70 0
1. For this example, Insurer C has a known gap limit of $400
This clearly shows that the idea of the MBS fee being the appropriate rebate for a medical service is not accepted by
the profession, nor by the insurers themselves. The MBS fee is not set at the cost of doing quality medicine – therefore
a gap may not be the doctor charging egregiously but simply the doctor trying to cover the cost of delivering a quality
medical service.
23Nor does the idea that doctors are causing the cost and premium issues with private health insurance hold true. Only
16 per cent of private health insurance benefit outlays for hospital treatments come from medical services, of which
over 97 per cent are billed at the no or known gap level44 - despite the indexation issues.
Clearly the problem is therefore not a cost to insurers issue, but rather one of an erosion of indexation to the patient
rebates, transparency for the patient (of the fee, and their rebate), health literacy (to understand the fee/rebate
relationship, other unrelated out of pocket costs such as excesses or hospital costs), and policy complexity (the
operation of the gap rates and how the insurer rebate drops to 25 per cent of the MBS).
Future Policy Direction
In March 2019 the Commonwealth Government announced that it would launch a national strategy to tackle excessive
out of pocket costs charged by medical specialists, including by developing a website to provide Australians with
transparency about the costs of specialist services45.
The AMA supports and actively encourages full transparency of doctors’ fees, and unreservedly condemns egregious
billing, which occurs in a very small percentage of cases. But informed financial consent requires total transparency.
Unlike the growing range of privately funded fees websites that now exist, a Government-developed website must
be impartial and backed by the Commonwealth’s extensive data set. However, a website that does not have the full
information is not in anyone’s interests.
For admitted hospital treatments, the level of benefits paid by the insurer will depend on the insurer, the particular
insurance policy, and the insurer’s arrangements with the treating doctor, and the treating hospital.
Therefore, the AMA calls for the Government to develop a website which:
Shows not only medical practitioner fees, but the insurers rebates, by fund, state and procedure
Provides health financial literacy around how insurance operates
Provides advice on how to ensure that the hospital is also covered and any excesses
Gives consumers examples of the right questions to ask their practitioner and their insurer
Shows consumers how the rebate can drop when the no and known gap is exceeded, by even a small amount
Provides consumers with avenues to seek further advice.
The AMA believes that a complete resource, which provides transparency all around, while assisting the consumer to
understand the health system, would go a long way to exposing where excessive or egregious out of pockets occur and
assist consumers to purchase better value products.
Furthermore, to highlight the content and approach required for such an online resource, the AMA has developed a
comprehensive guide which could be the basis for the Government’s online resource – the AMA Guide to Informed
Financial Consent.
Finally, the AMA calls on Government to commit to looking at a new, more appropriate indexation model for the MBS,
less variation in insurer rebates and some standardisation around offering a known gap product. Furthermore, the
AMA calls for insurers to stop the practice of linking gap rates to facility contracts – a process that has simply added
complexity for patients and practitioners alike.
44 https://www.apra.gov.au/quarterly-private-health-insurance-statistics
45 https://www.greghunt.com.au/national-strategy-to-tackle-specialist-out-of-pocket-costs/
24You can also read