A far-red hybrid voltage indicator enabled by bioorthogonal engineering of rhodopsin on live neurons - Zou Lab
←
→
Page content transcription
If your browser does not render page correctly, please read the page content below
Articles
                                                                                                         https://doi.org/10.1038/s41557-021-00641-1

A far-red hybrid voltage indicator enabled by
bioorthogonal engineering of rhodopsin on live
neurons
Shuzhang Liu1,6, Chang Lin1,6, Yongxian Xu1,2,6, Huixin Luo1, Luxin Peng1, Xiangmei Zeng1,
Huangtao Zheng1, Peng R. Chen 1,3 ✉ and Peng Zou 1,3,4,5 ✉

Membrane potential is a key aspect of cellular signalling and is dynamically regulated by an array of ion-selective pumps and
channels. Fluorescent voltage indicators enable non-invasive optical recording of the cellular membrane potential with high
spatial resolution. Here, we report a palette of bright and sensitive hybrid voltage indicators (HVIs) with fluorescence inten-
sities sensitive to changes in membrane potential via electrochromic Förster resonance energy transfer. Enzyme-mediated
site-specific incorporation of a probe, followed by an inverse-electron-demand Diels–Alder cycloaddition, was used to create
enhanced voltage-sensing rhodopsins with hybrid dye–protein architectures. The most sensitive indicator, HVI-Cy3, displays
high voltage sensitivity (−39% ΔF/F0 per 100 mV) and millisecond response kinetics, enabling optical recording of action
potentials at a sampling rate of 400 Hz over 10 min across a large neuronal population. The far-red indicator HVI-Cy5 could
be paired with optogenetic actuators and green/red-emitting fluorescent indicators, allowing an all-optical investigation of
neuronal electrophysiology.

T
       he membrane potential is a key biophysical signal that is cen-         and pumps, many of which are activated by blue and yellow light,
       tral to life. The actions of ion-selective pumps and channels          thus allowing an all-optical investigation of neural circuit electro-
       create a charge imbalance across the biological membrane,              physiology10,11. Among the rare examples of far-red voltage sensors,
establishing a dynamic transmembrane electric field that can vary             rhodopsin-based GEVIs (QuasArs10,12, Archers13 and Archon14)
on the timescale of milliseconds. This electric field can, in turn, reg-      sense membrane potential via electrochromism and could emit at
ulate the activities of an array of membrane-localized biomolecules,          >650 nm (Table 1). However, the native fluorescence of rhodop-
including voltage-gated ion channels and G-protein-coupled recep-             sin is approximately two orders of magnitude weaker than a bright
tors1. The membrane potential has been traditionally measured                 organic dye because of the low fluorescence quantum yield of its
with electrode-based techniques such as the whole-cell patch clamp            retinal chromophore15. Thus, applications of these rhodopsin-based
approach. Despite their high sensitivity, electrode-based methods             GEVIs often require intense excitation light (>80 W cm−2)10,14, rais-
often suffer from a lack of spatial resolution, high invasiveness to          ing concerns about an excessive heating effect and phototoxicity16.
cells and low throughput2,3. Optical recording of membrane poten-             Near-infrared voltage-sensing dyes have been developed to achieve
tial offers an attractive alternative by avoiding the above limita-           voltage imaging in cell cultures and brain slices (Table 1)17–20.
tions. Various voltage-sensitive fluorescent indicators have been             Although photo-activation and enzymatic uncaging approaches
developed to probe the membrane potential with high spatiotem-                have enabled the cell-specific labelling of voltage-sensing dyes, they
poral resolution, high throughput and in a minimally invasive and             have not been extended to far-red indicators21–23. Recently, a chemi-
highly parallel fashion. For example, genetically encoded voltage             genetic voltage indicator called Voltron was engineered by fusing a
indicators (GEVIs) are used to report action potentials (APs) and             self-labelling protein tag, HaloTag, to a voltage-sensing microbial
subthreshold activities from genetically specified neuronal popula-           rhodopsin, Ace2 from Acetabularia acetabulum24. Voltron635 has an
tions in cell cultures4,5, brain slices6,7 and living animals2,3,8. Because   emission peak at 656 nm and reports APs in cultured neurons with
most of these GEVIs are based on green or red fluorescent proteins            a modest sensitivity of approximately −3.5% fluorescence change
(FPs), their fluorescence emission has been limited to wavelengths            over baseline level (ΔF/F0) per AP (Table 1)24.
below 650 nm.                                                                     In this Article, we report a novel approach to achieving voltage
    A bright and sensitive far-red indicator is highly desired because        imaging in the far-red spectrum with high speed and sensitivity. We
it could facilitate the simultaneous recording of membrane voltage            employ enzyme-mediated probe incorporation to site-specifically
and other important physiological signals, such as calcium dynam-             conjugate a trans-cyclooctene moiety to an Ace2 mutant, which is
ics and neurotransmitter release9. In addition, a redshifted excita-          subsequently derivatized with tetrazine-conjugated organic fluo-
tion spectrum could enable crosstalk-free pairing of the imaging              rophores via the inverse-electron-demand Diels–Alder cycload-
probe with optogenetic actuators such as ion-selective channels               dition (IEDDA) reaction. The resulting hybrid voltage indicators

1
 College of Chemistry and Molecular Engineering, Synthetic and Functional Biomolecules Center, Beijing National Laboratory for Molecular Sciences, Key
Laboratory of Bioorganic Chemistry and Molecular Engineering of the Ministry of Education, Peking University, Beijing, China. 2School of Life Sciences,
Tsinghua University, Beijing, China. 3Peking-Tsinghua Center for Life Sciences, Beijing, China. 4PKU-IDG/McGovern Institute for Brain Research, Beijing,
China. 5Chinese Institute for Brain Research (CIBR), Beijing, China. 6These authors contributed equally: Shuzhang Liu, Chang Lin, Yongxian Xu.
  ✉e-mail: pengchen@pku.edu.cn; zoupeng@pku.edu.cn

Nature Chemistry | www.nature.com/naturechemistry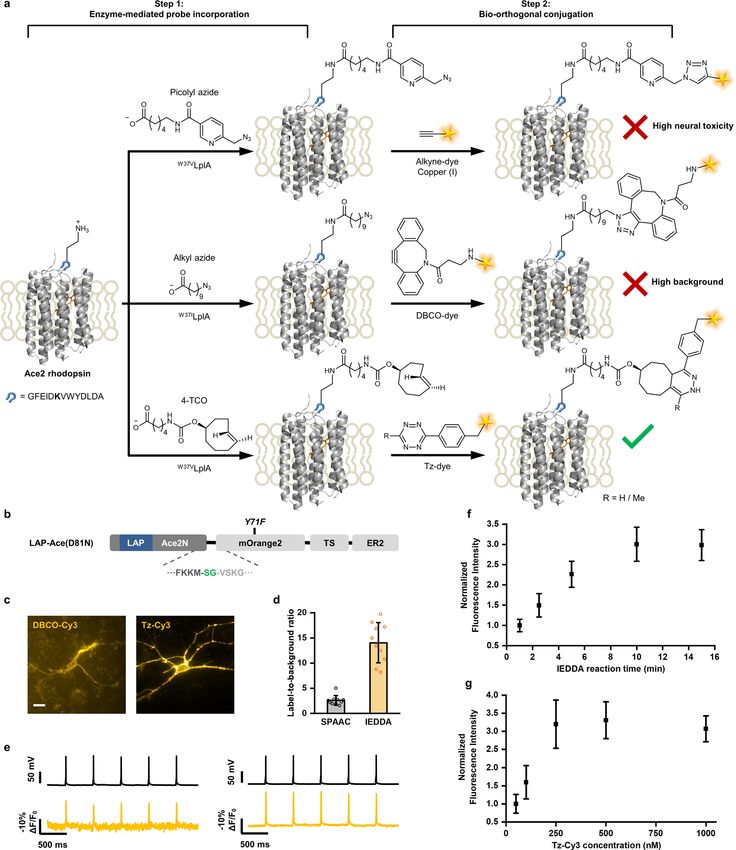
Articles Nature Chemistry
Table 1 | Summary of existing far-red voltage indicators
Name Type Sensitivity (ΔF/F0) Illumination Emission peak Ref.
intensity (W cm−2) (nm)
% per 100 mV a
% per AP b
QuasAr2 GEVI 90 48 300–800 715 Ref. 10
Archer1 GEVI 85 40 88 >660 Ref. 13
Archon1 GEVI 81 30 ~80 >660 Ref. 14
Di-2-ANEP(F)PTEA Dye NA 12.4 NA 632 Ref. 20
Indocyanine green Dye −1.9 NA 0.5 >800 Ref. 19
BeRST 1 Dye 24 9.5 20 683 Ref. 17
Voltron635 Hybrid −4 −3.5 0.5–2 656 Ref. 24
HVI-Cy5 Hybrid −19.6 −12.8 0.2–1.2 662 This study
a
Depolarization from −70 mV to 30 mV. bMeasured in cultured hippocampal neurons. NA, not available.
(HVIs) feature a dye–protein architecture that exhibits a strong reaction. In the resulting dye–protein architecture, because of the
electrochromic effect, in which the dye fluorescence intensities are spectral overlap and the short distance between the fluorophore
dynamically modulated by the strength and direction of the trans- donor and the rhodopsin’s retinal chromophore acceptor, the
membrane electric field. The most sensitive indicator, HVI-Cy3, reporter fluorescence is partially quenched via the FRET mecha-
displays a voltage sensitivity of −39% ΔF/F0 per 100 mV and mil- nism, the efficiency of which depends on the membrane potential
lisecond response kinetics. Voltage imaging with HVI-Cy3 in cul- through an electrochromic effect2,15. We compared several bioor-
tured human embryonic kidney 293 T (HEK293T) cells revealed thogonal reactions on neuronal cell membrane (Extended Data Fig.
gap junction-mediated electrical coupling. The most far-redshifted 1). First, copper-assisted alkyne-azide cycloaddition (CuAAC) was
indicator, HVI-Cy5, reports neuronal APs with a sensitivity 3.6-fold ruled out because of its strong neural toxicity induced by the pres-
higher than Voltron635 (−12.8% versus −3.5% ΔF/F0, Table 1) and is ence of copper at micromolar concentrations28. We then evaluated
spectrally orthogonal to green/red-emitting sensors, which is ben- strain-promoted alkyne-azide cycloaddition (SPAAC). Although
eficial for multiplexed fluorescence imaging of neuronal activities. this copper-free click reaction allowed cell-specific labelling in live
We further demonstrate the power of simultaneous voltage sensing neurons, we observed a high fluorescence background (Extended
and voltage control by combining HVI-Cy5 with blueshifted opto- Data Fig. 1 and Supplementary Table 1), presumably due to the high
genetic actuators to achieve an all-optical investigation of electro- hydrophobicity of the dibenzocyclooctyne (DBCO)-conjugated
physiology in cultured neurons. fluorophore29. The IEDDA reaction between trans-cyclooctene
(TCO) and tetrazine (Tz) is attractive because of its high biocom-
Results patibility and fast reaction kinetics (k ≈ 103–106 M−1 s−1)27,29–33. Given
Construction of hybrid voltage indicators. To obtain a that this reaction has recently been repurposed as a bioorthogonal
far-red-sensing HVI, we first performed bioorthogonal and cleavage reaction with certain TCO–Tz pairs34–38, we carefully con-
site-specific fluorophore labelling of rhodopsin on live neurons. sidered the choice of TCO structure. The position of carbamate
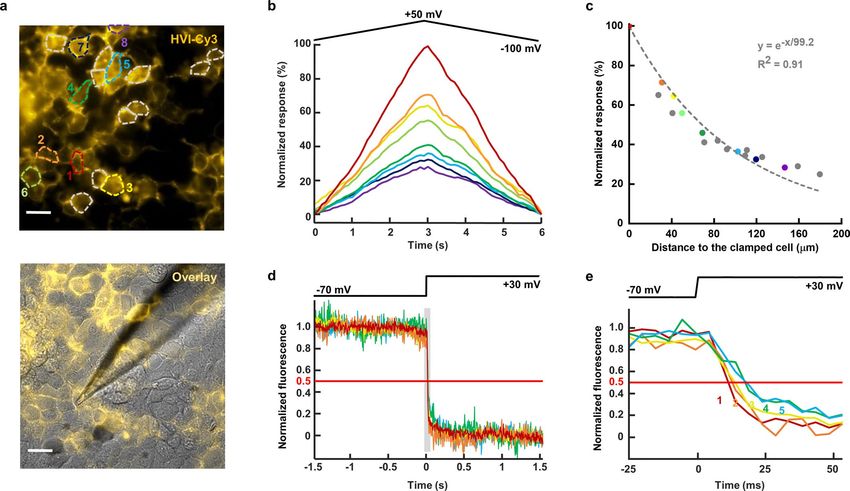
With our strategy, fluorophore labelling takes place via two steps: substitution group on the TCO ring is critical, because derivatives
enzyme-mediated probe incorporation and bioorthogonal conjuga- such as 2-TCO may undergo further rearrangement and elimi-
tion (Fig. 1a and Extended Data Fig. 1). In the first step, a functional nation after the initial cycloaddition with Tz34–38. We thus started
handle (for example, azide or trans-cyclooctene) is introduced to with 4-TCO and commercially available Tz-conjugated dyes as the
the extracellular side of the Ace2 rhodopsin via the PRIME (‘probe IEDDA pair and optimized the probe concentration and labelling
incorporation mediated by enzyme’) technique using an engineered time (Extended Data Fig. 1). We further verified that the reaction
bacterial lipoic acid ligase (LplA) on live cells25–27. Briefly, the car- caused negligible background staining (Extended Data Fig. 1 and
boxyl group in the substrate is activated by adenosine triphosphate Supplementary Table 1) and little perturbation to neuronal electro-
(ATP) into an adenylate intermediate, before being ligated to the physiology and cell viability (Supplementary Fig. 1).
amine group on the lysine side chain of a 13-amino-acid short pep- We also sought to improve the voltage sensitivity through
tide called LAP (Fig. 1a). Before we started, we considered the choice site-directed mutagenesis of Ace2. Based on the crystal struc-
of LAP fusion site in Ace2 rhodopsin. In previous PRIME applica- ture (Fig. 1) and previous biophysical studies, the proton
tions, LAP has been fused to either the N or C terminus of protein acceptor Asp81 residue (homologous to Asp95 and Asp85 in
targets to avoid affecting protein folding and to facilitate enzyme archaerhodopsin-3 and bacterial rhodopsin, respectively39) is
recognition25–27. In the specific case of Ace2, however, C-terminal involved in the acid–base equilibrium of the Schiff base in the
fusion is not possible because it is located at the intracellular side retinal binding pocket, which critically influences the rhodop-
and is thus inaccessible to the enzyme. N-terminal fusion is also sin absorption spectrum and the voltage-sensing process40,41.
problematic because this may interfere with the N-terminal signal We thus focused on the Asp81 site and screened nine mutants.
sequence that is crucial for the proper membrane trafficking of Among these, we identified Asp81CysAce2 as the best-performing
Ace2. Our solution is to insert LAP into the first extracellular loop rhodopsin protein scaffold in terms of sensitivity, signal-to-noise
of Ace2 (Fig. 1a). In addition, introducing fluorophore at this loop ratio (SNR; Fig. 1c and Supplementary Table 2) and membrane
enhances the Förster resonance energy transfer (FRET) efficiency trafficking (Extended Data Fig. 2) in cultured rat hippocampal
of the hybrid sensor, presumably due to a shorter donor–acceptor neurons. Importantly, this single mutation also abolished the
distance compared to N-terminal fusion28. steady-state photocurrent of the wild-type Ace2, which is a highly
In the second step, the functional handle is subsequently deriva- desirable property for voltage indicators (Extended Data Fig. 2).
tized with an organic fluorophore through a bioorthogonal chemical Taken together, we have optimized the conjugation chemistry
Nature Chemistry | www.nature.com/naturechemistry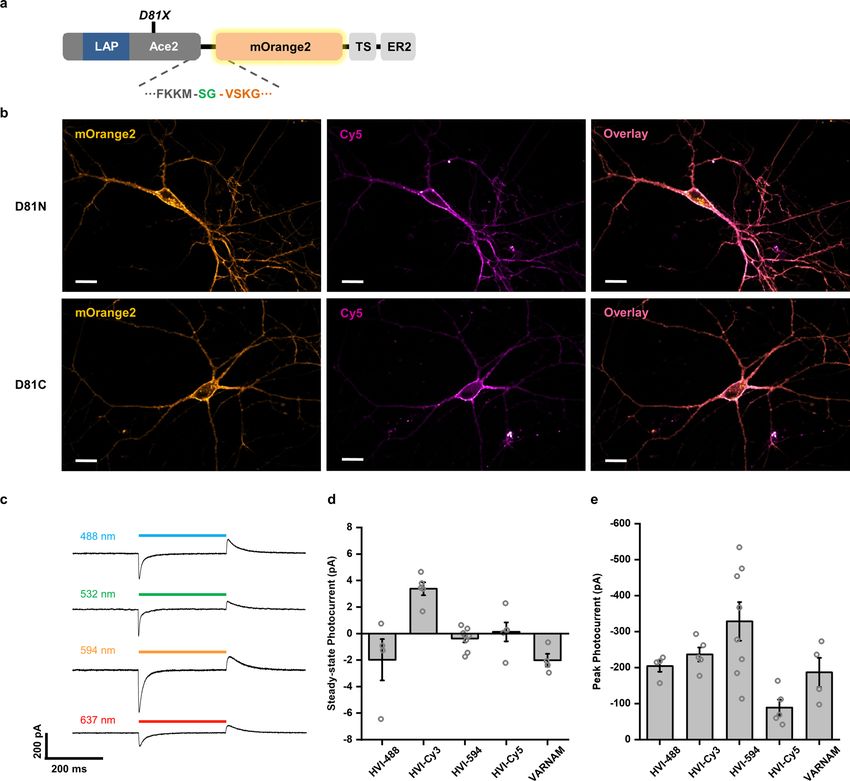
Nature Chemistry Articles
a
T
FRE
= GFEIDKVWYDLDA
O O
H H
N O N O
NH3 HN HN
4 H 4 N
O O
4-TCO H NH
O
H N N
N O + + + + + +
O
4 H
O H N N
Tz dye Rhodopsin
abs. Dye em.
W37V
LplA
ATP AMP + PPi – – – – – –
+
H
Wavelength
Ace2 rhodopsin
Depolarization Hyperpolarization
ing
b c ench
T qu
150
AP SNR AP sensitivity
35 FRE
Asp81 O
H
(acceptor) 120 30 N O
HN
– ∆F/F0 per AP (%)
4 N
Retinal O
90 25 NH
SNR
– – – – – –
60 20
Lys211 Rhodopsin
abs. Dye em.
Asp92 (donor) 30 15 H
+
0 10
PDB: 3AM6 + + + + + + Wavelength
G S H Q T L N A C
H+
Fig. 1 | Design of HVIs through bioorthogonal and site-specific engineering of rhodopsin on the neuronal cell membrane. a, Scheme of fluorescence
labelling. In the first step, the LplA ligase mutant installs a bioorthogonal functional handle (4-TCO) onto the central lysine residue in the peptide substrate
(LAP). ATP is consumed to generate the adenylate intermediate at the active site, which subsequently reacts with the amine to form an amide linkage. In
the second step, the fluorophore is conjugated via an inverse-electron-demand Diels–Alder reaction. Voltage sensing occurs via the electrochromic FRET
(eFRET) mechanism. Upon membrane depolarization, the FRET quenching efficiency increases, leading to lower fluorescence emission from the donor. b,
Crystal structure of light-sensitive proton pump Ace2. A zoomed-in view of the retinal binding pocket is shown on the right. Proton translocates from Asp92
to Asp81 via the Schiff base linkage between Lys211 and the retinal chromophore (PDB: 3AM6). c, Voltage sensitivities and the AP detection signal-to-noise
ratios (SNRs) of Ace(D81X) mutants. Rat hippocampal neurons expressing Ace(D81X) were labelled with Tz-Cy3. Stimulated AP firing was triggered via
current injection using a whole-cell patch clamp method. n = 4 cells (D81G), 6 cells (D81S), 4 cells (D81H), 4 cells (D81Q), 4 cells (D81T), 5 cells (D81L), 9
cells (D81N), 5 cells (D81A) and 8 cells (D81C), respectively. Error bars represent s.e.m.
(IEDDA) and obtained an enhanced rhodopsin protein scaffold analysis. Among these, HVI-Cy3 showed the highest sensitivity
(Asp81CysAce2), which we used for all subsequent experiments. (ΔF/F0 = −39.1 ± 0.8% per 100 mV; mean ± s.e.m.) and millisecond
response kinetics (half-life τ1/2 = 1.70 ± 0.07 ms in the depolarizing
Cellular characterization of HVI series. We created a panel step (mean ± s.e.m.); Fig. 2b,c and Supplementary Table 3). Even
of Asp81CysAce2–fluorophore hybrid voltage indicators (hereafter the most redshifted indicator—HVI-Cy5—exhibited a remark-
referred to as HVIs) through the IEDDA reaction with commer- able sensitivity (ΔF/F0 = −19.6 ± 0.8% per 100 mV; Fig. 2b,c and
cially available tetrazine–fluorophore conjugates (Supplementary Supplementary Table 3). Consistent with the model of electrochro-
Table 8). Notably, to construct our far-red HVI we used Cy5 as the mic FRET, voltage sensitivities of HVIs are dependent on the dye
fluorophore because of its desired excitation/emission spectrum emission spectra (Fig. 2d).
(ex. peak at 649 nm; em. peak at 670 nm) and high molecular bright- To demonstrate the high voltage sensitivity and fast response of
ness (extinction coefficient ε = 2.5 × 10⁵ M−1 cm−1, fluorescence HVI-Cy3, we applied this probe to visualize electrical coupling in
quantum yield Φ = 27%)42. We chose 3-methyl-6-Cy5-substituted cultured HEK293T cells. At the contact sites between neighbour-
Tz (mTz-Cy5), which is a more stable molecule than Tz-Cy5 during ing cells, hexameric connexin proteins on the plasma membrane
chemical synthesis and has a high reactivity towards 4-TCO. More assemble into gap junction channels that allow the intercellular
importantly, the introduction of a methyl group at the 3-position exchange of molecules smaller than ~1,000 Da (refs. 43,44). Because
would substantially stabilize the tetrazine ring towards amines and ions can also diffuse across the gap junction, a monolayer of cul-
thiols that are highly abundant in the cellular milieu27,33. tured HEK293T cells can be electrically connected across a long dis-
We characterized the dynamic ranges and response kinet- tance. Traditionally, electrical coupling has been investigated using
ics of HVIs in HEK293T cells (Fig. 2a and Supplementary Fig. a dual patch clamp technique, which is technically challenging. For
2). The membrane potential was controlled via whole-cell volt- voltage imaging, we labelled cells with HVI-Cy3 and controlled the
age clamp and varied linearly between −100 mV and 100 mV. membrane potential of a single cell via patch clamp, while simulta-
Fluorescence image series were acquired simultaneously, and neously monitoring the fluorescence from the entire field of view of
whole-cell-averaged fluorescence from a manually selected region dozens of cells (Extended Data Fig. 3). The fluorescence response
of interest was used for quantitation. For comparison, two FP-based to the command voltage decayed exponentially as a function of
GEVIs—Ace2N-mNeon2 and VARNAM3—were included in the distance between the measured cell and the patch pipette, with a
Nature Chemistry | www.nature.com/naturechemistry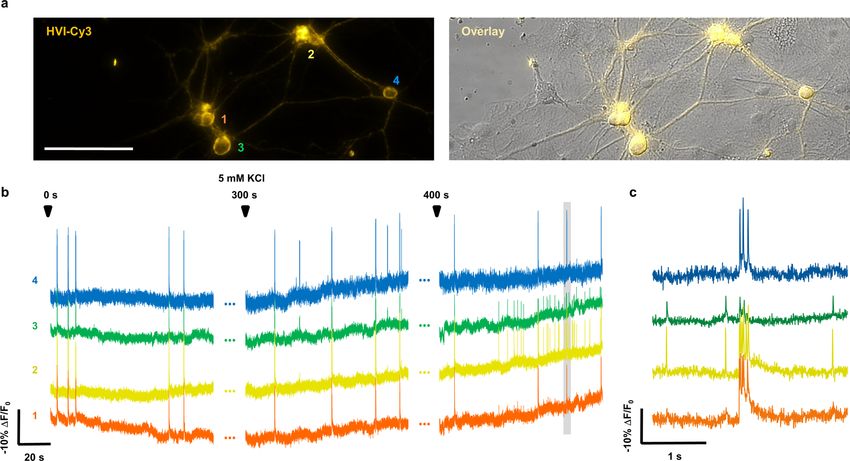
Articles                                                                                                                       Nature Chemistry

  a                                                                                                                                            VARNAM
                                                                                                                      Ace2N-mNeon

                        AF488                Cy3               AF594                               Cy5
  b                 –100 mV

  –30 mV
      20%

                         +100 mV
         200 ms

  c               –50                                             HVI-Cy3       d            –40                                                          1.0
                                                                                                                                               AF488
                                                                                             –35                                               Cy3
                  –40                                                                                                                          AF594      0.8
                                                                  HVI-594                    –30                                               Cy5

                                                                                                                                                                Emission (a.u.)
                                                                                             –25
                                                                                per 100 mV
                  –30                                                                                                                                     0.6
      ∆F/F0 (%)

                                                                                 ∆F/F0 (%)
                                                                  HVI-Cy5                    –20
                  –20                                                                                                                                     0.4
                                                                                             –15
                                                                  VARNAM                     –10
                  –10                                                                                                                                     0.2
                                                                                              –5
                   0                                                                           0                                                         0
                   –100            –50             0         50                                 450      500    550     600     650      700   750     800
                                         Vm (mV)                                                                       Wavelength (nm)

Fig. 2 | Characterization of the HVI voltage response dynamic range and kinetics in HEK293T cells. a, Scheme of HVIs labelled with AF488/Cy3/AF594/
Cy5, Ace2N-mNeon and VARNAM. b, Comparison of voltage sensitivities of HVIs and GEVIs in HEK293T cells. The membrane potential was controlled
via whole-cell voltage clamp, and a series of step waveforms were applied from −100 mV to 100 mV in increments of 20 mV. The image sampling rates
were 1,058 Hz and 484 Hz for HVIs and GEVIs, respectively. The sensitivity has been normalized to the fluorescence at membrane voltage Vm = −30 mV. c,
Fluorescence–voltage (F–V) curves of HVIs and VARNAM. The membrane potentials of the HEK293T cells were controlled by whole-cell voltage clamp. A
triangle waveform from −100 mV to +50 mV was applied for four cycles with a period of 6 s, and the fluorescence signal was recorded simultaneously at a
camera frame rate of 10 Hz. d, An overlay of the dynamic range (ΔF/F0, where F0 is the fluorescence at −70 mV) and emission spectra of the HVI series. n = 5
cells (HVI-488), 9 cells (HVI-Cy3), 7 cells (HVI-594) and 7 cells (HVI-Cy5). Error bars represent s.e.m.

length constant of ~100 μm. In addition, the fluorescence response            high after 10 min of light illumination (Fig. 3d). Across a field of
between electrically coupled cells appeared synchronized at the               view of 452 μm by 161 μm, our method revealed synchronized activ-
temporal resolution of 5 ms (Extended Data Fig. 3).                           ities of cultured rat hippocampal neurons (Extended Data Fig. 5).
    In cultured rat hippocampal neurons, the high dynamic range                   We evaluated the potential phototoxicity of HVIs through patch
of the HVI series has led to the sensitive detection of membrane              clamp electrophysiology and a CellTiter-Glo assay, which measures
voltage dynamics. For example, HVI-Cy3 and HVI-Cy5 faithfully                 cellular ATP concentrations. In all cases, the neurons were 100%
report AP spikes with sensitivities of ΔF/F0 = −25.3 ± 0.8% and               viable after light illumination, as they robustly fired APs when
−12.8 ± 0.9% per AP, respectively, which compare favourably with              stimulated by current injection (n = 18 cells). Furthermore, no sig-
the FP-based GEVIs Ace2N-mNeon (−4.9 ± 0.3%) and VARNAM                       nificant changes in neuronal electrophysiology or cell viability were
(−5.3 ± 0.3%) (Fig. 3a,b, Extended Data Fig. 4 and Supplementary              observed in cultured neurons expressing HVI-Cy5 after 5 min of
Table 3). Notably, the most redshifted indicator—HVI-Cy5—                     illumination with a 637 nm laser at 0.5 W cm−2 (Supplementary Figs.
is 3.6-fold more sensitive than the spectrally similar Voltron635             4 and 5). For HVI-Cy3, 10 min of illumination with a 532 nm laser at
(−12.8% versus −3.5% ΔF/F0 per AP; Table 1 and Supplementary                  1 W cm−2 caused no significant changes in membrane capacitance,
Table 4)24. In addition, HVI-Cy3 could respond to small changes in            resting potential, rheobase or AP amplitude and width. However,
subthreshold potential with SNR = 9.8 ± 1.1 per 8 mV of depolariza-           we did observe a reduction in membrane resistance (377 ± 42 MΩ
tion at a camera frame rate of 484 Hz under laser illumination of             versus 738 ± 91 MΩ, P = 0.0065; Supplementary Fig. 4), indicating
4.9 W cm−2 (Fig. 3c, Supplementary Fig. 3 and Supplementary Table             that care must be taken to reduce the laser power for long-term volt-
5). Taking advantage of the higher photostability of HVI-Cy3 (pho-            age imaging with HVI-Cy3.
tobleaching half-life t1/2 = 430 ± 64 s) relative to FP-based GEVIs
(Ace2N-mNeon t1/2 = 87 ± 4 s; VARNAM t1/2 = 154 ± 7 s; Extended               Multiplexed voltage imaging with HVI-Cy5. The far-red emission
Data Fig. 4 and Supplementary Table 6), we achieved continuous                spectrum of HVI-Cy5 allowed us to simultaneously monitor the
voltage imaging at 500 Hz over 10 min. Our data show spontaneous              membrane potential and other physiological signals such as Ca2+
AP firing as well as subthreshold activities, and the SNR remained            (Fig. 4a,b), intracellular pH (Extended Data Fig. 6) and extracel-

                                                                                                               Nature Chemistry | www.nature.com/naturechemistry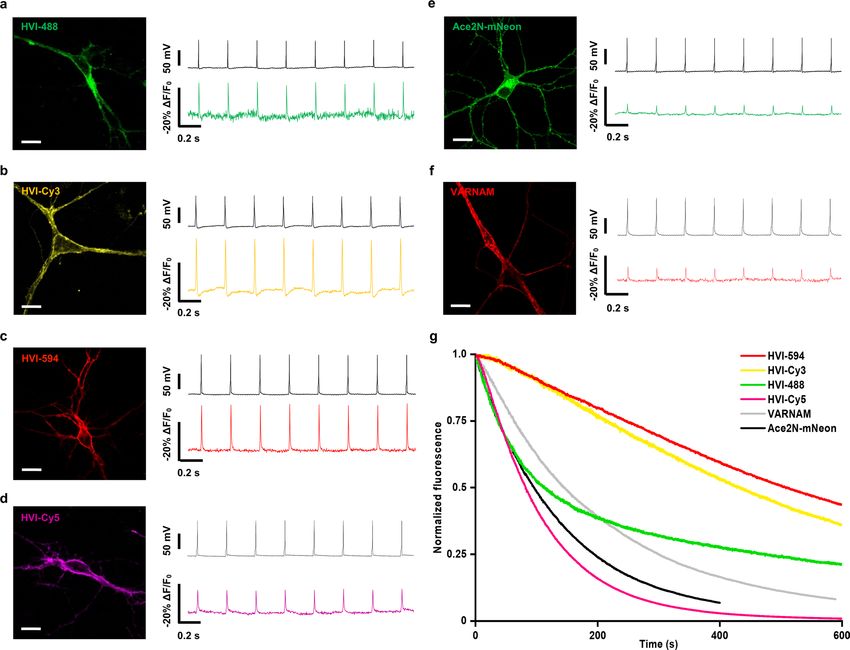
Nature Chemistry                                                                                                                                        Articles
a                                                b                                                     c
     HVI-Cy3                                                             170 pA                                         150 pA         50 pA      –50 pA          –150 pA

                                                50 mV

                                                                                                      8 mV
                                                –20% ∆F/F0

                                                                                                      –2% ∆F/F0
                                                       100 ms                                                     100 ms

d            0s                                                      300 s                                                   500 s
–25% ∆F/F0

                                                                •••                                                     ••• …
              20 s
–25% ∆F/F0

                  2s                                                                                    200 ms

Fig. 3 | Voltage imaging with HVIs in cultured rat hippocampal neurons. a, Representative confocal images of a rat hippocampal neuron expressing
HVI-Cy3. Scale bar, 20 μm. b, Simultaneous electrical recording (black trace) and HVI-Cy3 imaging (orange trace, sampling rate of 484 Hz) of an AP spike
train from a neuron stimulated by injection of a current of 170 pA for 500 ms. c, Simultaneous electrical recording (black trace) and HVI-Cy3 imaging
(orange trace, sampling rate of 484 Hz) of the subthreshold voltage activities of neurons stimulated by 10-ms weak current injections. Twenty successive
stimuli (grey) are superimposed, and the averaged trace of HVI-Cy3 fluorescence is shown in orange. d, Voltage imaging of a single neuron with HVI-Cy3
at 500 Hz for 10 min under illumination of ~1 W cm−2. The fluorescence signals for 0–100 s, 300–400 s and 500–600 s are shown as orange traces. Two
successive zoomed-in views of the shaded regions are shown at the bottom.

a                                                                                  c
      GCaMP6s-NES                     HVI-Cy5                   Overlay                   SF-iGluSnFR                        HVI-Cy5                Overlay

b                                                                                  d
                                                                 *                                                                                            *
                                                                                  10% ∆F/F0
30% ∆F/F0

             **        **   ** * **         * **                                                *            *      *                   *
                                                                                  –15% ∆F/F0
–15% ∆F/F0

                  20 s                                       200 ms                            10 s                                            100 ms

Fig. 4 | Multiplexed imaging with far-red HVI-Cy5 and green fluorescent indicators. a, Representative confocal images of a neuron co-expressing
GCaMP6s-NES and HVI-Cy5. b, Dual-colour imaging of calcium (green) and voltage (magenta) at 484 Hz, with a zoomed-in view of the shaded region
shown on the right. c, Representative confocal images of a neuron co-expressing SF-iGluSnFR and HVI-Cy5. d, Dual-colour imaging of glutamate (green)
and voltage (magenta) at 484 Hz, with a zoomed-in view of the shaded region shown on the right. Cy5 traces have been corrected for photobleaching.
Individual APs are marked with asterisks. Scale bars, 20 μm.

lular glutamate (Fig. 4c,d and Extended Data Fig. 6). In neurons                    spikes and AP spikes (Fig. 4b). The amplitudes of the calcium spikes
co-expressing HVI-Cy5 and the green calcium indicator GCaMP6s                       were positively correlated with the number of AP spikes during
in the cytoplasm (Fig. 4a), we observed time-correlated calcium                     burst AP activities, and subthreshold voltage activities did not lead

Nature Chemistry | www.nature.com/naturechemistry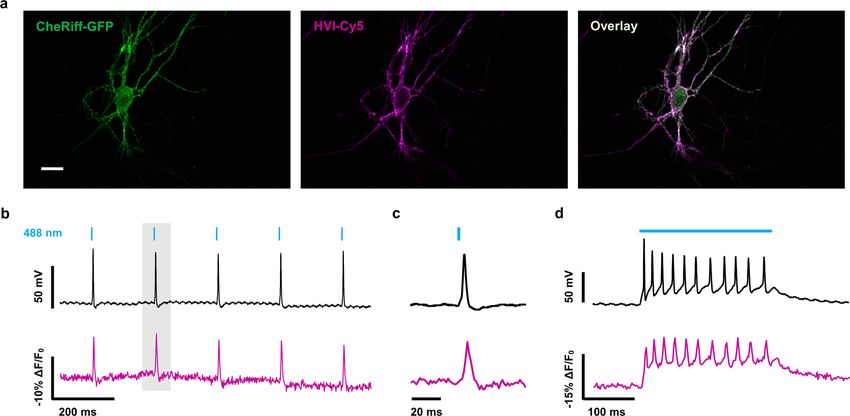
Articles                                                                                                                            Nature Chemistry

 a                                                                                  c
        CheRiff-EGFP              HVI-Cy5                Overlay                                R-GECO                   HVI-Cy5                                                   Overlay

 b                                                                                  d                                                                        e
                                                                                                                                                                                                     240

                                                                                                                                                                 Calcium signal response ∆F/F0 (%)
                                                                                                                                                                                                                   R 2 = 0.97

                            APV                    NBQX                                                                                                                                              180

                                                                                                                                                                                                     120

                            -                        -                                                                                                                                                60

                                                                                          –10% ∆F/F0
     –10% ∆F/F0

                                                                                                                     50% ∆F/F0
                                                                                                                                                                                                       0
                                                                                                                                                                                                           0 10 20 30
           100 ms                                                                                 100 ms                     2s                                                                            AP frequency (Hz)

 f                                                                                  g                       I   II        II            h
                                                                                                                                                            16

                                                                                                                                     Spike frequency (Hz)
                   +
                                                                                                                                                            12

                                                                                                                                                             8
                  CheRiff                   Mac               HVI-Cy5
                                                                                 –10% ∆F/F0

                                                                                                                                                             4

                                                                                                                                                             0
                                       H+
                                                                                                       1s                                                                                       I             II         III

Fig. 5 | All-optical electrophysiology with HVI-Cy5. a, Representative confocal images of rat hippocampal neurons differentially expressing CheRiff-EGFP or
HVI-Cy5. b, Top: pulsed blue-light illumination (250 ms, 0.3 W cm−2) of the CheRiff-expressing neuron evokes AP firing in its neighbouring neuron expressing
HVI-Cy5. The optical trace (10 trials superimposed) recorded under 637 nm laser illumination (0.6 W cm−2) reports the membrane voltage of the same cell
before (left) and after successive addition of 25 mM APV (middle) and 10 mM NBQX (right). APV and NBQX are blockers for the N-methyl-d-aspartate
(NMDA) receptor and α-amino-3-hydroxy-5-methyl-4-isoxazolepropionic acid (AMPA) receptor, respectively. Bottom: the NMDA receptor-dependent
fraction of postsynaptic potential is calculated as the difference between the fluorescence traces before and after APV addition. Similarly, the AMPA
receptor-dependent fraction of postsynaptic potential is calculated as the difference between the fluorescence traces before and after NBQX addition.
This pharmacological experiment was repeated twice. c, Representative confocal images of a neuron co-expressing R-GECO1, CheRiff and HVI-Cy5. d,
Dual-colour imaging of voltage (left) and calcium (right) at 484 Hz on increasing the levels of blue-light stimulation (301-ms pulses from a 488 nm laser at
3, 5, 10 and 13 mW cm−2). e, A linear regression of the calcium signal versus recorded AP frequencies. n = 13, 10, 7, 10, 6, 11, 9, 5, 5, 5 and 3 cells, respectively.
Error bars represent s.e.m. f, Scheme of bidirectional control and imaging of membrane voltage in cells co-expressing CheRiff, Mac, and HVI-Cy5. g, Voltage
imaging with HVI-Cy5 when AP spike trains evoked by 488 nm light illumination (0.03 W cm−2) were interrupted by a 561 nm light pulse (0.5 W cm−2). h,
Correlation between spike frequency and optogenetic illumination (n = 8 cells). Scale bars, 20 μm.

to changes in the calcium signal (Fig. 4b). By contrast, the intracel-                 the HVI were co-expressed in the same rat hippocampal neuron,
lular pH signal was not correlated with HVI-Cy5 dynamics under                         pulsed blue-light illumination at 0.1–0.3 W cm−2 triggered AP spike
identical imaging conditions (Extended Data Fig. 6).                                   trains, which could be reported by HVI-Cy5 with SNRs of 35.4 ± 8.0
   In neurons co-expressing HVI-Cy5 and the green glutamate                            (n = 6 cells) and 15.6 ± 2.3 (n = 4 cells) under ~0.6 W cm−2 of 637 nm
sensor SF-iGluSnFR, both indicators trafficked well to the cell                        laser illumination at bandwidths of 464 Hz and 821 Hz, respectively
membrane (Fig. 4c). Similar to the observation for intracellular                       (Extended Data Fig. 7). When CheRiff and HVI-Cy5 were differen-
calcium, the occurrence of the extracellular glutamate signal was                      tially expressed in distinct neurons (Methods and Fig. 5a), blue-light
also time-correlated with the burst activities of AP spike trains, but                 stimulation of a CheRiff-expressing neuron could induce AP firing
the signal appeared spatially heterogeneous, probably due to local-                    in a neighbouring neuron expressing HVI-Cy5. Consistent with
ized glutamate release (Extended Data Fig. 6). The number of AP                        the model of synaptic transmission, AP firing could be specifically
spikes in a cluster was positively correlated with the amplitude of                    blocked by 10 μM NBQX, an AMPA receptor inhibitor, whereas the
the corresponding whole-cell-averaged glutamate signal. Low glu-                       addition of 25 μM APV, an NMDA receptor inhibitor, caused little
tamate signal elicited subthreshold depolarization but failed to trig-                 change in the AP waveform (Fig. 5b).
ger AP firing (Fig. 4d). Together, our data demonstrate the power                          We then extended this all-optical electrophysiology approach
of HVI-Cy5 to enable multiplexed imaging of membrane potential                         to simultaneously image membrane potential and calcium under
with other physiological signals.                                                      various optogenetic stimulation dosages (3–38 mW cm−2). In cul-
   The far-red excitation spectrum of HVI-Cy5 also enabled pair-                       tured neurons co-expressing HVI-Cy5, CheRiff and the red calcium
ing with optogenetic actuators. We combined HVI-Cy5 with a                             indicator R-GECO1 (Fig. 5c), we observed concurrently higher AP
blue-light-activated cation channel, CheRiff10, to achieve all-optical                 firing frequencies and higher calcium signal levels upon increasing
electrophysiology, where the membrane potential could be con-                          blue-light stimulation (Fig. 5d). Quantitative analysis revealed that
trolled and measured by different coloured light. When CheRiff and                     the calcium signal was in direct proportion to the AP frequency

                                                                                                                     Nature Chemistry | www.nature.com/naturechemistry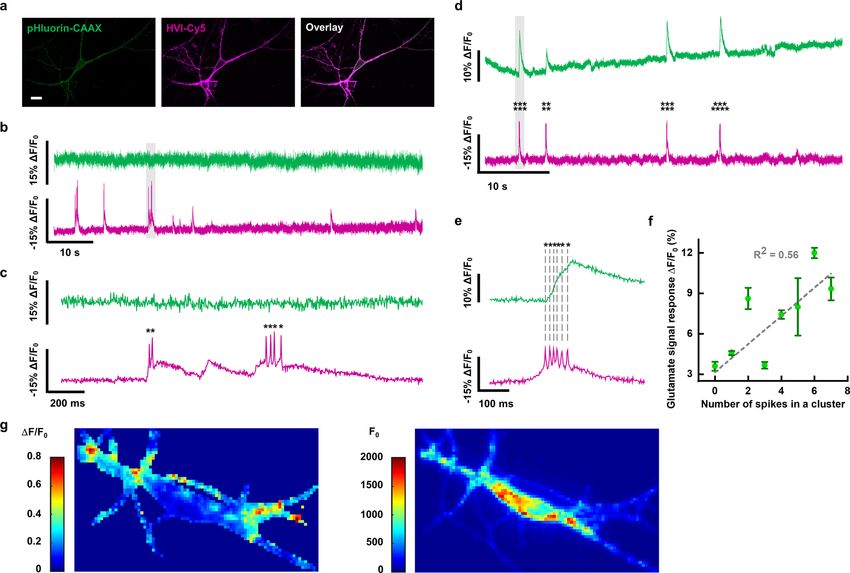
Nature Chemistry                                                                                                                       Articles
(~5.4 ± 0.3% R-GECO1 ΔF/F0 per Hz (mean ± s.e.m.); Fig. 5e).               the design of the HVIs, which is compatible with many organic
Little crosstalk was observed among the channels (Extended Data            fluorophore structures, as demonstrated by the palette of HVIs pre-
Fig. 8 and Supplementary Table 7).                                         sented in this study (Fig. 2 and Supplementary Table 3). Because
   Finally, we achieved simultaneous optical recording and bidi-           tetrazine-conjugated JF 635 is not commercially available, we chose
rectional optical manipulation of the membrane potential. When             mTz-Cy5 in this study to demonstrate the high voltage sensitivity
HVI-Cy5, CheRiff and a yellow light-sensitive proton pump—Mac              and capability of multiplexed voltage imaging with HVIs. Future
rhodopsin45—were co-expressed in the same neuron (Fig. 5f),                efforts would include replacing Cy5 with brighter and more photo-
blue-laser-stimulated AP spike trains were interrupted by pulsed           stable far-red organic fluorophores. Finally, to fully take advantage
yellow-light illumination (Fig. 5g,h). Thus, HVI-Cy5 enables               of voltage imaging in the far-red spectrum, future development of
low-crosstalk, all-optical electrophysiology that matches previous         HVIs should focus on co-expressing the trans-cyclooctene ligase in
electrode-based approaches to investigate neuronal excitability            the secretory pathway to metabolically label the Ace2 mutant within
(Extended Data Fig. 8).                                                    the cell. This approach has proven successful in cultured mamma-
                                                                           lian cells48 and should open the door to in vivo applications of HVIs.
Discussion
To summarize, we have employed site-specific protein modification          Online content
to develop a panel of fast and sensitive genetically targetable voltage    Any methods, additional references, Nature Research report-
indicators, including a far-red hybrid indicator, HVI-Cy5. Among           ing summaries, source data, extended data, supplementary infor-
these, the sensitive and photostable HVI-Cy3 indicator exhib-              mation, acknowledgements, peer review information; details of
ited the highest voltage sensitivity towards AP spikes (−25.3 ± 0.8        author contributions and competing interests; and statements of
ΔF/F0 per AP), enabling voltage imaging at the single neuron level         data and code availability are available at https://doi.org/10.1038/
across a wide field of view and over an extended period of time            s41557-021-00641-1.
(10 min). The bright and far-red HVI-Cy5 indicator is capable of
reporting neuronal APs under a modest illumination intensity (0.2–         Received: 1 February 2020; Accepted: 15 January 2021;
1.2 W cm−2)—that is, ~100-fold lower than previous GEVIs with              Published: xx xx xxxx
a similar emission spectrum (for example, Archon1)10,14. Taking
advantage of its high sensitivity and redshifted spectrum, we have         References
demonstrated the power of multiplexed imaging and all-optical              1. Xu, Y. X., Zou, P. & Cohen, A. E. Voltage imaging with genetically encoded
electrophysiology with HVI-Cy5 in cultured neurons.                            indicators. Curr. Opin. Chem. Biol. 39, 1–10 (2017).
    Compared to the spectrally similar indicator Voltron635, the volt-     2. Gong, Y. Y. et al. High-speed recording of neural spikes in awake mice and
age sensitivity of HVI-Cy5 is 3.6-fold higher in reporting APs in              flies with a fluorescent voltage sensor. Science 350, 1361–1366 (2015).
                                                                           3. Kannan, M. et al. Fast, in vivo voltage imaging using a red fluorescent
cultured neurons (Table 1 and Supplementary Table 4)24. Although               indicator. Nat. Methods 15, 1108–1116 (2018).
both the HVI and Voltron capitalize on the electrochromic quench-          4. Jin, L. et al. Single action potentials and subthreshold electrical events imaged
ing mechanism to report membrane voltage with a small-molecule                 in neurons with a fluorescent protein voltage probe. Neuron 75, 779–785
fluorophore, they differ in their choices of protein–dye conjuga-              (2012).
                                                                           5. Platisa, J., Vasan, G., Yang, A. & Pieribone, V. A. Directed evolution of key
tion methods. In Voltron, the fluorophore is attached to the 34-kDa
                                                                               residues in fluorescent protein inverses the polarity of voltage sensitivity in
self-labelling protein tag fused to Ace2 rhodopsin, whereas in the             the genetically encoded indicator ArcLight. ACS Chem. Neurosci. 8, 513–523
HVIs, the fluorophore is directly linked to a 13-amino-acid peptide            (2017).
(1.6 kDa) inserted at the extracellular loop of the rhodopsin. The         6. St-Pierre, F. et al. High-fidelity optical reporting of neuronal electrical activity
superior sensitivity of the HVIs over Voltron can be explained by              with an ultrafast fluorescent voltage sensor. Nat. Neurosci. 17, 884–889
                                                                               (2014).
the mechanism of voltage-dependent electrochromic quenching, in            7. Abdelfattah, A. S. et al. A bright and fast red fluorescent protein voltage
which voltage sensitivity is higher when the donor–quencher dis-               indicator that reports neuronal activity in organotypic brain slices. J. Neurosci.
tance is shorter, all else being equal28.                                      38, 3147–3148 (2018).
    Notably, although HVI-Cy5 in its current form is mainly suitable       8. Yang, H. H. et al. Subcellular imaging of voltage and calcium signals reveals
for imaging cultured neurons, the in vitro cell culture system is an           neural processing in vivo. Cell 166, 245–257 (2016).
                                                                           9. Hou, J. H., Kralj, J. M., Douglass, A. D., Engert, F. & Cohen, A. E.
important complement to in vivo systems for studying molecular                 Simultaneous mapping of membrane voltage and calcium in zebrafish heart
and cellular neuroscience. For example, voltage imaging assays in              in vivo reveals chamber-specific developmental transitions in ionic currents.
cell culture may assist in evaluating the effects of drugs on neuronal         Front. Physiol. 5, 344 (2014).
excitability in a higher-throughput and more cost-effective manner         10. Hochbaum, D. R. et al. All-optical electrophysiology in mammalian
than the in vivo system46. As demonstrated in this study, the com-             neurons using engineered microbial rhodopsins. Nat. Methods 11, 825–833
                                                                               (2014).
bination of HVI-Cy5 voltage imaging, optogenetic stimulation and           11. Fan, L. Z. et al. All-optical synaptic electrophysiology probes mechanism of
drug perturbation has helped dissect the contributions of two gluta-           ketamine-induced disinhibition. Nat. Methods 15, 823–831 (2018).
mate receptor subtypes to synaptic transmission. Such an assay may         12. Adam, Y. et al. Voltage imaging and optogenetics reveal behaviour-dependent
be extended to high-throughput compound screening for receptor                 changes in hippocampal dynamics. Nature 569, 413–417 (2019).
agonist and antagonist candidates.                                         13. Flytzanis, N. C. et al. Archaerhodopsin variants with enhanced
                                                                               voltage-sensitive fluorescence in mammalian and Caenorhabditis elegans
    From the bioorthogonal engineering perspective, the modular                neurons. Nat. Commun. 5, 4894 (2014).
design of HVIs has the advantage of allowing the separate opti-            14. Piatkevich, K. D. et al. A robotic multidimensional directed evolution
mization of conjugation methods, rhodopsin scaffolds and fluo-                 approach applied to fluorescent voltage reporters. Nat. Chem. Biol. 14,
rescence reporters. Our work has further demonstrated the safety,              352–360 (2018).
biocompatibility and fast reaction kinetics of IEDDA in the con-           15. Zou, P. et al. Bright and fast multicoloured voltage reporters via
                                                                               electrochromic FRET. Nat. Commun. 5, 4625 (2014).
text of cultured neurons. A redshift in rhodopsin absorption has           16. Owen, S. F., Liu, M. H. & Kreitzer, A. C. Thermal constraints on in vivo
been reported previously in an Asp81Ser mutation3,47. Owing to the             optogenetic manipulations. Nat. Neurosci. 22, 1061–1065 (2019).
structural similarity between serine and cysteine, it is likely that the   17. Huang, Y. L., Walker, A. S. & Miller, E. W. A photostable silicon rhodamine
high voltage sensitivity of HVI-Cy5 also benefits from a redshifted            platform for optical voltage sensing. J. Am. Chem. Soc. 137, 10767–10776
                                                                               (2015).
rhodopsin absorption. Although HVI-Cy5 appears to photobleach
                                                                           18. Fluhler, E., Burnham, V. G. & Loew, L. M. Spectra, membrane binding, and
more quickly than Voltron63524, this difference in photostability is           potentiometric responses of new charge shift probes. Biochemistry 24,
mainly due to the dye performance (Cy5 versus JF 635) rather than              5749–5755 (1985).

Nature Chemistry | www.nature.com/naturechemistry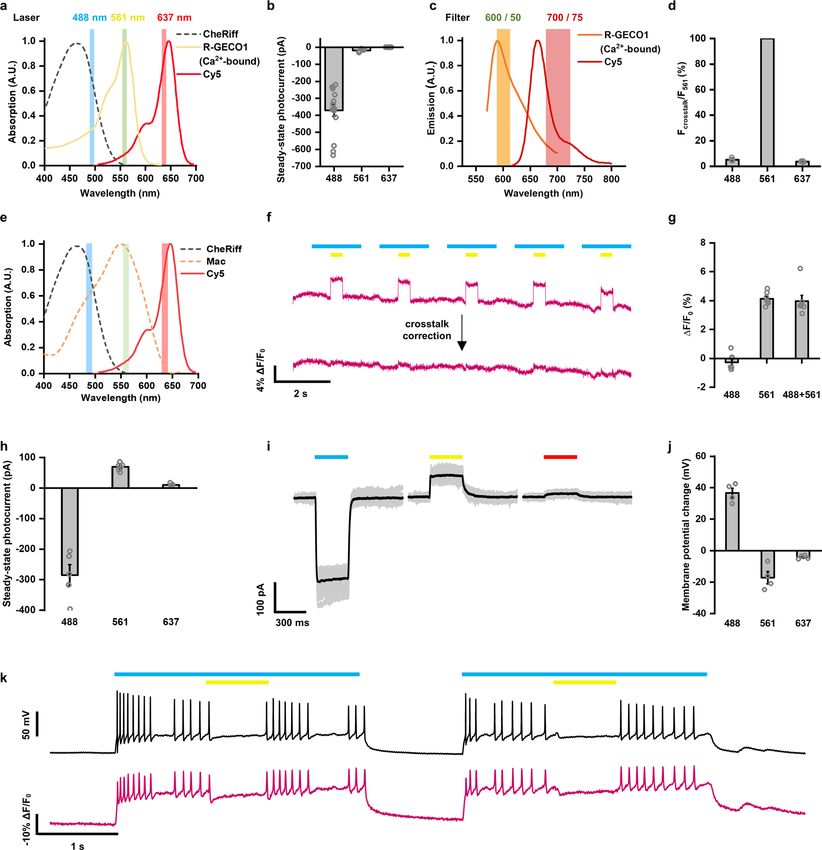
Articles                                                                                                                                 Nature Chemistry
19. Treger, J. S., Priest, M. F., Iezzi, R. & Bezanilla, F. Real-time imaging of        35. Li, J., Jia, S. & Chen, P. R. Diels–Alder reaction-triggered bioorthogonal
    electrical signals with an infrared FDA-approved dye. Biophys. J. 107, L9–L12           protein decaging in living cells. Nat. Chem. Biol. 10, 1003–1005 (2014).
    (2014).                                                                             36. Fan, X. et al. Optimized tetrazine derivatives for rapid bioorthogonal
20. Yan, P. et al. Palette of fluorinated voltage-sensitive hemicyanine dyes. Proc.         decaging in living cells. Angew. Chem. Int. Ed. 55, 14046–14050 (2016).
    Natl Acad. Sci. USA 109, 20443–20448 (2012).                                        37. Li, J. & Chen, P. R. Development and application of bond cleavage reactions
21. Grenier, V., Walker, A. S. & Miller, E. W. A small-molecule photoactivatable            in bioorthogonal chemistry. Nat. Chem. Biol. 12, 129–137 (2016).
    optical sensor of transmembrane potential. J. Am. Chem. Soc. 137,                   38. Carlson, J. C. T., Mikula, H. & Weissleder, R. Unraveling tetrazine-triggered
    10894–10897 (2015).                                                                     bioorthogonal elimination enables chemical tools for ultrafast release and
22. Liu, P., Grenier, V., Hong, W., Muller, V. R. & Miller, E. W. Fluorogenic               universal cleavage. J. Am. Chem. Soc. 140, 3603–3612 (2018).
    targeting of voltage-sensitive dyes to neurons. J. Am. Chem. Soc. 139,              39. Kralj, J. M., Hochbaum, D. R., Douglass, A. D. & Cohen, A. E. Electrical
    17334–17340 (2017).                                                                     spiking in Escherichia coli probed with a fluorescent voltage-indicating
23. Grenier, V., Daws, B. R., Liu, P. & Miller, E. W. Spying on neuronal                    protein. Science 333, 345–348 (2011).
    membrane potential with genetically targetable voltage indicators. J. Am.           40. Kralj, J. M., Douglass, A. D., Hochbaum, D. R., Maclaurin, D. & Cohen, A. E.
    Chem. Soc. 141, 1349–1358 (2019).                                                       Optical recording of action potentials in mammalian neurons using a
24. Abdelfattah, A. S. et al. Bright and photostable chemigenetic indicators for            microbial rhodopsin. Nat. Methods 9, 90–95 (2012).
    extended in vivo voltage imaging. Science 365, 699–704 (2019).                      41. Maclaurin, D., Venkatachalam, V., Lee, H. & Cohen, A. E. Mechanism of
25. Uttamapinant, C. et al. Fast, cell-compatible click chemistry with                      voltage-sensitive fluorescence in a microbial rhodopsin. Proc. Natl Acad. Sci.
    copper-chelating azides for biomolecular labeling. Angew. Chem. Int. Ed. 51,            USA 110, 5939–5944 (2013).
    5852–5856 (2012).                                                                   42. Mujumdar, R. B., Ernst, L. A., Mujumdar, S. R., Lewis, C. J. & Waggoner, A.
26. Yao, J. Z. et al. Fluorophore targeting to cellular proteins via                        S. Cyanine dye labeling reagents: sulfoindocyanine succinimidyl esters.
    enzyme-mediated azide ligation and strain-promoted cycloaddition. J. Am.                Bioconjug. Chem. 4, 105–111 (1993).
    Chem. Soc. 134, 3720–3728 (2012).                                                   43. Bennett, M. V. & Zukin, R. S. Electrical coupling and neuronal
27. Liu, D. S. et al. Diels–Alder cycloaddition for fluorophore targeting to specific       synchronization in the mammalian brain. Neuron 41, 495–511 (2004).
    proteins inside living cells. J. Am. Chem. Soc. 134, 792–795 (2012).                44. Dhein, S. Gap junction channels in the cardiovascular system:
28. Xu, Y. et al. Hybrid indicators for fast and sensitive voltage imaging. Angew.          pharmacological and physiological modulation. Trends Pharmacol. Sci. 19,
    Chem. Int. Ed. 57, 3949–3953 (2018).                                                    229–241 (1998).
29. Debets, M. F. et al. Bioconjugation with strained alkenes and alkynes. Acc.         45. Chow, B. Y. et al. High-performance genetically targetable optical neural
    Chem. Res. 44, 805–815 (2011).                                                          silencing by light-driven proton pumps. Nature 463, 98–102 (2010).
30. Lukinavicius, G. et al. A near-infrared fluorophore for live-cell                   46. Kiskinis, E. et al. All-optical electrophysiology for high-throughput functional
    super-resolution microscopy of cellular proteins. Nat. Chem. 5, 132–139                 characterization of a human iPSC-derived motor neuron model of ALS. Stem
    (2013).                                                                                 Cell Rep. 10, 1991–2004 (2018).
31. Nikic, I. et al. Minimal tags for rapid dual-color live-cell labeling and           47. Xu, Y. et al. Imaging neuronal activity with fast and sensitive red-shifted
    super-resolution microscopy. Angew. Chem. Int. Ed. 53, 2245–2249 (2014).                electrochromic FRET indicators. ACS Chem. Neurosci. 10, 4768–4775 (2019).
32. Nikic, I., Kang, J. H., Girona, G. E., Aramburu, I. V. & Lemke, E. A. Labeling      48. Uttamapinant, C., Sanchez, M. I., Liu, D. S., Yao, J. Z. & Ting, A. Y.
    proteins on live mammalian cells using click chemistry. Nat. Protoc. 10,                Site-specific protein labeling using PRIME and chelation-assisted click
    780–791 (2015).                                                                         chemistry. Nat. Protoc. 8, 1620–1634 (2013).
33. Beliu, G. et al. Bioorthogonal labeling with tetrazine-dyes for super-resolution
    microscopy. Commun. Biol. 2, 261 (2019).
34. Versteegen, R. M., Rossin, R., ten Hoeve, W., Janssen, H. M. & Robillard, M.        Publisher’s note Springer Nature remains neutral with regard to jurisdictional claims in
    S. Click to release: instantaneous doxorubicin elimination upon tetrazine           published maps and institutional affiliations.
    ligation. Angew. Chem. Int. Ed. 52, 14112–14116 (2013).                             © The Author(s), under exclusive licence to Springer Nature Limited 2021

                                                                                                                      Nature Chemistry | www.nature.com/naturechemistry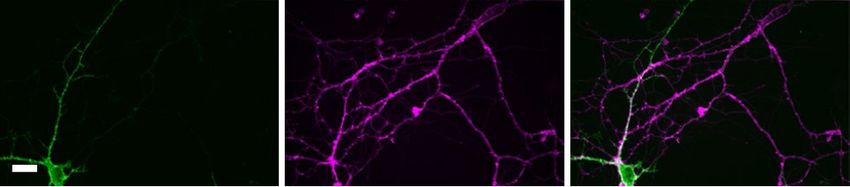
Nature Chemistry                                                                                                                                      Articles
Methods                                                                                   15 min at room temperature. The mixture was added to the cell culture medium
Materials and reagents. The reagents used in this study are summarized in                 in the absence of serum for 4 h. Thereafter, cells were digested by trypsin-EDTA
Supplementary Table 8. W37VLplA and W37ILplA were expressed in Escherichia                (0.25%, Gibco), reseeded on a sterile 14-mm glass coverslip pre-treated with
coli and purified according to a previously published method48. For chemical              matrigel matrix, and incubated in complete medium for 24 h before PRIME
synthesis, 10-azidodecanoic acid (Az-9) and rel-(1R-4E-pR)-cyclooct-4-ene-                labelling.
1-yl-N-pentanoic acid carbamate (4-TCO, previously described as TCO227) were                   For primary rat hippocampal neuron culture, sterile 14-mm glass coverslips
synthesized as previously described26,27.                                                 were incubated with 20 μg ml−1 poly-d-lysine (Sigma) solution at 37 °C with 5%
                                                                                          CO2 for 24 h in a 24-well plate. The coverslips were washed twice with ddH2O and
Chemical synthesis.                                                                       incubated with 10 μg ml−1 laminin mouse protein (Gibco) solution at 37 °C with
                                                                                          5% CO2 overnight. Thereafter, the coverslips were washed twice with ddH2O and
                                                                                          allowed to dry at room temperature. To isolate neurons, heads were separated from
                                                                                          neonatal Sprague–Dawley rat pups with scissors. The brain was dissected from the
                                                                                          skull and placed into a 35-mm dish with ice-chilled dissection solution (DMEM
                                                                                          with high glucose and penicillin-streptomycin antibiotics). The hippocampus was
                                                                                          isolated from the brains under a dissection scope, cut into small pieces (~0.5 mm)
                                                                                          and incubated with 2 ml of Trypsin-EDTA (0.25%, Gibco) at 37 °C with 5% CO2
     Synthesis of 10-azidodecanoic acid (Az-9)                                            for 15 min. The liquid was carefully aspirated and replaced with 1 ml of DMEM
     The synthesis of Az-9 has been described previously26. Sodium azide (0.5 g,          containing 10% FBS. The tissue fragments were dispersed by repeated pipetting
7.7 mmol) was added to 10 ml N,N-dimethylformamide (DMF) containing                       for 1 min and incubated on ice for 5 min. The sediment was discarded, and the
10-bromodecanoic acid (1.2 g, 4.8 mmol). The reaction was allowed to proceed at           supernatant was collected and diluted by neuronal culture medium (Neurobasal
room temperature overnight and then evaporated under reduced pressure. The                medium, B-27 supplement, GlutaMAX supplement and penicillin-streptomycin)
residue was dissolved in 15 ml of 1 M HCl and extracted with ethyl acetate (15 ml)        to a final cell density of 6 × 10⁴ cells ml−1. A 1-ml volume of cell suspension was
three times. The organic layer, dried using magnesium sulfate, was evaporated             added to each well of a 24-well plate (with a pre-coated glass coverslip). Half of the
under vacuum. The crude product was purified by silica gel chromatography using           neuron culture medium was replaced with fresh medium once every four days.
10–20% ethyl acetate in hexanes. Only 15 ml of eluent was evaporated to afford                 Neurons were transfected on DIV7–9 (7–9 days in vitro). For each well of a
the product as a pale yellow oil (~0.15 g). 1H NMR (400 MHz, CDCl3, δ): 3.25 (t,          24-well plate, 250–500 ng of plasmid DNA was mixed with 1 μl of Lipofectamine
J = 6.95 Hz, 2H), 2.35 (t, J = 7.49 Hz, 2H), 1.61 (m, 5H), 1.32 (m, 9H). ESI-MS(−)        3000 reagent in Neurobasal medium, before incubation with neurons for 45 min.
calculated for C10H8N3O2− [M-H]−: 212.14; found: 212.36.                                  The transfected neurons were labelled and imaged after 3–10 days. For wide-field
                                                                                          imaging assays, dissociated hippocampal neurons were nucleofected with
                                                                                          FCK-Asp81CysAce2 following the manufacturer’s protocol (Lonza V4XP-3024). For
                                                                                          synaptic transmission assays, dissociated hippocampal neurons were separately
                                                                                          nucleofected with FCK-Asp81CysAce2 and FCK-CheRiff-EGFP and co-plated in a 1:1
                                                                                          ratio into a well of a 24-well plate containing a pre-coated coverslip at a density of
    Synthesis of rel-(1R-4E-pR)-cyclooct-4-ene-1-yl-N-pentanoic acid carbamate            1.5 × 10⁵ cells per well. The medium was replaced with 1 ml of fresh medium after
(4-TCO)                                                                                   4 h. Half of the medium was replaced by fresh medium every four days.
    The synthesis of 4-TCO has been described previously27. The rel-(1R-
4E-pR)-cyclooct-4-enol (0.5 g, 4.0 mmol) and pyridine (0.47 g, 6 mmol) were               PRIME labelling. For PRIME-SPAAC labelling26, hippocampal neurons were
dissolved in dichloromethane and cooled at 0 °C. 4-Nitrophenyl chloroformate              transfected with LAP-Ace(D81N) construct on DIV7–9 and labelled on DIV12–14.
(0.96 g, 4.8 mmol) was added in multiple portions and the reaction was allowed to         Transfected neurons were incubated with Tyrode’s buffer containing 5 μM W37ILplA
reach room temperature. The mixture was stirred in the dark for 3 h and poured            (purified from bacterial culture as previously described48), 500 μM Az-9, 2 mM
into water (15 ml). The aqueous layer was extracted with diethyl ether (3 × 30 ml).       ATP and 2 mM magnesium acetate for 30 min at 37 °C. Cells were rinsed three
The ether layer was combined, washed sequentially with aqueous acetic acid                times with fresh Tyrode’s buffer. The neurons were then incubated with Tyrode’s
(pH 3, 3 × 30 ml), saturated aqueous NaHCO3 (3 × 30 ml) and saturated aqueous             buffer containing 10 μM DBCO-Cy3 for 10 min at 37 °C. Excess reagents were
NaCl (30 ml). The organic layer was dried over Na2SO4, filtered, and the solvent          removed by buffer replacement, three times, with fresh Tyrode’s buffer.
was removed to give rel-(1R-4E-pR)-cyclooct-4-ene-1-yl (4-nitrophenyl)                        For PRIME-IEDDA labelling27, transfected HEK293T cells or neurons were
carbonate as a light-yellow solid.                                                        rinsed with Tyrode’s salts solution (M&C Gene Technology) and then incubated
    5-Aminopentanoic acid (0.7 g, 6 mmol) and diisopropylethylamine (DIPEA,               with Tyrode’s buffer containing 5 μM W37VLplA, 100 μM 4-TCO, 1 mM ATP and
1.4 ml, 8 mmol) were dissolved in DMF (10 ml) and cooled at 0 °C. rel-(1R-                1 mM magnesium acetate for 30 min at 37 °C. Cells were gently rinsed with Tyrode’s
4E-pR)-cyclooct-4-ene-1-yl (4-nitrophenyl) carbonate was added. The mixture               buffer three times, and subsequently labelled with 0.5 μM tetrazine dyes in Tyrode’s
was stirred at room temperature in the dark, overnight. The DMF was vaporized             buffer for 10 min. Excess reagents were removed from each well and cells were
under reduced pressure and the resulting mixture was purified by column                   rinsed three times before the voltage imaging experiment.
chromatography using 5:1 petroleum ether and ethyl acetate followed by 20:1
dichloromethane and methanol to obtain the rel-(1R-4E-pR)-cyclooct-4-ene-                 Imaging apparatus and confocal microscopy. All of the fluorescence imaging
1-yl-N-pentanoic acid carbamate (4-TCO) as a colourless oil (0.7 g, 65%). 1H              experiments were conducted on an inverted fluorescence microscope (Nikon-TiE)
NMR (400 MHz, CD3OD, δ): 5.60–5.56 (m, 1H), 5.51–5.48 (m, 1H), 4.30–4.29                  equipped with a ×40, 1.3 NA oil immersion objective lens (except for wide-field
(m, 1H), 3.09 (t, J = 7.0 Hz, 2H), 2.37–2.28 (m, 5H), 2.00–1.89 (m, 4H), 1.75–1.67        imaging in Extended Data Fig. 5, which used a ×20, 1.05 NA dry objective lens),
(m, 2H), 1.64–1.57 (m, 3H), 1.53–1.47 (m, 2H). 13C NMR (100 MHz, CD3OD, δ):               five laser lines (Coherent OBIS 488 nm, 532 nm, 561 nm, 594 nm and 637 nm), a
177.35, 158.75, 136.10, 133.77, 81.57, 42.23, 41.23, 39.65, 35.18, 34.47, 33.49, 32.10,   spinning disk confocal unit (Yokogawa CSU-X1) and two scientific CMOS cameras
30.42, 23.22. ESI-MS(+) calculated for C28H46N2NaO8+, [2M + Na]+: 561.31; found:          (Hamamatsu ORCA-Flash 4.0 v2). The microscope, lasers and cameras were
561.41. ESI-MS(−) calculated for C28H45N2NaO8−, [2M-H]−: 537.32; found: 537.58.           controlled with custom-built software written in LabVIEW (National Instruments,
                                                                                          15.0 version) and could switch between confocal and wide-field imaging modes. For
Molecular cloning. Plasmids were constructed using the Gibson assembly                    two-colour simultaneous imaging, a dual-view device (Photometrics DV2) was used
method. Briefly, the inserts and the vector were polymerase chain reaction (PCR)          to split the emission into green/red and far-red fluorescence channels. The spectra
amplified into linear double-stranded DNA with overlapping sequences at the               properties of the filters and dichroic mirrors for various fluorescent indicators
ends. These DNA fragments were mixed with Gibson assembly enzymes following               used in this study are summarized in Supplementary Table 10. The transfected
the manufacturer’s instructions (New England Biolabs). Successful clones were             HEK293T cells or neurons on coverslips were transferred to Tyrode’s buffer before
verified by sequencing. Site-directed mutagenesis and linker insertion/deletion           imaging. Confocal images were acquired at 1 × 1 camera binning with an exposure
were achieved by PCR-amplifying the vector with a pair of primers containing the          time of 100 ms. Image analysis was performed in ImageJ/Fiji (version 1.52d).
desired mutation/insertion/deletion. The CheRiff gene was a gift from A. Cohen at
Harvard University. The GCaMP6s, SF-iGluSnFR and ecliptic pHluorin genes were             Electrophysiology. For single-cell electrophysiology recording, cultured neurons
provided by Y. Li at Peking University. The R-GECO1 gene was from H. Cheng at             were incubated in Tyrode’s buffer containing 20 μM gabazine, 10 μM NBQX and
Peking University. The Mac gene was a gift from L. Brown from the University of           25 μM APV (Tyrode’s buffer containing 50 nM 2-APB for HEK293T cells). The
Guelph. Primers used in this study are listed in Supplementary Table 9.                   electrophysiology experiments were performed at room temperature. Borosilicate
                                                                                          glass electrodes (Sutter) were pulled to a tip resistance of 2.5–5 MΩ. The glass
Cell culture and transfection. HEK293T cells were incubated in Dulbecco’s                 electrode was filled with internal solution containing 125 mM potassium
modified Eagle medium (DMEM, Gibco) containing 10% vol/vol fetal bovine                   gluconate, 8 mM NaCl, 0.6 mM MgCl2, 0.1 mM CaCl2, 1 mM EGTA, 10 mM
serum (FBS, Gibco) at 37 °C with 5% CO2. Cells were seeded in a 24-well plate and         HEPES, 4 mM Mg-ATP, 0.4 mM GTP·Na2 (pH 7.3) and adjusted to 295 mOsm kg−1
grown to 70–90% confluent for transfection. For each well, 500 ng plasmid and 1 μl        with 1 M sucrose. The glass electrode’s position was adjusted by a Sutter MP285
Lipofectamine 2000 reagent were mixed in Opti-MEM medium and incubated for                micro-manipulator. The cells were clamped using an Axopatch 200B amplifier

Nature Chemistry | www.nature.com/naturechemistry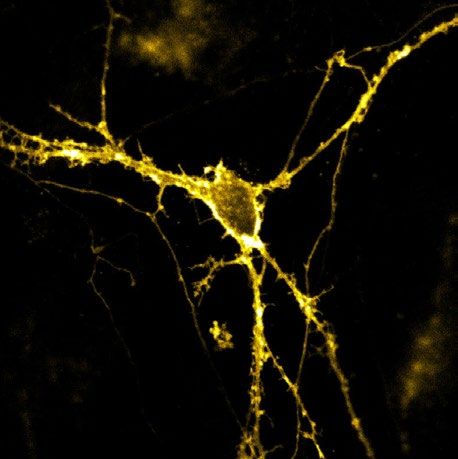
Articles                                                                                                                                   Nature Chemistry
(Axon Instruments). Membrane voltage signal recorded from the patch amplifier             were illuminated with a 637 nm laser at 0.2 W cm−2 and imaged at a camera frame
was filtered with an internal 5-kHz Bessel filter and digitized at 9,681.48 Hz with       rate of 464 Hz. For optogenetic control, neurons were activated with 488 nm laser
a National Instruments PCIe-6353 data acquisition (DAQ) board (approximately              illumination at 0.03–0.12 W cm−2 and deactivated with 561 nm laser illumination
twice the bandwidth of the Bessel filter).                                                at 0.5 W cm−2.

Simultaneous patch clamp and optical recording in HEK293T cells. The                      Photocurrent measurements. Cultured rat hippocampal neurons were transfected
membrane potential of the HEK293T cells was controlled via whole-cell patch               with HVI or VARNAM constructs as previously described. Photocurrent
clamp (Axopatch 200B, Axon Instruments). To characterize the dynamic range and            measurements were performed in Tyrode’s buffer containing 20 μM gabazine,
kinetics of the voltage indicators in HEK293T cells, the membrane potential was           10 μM NBQX and 25 μM APV to block synaptic transmission, and 500 nM
stepped from −100 mV to 100 mV in increments of 20 mV, with each step lasting             tetrodotoxin (TTX) to block AP firing. On DIV12–14, cells expressing HVI were
500 ms. Meanwhile, fluorescence images were recorded at a camera frame rate of            labelled with fluorophores and voltage-clamped at −70 mV via a patch pipette. The
1,058 Hz.                                                                                 photocurrent was measured with a DAQ and digitized at 20 kHz when cells were
    To map gap junction-mediated electrical coupling, HEK293T cells at full               illuminated with 300-ms laser pulses at the following intensities: HVI-488, 488 nm,
confluence were labelled with Cy3 fluorophore via PRIME-IEDDA. To measure                 3.1 W cm−2; HVI-Cy3, 532 nm, 4.9 W cm−2; VARNAM, 561 nm, 4.8 W cm−2; HVI-
the decay length of electrical coupling, cell image series were acquired at a camera      594, 594 nm, 3.8 W cm−2; HVI-Cy5, 637 nm, 0.48 W cm−2.
frame rate of 10 Hz with the membrane potential ramped between −100 mV and
50 mV for four cycles. To estimate the rate of electrical coupling, cell image series     Data analysis. Both the electrical data and the fluorescence images were analysed
were acquired at a camera frame rate of 200 Hz with the membrane potential                with home-built software written in MATLAB (MathWorks, version R2018b).
stepped between −70 mV and 30 mV.                                                         For each labelled cell, fluorescence intensities were extracted from the mean
                                                                                          pixel values of a manually drawn region of interest around the soma. Following
Voltage imaging in rat hippocampal neuron culture. To stimulate firing of                 camera bias subtraction (100 and 400 for 1 × 1 and 2 × 2 binning, respectively), the
individual APs, current of 200–500 pA was injected to cultured neurons for                fluorescence signal was corrected for photobleaching. The optical traces in Fig. 5g
5–10 ms at a repetition rate of 250–500 ms. Alternatively, neurons were stimulated        and Extended Data Fig. 8 were corrected for yellow-light-induced Cy5 fluorescence
with current of 100–200 pA for 500 ms to fire AP spike trains. Fluorescence images        (4.0% under our illumination conditions). This level of optical crosstalk was
were acquired at a camera frame rate of 484 Hz with 2 × 2 binning. For wide-field         determined by the experiments described in Extended Data Fig. 8. Statistical
voltage imaging, fluorescence images from a field of view of 452 μm × 161 μm were         analysis was performed with Excel (Microsoft Excel 2019) and Origin (version
recorded at 400 Hz for a total of 10 min.                                                 2019b).
    For simultaneous imaging with GCaMP6s and HVI-Cy5, neurons were
illuminated with 488 nm and 637 nm lasers at 1.3–2.5 W cm−2 and 0.5–1.2 W cm−2,           Reporting Summary. Further information on research design is available in the
respectively, and continuously imaged for 80–100 s at a camera frame rate of              Nature Research Reporting Summary linked to this Article.
484 Hz. For simultaneous imaging with SF-iGluSnFR and HVI-Cy5, neurons were
illuminated with 488 nm and 637 nm lasers at 0.6–1.9 W cm−2 and 0.2–0.5 W cm−2,           Data availability
respectively, and continuously imaged for 50–100 s at a camera frame rate of              All relevant data presented in this study are provided in the Article, Extended Data
484 Hz.                                                                                   figures and Supplementary Information. The data and genetic constructs are also
                                                                                          available from the corresponding authors upon request.
CellTiter-Glo assay for cell viability. Cell viability was measured by CellTiter-Glo
(Promega) assay, which quantified the cellular ATP levels. Neurons were plated in
96-well plates at 13,000 cells per well and cultured as described above. On DIV7–9,       Code availability
neurons were transfected with 125 ng of plasmid DNA per well by Lipofectamine             MATLAB code can be downloaded from GitHub at https://github.com/
3000. On DIV12–14, neurons were labelled with 5 μM LplA and 100 μM 4-TCO for              PKUCHEMZouLab/HVI. Alternatively, it is available from the corresponding
30 min, followed by 1 μM mTz-Cy5 for 10 min, as described above. Neurons were             authors upon request.
then illuminated with a xenon lamp equipped with a >650 nm long-pass filter at
~0.5 W cm−2 for 5 min. Thereafter, medium in each well was replaced with 100 μl           Acknowledgements
Tyrode’s buffer and 100 μl CellTiter-Glo reagent. The sample was mixed on an              We acknowledge funding from the Ministry of Science and Technology
orbital shaker for 2 min before being maintained at room temperature for 10 min.          (2018YFA0507600, 2017YFA0503600 and 2016YFA0501500), the National Natural
Luminescence was recorded on a microplate reader (Synergy H4 hybrid multimode             Science Foundation of China (91753131, 32088101, 21673009, 21521003 and
microplate reader). Eight technical replicates were performed for each sample.            21937001), the Natural Science Foundation of Beijing Municipality (5182011) and the
                                                                                          Interdisciplinary Medicine Seed Fund of Peking University (BMU2017MC006). P.Z.
All-optical electrophysiology with HVI-Cy5. Cultured rat hippocampal neurons              was sponsored by a Li Ge-Zhao Ning Life Science Junior Research Fellowship, a Bayer
expressing CheRiff and HVI-Cy5 were illuminated with 2-ms blue-light pulses               Investigator Award and a National Thousand Young Talents Award. P.R.C. is the recipient
at 0.13–0.31 W cm−2 to stimulate AP firing. Alternatively, cells were stimulated          of the XPLORER PRIZE from the Tencent Foundation. We thank Y. Li, H. Cheng,
with 250 ms of blue-light illumination at 0.06–0.31 W cm−2 to fire AP spike trains.       A. Cohen and L. Brown for providing plasmids. Z. Wu and Y. Li helped provide rat
Fluorescence images were acquired at a camera frame rate of either 464 Hz or              hippocampal neurons.
821 Hz.
     For the synaptic transmission assay, the differential expression of CheRiff and
HVI was achieved by electroporating two pools of rat hippocampal neurons in               Author contributions
suspension with two genes, respectively, before co-plating them together in the           P.Z. and P.R.C. conceived and supervised the project. S.L., C.L., Y.X. and L.P. performed
same cell cultural dish, as previously described in the ‘Cell culture and transfection’   all experiments, unless otherwise noted. C.L. and H.L. carried out chemical syntheses.
section. Cultured neurons were imaged in Tyrode’s buffer at a camera frame rate           X.Z. assisted with neuron culture. H.Z. assisted with purification of plasmids and
of 464 Hz. For each measurement, a 250-ms blue-light pulse (0.3 W cm−2) was               enzymes. S.L., C.L., P.R.C. and P.Z. analysed data. S.L., C.L. and P.Z. wrote the
repeated 10 times under constant 637 nm illumination (0.2 W cm−2). Subsequently,          manuscript with input from all authors.
25 μM APV was added to the Tyrode’s buffer and the same measurement was
repeated after 3 min. Thereafter, 10 μM NBQX was added to the buffer, followed by         Competing interests
another round of measurements.                                                            The authors declare no competing interests.
     To simultaneously monitor intracellular calcium and membrane voltage in
neurons undergoing optogenetic stimulation, rat hippocampal neurons were
transfected with R-GECO1 and Asp81CysAce2-P2A-CheRiff, as previously described            Additional information
in the ‘Cell culture and transfection’ section. Neurons were stimulated by a 488 nm       Extended data is available for this paper at https://doi.org/10.1038/s41557-021-00641-1.
laser for 301 ms at 3, 5, 10 and 13 mW cm−2, while continuously excited with              Supplementary information The online version contains supplementary material
561 nm and 637 nm lasers at 0.1 W cm−2 and 0.2 W cm−2, respectively, and imaged           available at https://doi.org/10.1038/s41557-021-00641-1.
at a camera frame rate of 484 Hz. The R-GECO1 data were smoothed and digitally            Correspondence and requests for materials should be addressed to P.R.C. or P.Z.
resampled at 48.4 Hz to boost the SNR.
     For the bidirectional optical control and recording of membrane potential,           Peer review information Nature Chemistry thanks the anonymous reviewers for their
cultured rat hippocampal neurons were co-transfected with Asp81CysAce2 and                contribution to the peer review of this work.
Mac-P2A-CheRiff at a 2:1 ratio and labelled with Cy5 as described above. Neurons          Reprints and permissions information is available at www.nature.com/reprints.

                                                                                                                         Nature Chemistry | www.nature.com/naturechemistry
You can also read