Simulations of the grand design galaxy M51: a case study for analysing tidally induced spiral structure
←
→
Page content transcription
If your browser does not render page correctly, please read the page content below
Mon. Not. R. Astron. Soc. 403, 625–645 (2010)                                                                        doi:10.1111/j.1365-2966.2009.16161.x

Simulations of the grand design galaxy M51: a case study for analysing
tidally induced spiral structure

C. L. Dobbs,1 C. Theis,2 J. E. Pringle3 and M. R. Bate1
1 School  of Physics, University of Exeter, Stocker Road, Exeter EX4 4QL
2 Institute of Astronomy, University of Vienna, Türkenschanzstr. 17, 1180 Vienna, Austria
3 Institute of Astronomy, Madingley Road, Cambridge CB3 0HA

Accepted 2009 December 3. Received 2009 December 3; in original form 2009 July 17

                                          ABSTRACT
                                          We present hydrodynamical models of the grand design spiral M51 (NGC 5194), and its inter-
                                          action with its companion NGC 5195. Despite the simplicity of our models, our simulations

                                                                                                                                                             Downloaded from http://mnras.oxfordjournals.org/ by guest on July 16, 2015
                                          capture the present-day spiral structure of M51 remarkably well, and even reproduce details
                                          such as a kink along one spiral arm, and spiral arm bifurcations. We investigate the offset
                                          between the stellar and gaseous spiral arms, and find at most times (including the present
                                          day) there is no offset between the stars and gas within our error bars. We also compare our
                                          simulations with recent observational analysis of M51. We compute the pattern speed versus
                                          radius, and similar to observations, find no single global pattern speed. We also show that the
                                          spiral arms cannot be fitted well by logarithmic spirals. We interpret these findings as evidence
                                          that M51 does not exhibit a quasi-steady density wave, as would be predicted by density wave
                                          theory. The internal structure of M51 derives from the complicated and dynamical interac-
                                          tion with its companion, resulting in spiral arms showing considerable structure in the form
                                          of short-lived kinks and bifurcations. Rather than trying to model such galaxies in terms of
                                          global spiral modes with fixed pattern speeds, it is more realistic to start from a picture in
                                          which the spiral arms, while not being simple material arms, are the result of tidally induced
                                          kinematic density ‘waves’ or density patterns, which wind up slowly over time.
                                          Key words: hydrodynamics – ISM: clouds – galaxies: ISM – galaxies: kinematics and dy-
                                          namics – galaxies: spiral – galaxies: structure.

                                                                                    1.1 Spiral structure
1 I N T RO D U C T I O N
                                                                                    Spiral galaxies exhibit a variety of morphologies, from flocculent to
Nearby galaxies such as M51 provide an ideal basis to exam-
                                                                                    grand design. Their structure and dynamics are thought to depend on
ine molecular cloud and star formation, both observationally and
                                                                                    whether the spiral arms are due to small-scale gravitational instabil-
theoretically. Whilst the last decade has seen a huge advance in
                                                                                    ities in the stars and/or gas, or larger-scale perturbations caused by
high-resolution hydrodynamic simulations of galaxies (e.g. Wada
                                                                                    global density waves, tidal interactions or bars (e.g. Toomre 1977;
& Norman 1999; de Avillez & Breitschwerdt 2005; Shetty &
                                                                                    Lin & Bertin 1985; Elmegreen 1991b, 1995).
Ostriker 2006; Dobbs 2008; Agertz et al. 2009; Tasker & Tan 2009),
                                                                                       Flocculent galaxies are thought to occur when local gravita-
such calculations are rarely designed to model specific galaxies,
                                                                                    tional instabilities in the gas lead to multiple short arm segments
e.g. M33, M81, M51 where we are now obtaining detailed CO, Hα
                                                                                    (Elmegreen 1991a, 1995; Bottema 2003; Li, Mac Low & Klessen
and with Herschel, far-infrared observations (e.g. Blitz et al. 2007;
                                                                                    2005). When instabilities are present in both the gas and stars,
Tamburro et al. 2008; Koda et al. 2009). However, several groups
                                                                                    longer spiral arms may develop (e.g. Sellwood & Carlberg 1984;
have successfully computed orbits of nearby interacting galaxies,
                                                                                    Elmegreen & Thomasson 1993).
including M51 (Salo & Laurikainen 2000a; Theis & Spinneker
                                                                                       In addition to flocculent spirals, grand design galaxies, predomi-
2003) and M81 (Yun 1999) using N-body codes. We take the re-
                                                                                    nantly with a symmetric two or four armed spiral pattern, constitute
sults from one such calculation (Theis & Spinneker 2003) as the
                                                                                    around 50 per cent of spiral galaxies (Elmegreen 1982). Tradition-
basis for modelling the gas dynamics of M51.
                                                                                    ally, ‘density wave theory’ has been used to provide an explanation
                                                                                    of the spiral patterns in these galaxies, where the stars and gas
                                                                                    are assumed to exhibit quasi-stationary standing wave patterns (Lin
 E-mail: dobbs@astro.ex.ac.uk                                                      & Shu 1964). The spiral arms occur where stars are aligned at


C   2010 The Authors. Journal compilation
                                          C 2010 RAS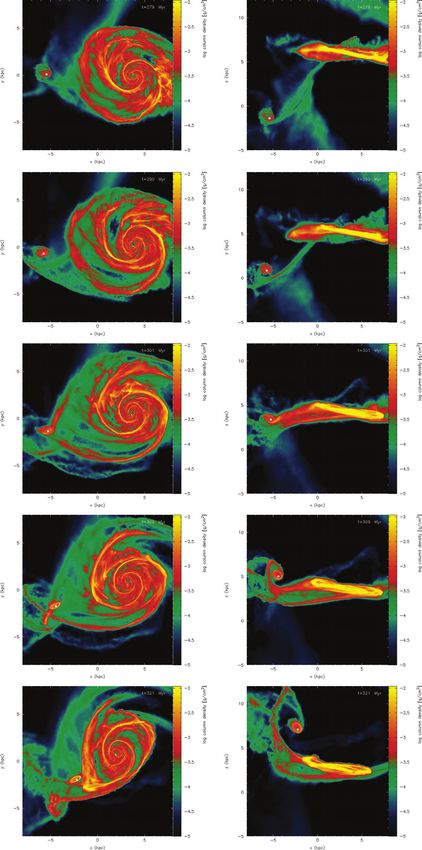
626       C. L. Dobbs et al.
particular points of their orbits (Toomre 1977). For both types of               [e.g. by agglomeration (Dobbs & Bonnell 2006; Dobbs 2008)] or
spiral, swing amplification may be important either by increas-                  gravitational instabilities in the gas (Balbus 1988; Kim & Ostriker
ing the amplitude of local perturbations (Julian & Toomre 1966;                  2002; Shetty & Ostriker 2006; Dobbs 2008)] and are then sheared
Toomre 1981; Sellwood & Carlberg 1984), or by providing a feed-                  into spurs as they leave the arms. In the presence of some under-
back mechanism to maintain wave packets propagating through the                  lying driving frequency (a global pattern speed), longer gaseous
disc (Mark 1976; Goldreich & Tremaine 1978; Toomre 1981).                        branches may also develop at certain radii due to resonances in
   However, an alternative picture is that the grand design spiral               the disc (Patsis, Grosbol & Hiotelis 1997; Chakrabarti, Laughlin
structure may be caused predominantly by tides, driven by inter-                 & Shu 2003; Yáñez et al. 2008). In addition, spurs may be associ-
nal bars or by interactions with other galaxies (Chamberlin 1901;                ated with stochastic star formation (Elmegreen 1980; Feitzinger &
Toomre & Toomre 1972; Tully 1974; Oh et al. 2008). In fact,                      Schwerdtfeger 1982), but simulations by Shetty & Ostriker (2008)
Kormendy & Norman (1979) proposed that, unless their rotation                    indicate that the stellar feedback tends to disrupt large spurs in the
curves have special properties, all non-barred grand design galaxies             disc.
must be the result of interactions with nearby galaxies. This view is
strengthened by the simulations by Bottema (2003).
   The first comprehensive investigation of the degree to which spe-             1.3 Previous models of M51
cific grand design spirals could be modelled by tidal interactions was
                                                                                 M51, in particular, is considered the hallmark for grand design
presented by Toomre & Toomre (1972). However, the limitations of
                                                                                 galaxies and as such is a prime candidate for the application of den-
the simple analysis of Toomre & Toomre (1972) were such that the
                                                                                 sity wave theory. However, there are clear indications of a departure
tidal features could not propagate radially and so could be induced
                                                                                 from standard density wave theory. Shetty et al. (2007) show huge
only in the outer parts of galaxies. Later calculations by Hernquist

                                                                                                                                                           Downloaded from http://mnras.oxfordjournals.org/ by guest on July 16, 2015
                                                                                 variations in the velocities of gas in the disc, apparently showing
(1990) of tidal interactions indicated that with higher resolution, and
                                                                                 large net radial mass fluxes at some radii, suggesting that the spiral
when including a fully consistent gravitational model, more realis-
                                                                                 structure of the galaxy is not in a steady state. Furthermore, Meidt
tic rotation curves and self-gravity of the stars, the spiral structure
                                                                                 et al. (2008) find multiple pattern speeds in M51 (or a radial depen-
extends to much smaller radii and is longer lived. Hernquist (1990)
                                                                                 dence of pattern speed), indicative that the pattern is both radially
found that the tidally induced waves are amplified by the swing
                                                                                 and time dependent.
amplification mechanism, as predicted by Toomre (1981). Further-
                                                                                    There have been numerous numerical models of M51,
more, the spiral structure is more easily seen and so prolonged when
                                                                                 (e.g. Toomre & Toomre 1972; Hernquist 1990), but the most thor-
gas is present (Sundelius et al. 1987; Bertin et al. 1989; Chakrabarti
                                                                                 ough are by Salo & Laurikainen (2000a,b). Salo & Laurikainen
2008). Nevertheless, the tidal encounter could produce the stimulus
                                                                                 (2000a) use a least squares technique to find the orbits of the galaxy–
for a strong density wave perturbation, as originally hypothesized
                                                                                 galaxy interaction which produce the observed structure. They show
by Toomre & Toomre (1972), and discussed in more detail for M51
                                                                                 that a multiple, rather than single, encounter can produce velocities
by Tully (1974) and Elmegreen, Seiden & Elmegreen (1989).
                                                                                 in the H I tail in agreement with observations. They also indicate
                                                                                 that tidal perturbations overwhelm any pre-existing spiral structure.
1.2 Molecular clouds and spurs                                                   Salo & Laurikainen (2000b) perform higher resolution simulations,
                                                                                 though only with a stellar disc, to investigate inner spiral struc-
For flocculent galaxies, the formation of molecular clouds is most
                                                                                 ture. Similar to Toomre (1969), they propose that the inner spirals
likely intrinsically linked to the formation of spiral structure – grav-
                                                                                 are a consequence of tidal waves propagating to the centre of the
itational instabilities in the gas lead to both the spiral arms and
                                                                                 disc.
molecular clouds (Elmegreen 1995). Recently, computer simula-
                                                                                    In order to analyse the extended parameter space, Theis &
tions have become capable of modelling the hydrodynamics of such
                                                                                 Spinneker (2003) instead employ a genetic algorithm to determine
galaxies. Several simulations show the formation of giant molecu-
                                                                                 the orbit of M51 and NGC 5195. Based on a much larger number
lar clouds in this manner (Wada & Norman 1999; Wada, Meurer &
                                                                                 of simulations, they corroborate the results of Salo & Laurikainen
Norman 2002; Li, Mac Low & Klessen 2005; Tasker & Bryan 2006;
                                                                                 (2000a) i.e. they find the orbit involves multiple encounters. Both
Robertson & Kravtsov 2008), although collisions between clouds
                                                                                 Salo & Laurikainen (2000a) and Theis & Spinneker (2003) require
may also contribute (Tasker & Tan 2009). For grand design spirals,
                                                                                 that NGC 5195 lies on a bound orbit to match the spatial and velocity
giant molecular clouds (GMCs) basically form in the same way, but
                                                                                 structure of M51.
long-lived spiral perturbations force the gas into the spiral arms pe-
riodically, and for longer. Consequently, the growth of instabilities
are more confined to, and more dependent on the conditions in the
                                                                                 1.4 The current paper
spiral arm, e.g. density, degree of shear. Furthermore, collisional
formation of molecular clouds can play a much more important role                So far, simulations of grand design galaxies have largely implicitly
as the mean free path between collisions decreases (Dobbs 2008).                 assumed density wave theory, invoking a global mode with a fixed
   In addition to molecular cloud complexes along the arms, inter-               pattern speed by applying a steady rotating spiral potential (Kim
arm spurs are clearly visible in many spiral galaxies (Elmegreen                 & Ostriker 2002; Dobbs, Bonnell & Pringle 2006; Dobbs 2008).
1980; La Vigne, Vogel & Ostriker 2006) and are particularly dis-                 However, if grand design galaxies arise from interactions or bars,
tinguishable in M51 (Corder et al. 2008). One possibility is that                it is unclear whether the density wave scenario invoked by Lin &
the interarm spurs correspond to features in the underlying stellar              Shu (1964) is appropriate in many galaxies. Thus, it is important to
distribution (Julian & Toomre 1966; Elmegreen 1980; Byrd, Smith                  study the gas dynamics and formation of molecular clouds in the
& Miller 1984) and are thus due to gravitational instabilities in                context of realistically induced spiral perturbations. For the case of
the stars. More recent simulations, which assume a static potential,             a bar-driven grand design spiral, the spiral is believed to be long-
have also shown the formation of spurs purely from the gaseous                   lasting, thus the idea of a spiral structure with fixed pattern speed
component of the disc. In this case, GMCs form in the spiral arms                may well be applicable. This is less likely to be true for interacting


                                                                           C   2010 The Authors. Journal compilation
                                                                                                                     C 2010 RAS, MNRAS 403, 625–645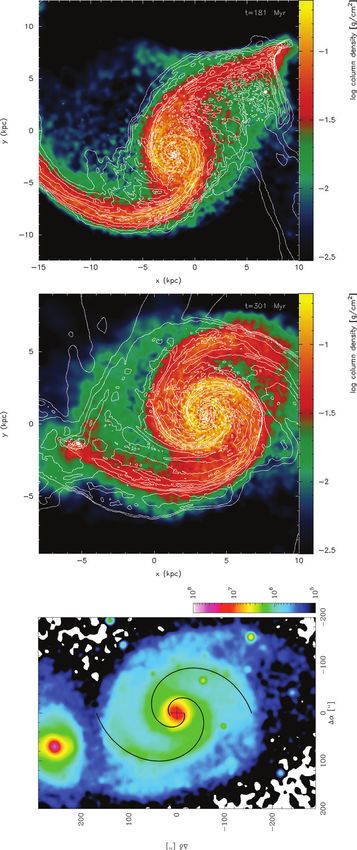
Simulations of tidally induced structure in M51                              627
galaxies, where there is a dynamical interaction and a constantly
changing spiral structure.
   In this paper, we study the dynamics in an interacting system,
using orbital data for M51 provided by Theis & Spinneker (2003).
Whilst Salo & Laurikainen (2000b) mainly concentrated on the stel-
lar structure and dynamics, we focus on the gas. Salo & Laurikainen
(2000a) do include gas in lower resolution simulations, though they
use a sticky particle method to evolve the gas particles. We instead
use a Lagrangian hydrodynamics code smoothed particle hydrody-
namics (SPH) to model a dynamic halo, disc (which contains gas and
stars) and bulge. We describe the evolution of the spiral arms, the
generation of substructure and the velocities in the gas. We consider
whether the evolution of the disc is significantly different from the
previous simulations which assumed a static potential and therefore
a rigidly rotating density wave.

2 C O M P U TAT I O N A L D E TA I L S
We model M51 and its interaction with NGC 5195 using SPH, a
Lagrangian fluids code. The code is based on an original version by

                                                                                                                                                                Downloaded from http://mnras.oxfordjournals.org/ by guest on July 16, 2015
Benz (Benz et al. 1990), but has since been subject to significant
modifications, including individual time steps and sink particles
(Bate 1995; Bate, Bonnell & Price 1995). More recently magnetic
fields have been included (Price & Monaghan 2005; Price & Bate
2007), although these are not used in the current paper.
   Unlike GADGET (Springel, Yoshida & White 2001; Springel 2005),
which has previously been applied to simulations of interacting
galaxies (e.g. Cox et al. 2006; Jáchym et al. 2007), our code has pre-
dominantly been used for simulations of star formation (e.g. Bate,
Bonnell & Bromm 2003; Price & Bate 2008; Bate 2009a,b). Even
for calculations of a galactic disc (Dobbs 2008; Dobbs & Bonnell
2008; Dobbs et al. 2008), we restricted our models to the gaseous             Figure 1. Orbit of M51 (dotted line) and companion galaxy NGC 5195
component of the disc. For the simulations in this paper, we model            (solid line) in the xy (top) and yz (lower) planes. The ×+ symbol denotes
the stellar disc, bulge and halo, so have therefore adapted the code          the initial positions of the galaxies and t1, t2, t3 denote times of 100, 200
to include two types of particle, gaseous and stellar.                        and 300 Myr. Recall that the z-axis lies along the line of sight (with positive
   All particles have variable smoothing lengths, the smoothing               z pointing towards the observer, while the x- and y-axes lie in the plane of
length and density solved iteratively according to                            the sky.
        1/3
         m
h=ν                                                                 (1)       comprise the disc and bulge of M51 – the halo is represented by
          ρ
                                                                              a potential. They generated spatial and velocity maps from the
(Price & Monaghan 2007). Here, ρ is the density, m the mass of the            outcome of each N-body calculation to compare with observed
particle and ν is a dimensionless parameter set to 1.2 in order that          maps of H I. The genetic algorithm code is used to constrain the
each particle has ∼60 neighbours. We calculate smoothing lengths              parameters of the orbit, and find the best fit to the observed data.
for the gas and star particles separately. For both types of particle,        The best-fitting model corresponds to a highly elliptical orbit, with
h sets the gravitational softening length, and, for gaseous particles,        two passages of NGC 5195 through the plane of the disc of M51.
it is also the SPH smoothing length. Only gas particles are subject to        This model provided the initial velocities and positions for the SPH
pressure and viscous forces. Artificial viscosity is included to treat        calculations at a time of ∼300 Myr prior to their current position.
shocks, using the standard parameters, α = 1 and β = 2 (Monaghan              At this point in the N-body model, the two galaxies are separated
& Lattanzio 1985).                                                            by approximately 24 kpc. The resulting orbit of the two galaxies
                                                                              in the SPH calculations is shown in Fig. 1. The initial positions and
                                                                              velocities of the two galaxies are listed in Table 1.
2.1 The orbit of M51 and NGC 5195
In order to reproduce spiral structure similar to that observed in M51,
                                                                              2.1.1 Dynamical friction
we model a galaxy representing M51 and its companion galaxy
NGC 5195. We assign the initial positions and velocities of the               A difference between the simulations presented here and those pro-
two galaxies according to the results from N-body calculations by             duced using the MINGA code is that we use a live halo, whereas
Theis & Spinneker (2003). Theis & Spinneker (2003) used MINGA, a              Theis & Spinneker (2003) use a potential. Consequently, the orbit
restricted N-body code combined with a genetic algorithm code, to             of the SPH calculations begins to deviate from that derived from the
determine the orbit of M51 and NGC 5195. In their calculations, the           MINGA calculations with time. Petsch & Theis (2008) have since im-
interacting galaxy NGC 5195 is represented by a single point mass,            plemented dynamical friction into an improved MINGA code, which
which has one third the mass of M51. The test particles otherwise             takes into account the effect of the companion on the halo. They


C   2010 The Authors. Journal compilation
                                          C 2010 RAS, MNRAS 403, 625–645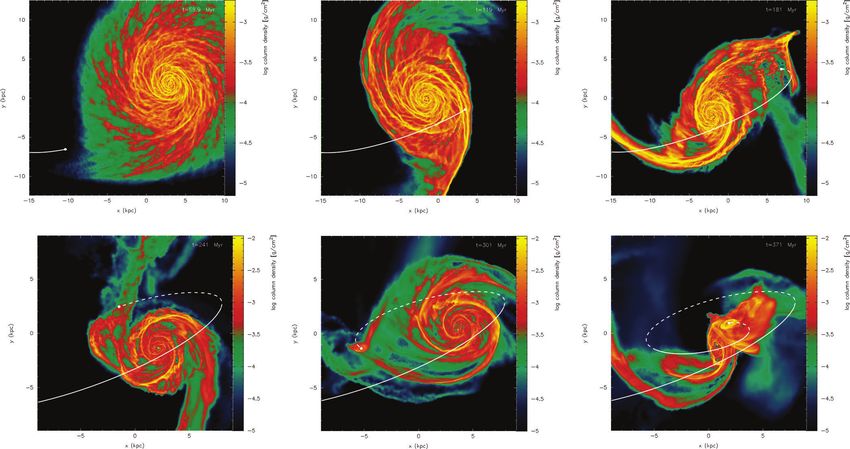
628       C. L. Dobbs et al.
          Table 1. The initial positions and velocities for M51                  Table 2. The mass, radial extent and number of particles is listed for each
          and NGC 5195 are listed.                                               component of the M51 galaxy (the radial extent is the distance to the edge
                                                                                 of each component, although all fall off with radius).
                                              M51     NGC 5195
                                                                                 Component              Mass             Radial extent           No.
              Initial position (kpc)     x    4.91     −17                                              (M )               (kpc)              particles
                                         y    1.89     −6.55
                                         z    0.95     −3.30                     M51: Disc          5.9 × 10¹⁰                 15                 106
          Initial velocity (km   s−1 )   vx   −1.46     5.86                     M51: Halo          1.45 × 10¹¹                20               6 × 10⁴
                                         vy    0.68    −2.44                     M51: Bulge         5.25 × 10⁹                 4.8              4 × 10⁴
                                         vz   −3.26     15.6                     NGC 5195           7.07 × 10¹⁰                 –                  1

          Note. These are extracted from the N-body calcula-                     Note. The companion galaxy NGC 5195 is represented by a single point
          tions performed by Theis & Spinneker (2003).                           mass in the simulation, thus has no physical radius.

                                                                                 y-axis, and then one 10◦ clockwise about the x–axis. Before adding
also reran the calculations of Theis & Spinneker (2003) using dy-
                                                                                 the perturbing galaxy, we first ran a simulation with stars only, to
namical friction. Unfortunately, they have not yet calculated a new
                                                                                 ensure that the galaxy had a stable configuration.
orbit for M51, which includes the effects of dynamical friction.
                                                                                    Lastly, we placed the two galaxies at the relative positions, and
   We did however run calculations of the interaction without gas, to
                                                                                 with the respective velocities to reproduce their orbit, as determined
compare with unpublished purely stellar dynamical calculations of
                                                                                 by Theis & Spinneker (2003). The initial positions and velocities
Harfst & Theis (private communication). Although Harfst & Theis
                                                                                 (with respect to our Cartesian grid) of the two galaxies are those

                                                                                                                                                               Downloaded from http://mnras.oxfordjournals.org/ by guest on July 16, 2015
modelled NGC 5195 as well as M51 (whilst here we adopt a point
                                                                                 shown in Table 1. Similar to Theis & Spinneker (2003), we model
mass for NGC 5195), we found that after 300 Myr, the difference
                                                                                 the interaction by designating a single particle as the companion
in the position of the companion, and the structure of the disc was
                                                                                 galaxy NGC 5195, which has a third of the mass of M51. The soft-
negligible for the MINGA and SPH codes. After 500 Myr, the structure
                                                                                 ening of the point mass is treated in the same way as the other par-
of M51 was still the same, although the companion galaxy had
                                                                                 ticles in the simulation. Salo & Laurikainen (2000b) similarly only
shifted about 25◦ further in its orbit for the SPH code.
                                                                                 assigned one particle to NGC 5195, although their first calculations
                                                                                 modelled the companion galaxy consistently (Salo & Laurikainen
2.2 Initial setup of M51 and NGC 5195                                            2000a).

We determined the initial distribution of particles in our model
of M51 by using the MKKD95 program (Kuijken & Dubinski 1995).                    2.2.1 The gaseous component of the disc
This is a publicly available program from the NEMO stellar dynamical
                                                                                 We performed three calculations with different conditions for the
software package (Teuben 1995). In the MKKD95 program, we set psi
                                                                                 gaseous component of the disc. In all cases, we set 900 000 random
0 = −7.65 and RA = 0.142 (which determine the size of the halo),
                                                                                 particles in the disc as gas particles – thus leaving 100 000 stellar
md = 1.36 (the mass of the disc), router = 3 (the radius where the
                                                                                 particles in the disc. In model A, this implied a mass resolution of
disc begins truncate) and drtrunc = 0.25 (the distance over which
                                                                                 180 M per particle for the gas and 2.4 × 10⁶ M per particle for
the disc truncates). The remaining parameters (including those for
                                                                                 the stellar disc. The average smoothing length for the gas particles
the bulge) were set as the defaults. We selected these parameters
                                                                                 is 100 pc. We did not change the positions of the gas particles,
to produce a mass and maximum radial extent for each component
                                                                                 rather we assumed they would settle in equilibrium in the direction
similar to those of Theis & Spinneker (2003), although we adopted
                                                                                 perpendicular to the disc (see Section 3). We then set masses and
a slightly less extended halo based on the rotation curve shown in
                                                                                 temperatures for the gas particles, as shown in Table 3.
Sofue et al. (1999). However, although the radius and mass chosen
                                                                                    We chose the gas mass to be 0.1, 1 or 10 per cent of the disc
for the halo were based on the observed rotation curve, our rotation
                                                                                 mass, and the temperature as either 100 or 104 K. For these cal-
curve was not as flat as Sofue et al. (1999), peaking at around
                                                                                 culations, we take a simple approach and assume the gas to be
275 rather than 250 km s−1 . Furthermore, the maximum velocity
                                                                                 isothermal. The cases where the gas mass is 0.1 or 1 per cent are
increases slightly during the interaction. Thus, in retrospect, we
                                                                                 unrealistically low for a disc galaxy. However, such a low mass
ideally would have needed to start with a more extended halo. The
                                                                                 largely prevents gravitational collapse in the gas. Gravitational col-
main difference this makes to our simulation is that the pattern has
                                                                                 lapse slows down the calculations, and requires the inclusion of
rotated further and is therefore slightly out of phase compared to
                                                                                 sink particles. Furthermore, in order to carry out a global compar-
the observed structure of M51 (see Sections 4.1 and 4.2).
                                                                                 ison of the gas distribution between models and observations, we
   The properties of our model of M51 are listed in Table 2, as well
as the number of particles in each component. We chose to place                         Table 3. The properties of the gas component are listed for
the most resolution in the disc (and in particular the gas). Thus,                      the three models presented in this paper.
we used one million particles for the disc, 6 × 10⁴ for the halo and
4 × 10⁴ for the bulge, giving a total of 1.1 million. We then assigned                  Model          Gas mass          Temperature       min (Qg )
SPH particles the velocities, positions and masses outputted from the                              (per cent of disc)       (K)
MKKD95 program.
   We work in a Cartesian coordinate system in which the x- and                           A                1                  104              30
                                                                                          B               10                  104              3
y-axes lie in the plane of the sky, and the z-axis lies towards us along
                                                                                          C               0.1                 100              30
the line of sight. In order to end up with the observed orientation
of M51, we start with our model galaxy in the plane of the sky and                      Note. The final column is the minimum value of the Toomre
then perform two rotations, first one of 20◦ clockwise about the                        stability parameter for the gas (see Section 2.2.2 and Fig. 2).


                                                                           C   2010 The Authors. Journal compilation
                                                                                                                     C 2010 RAS, MNRAS 403, 625–645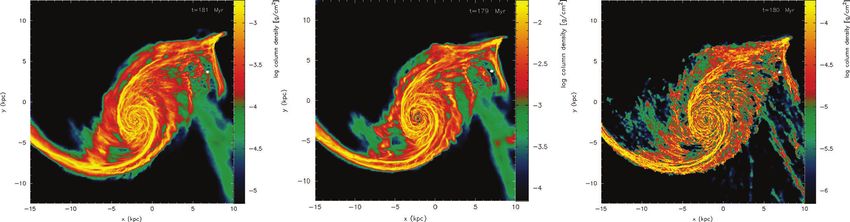
Simulations of tidally induced structure in M51                          629

                                                                                     Figure 3. The gas column density is shown for an isolated galaxy, using
                                                                                     the galaxy from model A with 1 per cent warm gas. The time is 300 Myr,
Figure 2. Qs and Qg are plotted against radius for model B, where 10 per
                                                                                     though the nature of the spiral structure does not change significantly be-
cent of the disc is warm (104 K) gas. Qs is the same for all the models as the
                                                                                     tween 100 and 300 Myr. The combined stellar + gaseous disc is unstable to

                                                                                                                                                                   Downloaded from http://mnras.oxfordjournals.org/ by guest on July 16, 2015
stellar distribution does not change. Qg is a factor of 10 higher for models
                                                                                     gravitational perturbations (with Qs < 2), hence a multi-armed flocculent
A and C, which are more stable.
                                                                                     spiral pattern develops.
are mainly interested in the structure induced in the gas in response
                                                                                     accretion radii of 10 pc. Clearly, we do not resolve the Jeans length
to the interaction, as opposed to the instabilities in the gas. For the
                                                                                     up to this density with our resolution – the inclusion of sink particles
warm (104 K) gas though, which is less susceptible to gravitational
                                                                                     merely allows the calculations to continue. In our main model (A)
instabilities, we also ran a model where 10 per cent of the disc is
                                                                                     only five sink particles are formed during the simulation.
gas (by mass).
   We initially ran a calculation with a temperature of 100 K, setting
1 per cent of the disc as gas. However, this gave rise to widespread                 3 I S O L AT E D G A L A X Y
self-gravitational collapse throughout the disc. For this reason, we
restarted the calculation but taking 0.1 per cent of the mass of                     Before considering the results of the models where we have two
the disc to be gas, which was more stable. In addition to running                    interacting galaxies, we first consider the case where we model an
models with an interaction, we also ran a calculation for a galaxy                   isolated galaxy. This galaxy is essentially the same as that set up
in isolation. For this, we used our fiducial mode (A) with 1 per cent                for model A, except the galaxy is not inclined to the line of sight,
warm gas.                                                                            and is centred at Cartesian coordinates (0,0,0). We show in Fig. 3
                                                                                     the column density of the gaseous component after 300 Myr. The
                                                                                     structure at this time is typical of the structure present at any time
2.2.2 Stability of the disc                                                          after 100 Myr – there are multiple (relatively long) gaseous spiral
                                                                                     arms, but no obvious spiral mode. The combined stellar + gaseous
To clarify the gravitational stability of the disc, we computed the                  disc is evidently susceptible to gravitational perturbations (as also
Toomre stability parameter for the gas (Qg ) and stars (Qs ). We                     indicated by the low Qs parameter in Fig. 2). However, the gas
took Qg = cs κ/πG and Qs = σ R κ/3.36G  where cs is the                            tends to be locally stable (since we chose such a low gas mass)
sound speed, κ is the epicyclic frequency,  the surface density                     to runaway gravitational collapse, and only one sink particle forms
and σ R the radial velocity dispersion (Toomre 1964; Goldreich &                     over the length of the simulation, 300 Myr. The overall appearance
Lynden-Bell 1965; Binney & Tremaine 1987). A detailed analy-                         is one of a typical flocculent galaxy.
sis for the Toomre criterion in a two-fluid system is described in                      As described previously, we did not set the gas particles in vertical
Jog & Solomon (1984) and (Romeo 1992), but we adopt the lim-                         equilibrium initially. In the isolated case, however, we find that the
iting case where one component is stable for our simple analysis                     gas settles in the z direction within 30 Myr, with a typical scale
here. We show Qg and Qs versus radius for the least stable case                      height of around 200 pc. This is comfortably before the interaction
(model B) in Fig. 2. We also state the minimum value of Qg in                        occurs in our M51 models described next.
Table 3. As Qs is ≈1 at larger radii, the stars are unstable to per-
turbations, and as we show in Section 3.1.1, multiple spiral arms
develop even in the absence of a tidal interaction. For the model                    4 M51 MODEL
where 10 per cent of the disc is gas, Qg is as low as 3, hence the                   We describe, in this section, the structure of the disc in simula-
gas is only marginally stable. This is the least stable case – Qg is a               tions of M51 and its orbit with NGC 5195. We provide a more
factor of 10 higher in models A and C.                                               detailed comparison between our results and the structure of M51
                                                                                     in Section 4.1.1, a comparison between models A, B and C in
                                                                                     Section 4.1.2, and a Fourier analysis of the spiral components in
2.2.3 Sink particles
                                                                                     Section 4.1.3. We also investigate any offset between the stellar
Even with low surface densities, we found it necessary for computa-                  and gaseous arms in Section 4.2, and compute the pattern speed in
tional reasons to allow the formation of sink particles. Sink particles              Section 4.3. Finally, in Section 5, we make comparisons between
replaced regions with gas densities exceeding 10−12 g cm−3 , with                    our results and the observations of Shetty et al. (2007).


C   2010 The Authors. Journal compilation
                                          C 2010 RAS, MNRAS 403, 625–645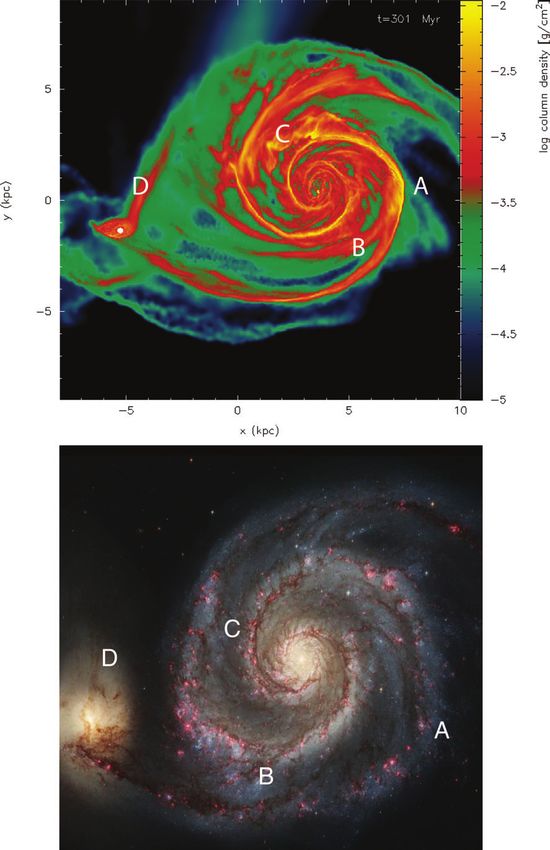
630        C. L. Dobbs et al.

                                                                                                                                                                    Downloaded from http://mnras.oxfordjournals.org/ by guest on July 16, 2015
Figure 4. Column density plots show the time evolution of the simulated interaction of M51 and NGC 5195, at times of 60, 120, 180, 240, 300 (corresponding
approximately to the present day) and 371 Myr. These plots only show the gas, which represents 1 per cent of the disc by mass, and has a temperature of
104 K (model A). We model a galaxy representing M51, whilst the galaxy NGC 5195 (a point mass) is indicated by the white spot. Sink particles are otherwise
omitted from the figures (see text). The orbit of the companion galaxy is also shown on the panels (the dashed section indicates that the companion is behind
the M51 galaxy). The galaxy undergoes a transition from a flocculent spiral to a grand design spiral during the course of the interaction. At the last time frame
(371 Myr), the two galaxies are in the process of merging. Note, both the spatial and density scales differ in the lower three plots.

                                                                                    with many shorter segments of spiral arms, due to gravitational
4.1 Structure of the disc                                                           instabilities primarily affecting the gas (Toomre 1964). By 180 Myr
We show the evolution of the gas disc of model A (with 1 per cent                   (top right-hand panel), the galaxy contains a dominant two–armed
warm gas) in Fig. 4, where the interacting galaxy NGC 5195 is                       spiral pattern. Some remaining flocculent structure is seen towards
visible as a white dot. After 60 Myr (first panel), the interaction is              the top right of the panel (x = 5 kpc, y = 5 kpc), which has not yet
not far advanced, and the structure resembles the flocculent spiral                 passed through the tidal arms. However, there are also bifurcations
structure seen in the isolated case (Fig. 3). By 120 Myr (second                    of the spiral arms, spurs and material shearing away from the spiral
panel), we start to see a two-armed spiral pattern developed at                     arms, which we discuss further in later parts of the paper.
larger radii (R > 5 kpc). At later times, the two-armed structure
extends to much smaller (R ∼ 2 kpc) radii. The spiral pattern
                                                                                    4.1.1 Detailed analysis of structure and comparison with M51
evidently changes with time, but it evolves more slowly between
240 and 300 Myr. During the simulation, the companion galaxy                        In Fig. 5, we show a snapshot from our simulation, at 300 Myr
becomes increasingly bound to the M51 galaxy, and at the latest time                roughly corresponding to the present day, accompanied by an Hub-
(370 Myr), the two galaxies are beginning to merge.                                 ble Space Telescope (HST) image of M51. The figures show excel-
   The time of 300 Myr corresponds approximately with the present                   lent agreement between the simulations and observations, in partic-
day in Theis & Spinneker (2003). The orbit in this simulation devi-                 ular, the overall shapes of the arms, and their pitch angles.
ates from the one obtained by Theis & Spinneker (2003) because our                     We note several specific features seen in the simulation, and M51,
active halo permits dynamical friction and therefore the model does                 which are labelled on Fig. 5. First, there is a clear kink in the spiral
not exactly reproduce the current positions of M51 and NGC 5195.                    arm (marked A) in M51, and remarkably, the same feature appears
Nevertheless, the tightly wound spiral arms and overall morphology                  in our model. The kink is slightly further anticlockwise compared
strongly resemble that of M51, as we will discuss in Section 4.1.1.                 to the actual M51, suggesting our model has evolved slightly too
   Although not shown in Fig. 4, to avoid confusion with the com-                   far, presumably because the density structure, and hence the rotation
panion galaxy, the gas disc also contains sink particles. These have                curve we have assumed for M51 is not quite right. This kink appears
been inserted at regions which acquire sufficiently high densities                  to arise where the inner spiral arm, induced from the previous
that would otherwise halt the calculation. However, for model A,                    crossing of the companion, meets a new spiral arm induced by
the disc is still relatively stable and only five such particles form               the current passage of NGC 5195. The feature marked B indicates
over the course of the calculation.                                                 a second spiral arm breaking away from the main arm. This occurs
   Interestingly, there appears to be substructure in the gas at all                in both model and the actual M51, although again in our model the
stages of the interaction. Initially, the substructure is flocculent,               arm has rotated further round the galaxy. We also see a large degree


                                                                              C   2010 The Authors. Journal compilation
                                                                                                                        C 2010 RAS, MNRAS 403, 625–645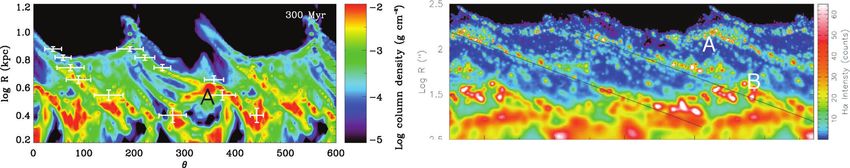
Simulations of tidally induced structure in M51                         631

                                                                                                                                                                   Downloaded from http://mnras.oxfordjournals.org/ by guest on July 16, 2015
Figure 5. The top panel is a column density plot from our simulation with
1 per cent warm gas after 300 Myr, whilst the lower panel is a HST image              Figure 6. The top panel shows a column density plot from our fiducial
of M51 produced by NASA, ESA, S. Beckwith (STScI) and The Hubble                      simulation after 300 Myr but zoomed out to larger scales. There is a tidal
Heritage Team (STScI/AURA). The spiral structure e.g. shape and pitch                 tail of low-density gas which roughly matches the H I observations by Rots
angle of the spiral arms appears very similar to the actual M51. In addition,         et al. (1990), lower panel. Image courtesy of NRAO/AUI/NSF.
we mark on several features (A, a kink in the spiral arm; B, a branch; C,
interarm gas; D, a stream of gas extending from the companion) which
appear in both the simulation and the observations.                                   gas tail has a stellar counterpart. This is as expected since we base
                                                                                      our models on the calculations of Theis & Spinneker (2003), who
                                                                                      compared the stellar distribution of their results with Rots et al.
of gas between the spiral arms, in particular, indicated at C, and
                                                                                      (1990).
again this is typical for much of M51.1
                                                                                         The gas feature at (0,20) kpc in our coordinates is not seen in the
   A feature which is not seen in the Hubble image of M51, but is
                                                                                      observations. We find that this gas has been slung out of M51 by
present in our model, is a large stream of gas above the uppermost
                                                                                      a close passage with the companion. Possibly, there is gas in this
spiral arm (i.e. above C). Interestingly though, we do see gas in front
                                                                                      region which is not detected. Alternatively, if we properly modelled
of the companion galaxy (marked D). Possibly, this gas extends
                                                                                      the companion, rather than using a point mass, the gas may collide
further, and would be visible in H I (see Fig. 6), or alternatively the
                                                                                      with gas internal to the companion and experience less acceleration,
gas disc in our model is initially too extended.
                                                                                      or even become accreted by the companion.
   In Fig. 6, we show a much larger scale image from our simulation
                                                                                         From Fig. 5, our simulated galaxy appears slightly stretched
at the same time of 300 Myr, and below an H I image from Rots
                                                                                      in the y direction compared to the actual M51. Although we use
et al. (1990). We capture the H I tail of M51 very well. The width
                                                                                      the observed position and inclination angles of M51 in our initial
of the tail increases up to the corner of the tail, before diminishing.
                                                                                      conditions, these change over the course of the simulation, and
There is also gas far round the tail, i.e. at negative x values in our
                                                                                      the galaxy becomes less tilted on the plane of the sky. Thus, at
coordinates, which is apparent in the H I image. The entirety of the
                                                                                      300 Myr, the galaxy appears more face-on than M51. This could
                                                                                      suggest that we would need to start with a slightly different orien-
1 At
                                                                                      tation to that currently observed for M51, or again reflect a simpli-
     180 Myr (Fig. 4), there is also a stream of gas shearing away from the
                                                                                      fication of our model (e.g. representing NGC 5195 by a point mass).
spiral arm. Thus, the spiral arm appears to bifurcate moving radially inwards
along the spiral arm [at coordinates (−10, −7) kpc]. Although not seen in                We show the detailed evolution of the disc from 280 to 320 Myr
M51, this is very similar to some of the structure seen in M81 (Kendall               in Fig. 7. The structure of the disc, and the spiral arms, are evidently
et al. 2008). Identifications of bifurcations with pattern speed resonances           changing over time-scales of
632 C. L. Dobbs et al.
Downloaded from http://mnras.oxfordjournals.org/ by guest on July 16, 2015
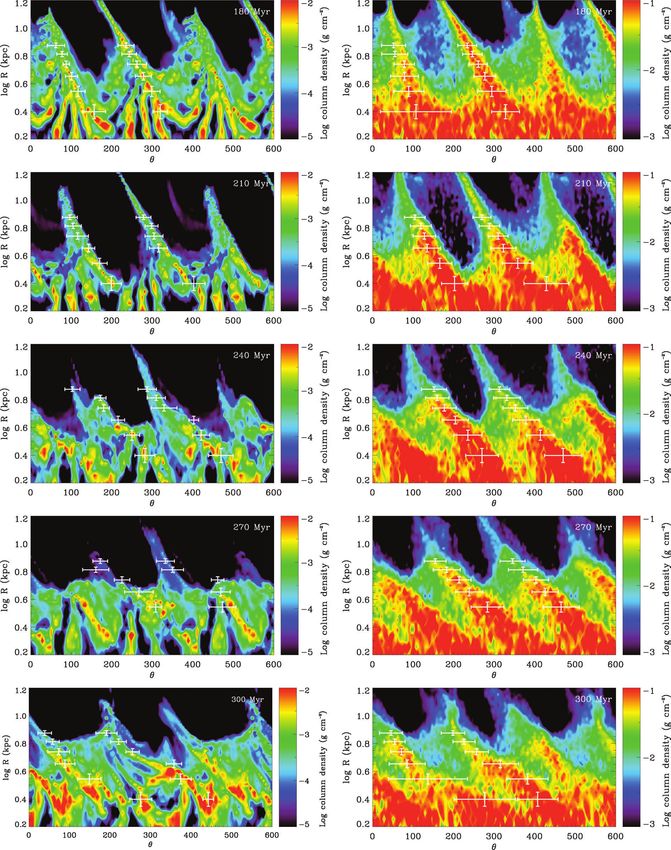
Figure 7. The column density of the gas disc is shown for model A (1 per cent warm gas) after 279, 290, 301, 309 and 320 Myr. The left-hand panels show the
galaxy face on (in the xy plane in our coordinates) whilst the right-hand panels show the galaxy along the line of sight (i.e. in the xz plane) where the positive
z direction is towards us. The panels indicate that the current position of the companion apparently at the end of a spiral arm is a coincidence, whilst the
left-hand panels highlight the evolution of the spiral structure, and interarm structure over much shorter time-scales compared to Fig. 4.
C 2010 The Authors. Journal compilation
C 2010 RAS, MNRAS 403, 625–645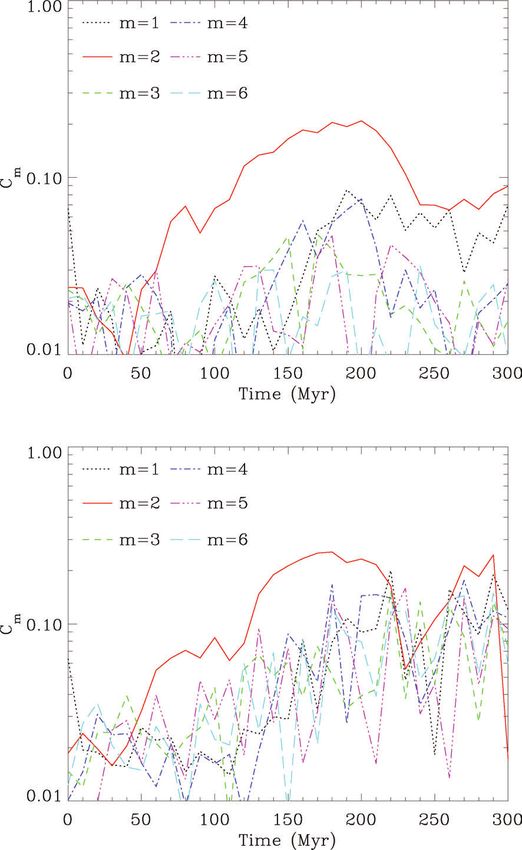
Simulations of tidally induced structure in M51                               633
was nowhere near the spiral arm. In the direction along the line of                4.1.3 Evolution of spiral modes
sight (right-hand plots), the companion galaxy is passing through
                                                                                   We consider specifically how the spiral structure of the disc changes
the plane of the disc, from behind to in front of M51. We can also
                                                                                   with time by computing the amplitude of the spiral modes. We
see the evolution of the large branch in the spiral arm, marked B in
                                                                                   calculate the Fourier amplitude of each spiral mode according to
Fig. 5. The branch is due to material shearing away from the spiral
                                                                                   Theis & Orlova (2004):
arm, and its presence and location change with time. Thus, unlike

Elmegreen et al. (1989), who suggest branches in M51 lie at the 4:1                         1  2π Rout                    −imθ


ultraharmonic resonance of some global pattern speed, we instead                   Cm =                    (R, θ)R dR e        dθ ,               (2)
                                                                                          Mdisc  0     Rin
suggest they are temporary features, due to the chaotic dynamics,
and evolve from material sheared from the spiral arms. We discuss                  where M disc is the mass of either the stellar or gas disc and  is the
the formation of branches in more detail in Section 4.1.4.                         corresponding surface density. We calculate the Fourier amplitudes
   Finally, it has been noted in some observations that there may be               over annuli of the disc, between Rout and Rin . Using cylindrical
an oval distortion in the inner region of M51 (Pierce 1986; Tosaki                 coordinates, R is the distance from a point to the centre of mass of
et al. 1991; Zaritsky, Rix & Rieke 1993). An oval region is apparent               the galaxy, and θ is the angle which subtends to the centre of mass,
in our simulations at r ≈ 1 kpc, with aspect ratio 2:1.                            measured anticlockwise round the galaxy. We did not perform any
                                                                                   rotational transformations prior to obtaining the Fourier transforms
                                                                                   – the galaxy is still inclined with respect to the line of sight.
4.1.2 The structure of the disc with a higher fraction of warm gas,                   We show the amplitude of the modes versus time in Fig. 9 for
and with cold gas                                                                  the whole of the disc (taking R in = 0 kpc and R out = 10 kpc).
                                                                                   The amplitudes of the modes increase during the interaction, and as

                                                                                                                                                                   Downloaded from http://mnras.oxfordjournals.org/ by guest on July 16, 2015
We focus our analysis on model A, presented in Fig. 4 since this
                                                                                   expected, the m = 2 mode is the dominant mode. However, the m =
was the most stable, with less fragmentation and few sink particles
                                                                                   2 mode is not substantially higher than the other modes, particularly
forming. However, before discussing this model in more detail, we
                                                                                   at later times. For the gas, there is even less difference between the
first describe the structure in models B and C.
                                                                                   m = 2 and other modes. This comes about because the azimuthal
   In addition to our main model, we also ran calculations with
                                                                                   distribution of the gas density is very spiky (Fig. 11).
10 per cent warm gas (model B) and 0.1 per cent cold gas (model
                                                                                      In Fig. 10, we plot the amplitudes versus time at different radii
C). The model with 10 per cent warm gas represents a more re-
                                                                                   in the disc. Here, we take annuli of width 2 kpc, about 3, 5 and
alistic gas fraction for the galaxy. However, both models B and
                                                                                   10 kpc. We only show the amplitudes for the stars, but the gas
C were considerably less stable, and formed many more sink par-
                                                                                   shows similar behaviour. From this figure, it is evident that the m =
ticles. Consequently, it was not possible (or appropriate) to run
                                                                                   2 spiral structure takes longer to develop at smaller radii. This might
these calculations for as long. We show the structure of the disc at
                                                                                   be due to radial propagation, or it might be because the strength of
180 Myr for these two simulations, as well as the case with 1 per
                                                                                   the tidal forces decreases strongly with radius (note that for the R =
cent warm gas (model A) in Fig. 8. The structure for both mod-
                                                                                   10 kpc plot, the Fourier amplitudes are not particularly meaningful
els with warm (104 K) gas is very similar (left-hand and middle
                                                                                   at later times since the companion is located within 10 kpc). From
panels). This is perhaps not that surprising as Qg for both models
                                                                                   viewing a movie of the stellar distribution, there is no obvious break
is fairly high. There are some small differences – the spurs are
                                                                                   in the stellar arms with time. This suggests that the tidal interaction is
more compact, presumably because the gas is less gravitationally
                                                                                   solely responsible for the inner structure, in agreement with Toomre
stable (and in fact unlike model A, the spurs tend to contain sink
                                                                                   (1977) and Salo & Laurikainen (2000b). For the gas, however, the
particles). There is generally more local collapse in the model with
                                                                                   main spiral arms are not always continuous, and it is possible (at
10 per cent warm gas and consequently 32 sink particles have
                                                                                   earlier times) to have shorter sections of spiral arms in the inner
formed at this point. The final panel in Fig. 8 (right-hand panel)
                                                                                   disc overlapping the main tidally induced spiral arms.
shows the disc with 0.1 per cent 100 K gas. As expected, there is
                                                                                      The lack of a dominant m = 2 mode is surprising, given that the
much more fragmentation than in the models with warm gas. Again
                                                                                   column density plots (Figs 4 and 5) show an obvious two-armed
widespread collapse occurs in the disc, and after 180 Myr, 184 sink
                                                                                   spiral pattern, both in the gas and stars. However, this does appear
particles have formed.

Figure 8. The column density of the gas disc is shown for the three models A, B and C. The figures show cases where 1 (left-hand panel), 10 (middle panel)
and 0.1 per cent (right-hand panel) of the disc is gas, by mass. The temperature of the gas is 104 K in the left-hand and middle panels, and 100 K in the
right-hand panel. The time of the simulation for each panel is 180 Myr. Similar to Fig. 4 sink particles are not shown, only the point mass which represents the
galaxy NGC 5195.


C   2010 The Authors. Journal compilation
                                          C 2010 RAS, MNRAS 403, 625–645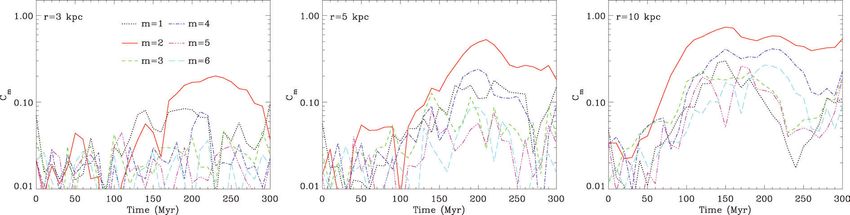
634        C. L. Dobbs et al.
                                                                                       to agree with recent observations (Kendall et al., in preparation),
                                                                                       where the amplitude of the m = 2 mode is around 0.2–0.3, and the
                                                                                       other modes 0.1. Elmegreen et al. (1989) found slightly higher
                                                                                       amplitudes, between 0.1 and 1 for the m = 2 mode, but still the
                                                                                       amplitude of the m = 4 mode is not significantly less than m = 2
                                                                                       (and actually higher at small radii).
                                                                                          In addition to the Fourier amplitudes, we show azimuthal profiles
                                                                                       of the density in Fig. 11. We determine the mass averaged volume
                                                                                       density (ρ) over an annulus of width 1 kpc, divided into 64 sections
                                                                                       azimuthally. The figure shows the density at times of 120, 180, 240
                                                                                       and 300 Myr. At 120 Myr, the interaction is still at an early stage, so
                                                                                       as expected there is no obvious two-armed pattern, though Fig. 11
                                                                                       and the column density plot (Fig. 4, top middle) indicate that there
                                                                                       is one prominent spiral arm in the gas, due to the interaction. The
                                                                                       density profiles generally show that the arms are considerably more
                                                                                       peaked than sinusoidal curves. In some cases (e.g. r = 5 kpc, at
                                                                                       180 Myr or r = 3 kpc at 300 Myr), there is also a considerable
                                                                                       degree of substructure in the gas. Furthermore, the main arms may
                                                                                       be of unequal densities (e.g. r = 5 kpc, 240 Myr) and not necessarily
                                                                                       symmetric. As we remarked above, this explains the relatively low

                                                                                                                                                                  Downloaded from http://mnras.oxfordjournals.org/ by guest on July 16, 2015
                                                                                       amplitude of the m = 2 mode in relation to the other modes.

                                                                                       4.1.4 Origins of substructure and spurs
                                                                                       The later part of this paper focuses predominantly on comparisons
                                                                                       with observations, but beforehand we briefly consider the origins
                                                                                       of spurs and branches which lie between the main spiral arms. As
                                                                                       mentioned in the introduction, gaseous spurs could be due to pertur-
                                                                                       bations in the underlying stellar disc, or occur as GMCs experience
                                                                                       shear when they leave the spiral arms. Numerical simulations of
                                                                                       grand design spirals have largely neglected the first hypothesis, as
                                                                                       they have assumed an underlying stellar potential, rather than incor-
Figure 9. The spiral mode amplitudes are shown for the whole of the
                                                                                       porating a live stellar component. Alternatively, for a quasi-steady
disc versus time. The top panel is for the stellar (disc) component and the            structure driven by some fixed pattern speed, spurs can occur at
lower for the gas component. The m = 2 mode is generally highest, though               specific resonances in the disc.
surprisingly not substantially higher than the other modes, especially for the            We investigate the origins of substructure in the disc further by
gas. The reason for this is evident from Fig. 11, where it can be seen that            tracing back the gas which constitutes a large branch at the time of
although the azimuthal structure is predominantly double-peaked (m = 2),               300 Myr. Fig. 12 shows the gas at earlier times of 256 and 271 Myr.
it is sufficiently spiky, and the arms are sufficiently offset, a lot of power         At 271 Myr, the gas lies in a clump along the spiral arm, which then
in higher values of m is necessary to Fourier-decompose the azimuthal                  becomes sheared into the branch we see at 300 Myr.
distributions.                                                                            The origin of the clump in the spiral arm at 271 Myr could be due
                                                                                       to gravitational instabilities, which may potentially lead to frag-
                                                                                       mentation along the spiral arms, and in turn to spurs. However,
                                                                                       this does not appear particularly likely, first since as mentioned in

Figure 10. The spiral mode amplitudes are shown versus time at radii of 3 (left-hand panel), 5 (middle panel) and 10 (right-hand panel) kpc for the stellar
disc. There is an evident transition of the m = 2 mode inwards through the disc. At r = 10 kpc, a two armed spiral emerges between 50 and 100 Myr, but is not
induced in the central 3 kpc until after 150 Myr. As well as the m = 2 mode, all the Fourier amplitudes are seen to increase during the interaction. The spiral
modes for the gas show similar behaviour, though as for Fig. 7, the m = 2 mode is not quite as large relative to the other modes.


                                                                                 C   2010 The Authors. Journal compilation
                                                                                                                           C 2010 RAS, MNRAS 403, 625–645
Simulations of tidally induced structure in M51 635
Downloaded from http://mnras.oxfordjournals.org/ by guest on July 16, 2015
Figure 11. These panels show azimuthal plots of the stellar and gas densities at times of 120 (top), 180 (second), 240 (third) and 300 (lower) Myr. The mass
averaged density is calculated from annuli of width 1 kpc, which are positioned at 3 (left), 5 (centre) and 7 (right) kpc, and both the gaseous (solid) and stellar
(dotted) densities are shown. The azimuthal angle is calculated anticlockwise round the disc (in the direction of flow). At the earliest time, the interaction is
only commencing, so there is no dominant two armed structure. Though the gas and stellar peaks are generally correlated, which is not surprising if they are
generated by gravitational instabilities simultaneously. After 180 Myr, both the gas and stars now have two peaks. However, at the later times there tends to be
substructure in the gas which leads to multiple peaks as well as the main spiral arms.
Section 2.2.2, the gas has a relatively high Q. Moreover, as Fig. 8 smooth. Nevertheless, the gas in these models is clumpy, not be-
indicates, there is not a significant difference in structure between cause the gas is cold, but rather due to the flocculent spiral arms
the models with 1 and 10 per cent gas (A and C), implying that induced at earlier times by gravitational instabilities in the stellar
self-gravity of the gas is not regulating the structure. A second pos- and gaseous components. Thus, flocculent spiral arms merge with
sibility is cloud collisions. However, the formation of large clumps the tidally induced spiral arms to form clumps, which are then
in this manner also seems unlikely when the temperature of the gas sheared into branches or spurs, which in turn seed clumpy structure
(104 K) is high (Dobbs & Bonnell 2006), since the gas is largely in the next spiral arm.
C 2010 The Authors. Journal compilation
C 2010 RAS, MNRAS 403, 625–645636 C. L. Dobbs et al.
population (Roberts 1969; Gittins & Clarke 2004), although this
is dependent on the properties of the model, e.g. sound speed of
the gas, strength of the potential (Slyz, Kranz & Rix 2003; Dobbs
2007). Observations of CO overlaid on optical images of M51 in-
dicate such an offset for one spiral arm, though oddly for the other
they are coincident (e.g. Schinnerer et al. 2004).
In Fig. 13, we show the column density of the stars (in the disc
only), and overlay contours of the gas column density. As expected,
the stellar distribution is much smoother, and the spiral arms much
broader compared to the gas. Also shown on Fig. 13 is a K-band im-
age (which traces the old stellar population) of M51 from Hitschfeld
et al. (2009), which again shows good agreement with the stellar
distribution from our simulations. Similar to the gaseous arms, the
stellar arms in the simulations are wound slightly further than in
the observations due to adopting a too high rotation curve initially
(Section 2.2).
Fig. 13 does not indicate any obvious offset between the gas and
stars. The main departures of the gas from the stellar component
are interarm features. A similar conclusion can be drawn from
Fig. 11, which shows that the stellar and gaseous peaks tend to
Downloaded from http://mnras.oxfordjournals.org/ by guest on July 16, 2015
be coincident. Any offset between peaks of stellar and gas density
in azimuth are temporary, and tend to be localized, e.g. at R =
5 kpc, one gas arm lies downstream of the stars (higher θ) whilst
the other is essentially coincident. At 240 Myr, one arm is still
largely coincident (if anything, upstream) whilst the other has split
into two separate peaks.
We determine the offset more systematically by locating the peak
of the gas and stellar spiral arms. However, rather than use the
m = 2 Fourier amplitude, which implicitly assumes symmetric
spiral arms and the dominance of the m = 2 harmonic, we fit
Figure 12. In this figure, we focus on the formation of a large secondary Gaussians to our azimuthal density profiles. As can be seen from
spiral arm, or branch which appears in the simulation. Gas particles are the column density plots and Fig. 11, the spiral arms may often be
selected from the branch, and then shown at two earlier time frames (left) asymmetric. We took density profiles over annuli of width 1 kpc,
whilst all the gas in the locality is shown on the right-hand column density
similar to those shown in Fig. 11. We used a routine in Numerical
plots. The branch originates from a clump of dense gas in the spiral arm
Recipes (Press et al. 1992) to fit a function of the form
which gets sheared in the interarm region. This in turn originates from
substructure in the disc.
θ − B1 2 θ − B2 2
ρ(θ) = A1 exp − + A2 exp − + A3 ,
A third option is that the clumpy structure along the spiral arms C1 C2
is associated with compressive tidal forces (Renaud et al. 2008),
which could account for structure at predominantly larger radii, a (3)
possibility that we will address in a later paper.
√ by A1 and√
with the amplitudes of the spiral arms given A2 , the offsets
by B1 and B2 and the dispersions by C1 / 2 and C2 / 2.
4.1.5 Comparison of spurs with M51 The position of the spiral arms is shown versus radius in Fig. 14,
for the gas and stars at five different times during the interaction.
The surface densities of spurs in the 1 and 10 per cent warm We took annuli from 1–8 kpc, but at the innermost radius, it was
gas models are 10−3 and 10−2 g cm−2 , respectively, or 4.5 and often impossible to fit the distribution to two peaks, indicating that
45 M pc−2 . The surface densities of spurs seen in M51 are in our model the spiral structure was not strongly induced at such
∼50 M pc−2 (Corder et al. 2008). Thus, the features found in small radii. The error bars in Fig 14 correspond to the width of
our 10 per cent gas model are approaching the surface densities of the Gaussian peak for each arm. In nearly all cases, the stellar and
spurs in M51, although the surface densities are deliberately low in gaseous spiral arms are coincident within the error bars, and, in
our models to avoid gravitational collapse. particular, at the present-day time of 300 Myr. Had we used the
errors of the fit instead, the error bars would have been smaller,
typically about one third the size shown in Fig. 14. At most time
4.2 Stellar spiral arms and the offset between stars and gas
frames, however, the two types of arms would still coincide within
There have been numerous studies of the offset between different the smaller errors.
tracers in M51 (e.g. Tilanus & Allen 1989; Rand & Kulkarni 1990; Kinks in the positions of the gaseous spiral arms are either due to
Petit et al. 1996; Patrikeev et al. 2006). The CO is typically seen a sharp dip in the spiral amplitude between the inner and outer parts
upstream of Hα, and the offset interpreted as the time for stars to of the annulus, which results in an overestimate of the azimuthal
form (Tamburro et al. 2008). Density wave theory, i.e. the assump- angle of the peak, or occur where the spiral arm bifurcates. There
tion that the stellar arms rotate more slowly than the gas, predicts is a slight tendency for the shock to be upstream of the stellar arms
that the CO should also be upstream of the underlying old stellar at smaller radii and downstream at larger radii. However, if anything,
C 2010 The Authors. Journal compilation
C 2010 RAS, MNRAS 403, 625–645Simulations of tidally induced structure in M51 637
the location of the shock oscillates upstream and downstream (as
typically found in the grand design galaxies studied by Kendall
2009, including M51) and, moreover, the offsets are typically too
small to be very meaningful.
4.3 Pattern speeds of the spiral arms
One of the implicit assumptions in Lin-Shu density wave theory
is that the spiral arms have a coherent pattern which rotates at a
fixed pattern speed. However, recent observations by Meidt et al.
(2008) have been unable to find a single pattern speed; rather they
assign different pattern speeds to different radii. In an attempt to
retain some contact with density wave theory, they suggest that
there may be multiple spiral arm modes in the disc, but also agree
that their results can be explained by a winding pattern. The most
obvious interpretation of their results is the latter, and even more
simply, that there is no global pattern speed. This can be seen from
our simulations, e.g. by comparing the galaxy at times of 180 and
300 Myr (Fig. 17), where it is evident that the spiral arms are visibly
winding up.
Downloaded from http://mnras.oxfordjournals.org/ by guest on July 16, 2015
We use the results of our Gaussian fitting to find the pattern
speed of the arms from our simulations, simply taking p = dθ /dt
at each radius R. In Fig. 15, we show the pattern speed for the stars
and gas versus radius, accompanied by a similar figure from Meidt
et al. (2008). We show the pattern speeds for each arm, as we do
not assume they are necessarily the same. Fig. 15 shows that the
pattern speed is not constant with radius. Rather the pattern speed
decreases with radius. For Fig. 15, we calculate the pattern speed
between times of 180 and 300 Myr. Taking 240 to 300 Myr produces
a similar result but with larger error bars. We note that our pattern
speeds agree roughly with those determined by Meidt et al. (2008),
lying between 25 and 50 kpc km s−1 compared to 50 kpc km s−1 at
radii between 2 and 4 kpc and 25 kpc km s−1 between 4 and 5 kpc.
Egusa et al. (2009) also measure a pattern speed of 30 kpc km s−1 .
In the simulations, the pattern speed of one arm starts relatively flat,
then drops at 4.5 kpc, corresponding again to the kink observed in
Fig. 5.
5 C O M PA R I S O N W I T H O B S E RVAT I O N S
OF DENSITY AND VELOCITY
In this section, we make a comparison between our results and some
of the analyses presented in Shetty et al. (2007). Shetty et al. (2007)
note some discrepancies between their observations and density
wave theory, in particular, large circular and radial velocities. We
follow the procedures outlined in Shetty et al. (2007) for analysing
M51. They show plots of column density on a log R versus azimuth
space, and fit straight lines to the spiral arms, which assumes an
underlying shape of the arms to be that of a equiangular spiral.
They then plot velocity against an angle ψ, where ψ is the angle
extending from a spiral arm.
We first assessed whether there was a warp in the disc, as Shetty
et al. (2007) include the position angle in their analysis. However,
Figure 13. The column density for the stellar disc is shown for the model
although our disc shows a slight warp (see Fig. 16), we considered
with 1 per cent warm gas at times of 180 (top) and 300 (middle) Myr.
Contours of gas column density are overlaid. The lower panel shows a K- it would make little difference to our results, at least in the central
band image of M51, indicating the old stellar population, from Hitschfeld parts of the disc.
et al. (2009). The black lines represent symmetric logarithmic spirals fitted
to 12 CO data by Shetty et al. (2007). Credit: Hitschfeld et al., A&A, 495,
5.1 R − θ plots of spiral arms
795, 2009, reproduced with permission C ESO.
In Fig. 17, we show the column density of gas (left-hand panels) and
stars (right-hand panels) on a polar plot, at times of 180, 210, 240,
270 and 300 Myr. Over time, the spiral arms become shallower, in
C 2010 The Authors. Journal compilation
C 2010 RAS, MNRAS 403, 625–645You can also read