Coupling Between Nutrient Availability and Thyroid Hormone Activation
←
→
Page content transcription
If your browser does not render page correctly, please read the page content below
Please do not remove this page

Coupling Between Nutrient Availability and Thyroid
Hormone Activation
Lartey, Lattoya Josephine
https://scholarship.miami.edudiscovery/delivery/01UOML_INST:ResearchRepository/12355257170002976?l#13355470680002976

Lartey, L. J. (2016). Coupling Between Nutrient Availability and Thyroid Hormone Activation [University of
Miami].
https://scholarship.miami.edu/discovery/fulldisplay/alma991031447139202976/01UOML_INST:ResearchReposi
tory

Open
Downloaded On 2020/08/20 08:02:15

Please do not remove this page
                             UNIVERSITY OF MIAMI


       COUPLING BETWEEN NUTRIENT AVAILABILITY AND THYROID HORMONE
                               ACTIVATION


                                          By

                              Lattoya Josephine Lartey


                                 A DISSERTATION


                                Submitted to the Faculty
                              of the University of Miami
                     in partial fulfillment of the requirements for
                         the degree of Doctor of Philosophy

                                Coral Gables, Florida


                                      May 2016
               ©2015
       Lattoya Josephine Lartey
         All Rights Reserved
                      UNIVERSITY OF MIAMI

               A dissertation submitted in partial fulfillment of
                      the requirements for the degree of
                             Doctor of Philosophy

       COUPLING BETWEEN NUTRIENT AVAILABILITY AND
              THYORID HORMONE ACTIVATION

                            Lattoya Josephine Lartey

Approved:

________________                                    _________________
Antonio C. Bianco, M.D., Ph.D.                      Fulvia Verde, Ph.D.
Professor of Medicine                               Associate Professor Molecular
Rush University Medical Center                      and Cellular Pharmacology

________________                                    _________________
Kerry Burnstein, Ph.D.                              Sandra Lemmon, Ph.D.
Professor of Molecular                              Professor of Molecular and
and Cellular Pharmacology                           Cellular Pharmacology

________________                                    _________________
Christian Faul, Ph.D.                              Joyce Slingerland, M.D.,Ph.D.
Research Associate Professor                       Professor of Medicine
of Medicine

                                                    ___________________
                                                    Guillermo Prado, Ph.D.
                                                     Dean of the Graduate School
LARTEY, LATTOYA JOSEPHINE                   (Ph.D., Molecular and Cellular Pharmacology)
Coupling Between Nutrient Availability                                        (May 2016)
and Thyroid Hormone Activation

Abstract of a dissertation at the University of Miami.

Dissertation supervised by Professor Antonio C. Bianco.
Number of pages in text (70)

       Thyroid hormone is essential for metabolism, growth, development and cognitive

function. Thyroid hormone is secreted in two forms, the biologically active 3,5,3’-

triiodothyronine (T3) and the inactive thyroxine (T4) that must be converted to T3 in

order to gain biological activity. This reaction is catalyzed by type II deiodinase (D2), a

thioredoxin-fold containing selenoenzyme; its activity plays an essential role in thyroid

hormone activation.

       The thyroid gland is regulated by the hypothalamic-pituitary-thyroid (HPT) axis.

It responds to food availability via leptin induction of thyrotropin releasing hormone

(TRH) in the hypothalamus and thyroid stimulating hormone (TSH) in the pituitary.

These actions stimulate the production and secretion of T3 and T4 from the thyroid. This

current work describes the exciting new finding that food availability also activates

thyroid hormone action via the induction of D2 as measured, in part, through the

conversion of T4 to T3. Herein, we have characterized the mechanism whereby D2 is

activated via insulin/IGF-1 signaling through the PI3K-mTORC2-Akt pathway.

       To understand how nutritional signals affect D2 expression and activity, we

studied mouse skeletal muscle and a mesothelioma cell line (MSTO-211H) and show that

D2 is transcriptionally upregulated during the transition from fasting to refeeding or upon
switching from 0.1 to 10% FBS, respectively. The underlying mechanism is the

transcriptional de-repression of DIO2 through the activation of the mTORC2 signaling

pathway, since lentiviral knockdown of rictor abrogates this effect. Forkhead box O1

(FOXO1), a downstream target of mTORC2, transcriptionally represses DIO2; this was

determined using its specific inhibitor AS1842856 and through adenoviral infection of

constitutively active FOXO1. These results were confirmed by ChIP studies in MSTO-

211H cells indicating that within 4h of exposure to 10% FBS-containing media, FOXO1

binding to the DIO2 promoter markedly decreases and the DIO2 promoter is activated.

Studies using the insulin-receptor FOXO1 KO mouse indicate that insulin is a key

signaling molecule in this process. Similar results were found using IGF-1 as a stimulant.

This study concludes that FOXO1 represses DIO2 during fasting and DIO2 de-repression

is stimulated by nutritional activation of the PI3K-mTORC2-Akt-FOXO1 pathway.

       Through these studies, we have been able to characterize a novel mechanism of

D2 regulation that is both locally and temporally regulated. It mechanistically describes

how the production of T3 fluctuates in response to nutritional stimuli independently of

the HPT axis. This mechanism linking thyroid hormone activation via D2 induction to

food availability describes how the body adjusts T3 production to an appropriate level in

the conditions of fasting and refeeding.
                                     DEDICATION

I dedicate this work to my mother, Jacqueline Omega Robinson, for your unwavering

belief in my abilities. Every prayer you have said on my behalf has given me the strength

to continue along this journey. Thank you for your motivation, for your encouragement

and for being my biggest cheerleader. I have worked to accomplish this goal not only for

myself, but for you and for every sacrifice that you have made to ensure that I have every

opportunity that you did not. We can celebrate this achievement together because it has

been a joint effort and without your love and support, this would not have been possible.

                                            iii
                              ACKNOWLEDGEMENTS

I am immensely grateful to GOD ALMIGHTY for without His blessings and guidance,

this study would not have been possible. I am grateful for being given the opportunity to

study GOD’s greatest creation.

I would like to thank my mother, sisters, family and friends for your prayers, support and

encouragement. Thank you for believing in me when my own faith faltered.

I would like to express my sincerest gratitude to my advisor, Antonio C. Bianco, M.D.,

Ph.D., for your guidance, support and encouragement throughout my Ph.D. study. Your

immense knowledge, dedication and passion have made you a leader in this field and it is

an honor that I have had the opportunity to study under your guidance and direction.

I would like to thank the members of my dissertation committee, Kerry Burnstein, Ph.D.,

Sandra Lemmon, Ph.D., Fulvia Verde, Ph.D., and Joyce Slingerland M.D., Ph.D., for

your guidance and encouragement throughout my Ph.D. study. Your suggestions and

thoughtful input helped widen my perspective. Thank you for your support.

I would like to thank Terry G. Unterman for providing invaluable resources that have

assisted in the completion of this project. Your insight and advice helped elucidate a

valuable component in my dissertation work.

                                            iv
I would like to sincerely thank my colleagues and lab mates for your stimulating

discussions and technical support throughout my Ph.D. study. Thank you for the

encouragement and support and for cultivating such an uplifting and friendly working

environment.

                                            v
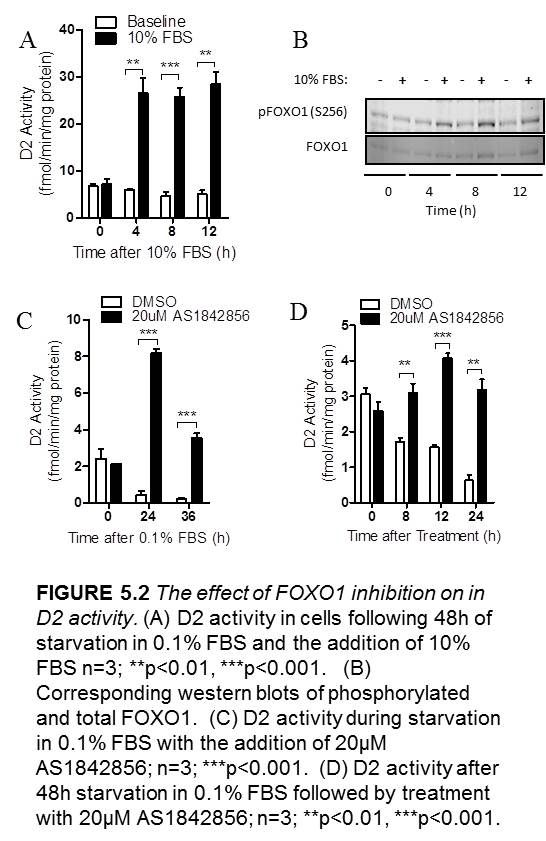
                              TABLE OF CONTENTS

LIST OF FIGURES……………………………………………………………………viii

LIST OF TABLES……………………………………………………………………….x

ABBREVIATIONS……………………………………………………………………...xi

Chapter 1. Introduction…………………………………………………………………1
      1.1 Thyroid hormone………….…………….…………………………………...1
      1.2 Thyroid hormone action…………………..…………………………………2
      1.3 Type II deiodinase…………………………………….……………………...6
      1.4 Thyroid hormone and food availability…………………...………………..8
      1.5 Insulin signaling………………………………………...…….…………….10

Chapter 2. Methods…………………………………………………………………….13
      2.1 Mice………………………………………………………………………….13
             2.1.1 Fasting/refeeding protocol in mice…………………………….…..13
             2.1.2 Blood biochemistry………………………………………………..14
             2.1.3 IR/LIRKO/LIRFKO mice………………………………………….14
      2.2 Cell Culture…………………………………………………………………14
             2.2.1 Fasting/refeeding protocol in MSTO-211H cells……………….…14
             2.2.2 Signaling pathway inhibition in MSTO-211H cells……………….15
      2.3 D2 activity assay………………….....………………………………………16
      2.4 Gene expression analysis…………………………………………………...16
      2.5 Western blot analysis……………………………………………………….17
      2.6 T4 to T3 conversion in intact cells…………………………………………18
      2.7 Lentiviral-mediated shRNA knockdown of rictor and raptor…………..19
      2.8 Adenoviral-mediated transduction of WT and CA FOXO1……………..19
      2.9 Chromatin immunoprecipitation (ChIP) of FOXO1……………………..20
      2.10 Statistical analysis…………………………………………………………20

Chapter 3. The effects of fasting and refeeding on D2 activity and expression in the
soleus muscle of mice and the MSTO-211H cell line…………………………….…...21
       3.1 Introductory remarks………………………………………………………21
       3.2 Results……………………………………………………………………….22
              3.2.1 Short-term fasting lowers soleus Dio2 expression and activity levels
              in the soleus muscle of wild type mice……………………………..……22
              3.2.2 Refeeding restores Dio2 expression and activity levels in the soleus
              muscle of fasted animals…………………………………………………24
              3.2.3 Fasting and refeeding is modeled in the MSTO-211H cell line…...25
              3.2.4 D2 activity half-life is unaffected by re-exposing MSTO-211H cells
              to 10% FBS………………………………………………………………27
              3.2.5 Insulin and IGF-1 induce D2 activity and increase T3 production in
              MSTO-211H cells………………………………………………………..28
       3.3 Summary…………………………………………………………………….30

                                           vi
Chapter 4. Insulin/IGF-1/FBS stimulates D2 activity via PI3K-dependent
pathways...........................................................................................................................32
4.1 Introductory remarks………………………………………………………32
4.2 Results……………………………………………………………………….35
4.2.1 The inhibition of PI3K prevents the FBS and insulin-mediated
stimulation of D2 activity in MSTO-211H cells………………………...35
4.2.2 The inhibition of Akt prevents the FBS and insulin-mediated
stimulation of D2 activity in MSTO-211H cells………………………...37
4.2.3 The inhibition of mTOR prevents the FBS and insulin-mediated
stimulation of D2 activity in MSTO-211H cells………………………...39
4.2.4 The inhibition of mTORC1 signaling delays but does not prevent the
induction of D2 activity in MSTO-211H cells…………………………..40
4.2.5 The inhibition of mTORC2 signaling prevents the FBS and insulin-
mediated stimulation of D2 activity in MSTO-211H cells………………43
4.3 Summary…………………………………………………………………….44
Chapter 5. FOXO1 transcriptionally represses DIO2………………………………..46
5.1 Introductory remarks………………………………………………………46
5.2 Results……………………………………………………………………….48
5.2.1 The effect of a liver specific knock out of the insulin receptor on
Dio2 expression………………………………………………………….48
5.2.2 The effect of FOXO1 inhibition on D2 activity……………………49
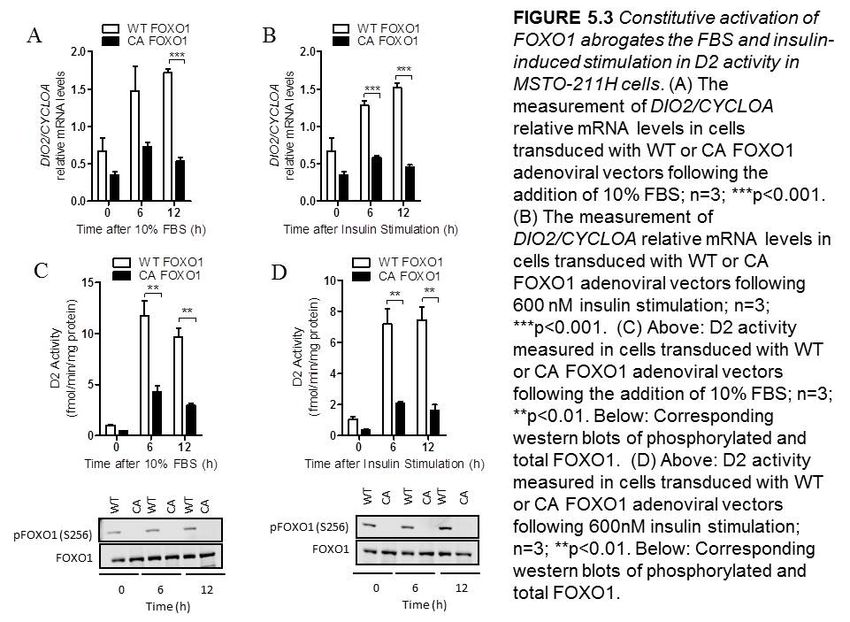
5.2.3 Constitutive activation of FOXO1 abrogates the FBS and insulin-
induced stimulation in D2 activity in MSTO-211H cells……..…………50
5.2.4 FOXO1 binds to the DIO2 promoter during starvation and is
released upon re-exposure to 10% FBS.………...……………………….52
5.3 Summary…………………………………………………………………….53
Chapter 6. Discussion…………………………………………………………………..54
6.1 General conclusions…………….…………………………………………..54
6.2 Clinical implications………………………………………………………..58
6.2.1 Hypothyroidism……………..……………………………………..58
6.2.1 Insulin resistance………..………………………………………….59
6.3. Future directions…………………………………………………………...59
6.4 Concluding remarks…………………………….………………………….60
REFERENCES………………………………………………………………………….62
vii
LIST OF FIGURES
Figure 1.1 Structural formulas of thyroid hormones and related compounds…………….1
Figure 1.2 The hypothalamus-pituitary-thyroid (HPT) axis………………………………2
Figure 1.3 Nuclear action of thyroid hormone…………………………………………….4
Figure 1.4 Deiodinase mediated metabolism of the iodothyronines………………………5
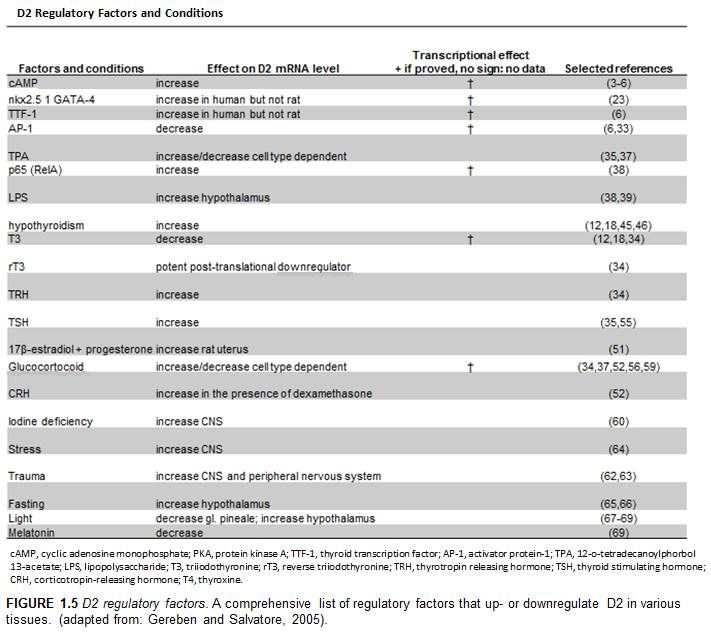
Figure 1.5 D2 regulatory factors and conditions………………………………………….7
Figure 1.6 D2 regulatory pathways………………………………………………………..7
Figure 1.7 The mTOR signaling pathway………………………………………………..10
Figure 3.1 The effects of short term fasting on the soleus muscle of mice……………...23
Figure 3.2 The effects of refeeding on the soleus muscle of mice………………………24
Figure 3.3 Fasting and refeeding is modeled in the MSTO-211H cell line……………...26
Figure 3.4 The response of MSTO-211H cells to FBS…………………………………..26
Figure 3.5 D2 half-life measured in MSTO-211H cells…………………………………28
Figure 3.6 The effects of insulin and IGF-1 on D2 activity and T3 production…………30
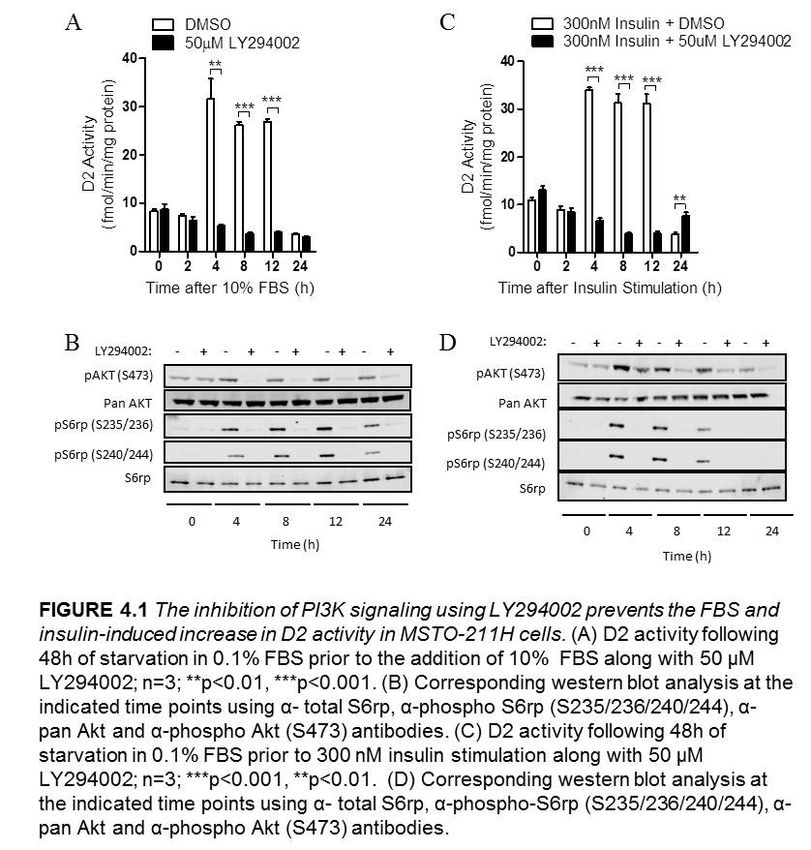
Figure 4.1 The inhibition of PI3K signaling using LY294002 prevents the FBS and
insulin-induced increase in D2 activity in MSTO-211H cells……………………….......36
Figure 4.2 The inhibition of PI3K signaling using Wortmannin prevents the FBS and
insulin-induced increase in D2 activity in MSTO-211H cells…………………………...37
Figure 4.3 The inhibition of Akt signaling using GSK690693 prevents the FBS and
insulin-induced increase in D2 activity in MSTO-211H cells………………………......38
Figure 4.4 The inhibition of mTOR signaling using PP242 prevents the FBS and insulin-
induced increase in D2activity…………………………………………………………...39
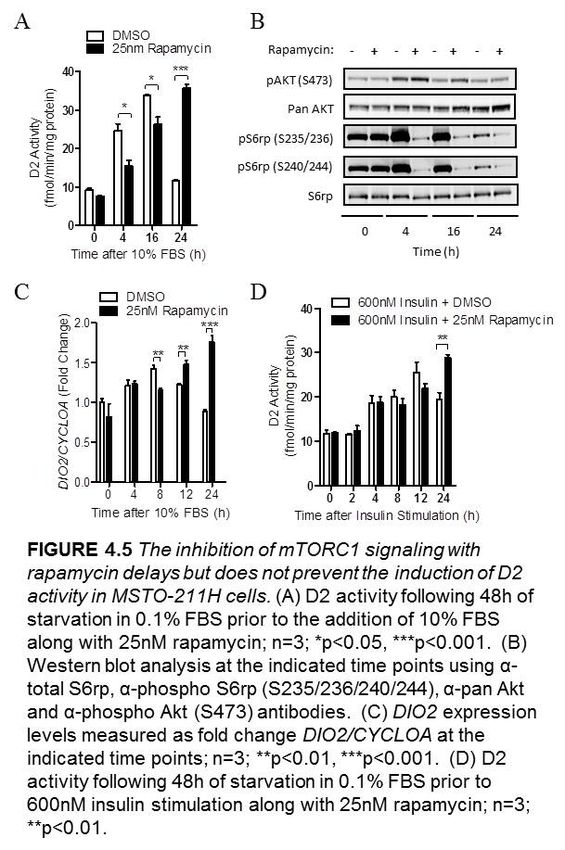
Figure 4.5 The inhibition of mTORC1signaling with rapamycin delays but does not
prevent the induction of D2 activity in MSTO-211H cells……………..……………….41
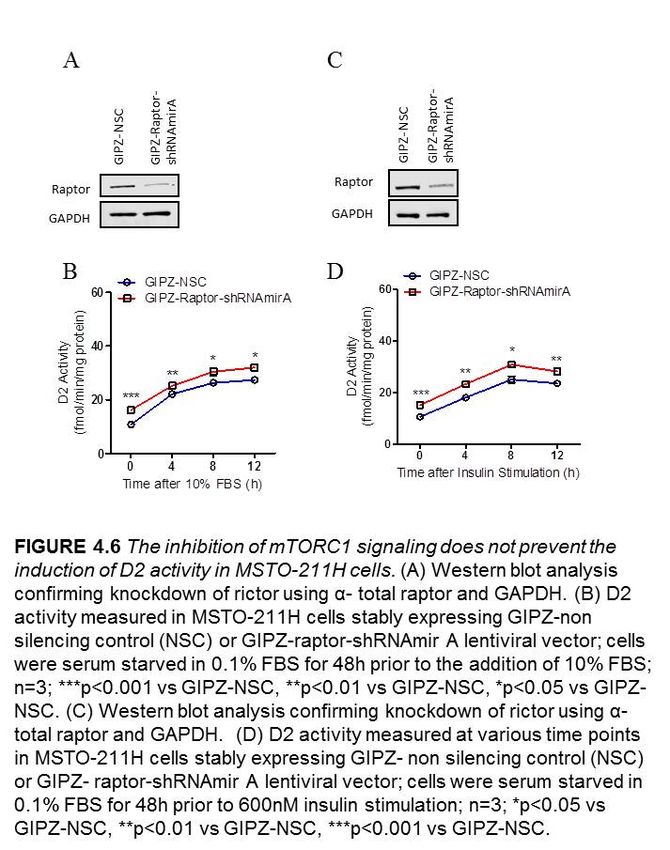
Figure 4.6 The inhibition of mTORC1signaling does not prevent the induction of D2
activity in MSTO-211H cells………………………………..…………….…………….42
viii
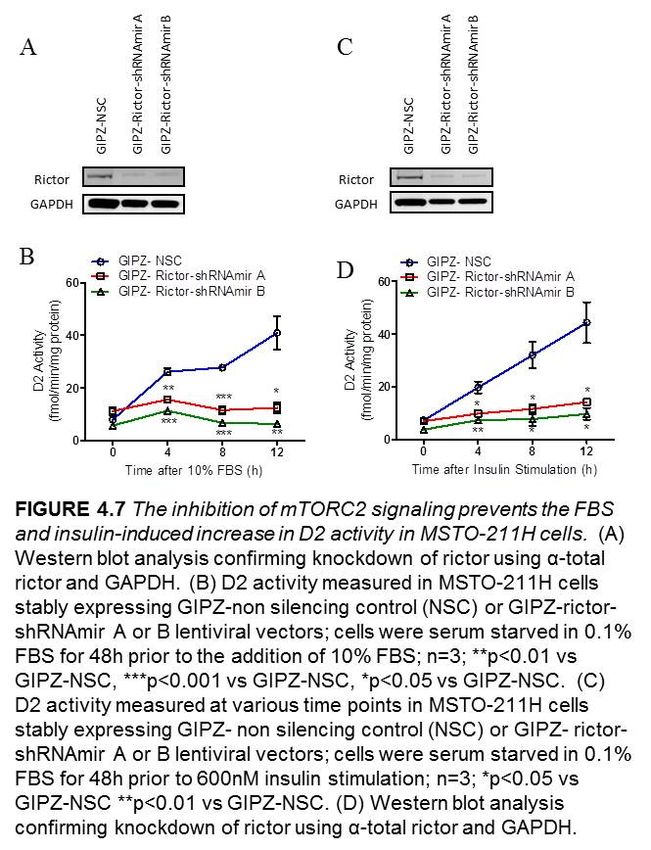
Figure 4.7 The inhibition of mTORC2 signaling prevents the FBS and insulin-induced
increase in D2 activity in MSTO-211H cells………………………..…………………...44
Figure 5.1 The liver specific knock out of the insulin receptor decreases Dio2 expression
in mice……………………………………………………………………………………48
Figure 5.2 The effect of FOXO1 inhibition on in D2 activity…………………………...50
Figure 5.3 Constitutive activation of FOXO1 abrogates the FBS and insulin-induced
stimulation of D2 activity in MSTO-211H cells………………………….……………...51
Figure 5.4 FOXO1 binds to the DIO2 promoter during starvation and is released upon re-
exposure to 10% FBS…………………………………………………………………….52
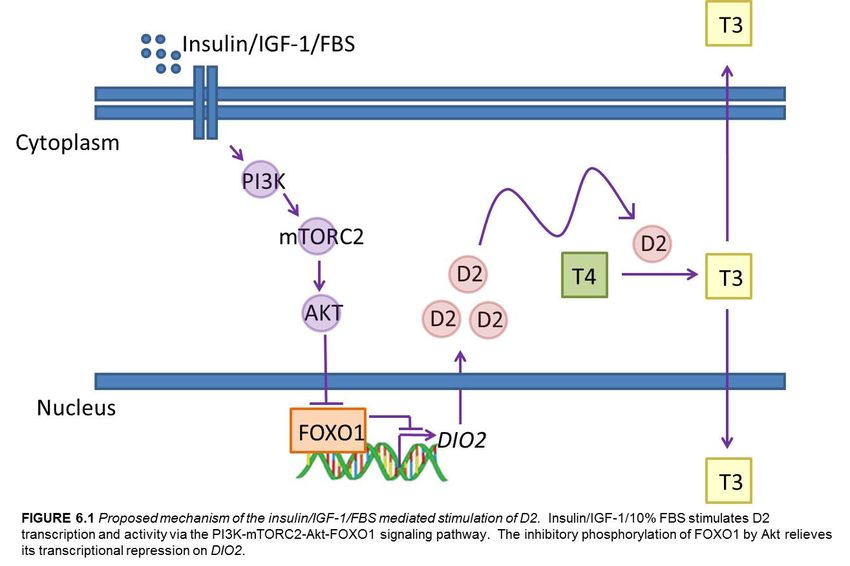
Figure 6.1 Proposed mechanism of the insulin/IGF-1/FBS mediated stimulation of D2..55
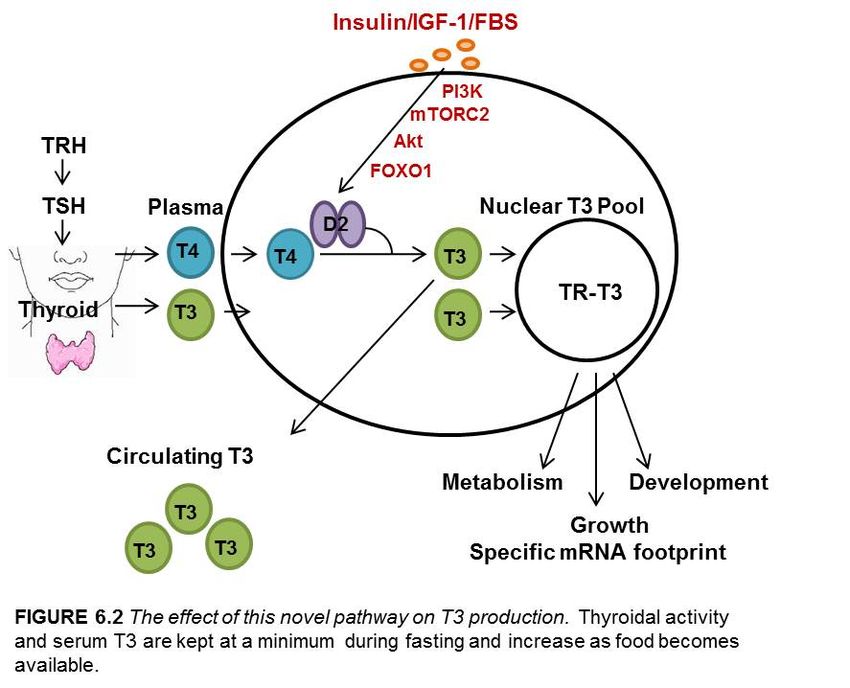
Figure 6.2 The effect of this novel pathway on T3 production………………….............60
ix
                           LIST OF TABLES

Table 1. Pharmacological inhibitors utilized…….……...……………………………….15

Table 2. Primers used for qPCR analysis………………………………………………...17

Table 3. Primary antibodies used for western blotting…………………………………..18

                                  x
                              ABBREVIATIONS

Akt         protein kinase B
BAT         brown adipose tissue
CA          constitutively active
ChIP        chromatin immunoprecipitation
CHX         cyclohexamide
CO2         carbon dioxide
CPM         counts per minute
DIT         diiodotyrosine
DMSO        dimethyl sulfoxide
DTT         dithiothreitol
D1          type I deiodinase
D2          type II deiodinase
D3          type III deiodinase
EDTA        ethylenediaminetetraacetic acid
FBS         fetal bovine serum
FOXO        family of forkhead box ‘other’ transcription factors
HPT         hypothalamus-pituitary-thyroid axis
IGF-1       insulin-like growth factor 1
IGF-1R      insulin like growth factor receptor 1
IR          insulin receptor
LIRKO       liver-specific insulin receptor knock-out
LIRFKO      liver-specific insulin receptor/FOXO1 double knock-out
MCT8        monocarboxylate transporter 8
MCT10       monocarboxylate transporter 10
MIT         monoiodotyrosine
MOI         multiplicity of infection
MSTO-211H   mesothelioma cell line
mTOR        mammalian target of rapamycin
mTORC       mTOR complex
NSC         non silencing control
OATP        organic anion transporting polypeptide family
PE          PBS EDTA buffer
PI3K        phosphatidylinositol-4,5-bisphosphate 3-kinase
PKC         protein kinase C
RAPTOR      regulatory-associated protein of mammalian target of rapamycin
RICTOR      rapamycin-insensitive companion of mTOR
RXR         retinoid-X receptor
S6K         ribosomal S6 kinase
TRs         thyroid hormone receptors
TRH         thyrotropin releasing hormone
TSH         thyroid stimulating hormone
TRE         thyroid hormone response element
TRX         thioredoxin
T3          3,5,3’-triiodothyronine, thyroid hormone

                                        xi
T4     thyroxine
WT     wild type
4EBP   4-(eIF4E) binding proteins

                                    xii
                                 Chapter 1. Introduction

1.1 Thyroid hormone

       Thyroid hormone acts on nuclear thyroid hormone receptors (TRs) to control the

transcription of genes that modulate processes required for normal growth, development,

cognitive function and metabolic function (Brent 2012, Mullur, Liu et al. 2014). Thyroid

hormone is produced in and secreted from the thyroid gland. Synthesis of thyroid

hormone occurs when iodide from the circulation is transported into the thyroid; in a

series of oxidative coupling reactions, iodine is incorporated into tyrosine residues of the

thyroglobulin molecule to form iodotyrosines, monoiodotyrosine (MIT) or diiodotyrosine

(DIT). These hormonally inactive intermediates are coupled through oxidation to form

thyroid hormone. The fusion of one MIT molecule with one DIT molecule or of two DIT

molecules produces thyroid hormone in two forms, 3,5,3’-triiodothyronine (T3) or

thyroxine (T4) (Fig. 1.1), respectively (Larsen and Ingbar 1992). T4 is the major

secretory product of the thyroid and serves as an inactive precursor of T3; outside of the

                                              1
2


thyroid parenchyma, T4 can be activated to T3 to gain biological activity (Bianco and

Kim 2006).

       This process of thyroid hormone production and secretion is controlled by the

hypothalamus-pituitary-thyroid (HPT) axis. Originating in the paraventricular nucleus of

the hypothalamus, thyrotropin releasing hormone (TRH) is secreted in the median

eminence and acts on the anterior pituitary gland to stimulate the release of thyroid

stimulating hormone (TSH). TSH acts on follicular cells in the thyroid gland to stimulate

the synthesis and release of T4 and T3 (Mullur, Liu et al. 2014) (Fig. 1.2). Both thyroid

hormones signal back to the hypothalamus and pituitary to negatively regulate the

secretion of TRH and TSH (Fekete and Lechan 2014).

1.2 Thyroid hormone action

       The response of a particular cell to T3 is mediated by various factors including the

transmembrane transport of thyroid hormone via thyroid hormone transporters, the
3


expression of nuclear thyroid hormone receptors (TR’s), and the levels of deiodinase

expression (Brent 2012, Warner and Mittag 2012). Specific thyroid hormone transporters

such as monocarboxylate transporter 8 (MCT8), monocarboxylate transporter 10

(MCT10), and organic anion transporting polypeptide family (OATP’s), are required for

uptake of T4 and T3 into the cell (van der Deure, Peeters et al. 2010). Their location and

distribution on T3 target tissues regulate the cell response to thyroid hormone.

       T3 diffuses into the nucleus of the target cell and controls gene transcription by

binding to nuclear TRs thereby modulating biological processes in the body (Brent 2012).

TRs belong to the steroid/thyroid hormone receptor superfamily of ligand-dependent

transcription factors and are located on the promoter regions of T3 target genes at sites

containing thyroid hormone response elements (TRE’s) (Brent 2012). There are two TR

genes, TRα and TRβ, resulting in different TR isoforms with varying degrees of tissue

distribution and expression levels (Brent 2012). They function as heterodimers with

retinoid-X receptors (RXR). Without T3, corepressors bind to the TR complex preventing

gene transcription. However, upon the binding of T3 to the TR, coactivators replace the

corepressors and gene transcription is initiated (Fig. 1.3). Therefore, the levels of TR

occupancy determine the extent of intracellular T3 activity. T3 responsive genes are

commonly involved in development, differentiation and metabolism and differ based on

the gene expression profile of a particular cell type or tissue.
4


       Intracellular T3 activation and deactivation is also regulated by the action of

iodothyronine deiodinases (~29-33 kDa), a family of dimeric thioredoxin (TRX) fold-

containing selenoproteins consisting of types I, II, and III deiodinases (hereby referred to

as D1, D2, and D3, respectively) (Callebaut, Curcio-Morelli et al. 2003). These enzymes

share approximately 50% sequence homology and catalyze the reductive dehalogenation

of iodothyronines. The deiodinases belong to a family of 25 selenoproteins containing

the rare selenocysteine (Sec) amino acid. The deiodinases are integral membrane

proteins, however, their cellular locations differ; the expression and activity levels of the

deiodinases are temporal and tissue specific which allow for cellular customization of a

T3 footprint (Bianco and Kim 2006, Gereben, Zavacki et al. 2008). D3 is located in the

plasma membrane and nucleus and its active center is located in the cytosol; it is

primarily expressed in the central nervous system, placenta, skin, uterus and the brain (Jo,

Kallo et al. 2012). It serves to inactivate T3 by the removal of an iodine residue from the

inner tyrosyl ring of the phenolic iodothyronine forming rT3 from T4 or T2 from T3. D2
5


is located in the endoplasmic reticulum with its active center located in the cytosol; it is

primarily expressed in the central nervous system, hypothalamus, pituitary, thyroid,

brown adipose tissue and skeletal muscle (Larsen and Zavacki 2012). D2 activates the

prohormone, T4 to the active T3 molecule through the removal of an iodine residue from

the outer phenolic ring of the iodothyronine. D1, located in the plasma membrane and its

active center is in the cytosol; it is primarily found in the liver, kidney and thyroid. D1

has dual functions and is able to either activate T4 to T3 or convert rT3 to T2 by the

removal of an outer ring iodine or inactivate T4 and T3 by inner ring deiodination to

produce rT3 and T2, respectively (Fig. 1.4) (Zavacki, Ying et al. 2005, Bianco and Kim

2006). Based on kinetic studies, D2 is thought to be the main T4 activating enzyme,

while D1 is thought to have a scavenger role mainly deiodinating conjugated

iodothyronines in process of elimination (Arrojo e Drigo and Bianco 2011). Therefore,
6


due to the deiodinase-mediated local activation of thyroid hormone, serum T3 levels are

not always reflective of the state of T3 target tissues.

1.3 Type II deiodinase

       Various mechanisms regulate D2 in a temporal and tissue specific manner

including intracellular mediators such as cAMP (Bartha, Kim et al. 2000, Canettieri, Celi

et al. 2000), transcription factors such as Nkx-2.5 and GATA-4 in the human heart

(Dentice, Morisco et al. 2003), hormones such as T3 (Kim, Harney et al. 1998), and post

translational factors such as ubiquitination (Gereben, Goncalves et al. 2000) (Fig. 1.5,

Fig. 1.6). Physiologically, D2 plays a role in the hypothalamic-pituitary feedback, it is

required for thermogenesis in BAT, and it provides a source of plasma T3 (Larsen and

Zavacki 2012). Because D2 is able to increase intracellular thyroid hormone production

thereby expanding the nuclear T3 pool, understanding pathways that control D2 are

relevant for tissues involved in energy expenditure and metabolism such as brown

adipose tissue and skeletal muscle (Bianco and McAninch 2013).
7
8


       Previous studies in floating rat brown adipocytes have shown that insulin

increases D2 activity in a concentration dependent manner (Mills, Barge et al. 1987).

Additionally, studies also indicate that rats injected with insulin have increased D2

activity in the BAT (Silva and Larsen 1986). Since insulin is an indicator of

food/nutrient availability in the body, this suggests that D2 may be affected by nutrient

availability in the BAT. However, studies have yet to be conducted to determine the

mechanism of D2 regulation in response to insulin and/or nutrient availability.

1.4 Thyroid hormone and food availability

       In the adult, alterations in thyroid hormone levels primarily affect energy

expenditure and metabolic processes which manifest as changes in the rate of metabolism

(Bianco and McAninch 2013). In humans, the thyroid contributes approximately 20% of

the daily T3 production and the remaining 80% is contributed by the two deiodinases, D1

and D2, with the latter playing the major role (Bianco, Salvatore et al. 2002). A major

condition in which thyroid hormone plays a role is in fasting and/or caloric restriction

(LoPresti, Gray et al. 1991). In this state, there is a reduction in energy expenditure, a

decline in leptin and decreases in plasma insulin and T3 levels (LoPresti, Gray et al.

1991, Rosenbaum, Murphy et al. 2002, Chan, Heist et al. 2003). These effects correlate

with the downregulation of the HPT axis that contribute to the decreased serum T3.

Leptin, an adipocyte-derived hormone, has been shown to be a key factor stimulating the

HPT axis (Boelen, Wiersinga et al. 2008). The drop in serum leptin alters the

neuroendocrine response to fasting by suppressing the preproTRH gene in the neurons of
9


the paraventricular nucleus of the hypothalamus resulting in a decrease in TRH and

consequently thyroid hormone (Legradi, Emerson et al. 1997, Boelen, van Beeren et al.

2012). However, upon refeeding , thyroid hormone levels are restored as seen in patients

recovering from anorexia nervosa (Schebendach, Golden et al. 1997).

         Both thyroid hormone and deiodinase expression levels are affected by fasting in

animal models and in human subjects. In rats, in vivo kinetic studies indicate that

reduced serum T3 levels during fasting are a result of decreased thyroid hormone

secretion (Kinlaw, Schwartz et al. 1985). The expression of D3 accelerates thyroid

hormone inactivation in multiple tissues, as well as increased sulfation and

glucuronidation of T3in the liver (Vella, Ramadoss et al. 2011). Additionally, hepatic D1

is decreased during fasting, a result of its sensitivity to T3 (Zavacki, Ying et al. 2005).

Recent studies in mice have shown that in fasting, D2 is reduced in the pituitary and BAT

but is unaffected in the cerebrum, cerebral cortex and hypothalamus (Galton, Hernandez

et al. 2014). Finally, studies of human muscle biopsies taken from fasting subjects

indicate that D2 mRNA decreases with fasting and is increased after insulin infusion

(Heemstra, Soeters et al. 2009). However, studies have yet to define a specific

mechanism for the action of D2 during fasting. Therefore, due to D2’s ability to

contribute to intracellular T3 activation and consequent contribution to serum T3 levels,

we aim to understand the mechanism regulating D2 in the skeletal muscle during fasting

and refeeding.
10


1.5 Insulin signaling

       To study the mechanistic regulation of D2 in the skeletal muscle during fasting

and refeeding, we turned our attention to insulin, an indicator of nutrient/food availability

and a major effector of skeletal muscle that decreases during fasting. Insulin is a

multifunctional protein that stimulates cell growth and differentiation, stimulates

lipogenesis, glycogen and protein synthesis and increases glucose uptake in the fat and

muscle. The insulin receptor belongs to a subfamily of receptor tyrosine kinases that

include the insulin-like growth factor (IGF)-1 receptor and the insulin receptor-related

receptor (IRR) (Saltiel and Kahn 2001). These receptors exist as homo- or heterodimers

that become autophosphorylated upon the binding of insulin, which stimulates a signaling
11
cascade (Nakae, Kido et al. 2001). Insulin exerts its affects through various nutrient
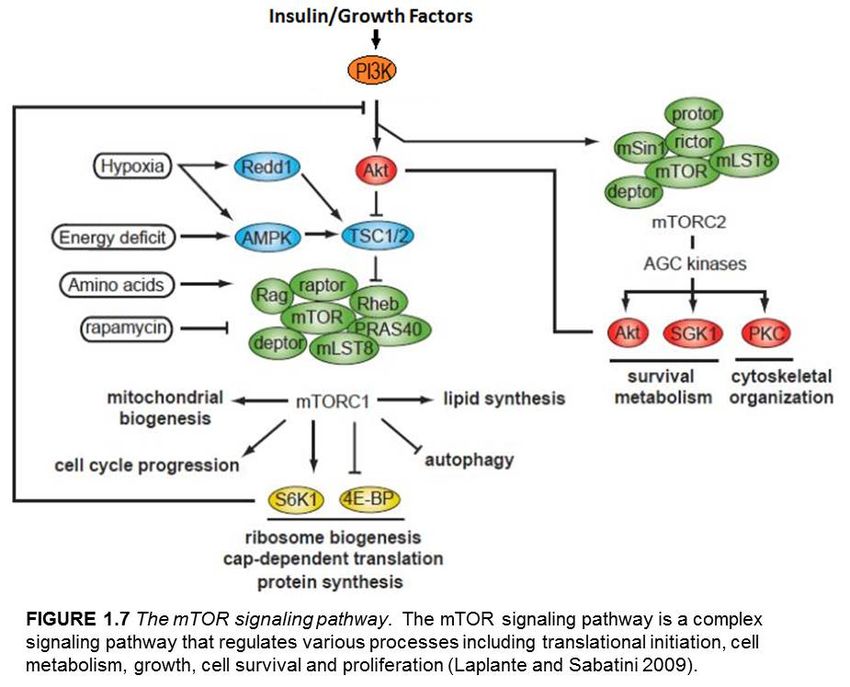
sensing pathways, one of these being the mTOR signaling pathway. The mTOR
signaling pathway is a complex network that regulates various processes including
translational initiation, cell metabolism, growth, cell survival and proliferation through
the PI3K/mTOR pathway (Laplante and Sabatini 2009, Laplante and Sabatini 2009,
Agulnik 2012) (Fig. 1.7). MTOR is a 289-kDa Ser/Thr kinase that is the catalytic core of
two distinct multi component complexes, mTOR complex 1 (mTORC1) and mTOR
complex 2 (mTORC2) (Wander, Hennessy et al. 2011). Numerous studies have linked
mTORC1 to protein synthesis and growth (Thoreen, Chantranupong et al. 2012) and to
the downstream activation of a myriad of metabolic regulatory genes including HIF-1α
and SREBP1/2 (Duvel, Yecies et al. 2010). MTORC2 phosphorylates the AGC kinases
and mediates cell survival and proliferation through phosphorylation of its downstream
effector, Akt (Su and Jacinto 2011). It also phosphorylates PKCα to affect cytoskeleton
arrangement (Ma and Blenis 2009).
Our understanding of the role of insulin during fasting and the regulation of D2 in
the skeletal muscle during fasting led to the hypothesis that D2 may be a downstream
target of insulin and the mTOR signaling pathway. If proven true, this would implicate
mTOR signaling as a major mediator of metabolic pathways linking nutrient availability
and the modulation of thyroid hormone action. Therefore, the aim of this current work is
to examine the regulation of thyroid hormone activation via D2 stimulation during fasting
and refeeding through an examination of the mTOR signaling pathway. The goals of this
work are to:
12


       1. Determine how D2 is affected by fasting and refeeding in vivo and in vitro.

       2. Determine if the mTOR signaling pathway affects D2 expression and activity.

       3. Determine the transcriptional mechanism responsible for the insulin stimulated

          increase of D2 activity.

       In exploring these aims, we have identified that D2 is transcriptionally upregulated by

insulin/IGF-1 and signals through the PI3K-mTORC2-Akt pathway to phosphorylate

FOXO1 and relieve its negative repression on the DIO2 promoter. This novel mechanism

links nutritional availability to thyroid hormone activation- a plausible connection as

thyroid hormone regulates various aspects of metabolism, many aspects of which are

directly affected by nutrient status. Through these novel studies, we have elucidated a

new role for mTOR signaling as well as a novel regulatory mechanism for D2. The

findings from this work have been published in The Journal of Biological Chemistry

(Lartey, Werneck-de-Castro et al. 2015).
                                      Chapter 2. Methods

2.1 Mice

All studies performed were approved by the Institutional Animal Care and Use

Committee by the University of Miami in compliance with the National Institutes of

Health Standards. Male, 3-month old C57BL/6J mice (Jackson Laboratory) were housed

at room temperature (22°C) on a 12h dark/light cycle. Mice were randomly divided into

3 groups (control, fasting, refeeding) (n=7) and acclimatized for 5 days. Animals were

fed ad libitum with standard chow diet (3.5kcal/g, 28.8% protein, 58.5% carbohydrate,

12.7% fat; 5010 LabDiet laboratory autoclavable rodent diet; PMI Nutrition, Richmond,

IN) and water.

2.1.1 Fasting/refeeding protocol in mice

As indicated, food was withdrawn at 21:00h for the fasting and refeeding groups. After

36h, control and fasted mice were sacrificed by asphyxiation in a CO2 chamber. Mice

from the refeeding group were weighed, refed for an additional 8h and sacrificed. The

soleus muscle and cerebral cortex were rapidly dissected and frozen in liquid nitrogen

and stored at -80°C until analysis.

                                              13
14


2.1.2 Blood biochemistry

Blood was collected by cardiac puncture and plasma stored at -80°C until analysis.

Insulin was measured using Mouse Insulin ELISA (Mercodia, AB) per manufacturer’s

instruction.

2.1.3 IR/LIRKO/LIRFKO mice

As indicated, freely feeding 11 week old male insulin receptor (IR) floxed, liver-specific

IR knockout (LIRKO) and liver specific IR/FOXO1 double knockout (LIRFKO) mice (I,

Zhang et al. 2015) were used as well. They were sacrificed by decapitation following

brief sedation with isofluorane. The liver was rapidly dissected and frozen in liquid

nitrogen and stored at -80°C until analysis.

2.2 Cell culture

       MSTO-211H cells were purchased from American Type Culture Collection (Manassas,

VA) and cultured in humidified atmosphere with 5% CO2 at 37° C, in RPMI 1640 from

CellGro (Manassas, VA) supplemented with FBS 10% and 100nM sodium selenite

(Curcio, Baqui et al. 2001, Arrojo e Drigo, Fonseca et al. 2011).

2.2.1 Fasting/refeeding protocol in MSTO-211H cells

For starvation assays, cells were serum starved for 48h in 0.1% FBS (Atlanta Biologicals,

Flowery Branch, GA) containing medium. For exposure to 10% FBS assays, cells were
15


serum starved for 48h in 0.1% FBS containing medium and then re-exposed to 10%

containing FBS medium. For insulin stimulation assays, cells were serum starved for 48h

in 0.1% FBS containing medium and then re-exposed to 300 or 600nM insulin (Sigma-

Aldrich, St. Louis, MO) supplemented in 0.1% FBS containing medium. For IGF-1

stimulation assays, cells were serum starved for 48h in 0.1% FBS containing medium and

then re-exposed to 50ng/mL IGF-1 (Sigma-Aldrich, St. Louis, MO) supplemented in

0.1% FBS containing medium.

2.2.2 Signaling pathway inhibition in MSTO-211H cells

When indicated, cells were serum starved for 48h in 0.1% FBS prior to treatment with

various inhibitors:

Table 1. Pharmacological inhibitors utilized

       Inhibitor      Company        Biochemical/Physiological Action      Concentrati
                                                                               on
LY294002           Sigma-Aldrich    Specific cell permeable                50µM
                                    phosphatidylinositol 3-kinase
                                    inhibitor.
Wortmannin         Sigma-Aldrich    Membrane permeable hydrophobic         100nM-1µM
                                    fungal metabolite that selectively
                                    inhibits phosphoinosidite 3-kinase.
GSK690693          Sigma-Aldrich    An ATP competitive, potent pan-        10nM
                                    AKT inhibitor against Akt 1,2 and 3.
PP242              Sigma-Aldrich    A potent and selective mTOR            2µM
                                    inhibitor targeting the ATP domain
                                    of mTOR.
Rapamycin          Sigma-Aldrich    A macrocyclic triene antibiotic with   25nM
                                    potent immunosuppressive and
                                    anticancer activity; complexes with
                                    FKBP12 to bind and inhibit the
                                    mTORC1.
AS1842856          EMD Millipore    A cell-permeable                       20µM
                                    oxodihydroquinoline that
16


                                                      preferentially inhibits the
                                                      transcriptional activity of FOXO1
                                                      via direct binding to the active
                                                      FOXO1.
MSTO-211H cells were treated with inhibitors at the concentration listed above.

2.3 D2 activity assay

For the measurement of D2 activity in MSTO-211H cells, harvested cells were re-

suspended in DPBS containing 1 mM EDTA (PE), 0.25M sucrose and 10 mM

dithiothreitol (DTT). Cells were sonicated and lysates analyzed for protein concentration

via Bradford assay (Bio-Rad Laboratories). 25µg of total protein was incubated for 1h at

37°C in the presence of 20mM DTT, 0.1nM T4 and 100K cpm 125I-T4 (Perkin Elmer Life

and Analytical Sciences, Inc.- NEX111H500UC). Assays were stopped with the addition

of horse serum and 50% trichloroacetic acid and free 125I was counted on the 2470

automatic γ-counter Wizard2 (Perkin Elmer) in duplicates as previously described

(Werneck-de-Castro, Fonseca et al. 2015). For the measurement of D2 activity in the

soleus muscle, the assay was performed with the following modifications: protease

inhibitor cocktail (Roche) was added before sonication and 200 µg of total protein was

incubated for 3h at 37°C in the presence of 20mM DTT, 1mM PTU, 0.5 nM T4 and

200K cpm 125I-T4.

2.4 Gene expression analysis

RNA was extracted from MSTO-211H cells or animal tissue using RNAqueous- Micro

Kit (Life Technologies Inc.) or RNeasy Mini Kit (Qiagen), respectively. RNA was
17


quantified with a NanoDrop and reverse transcribed using High Capacity cDNA (Applied

Biosystems) or First Strand cDNA Kit for RT-PCR (AMV) Kit (Roche). Genes of

interest were measured by qPCR (BioRad iCycler iQ Real-Time PCR Detection System)

using the iQ SYBR Green Supermix (BioRad) or qPCR (Applied Biosystems Step One

Plus Real-Time PCR System) using the SYBR Green FastMix ROX (Quanta

Biosciences). Relative quantitation was measured using the standard curve method and

the iCycler or Step One Plus software. Primer sequences are provided below:

Table 2. Primers used for qPCR analysis

         Gene Name                 Gene                             Primer Sequence
                               Abbreviation
Mouse Type II                 Dio2                       F: 5’- TCCTAGATGCCTACAAACAGGTTA- 3’
Deiodinase                                               R: 5’-GTCAGGTGGCTGAACCAAAG-3’
Mouse CycloA                  CycloA                     F: 5’-GCCGATGACGAGCCCTTG-3’
                                                         R: 5’-TGCCGCCAGTGCCATTATG-3’
Mouse RNA                     RNApolII                   F: 5’-ATGTGCAGGAAACATGACCG-3’
Polymerase II                                            R: 5’-GCCCACATGAAACACAGGTT-3’
Mouse TATA                    Tbp                        F: 5’-ACCCTTCACCAATGACTCCTATG-3’
Binding Protein                                          R: 5’-ATGATGACTGCAGCAAATCGC-3’
Human Type II                 DIO2                       F: 5’-GGCTGACCGCATGGACAATAA-3’
Deiodinase                                               R: 5’-GCTACCCCGTAAGCTATGTG-3’
Human CycloA                  CYCLOA                     F: 5’-GGCAAATGCTGGACCCAACAC-3’
                                                         R: 5’-TGCCATTCCTGGACCCAAAGC-3’
All primers were made using Invitrogen Custom Primers.

2.5 Western blot analysis

       Cells/tissues were lysed in 0.25M sucrose PE containing 10mM DTT. The lysates were

diluted with 4X sample loading buffer (Invitrogen) and 5-25µg of total protein were run

on 4-12% NuPAGE Bis-Tris Gels (Life Technologies, Carlsbad, CA). Samples were

transferred to Immobilon-FL PVDF transfer membrane (Millipore, Billerica, MA) and
18


probed with primary antibodies as indicated at a 1:1000 dilution overnight at 4°C. Next,

membranes were incubated with fluorescently labeled secondary antibodies (LiCOR

Biosciences, Lincoln, NE) at a 1:2500 dilution for 1h at room temperature. All blots were

imaged using LiCOR Odyssey instrument per manufacturer’s instructions (LiCOR

Biosciences, Lincoln, NE). Primary antibodies used are provided below:

Table 3. Primary antibodies used for western blotting

Primary Antibody                    Company                     Dilution       Isotype/Source
p-S6rp (S235/236)                Cell Signaling               1:1000         Rabbit
p-S6rp (240/244)                 Cell Signaling               1:1000         Rabbit
S6rp                             Cell Signaling               1:1000         Mouse IgG
p-Akt (S473)                     Cell Signaling               1:1000         Rabbit IgG
p-Akt (T308)                     Cell Signaling               1:1000         Rabbit IgG
Pan Akt                          Cell Signaling               1:1000         Rabbit IgG
p-4EBP1                          Cell Signaling               1:1000         Rabbit IgG
4EBP1                            Cell Signaling               1:1000         Rabbit IgG
Rictor                           Cell Signaling               1:1000         Rabbit IgG
Raptor                           Cell Signaling               1:1000         Rabbit IgG
p-FOXO1                          Cell Signaling               1:1000         Rabbit
FOXO1                            Cell Signaling               1:1000         Rabbit IgG
GAPDH                            GeneTex                      1:1000         Rabbit
Antibodies were used and diluted according to manufacturer’s instructions.

2.6 T4 to T3 conversion in intact cells

       The production of T3 from outer ring-labeled T4 in intact cells was analyzed by

measuring 125I in the medium as described elsewhere (da-Silva, Harney et al. 2007)

except that the assay was stopped 12h after addition of 125I-T4 and the free T4

concentration was 30 pM.
19


2.7 Lentivirus-mediated shRNA knockdown of rictor and raptor

Rictor and raptor knockdown were established by transduction with GIPZ lentiviral

shRNAmir vectors in MSTO-211H cells using GIPZ lentiviral shRNAmir for non-

silencing control (NSC), human rictor (clone ID. V2LHS_120392 and clone ID.

V3LHS_367492) or human raptor (clone ID. V3LHS_636800) from Thermo Scientific

(Lafayette, CO). For generation of stable knockdown cell lines, MSTO-211H cells were

plated at 1.5 x 10⁵ cells/well and transduced with lentiviral particles at a multiplicity of

infection (MOI) of ~23 and ~15 for rictor, respectively, and an MOI of ~13 for raptor and

diluted in 1mL of serum free RPMI containing 8ug/mL polybrene (Sigma Aldrich). After

6h, 1mL of complete RPMI was added to each well (6-well plates). 72h later, the

transfection cocktail was replaced with complete medium containing puromycin

(1ug/mL) to select for shRNA expressing cells. Stable cell lines were generated after

puromycin selection for 7 days.

2.8 Adenoviral-mediated transduction of WT and CA FOXO1

Adenoviral particles expressing wildtype (WT) and constitutively active (CA) FOXO1 as

described (Zhang, Patil et al. 2006) were used to generate transient transfections for WT

and CA FOXO1 in MSTO-211H. Cells were plated at 2.5 x 10⁵ cells/well in 6-well

dishes and transduced with adenoviral particles of concentration 2.0 x 10¹⁰PFU/mL and

1.8 x 10¹⁰PFU/mL, respectively, that was diluted in 1mL of serum free RPMI. Complete
20


media containing 10% FBS was added after 6h and the media was changed again after

24h. At 48h, cells were re-fed or stimulated with insulin for experimental procedure.

2.9 Chromatin immunoprecipitation (ChIP) of FOXO1

ChIP was performed in MSTO-211H cells using EZ-ChIP Chromatin

Immunoprecipitation Kit (EMD Millipore) according to the manufacturer’s guidelines.

Primers for RT-qPCR (Applied Biosystems Step One Plus Real-Time PCR System) were

designed for predicted FOXO1 binding sites in the DIO2 promoter region: forward, 5’-

CTGTCTGGAGGAACTTGGATTT -3’, and reverse, 5’-

CCATGACTCCAACCCTTTGT-3’ and performed using the SYBR Green FastMix ROX

(Quanta Biosciences). α-FKHR (H-128) (Santa Cruz Biotechnology) was used to detect

binding of FOXO1 to the DIO2 promoter and ChIP enrichment is reported as input

percent.

2.10 Statistical analysis

All data were analyzed using PRISM software (GraphPad Software) and expressed as

mean ± SEM. The Student’s t test was used to compare two groups. One-way analysis of

variance (ANOVA) was used to compare more than two groups. Significance was held at

p
       Chapter 3. The effects of fasting and refeeding on D2 activity and expression in the
                      soleus muscle of mice and the MSTO-211H cell line

3.1 Introductory remarks

             Numerous metabolic changes occur when transitioning from the fed to fasting

state that elicit a myriad of intracellular biochemical interactions. In the fed state, the

primary goals of the body are to maintain glucose homeostasis, to promote the storage of

fuels and to synthesize proteins. These goals are achieved through the secretion of

insulin from the β-cells of the pancreas, the stimulation of glycogen synthesis, the uptake

of glucose by the muscle and adipose tissue and the acceleration of glycolysis. During

fasting there is a decrease in insulin secretion which mobilizes hepatic glycogen and

glucose secretion. These alterations in metabolic processes serve to optimize energy

utilization and conserve energy (Berg, Tymoczko et al. 2002).

             In humans, fasting results in changes along the HPT axis in addition to alterations

in thyroid hormone action and signaling in the periphery. It is marked by a decrease in

serum T3, an increase in serum rT3 and minor or no change in serum T4 (Chan, Heist et

al. 2003, Boelen, Wiersinga et al. 2008). The production of rT3 from T4 (Fig. 1.4) serves

to decrease cellular metabolism and alleviate the energetic burden in a fasted state

(Martinez, Sonanez-Organis et al. 2013). TRH and TSH decrease due to diminished

leptin secretion which serves to transcriptionally decrease the expression of preproTRH

in the paraventricular nucleus of the hypothalamus (Legradi, Emerson et al. 1997,

Boelen, van Beeren et al. 2012). In rodents, fasting decreases serum T4 and T3 levels

                                                 21
22


and affects the expression of hepatic thyroid hormone responsive genes indicative of

altered T3 content and action on a tissue specific basis (Carr, Seelig et al. 1983, Galton,

Hernandez et al. 2014).

       Since the iodothyronine deiodinases mediate T3 production in a tissue specific

manner, we sought to examine the mechanistic role of D2 during fasting. Previous

studies have shown that in fasted rodents, Dio2 expression increases in the hypothalamus

(Diano, Naftolin et al. 1998) yet decreases in the pituitary (Boelen, Kwakkel et al. 2006)

indicating that there is likely a tissue specific response to fasting. To our knowledge,

there is yet to be an examination of the effects of fasting and refeeding on Dio2

expression and activity in the skeletal muscle; this is important given this tissue

contribution to plasma T3. Thus, in our fist experiments, we sought to examine the

effects of fasting and refeeding on Dio2 expression and activity levels in the soleus

muscle of mice.

3.2 Results

3.2.1 Short-term fasting lowers soleus Dio2 expression and activity levels in the soleus

muscle of wild type mice

       To assess the role of D2 in fasting, wild type mice were subjected to a 36h fast

and provided with water ad libitum. Measurement of body weight before and after the

fasting period resulted in a ~5-fold decrease in change in body weight (Fig. 3.1A).

Serum insulin levels significantly decreased in comparison to control animals (Fig. 3.1B),
You can also read