Stimulus-dependent relationships between behavioral choice and sensory neural responses
←
→
Page content transcription
If your browser does not render page correctly, please read the page content below
RESEARCH ARTICLE

                                     Stimulus-dependent relationships
                                     between behavioral choice and sensory
                                     neural responses
                                     Daniel Chicharro1,2*, Stefano Panzeri1†, Ralf M Haefner3†*
                                     1
                                      Neural Computation Laboratory, Center for Neuroscience and Cognitive
                                     Systems@UniTn, Istituto Italiano di Tecnologia, Rovereto, Italy; 2Department of
                                     Neurobiology, Harvard Medical School, Boston, United States; 3Brain and Cognitive
                                     Sciences, Center for Visual Science, University of Rochester, Rochester, United
                                     States

                                     Abstract Understanding perceptual decision-making requires linking sensory neural responses
                                     to behavioral choices. In two-choice tasks, activity-choice covariations are commonly quantified
                                     with a single measure of choice probability (CP), without characterizing their changes across
                                     stimulus levels. We provide theoretical conditions for stimulus dependencies of activity-choice
                                     covariations. Assuming a general decision-threshold model, which comprises both feedforward and
                                     feedback processing and allows for a stimulus-modulated neural population covariance, we
                                     analytically predict a very general and previously unreported stimulus dependence of CPs. We
                                     develop new tools, including refined analyses of CPs and generalized linear models with stimulus-
                                     choice interactions, which accurately assess the stimulus- or choice-driven signals of each neuron,
                                     characterizing stimulus-dependent patterns of choice-related signals. With these tools, we analyze
                                     CPs of macaque MT neurons during a motion discrimination task. Our analysis provides preliminary
*For correspondence:                 empirical evidence for the promise of studying stimulus dependencies of choice-related signals,
Daniel_Chicharro@hms.harvard.        encouraging further assessment in wider data sets.
edu (DC);
ralf.haefner@rochester.edu (RMH)
†
    Co-senior authors
                                     Introduction
Competing interests: The
                                     How perceptual decisions depend on responses of sensory neurons is a fundamental question in sys-
authors declare that no
                                     tems neuroscience (Parker and Newsome, 1998; Gold and Shadlen, 2001; Romo and Salinas,
competing interests exist.
                                     2003; Gold and Shadlen, 2007; Siegel et al., 2015; van Vugt et al., 2018; O’Connell et al., 2018;
Funding: See page 25                 Steinmetz et al., 2019). The seminal work of Britten et al., 1996 showed that responses from single
Received: 02 January 2020            cells in area MT of monkeys during a motion discrimination task covaried with behavioral choices.
Accepted: 06 April 2021              Similar activity-choice covariations have been found in many sensory areas during a variety of both
Published: 07 April 2021             discrimination and detection two-choice tasks (see Nienborg et al., 2012; Cumming and Nienborg,
                                     2016, for a review). Identifying which cells encode choice, and how and when they encode it, is
Reviewing editor: Kristine Krug,
University of Oxford, United
                                     essential to understand how the brain generates behavior based on sensory information.
Kingdom                                  With two-choice tasks, Choice Probability (CP) has been the most prominent measure
                                     (Britten et al., 1996; Parker and Newsome, 1998; Nienborg et al., 2012) used to quantify activity-
   Copyright Chicharro et al. This
                                     choice covariations. Although early studies (Britten et al., 1996; Dodd et al., 2001) explored poten-
article is distributed under the
                                     tial dependencies of the CP on the stimulus content, no significant evidence was found of a CP stim-
terms of the Creative Commons
Attribution License, which           ulus dependency. Accordingly, it has become common to report for each neuron a single CP value
permits unrestricted use and         to quantify the strength of activity-choice covariations. This scalar CP value has been typically calcu-
redistribution provided that the     lated either only from trials with a single, non-informative stimulus level (e.g. Dodd et al., 2001;
original author and source are       Parker et al., 2002; Krug et al., 2004; Wimmer et al., 2015; Katz et al., 2016; Wasmuht et al.,
credited.                            2019), or by pooling trials across stimulus levels (so-called grand CP [Britten et al., 1996]) under the

Chicharro et al. eLife 2021;10:e54858. DOI: https://doi.org/10.7554/eLife.54858                                                       1 of 39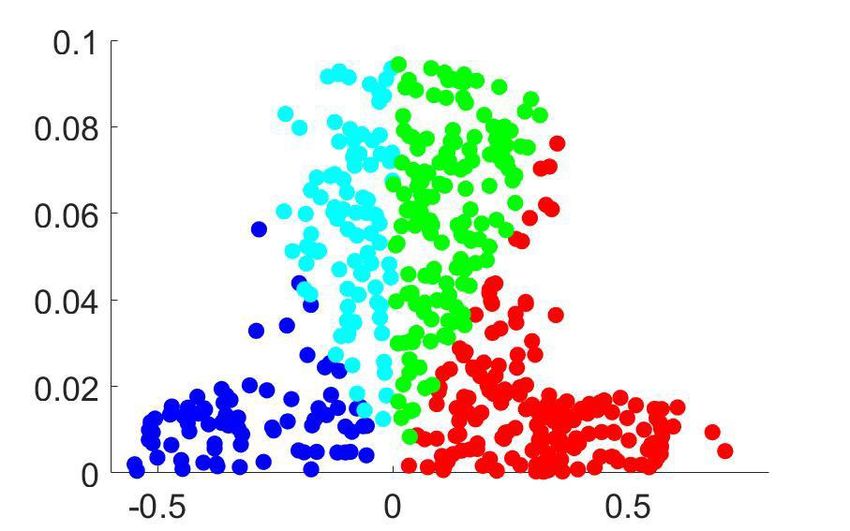
Research article                                                                                                      Neuroscience

                                    assumption that choice-related neural signals are separable from stimulus-driven responses (e.g.
                                    Verhoef et al., 2015; Pitkow et al., 2015; Smolyanskaya et al., 2015; Bondy et al., 2018). Alterna-
                                    tively, a single CP is sometimes obtained simply averaging CPs across stimulus levels (e.g. Cai and
                                    Padoa-Schioppa, 2014; Latimer et al., 2015; Liu et al., 2016). Even when activity-choice covaria-
                                    tions are modeled jointly with other covariates of the neural responses using Generalized Linear
                                    Models (GLMs) (Truccolo et al., 2005; Pillow et al., 2008), the stimulus level and the choice value
                                    are also usually used as separate predictors of the responses (Park et al., 2014; Runyan et al.,
                                    2017; Scott et al., 2017; Pinto et al., 2019; Minderer et al., 2019).
                                        This focus on characterizing a neuron by a single CP value is mirrored in the existing theoretical
                                    studies. Existing theoretical results rely on a standard feed-forward model of decision making in
                                    which a neural representation of the stimulus is converted by a threshold mechanism into a behav-
                                    ioral choice (Shadlen et al., 1996; Cohen and Newsome, 2009b; Haefner et al., 2013) assuming a
                                    single, zero-signal stimulus level, and hence ignoring stimulus dependencies of CPs. Furthermore, so
                                    far no analytical mechanistic model accounts for feedback contributions to activity-choice covaria-
                                    tions known to be important empirically (Nienborg and Cumming, 2009; Cumming and Nienborg,
                                    2016; Bondy et al., 2018).
                                        The main contribution of this work is to extend CP analysis reporting a single CP value for each
                                    cell to a more complete characterization of within-cell patterns of choice-related activity across stim-
                                    ulus levels. First, we extended the analytical results of Haefner et al., 2013 to the general case of
                                    informative stimuli and to include both feedforward and feedback sources of the covariation
                                    between the choice and each cell. Our results predict that CP stimulus dependencies can appear in
                                    a cell-specific way because of stimulus-dependencies of cross-neuronal correlations. We show that
                                    they can also appear for all neurons because of the transformation of the neural representation of
                                    the stimulus into a binary choice, if the decision-making process relies on a threshold mechanism (or
                                    threshold criterion) to convert a continuous decision variable into a binary choice. Second, we devel-
                                    oped two new analytical methods (a refined CP analysis and a new generalized linear model with
                                    stimulus-choice interactions) with increased power to detect stimulus dependencies in activity-choice
                                    covariations. Our new CP analysis isolates within-cell stimulus dependencies of activity-choice cova-
                                    riations from across-cells heterogeneity in the magnitude of the CP values, which may hinder their
                                    detection (Britten et al., 1996). Third, we applied this analysis framework to the classic dataset of
                                    Britten et al., 1996 containing recordings from neurons in visual cortical area MT and found evi-
                                    dence for our predicted population-level threshold-induced dependency but also additional interest-
                                    ing cell-specific dependencies. We found consistent results on the existence of stimulus-choice
                                    interactions in neural activity both with our refined CP analysis and using generalized linear models
                                    with interaction terms. Finally, we show that main properties of the additional dependencies found
                                    can be explained modeling the cross-neuronal correlation structure induced by gain fluctuations
                                    (Goris et al., 2014; Ecker et al., 2014; Kayser et al., 2015; Schölvinck et al., 2015), which have
                                    been shown to explain a substantial amount of response variability in MT visual cortex (Goris et al.,
                                    2014).

                                    Results
                                    We will first present the analysis of a theoretical model of how informative stimuli modulate choice
                                    probabilities. We will then analyze MT visual cortex neuronal responses from Britten et al., 1996,
                                    applying new methods developed to quantify stimulus-dependent activity-choice covariations with
                                    CPs and GLMs. This analysis provides preliminary empirical evidence in support of using these new
                                    methods for studying stimulus dependencies of activity-choice covariations.

                                    A general account for choice-related neural signals in the presence of
                                    informative stimuli
                                    In a two-choice psychophysical task, such as a stimulus discrimination or detection task, a neuron is
                                    said to contain a ‘choice-related signal’, or ‘decision-related signal’ when its activity carries informa-
                                    tion about the behavioral choice above and beyond the information that it carries about the stimulus
                                    (Britten et al., 1996; Parker and Newsome, 1998; Nienborg et al., 2012). The interpretation of
                                    choice-related signals in terms of decision-making mechanisms is however difficult. Much progress in
                                    our understanding of their meaning has relied on using models to derive mathematically the

Chicharro et al. eLife 2021;10:e54858. DOI: https://doi.org/10.7554/eLife.54858                                                        2 of 39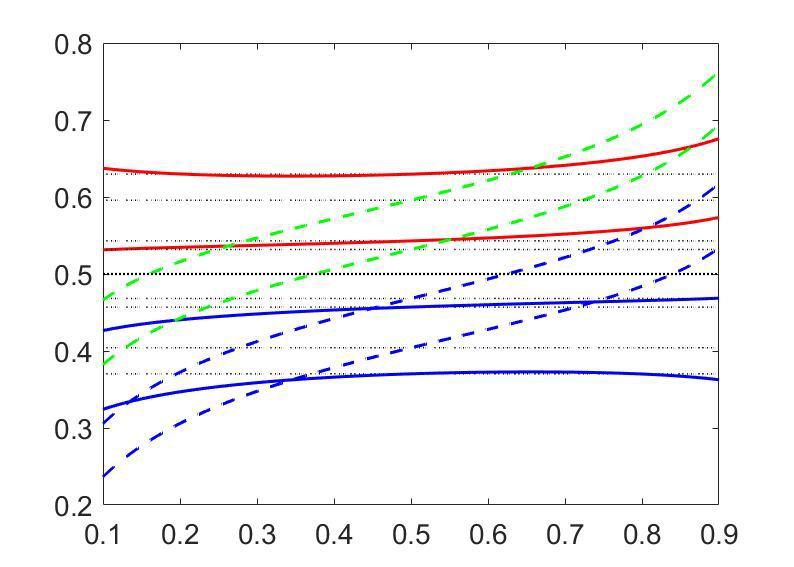
Research article                                                                                                    Neuroscience

                                    relationship between the underlying decision-making mechanisms and different measures of activity-
                                    choice covariation (Haefner et al., 2013; Pitkow et al., 2015) usually used to quantify choice-related
                                    signals.
                                        The most widely used measure of activity-choice covariation for tasks involving two choices is
                                    choice probability, CP. The CP is defined as the probability that a random sample of neural activity
                                    from all trials with behavioral choice D equal to 1 is larger than one sample randomly drawn from all
                                    trials with choice D ¼ 1 (Britten et al., 1996; Parker and Newsome, 1998; Nienborg et al., 2012;
                                    Haefner et al., 2013):
                                                                         Z ¥               Z r
                                                                    CP      dr pðrjD ¼ 1Þ     dr 0 pðr 0 jD ¼ 1Þ;                      (1)
                                                                              ¥                      ¥

                                    where r is any measure of the neural activity, which we will here consider to be the neuron’s per-trial
                                    spike count. Another prominent measure of choice-related signals is choice correlation, CC
                                    (Pitkow et al., 2015). This quantity is defined under the assumption that the binary choice D is medi-
                                    ated by an intermediate continuous decision value, d. This value may represent the brain’s estimate
                                    of the stimulus, or an internal belief about the correct choice. The definition of CC further assumes
                                    that the categorical choice D is related to d via a thresholding operation such that the choice
                                    depends on whether d is smaller or larger than a threshold q (Gold and Shadlen, 2007). Its expres-
                                    sion is as follows:
                                                                                               covðr; dÞ
                                                                           CC  corrðr; dÞ ¼ pffiffiffiffiffiffiffiffiffiffipffiffiffiffiffiffiffiffiffiffi ;                   (2)
                                                                                              var r var d

                                    where covðr; dÞ is the covariance of the neural responses with d, and var r, var d their variance across
                                    trials. Perhaps, the simplest measure of activity-choice covariation, which has been used in empirical
                                    studies (Mante et al., 2013; Ruff et al., 2018), is what we called the choice-triggered average,
                                    CTA, defined as the difference between a neuron’s average spike count r across trials with behav-
                                    ioral decision D ¼ 1 minus the average spike count in trials with decision D ¼ 1:

                                                                               CTA  hriD¼1          hriD¼ 1 :                           (3)

                                        The CP and CTA quantify activity-choice covariations without assumptions about the underlying
                                    decision-making mechanisms. However, their interpretation has commonly (Nienborg et al., 2012)
                                    been informed in previous analytical and computational studies by assuming a specific feedforward
                                    decision-threshold model of choice-related signals (Shadlen et al., 1996; Cohen and Newsome,
                                    2009b). Haefner et al., 2013 used that model to derive an analytical expression for CP valid under
                                    two assumptions that are often violated in practice: first, the model assumes a causally feedforward
                                    structure in which sensory responses caused the decision, and second, it is assumed that both deci-
                                    sions are equally likely. However, the presence of informative stimuli leads to one choice being more
                                    likely than the other, hampering the application of the analytical results to Grand CPs and to detec-
                                    tion tasks (Bosking and Maunsell, 2011; Smolyanskaya et al., 2015), which involve informative
                                    stimuli. Furthermore, decision-related signals have empirically been shown to reflect substantial
                                    feedback components (Nienborg and Cumming, 2009; Nienborg et al., 2012; Macke and Nien-
                                    borg, 2019). We will next extend this previous model (Haefner et al., 2013) to obtain a general
                                    expression of the CP valid for informative stimuli and regardless of the feedforward or feedback ori-
                                    gin of the dependencies between the neural responses and the decision variable.
                                        We first consider a most generic model in which we simply assume that the response ri of the
                                    i th sensory neurons covaries with the behavioral decision D, but without making any assumption
                                    about the origin of that covariation (Figure 1A). We find that to a first approximation (exact solution
                                    provided in Methods), the CP of cell i captures the difference between the distributions pðri jD ¼ 1Þ
                                    and pðri jD ¼ 1Þ resulting from a difference in their means, and hence is related to the CTA:
                                                                                       1  1 CTAi
                                                                                  CPi » þ pffiffiffiffi pffiffiffiffiffiffiffiffiffiffiffi :                           (4)
                                                                                       2 2 p var ri

                                      The CTA generically quantifies the linear dependencies between responses and choice, and this
                                    approximation of the CP does not depend on their feedforward or feedback origin (Figure 1A). We

Chicharro et al. eLife 2021;10:e54858. DOI: https://doi.org/10.7554/eLife.54858                                                      3 of 39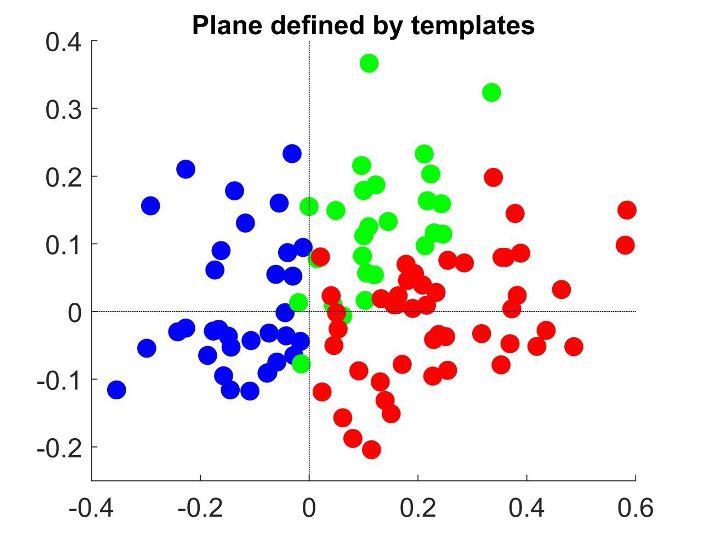
Research article                                                                                                            Neuroscience

       a                                     b                                      c

            Y                 Y                       Y                 Y

Figure 1. Models of choice probabilities. Arrows indicate causal influences. Undirected edges indicate relationships that may be due to feedforward,
feedback, and/or common inputs. (a) A model agnostic to the causal origin of the choice–response covariation: the response of sensory neurons
encoding a stimulus s covaries with choice D. (b) Threshold model with a continuous decision variable d mediating the relationship between responses
and choice. The binary decision is made comparing d to a threshold q. (c) The threshold mechanism (vertical dashed black line) dichotomizes the d-
space, resulting in a difference between the means of the conditional distributions associated with D ¼ 1 (red and blue vertical dashes on top of
figure). This difference is quantified by CTAd (horizontal thick black line) and implies a non-zero difference between the choice-triggered average
responses (CTAi ) in the presence of a correlation, CCi , between d and ri.

                                    next add the assumption that the relationship between a neuron’s response and the choice is medi-
                                    ated by the continuous variable d, as commonly assumed by previous studies and described above
                                    (Figure 1B). This splits any correlation between the neural response ri and choice D into the product
                                    of the two respective correlations: corrðri ; DÞ ¼ corrðri ; dÞcorrðd; DÞ = CCi corrðd; DÞ, where
                                    CCi ¼ corrðri ; dÞ is the choice correlation as defined in Equation 2. It follows (see Methods) that:
                                                                                          pffiffiffiffiffiffiffiffiffiffiffi
                                                                                            var ri
                                                                              CTAi ¼ CCi pffiffiffiffiffiffiffiffiffiffi CTAd ;                               (5)
                                                                                            var d

                                    where CTAd is the average difference in d between the two choices, in analogy to the CTAi for neu-
                                    ron i. Equation 5 describes how activity-choice covariations appear in the model (Figure 1C): the
                                    threshold mechanism dichotomizes the space of the decision variable, resulting in a different mean
                                    of d for each choice, which is quantified in CTAd . If the activity of cell i is correlated with the decision
                                    variable d (non zero CCi ), the CTAd is then reflected in the CTAi of the cell. In previous theoretical
                                    work (Haefner et al., 2013), the distribution over d was assumed to be fixed and centered on the
                                    threshold value q. Here, we remove that assumption and consider that d may not be centered on the

Chicharro et al. eLife 2021;10:e54858. DOI: https://doi.org/10.7554/eLife.54858                                                               4 of 39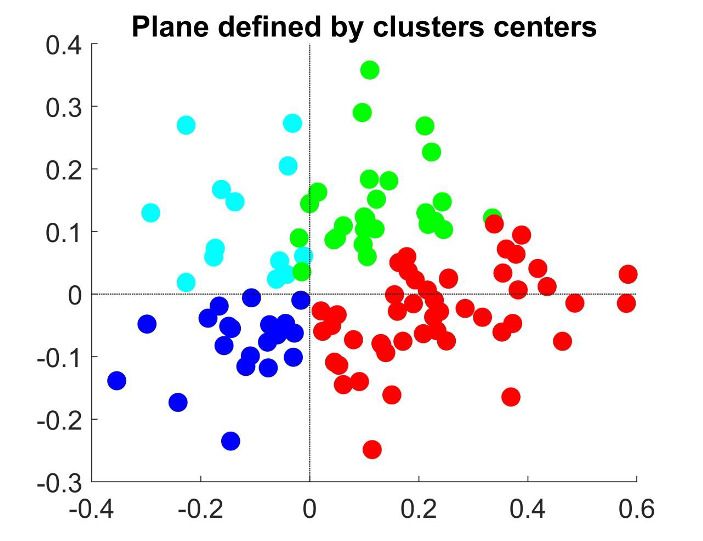
Research article                                                                                                     Neuroscience

                                    threshold if the stimulus is informative, containing evidence in favor of one of the two choices, or if
                                    the choice is otherwise biased. In those cases, the normalized CTAd in Equation 5, namely
                                           pffiffiffiffiffiffiffiffiffiffi
                                    CTAd = var d , can be determined (see Materials and methods) in terms of the probability of choos-
                                    ing choice 1, pCR  pðD ¼ 1Þ ¼ pðd>Þ, which we call the ‘choice rate’, pCR . Since the decision variable
                                    is determined as the combination of the responses of many cells, its distribution is well approxi-
                                    mated by a Gaussian distribution, but now with a nonzero mean determined by the stimulus content.
                                                                                                              pffiffiffiffiffiffi
                                    With this assumption, the normalized CTAd for pCR ¼ 0:5 is equal to 4= 2p, and for each other pCR
                                    value differs by a scaling factor
                                                                                     pffiffiffiffiffiffi
                                                                                      2pfðF 1 ðpCR ÞÞ
                                                                           hðpCR Þ ¼                  ;                                   (6)
                                                                                      4pCR ð1 pCR Þ

                                    where fðxÞ is the density function of a zero-mean, unit variance, Gaussian distribution, and F 1 is
                                    the corresponding inverse cumulative density function. By construction, hðpCR Þ ¼ 1 for pCR ¼ 0:5
                                    where it has its minimum. Given the factor hðpCR Þ, combining Equations 4 and 5 we can relate CP
                                    and CC across different ratios pCR , corresponding to different stimulus levels, irrespectively of
                                    whether CP is caused by feedforward or feedback signals. In the linear approximation (see Methods
                                    for the exact formula and derivation with the decision-threshold model), this relationship reads:
                                                                                     pffiffiffi
                                                                                  1   2
                                                                      CPi ðpCR Þ » þ      hðpCR Þ CCi ðpCR Þ:                         (7)
                                                                                  2 p

                                        For equal fractions of choices, pCR ¼ 0:5, this CP expression corresponds to the linear approxima-
                                    tion derived in Haefner et al., 2013. Note that extending the CP formula to pCR 6¼ 0:5 required us to
                                    also make explicit the dependency of the choice correlations on the choice rate, CCi ðpCR Þ. Unlike
                                    hðpCR Þ which is an effect of the decision-making threshold mechanism and shared by all neurons,
                                    CCi ðpCR Þ is specific to and generally different for each neuron, reflecting its role in the perceptual
                                    decision-making process. A CC stimulus dependence may arise as a result of stimulus-dependent
                                    decision feedback (Haefner et al., 2016; Bondy et al., 2018; Lange and Haefner, 2017), or other
                                    sources of stimulus-dependent cross-neuronal correlations (Ponce-Alvarez et al., 2013;
                                    Orbán et al., 2016) such as shared gain fluctuations (Goris et al., 2014). In fact, we will show below
                                    that gain-induced stimulus-dependent cross-neuronal correlations account for observed features in
                                    our empirical data. Note that we do not distinguish between CC stimulus dependencies and a
                                    dependence of the CC on pCR . We do not make this distinction here because most generally a
                                    change in the stimulus level results in a change of pCR , and the two cannot be disentangled. How-
                                    ever, the pCR more generally depends on other factors such as the reward value, attention level, or
                                    arousal state, and in Equation 7 the separate dependencies on the stimulus and pCR can be explicitly
                                    indicated as CCi ðpCR ; sÞ when the experimental paradigm allows to separate these two influences.
                                        For simplicity, we presented above only the general relationship between the CP and CC in Equa-
                                    tion 7 derived as a linear approximation for weak activity-choice covariations, as this is the regime
                                    relevant for single sensory neurons. See Methods for the exact analytical solution from the threshold
                                    model (Equation 16) and Appendix 1 for its derivation. Despite the assumption of weak activity-
                                    choice covariations, this approximation is very close over the empirically relevant range of CC’s
                                    (Figure 2A–B). Below we will focus on a concrete type of CC stimulus dependence, namely origi-
                                    nated by gain fluctuations, but it is clear from Equation 7 that any CC stimulus dependence will
                                    modify the CPðpCR Þ shape induced purely by the threshold effect. A summary of the overall relation
                                    between the CP, CTA, and CC is provided in Figure 2D.
                                        The model provides a concrete prediction of a stereotyped dependence of CP on pCR through
                                    hðpCR Þ when the choice-related signals are mediated by an intermediate decision variable d, which is
                                    testable using data. First, under the assumption that CC is constant and therefore hðpCR Þ is the only
                                    source of CP dependence on pCR , for a positive CC (CP>0:5), the CPðpCR Þ should have a minimum
                                    at pCR ¼ 0:5 and increase symmetrically as pCR deviates from 0.5 as the result of a change in the stim-
                                    ulus in either direction (Figure 2A). When the CC is negative (CP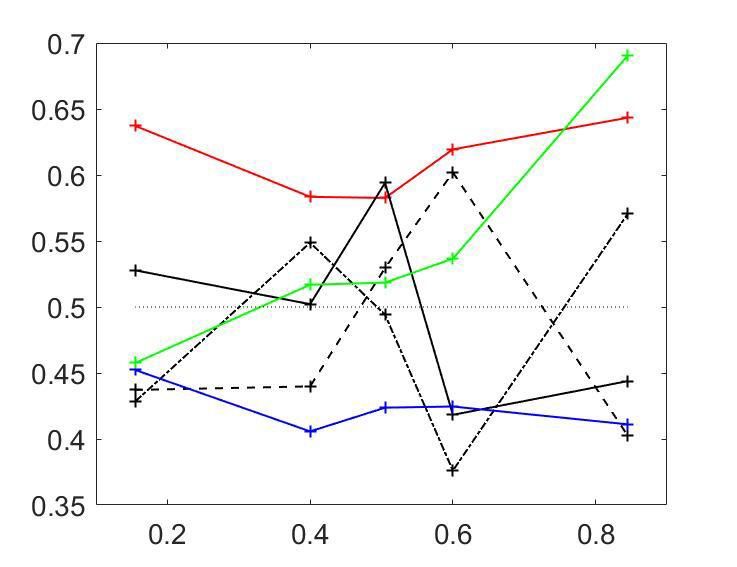
Research article                                                                                                                  Neuroscience

   a                              exact CP
                                                      b                                               c              λi =0.1      λi =0.5
                                  linear CP                         pCR= 0.9
                                                                    pCR= 0.5

                                                     CP

                                                                                                     CP
   CP

                   pCR ≡ p(choice = 1)                                       CC                                        pCR ≡ p(choice = 1)

       d
            Relations between the different
             measures of activity-choice
                      covariation

Figure 2. Predictions for stimulus dependencies from the threshold model. (a) CP dependence on pCR through the threshold-induced factor hðpCR Þ.
Results are shown for three values of a stimulus-independent choice correlation, CCi , isolating the shape of hðpCR Þ from other stimulus dependencies.
Solid curves represent the exact solution of the CP obtained from our model (see Methods, Equation 16) and dashed curves its linear approximation
(Equation 7). (b) Comparison of the exact solution of the CP (solid) and its linear approximation (dashed), as a function of the magnitude of a stimulus-
independent choice correlation. Results are shown for two values of pCR , 0.5 and 0.9. (c) CP dependence on pCR when together with the factor hðpCR Þ
stimulus dependencies also appear through stimulus-dependent choice correlations induced by response gain fluctuations (Equation 11). Results are
shown for five values of CCðpCR ¼ 0:5Þ (dotted horizontal lines) and in each case for two values of li , the fraction of the variance of a cell i caused by
the gain fluctuations (Methods). (d) Summary of the derived relationships as provided by Equations 4-7.

                                      detectable only when including highly informative stimuli in the analysis to obtain pCR values very dif-
                                      ferent from 0.5. However, for those pCR values, CP estimates are less reliable, because only for few
                                      trials the choice is expected to be inconsistent with the sensory information, meaning that one of
                                      the two distributions pðri jD ¼ 1Þ or pðri jD ¼ 1Þ is poorly sampled. This means that to detect the
                                      hðpCR Þ modulation for single cells, many trials would be needed for each value of pCR to obtain good
                                      estimates. Because hðpCR Þ is common to all cells, averaging CPðpCR Þ profiles across cells can also
                                      improve the estimation. This averaging may also help to isolate the hðpCR Þ modulation, assuming
                                      that cell-specific CPi stimulus dependencies introduced through choice correlations CCi are hetero-
                                      geneous across cells and average out. We refer to Appendix 1 for a detailed analysis of the statistical
                                      power for the detection of hðpCR Þ as a function of the number of trials and cells used to estimate an
                                      average CPðpCR Þ profile. We will present below (Section ‘Stimulus dependence of choice-related sig-
                                      nals in the responses of MT cell’) evidence for the hðpCR Þ modulation from a re-analysis of the data in
                                      Britten et al., 1996.

                                      The structure of CP stimulus dependencies induced by response gain
                                      fluctuations
                                      We will now focus on a concrete source of stimulus-dependent correlations that leads to a non-con-
                                      stant CCðpCR Þ, namely the effect of gain fluctuations into the stimulus-response relationship
                                      (Goris et al., 2014; Ecker et al., 2014; Kayser et al., 2015; Schölvinck et al., 2015). Goris et al.,
                                      2014 showed that 75% of the variability in the responses in monkeys MT cells when presented with
                                      drifting gratings could be explained by gain fluctuations. We derive the CP dependencies on pCR in
                                      a feedforward model of decision-making (Shadlen et al., 1996; Haefner et al., 2013) that also

Chicharro et al. eLife 2021;10:e54858. DOI: https://doi.org/10.7554/eLife.54858                                                                     6 of 39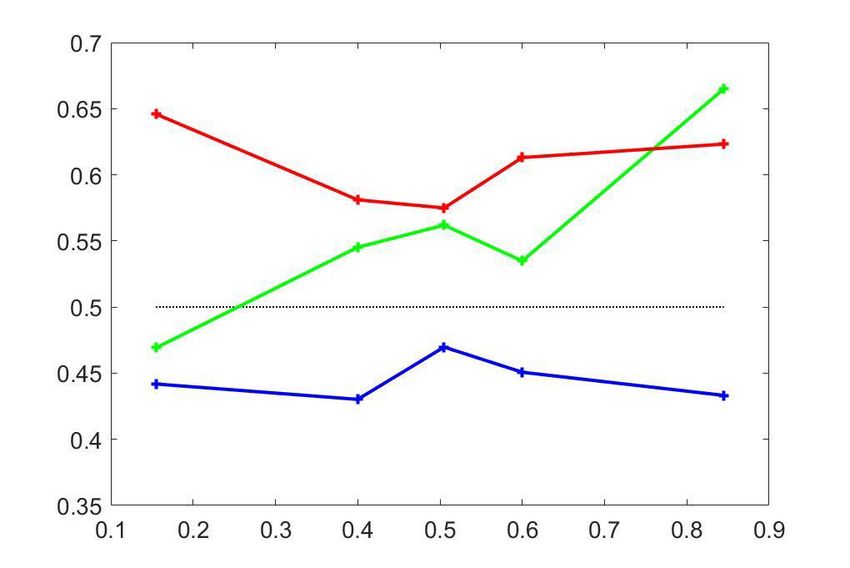
Research article                                                                                                               Neuroscience

                                    models the effect of gain fluctuations in the responses. The feedfoward model considers a popula-
                                    tion of sensory responses, ~ r ¼ ðr1 ; :::; rn Þ, with tuning functions ~
                                                                                                            f ðsÞ ¼ ðf1 ðsÞ; :::; fn ðsÞÞ, responses
                                    ri ¼ fi ðsÞ þ i , and a covariance structure S of the neuron’s intrinsic variability i . The responses are
                                    read out into the decision variable with a linear decoder
                                                                                               n
                                                                                               X
                                                                                       w>~
                                                                                    d ¼~ r           wi ri ;                                      (8)
                                                                                                i¼1

                                    where ~w are the read-out weights. The categorical choice D is made by comparing d to a threshold
                                    q. With this model, the general expression of Equation 7 reduces to
                                                                                pffiffiffi
                                                                             1   2                  ðSðsÞ~ wÞi
                                                                 CPi ðpCR Þ » þ      hðpCR Þ pffiffiffiffiffiffiffiffiffiffiffipffiffiffiffiffiffiffiffiffiffiffiffiffiffiffiffiffiffi :     (9)
                                                                             2 p              Sii ðsÞ ~   w> SðsÞ~      w

                                    where ðSðsÞ~                                    w> SðsÞ~
                                                      wÞi ¼ covðri ; dÞ and var d ¼ ~      w. This expression corresponds to the one derived by
                                    Haefner et al., 2013, except for hðpCR Þ and for the fact that we now explicitly indicate the depen-
                                    dence of the correlation structure SðsÞ on the stimulus. The expression relates the CP magnitude to
                                    single-unit properties such as the neurometric sensitivity, as well as to population properties, such as
                                    the decoder pooling size and the magnitude of the cross-neuronal correlations, which determine CC
                                    (Shadlen et al., 1996; Haefner et al., 2013). In particular, if the decoding weights are optimally
                                    tuned to the structure of the covariability SðpCR ¼ 0:5Þ at the decision boundary, this results in a pro-
                                    portionality between CPi ðpCR ¼ 0:5Þ and the neurometric sensitivity of the cells:
                                    CPi ðpCR ¼ 0:5Þ / fi0 =sri (Haefner et al., 2013), as has been experimentally observed (Britten et al.,
                                    1996; Parker and Newsome, 1998). While this feedfoward model is generic, we concretely study
                                    CC stimulus dependencies induced by the effect of global gain response fluctuations in cross-neuro-
                                    nal correlations. Following Goris et al., 2014 we modeled the responses of cell i in trial k as
                                    fik ðsÞ ¼ gk fi ðsÞ, where gk is a gain modulation factor shared by the population. We assume that the
                                    readout weights ~        w are stimulus-independent. As a consequence, the covariance of population
                                    responses S has a component due to the gain fluctuations:
                                                                                          þ s2 ~
                                                                                  SðsÞ ¼ S           ~>                                           (10)
                                                                                              G f ðsÞf ðsÞ;

                                                                                  is the covariance not associated with the gain, which
                                     where s2G is the variance of the gain g and S
                                    for simplicity we assume to be stimulus independent. The component of the cross-neuronal covari-
                                    ance matrix S induced by gain fluctuations is proportional to the tuning curves (/ ~
                                                                                                                       f ðsÞ~
                                                                                                                            f T ðsÞ). A devia-
                                    tion Ds  s s0 of the stimulus from the uninformative stimulus s0 produces a change D~    f ¼~
                                                                                                                                 f 0 ðs0 ÞDs in
                                    the population firing rates, which affects the variability of the responses, the variability of the
                                    decoder, and their covariance, which all vary with Ds. Because the variance of the decoder
                                            w> SðsÞ~
                                    var d ¼ ~          w and the covariance covðri ; dÞ ¼ ðSðsÞ~
                                                                                               wÞi both depend on the concrete form of the
                                    read-out weights, the effect of gain-induced stimulus dependencies on the CP is specific for each
                                    decoder. Under the assumption of an optimal linear decoder at the decision boundary s0
                                     w / S 1~
                                    (~       f 0 ðs0 Þ), we obtain an approximation of the CC dependence on the stimulus deviation Ds from
                                    s0 (see Methods for details):
                                                                                                                          Ds
                                                                                                         CC2i ðpCR ¼ 0:5Þ pffiffiffiffiffiffiffiffiffiffi ;

                                                          CCi ðpCR Þ ¼ CCi ðpCR ¼ 0:5Þ þ sG li 1                                                 (11)
                                                                                                                           var d

                                    where the slope is determined by the coefficient bpCR ¼ sG li 1 CC2i ðpCR ¼ 0:5Þ , with li being the


                                    fraction of the variance of cell i caused by the gain fluctuations (Methods). The choice rate pCR is
                                    determined by the stimulus Ds as characterized by the psychometric function. For this form of the
                                    slope coefficient bpCR obtained with an optimal decoder all the factors contributing to it are positive
                                    (Figure 2C). In Appendix 4 we further analytically describe how gain fluctuations introduce CP stimu-
                                    lus dependencies not only for an optimal decoder, but also for any unbiased decoders. Conversely
                                    to the factor hðpCR Þ, the pattern of CPðpCR Þ profiles produced by the gain fluctuations is cell-specific,
                                    with a stronger asymmetric component for cells with higher li (Figure 2C). Furthermore, while the
                                    sign of the multiplicative modulation hðpCR Þ changes when CC>0 or CC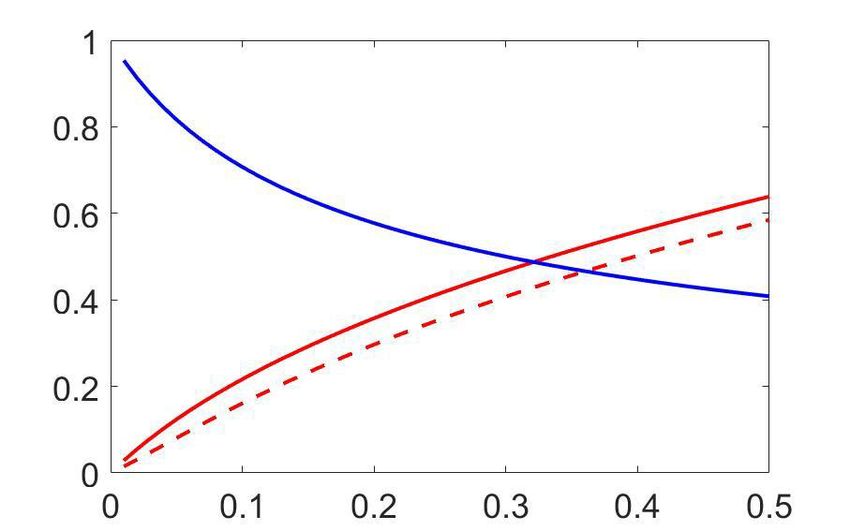
Research article                                                                                                       Neuroscience

                                    covariation for uninformative stimuli (CPðpCR ¼ 0:5Þ close to 0.5), this implies that the CP of a neuron
                                    can actually change from below 0.5 to above 0.5 across the stimulus range presented in the
                                    experiment.

                                    Stimulus dependencies of choice-related signals in the responses of MT
                                    cells
                                    In the light of our findings above, we re-analyzed the classic Britten et al., 1996 data containing
                                    responses of neurons in area MT in a coarse motion direction discrimination task (see Methods for a
                                    description of the data set). Our objective is to identify any patterns of CP dependence on the
                                    choice rate/stimulus level. First, we describe our results testing for the threshold-induced CP stimu-
                                    lus dependence, hðpCR Þ, and then more generally we characterize the CPðpCR Þ patterns found in the
                                    data using clustering analysis. Finally, as an alternative to CP analysis, we show how to extend Gen-
                                    eralized Linear Models (GLMs) of neural activity to include stimulus-choice interaction terms that
                                    incorporate the stimulus dependencies of activity-choice covariations derived with our theoretical
                                    approach and found above in the MT data.

                                    Testing the presence of a threshold-induced CP stimulus dependence in
                                    experimental data
                                    We start describing how to analyze within-cell CPðpCR Þ profiles to test the existence of the thresh-
                                    old-induced modulation. The theoretically derived properties of hðpCR Þ suggest several empirical sig-
                                    natures that will be reflected in the within-cell CPðpCR Þ profiles. First, because hðpCR Þ introduces a
                                    multiplicative modulation of the choice correlation, for informative stimuli it leads to an increase of
                                    the CP for cells with positive choice correlation (CP>0:5) and to a decrease for cells with negative
                                    choice correlation (CP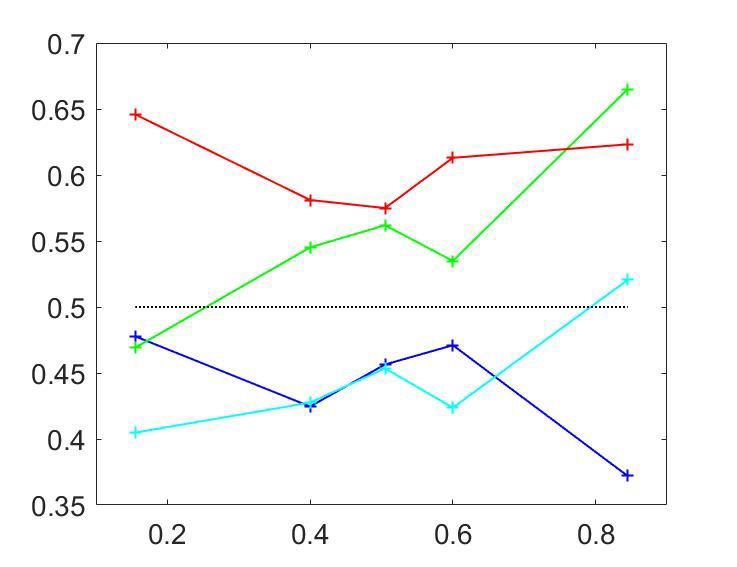
Research article                                                                                                                       Neuroscience

                                      Following the second consideration, those cells were excluded from the analysis to avoid that they
                                      only contributed to the average at certain pCR values.
                                         We derived the following refined procedure to analyze CPðpCR Þ profiles. As a first step, we con-
                                      structed a CPðpCR Þ profile for each cell. First, for each cell and each stimulus coherence level we cal-
                                      culated a CP estimate if at least four trials were available for each decision. For the experimental
                                      data set, CPs are always estimated from its definition (Equation 1), and we will only use the theoreti-
                                      cal expression of hðpCR Þ to fit the modulation of the experimentally estimated CPðpCR Þ profiles. Sec-
                                      ond, as a first way to improve the CP estimates, we binned pCR values into five bins and assigned
                                      stimulus coherence levels to the bins according to the psychometric function that maps stimulus lev-
                                      els to pCR , with the central bin containing the trials from the zero-signal stimulus. A single CP value
                                      per bin for each cell was then obtained as a weighted average of the CPs from stimulus levels
                                      assigned to each bin. The weights were calculated as inversely proportional to the standard error of
                                      the estimates, giving more weight to the most reliable CPs (see Methods). The results that we pres-
                                      ent hereafter are all robust to the selection of the minimum number of trials and the binning inter-
                                      vals. Unless otherwise stated, in all following analyses we included all the cells (N ¼ 107) for which
                                      we had data to compute CPs in all five bins, thus allowing us to estimate a full within-cell CPðpCR Þ
                                      profile. As a second step, we averaged the within-cell CPðpCR Þ profiles across cells, taking into
                                      account the two considerations above. As before, averages were weighted by inverse estimation
                                      errors.
                                         Figure 3A shows the averaged CPðpCR Þ profiles. To assess the statistical significance of the CP
                                      dependence on pCR , we developed a surrogates method to test whether a pattern consistent with
                                      the predicted CP-increase for informative stimuli could appear under the null hypothesis that the CP
                                      has a constant value independent of pCR (see Methods). For the cells with average CP higher than
                                      0.5, we found that the modulation of the CP was significant (p ¼ 0:0006), with higher CPs obtained

       a                                                        b                   b
                      CP>0.5 N = 74 p = 0.0006                                                       CP>0.5 N = 117 pc= 0.0013
                      CP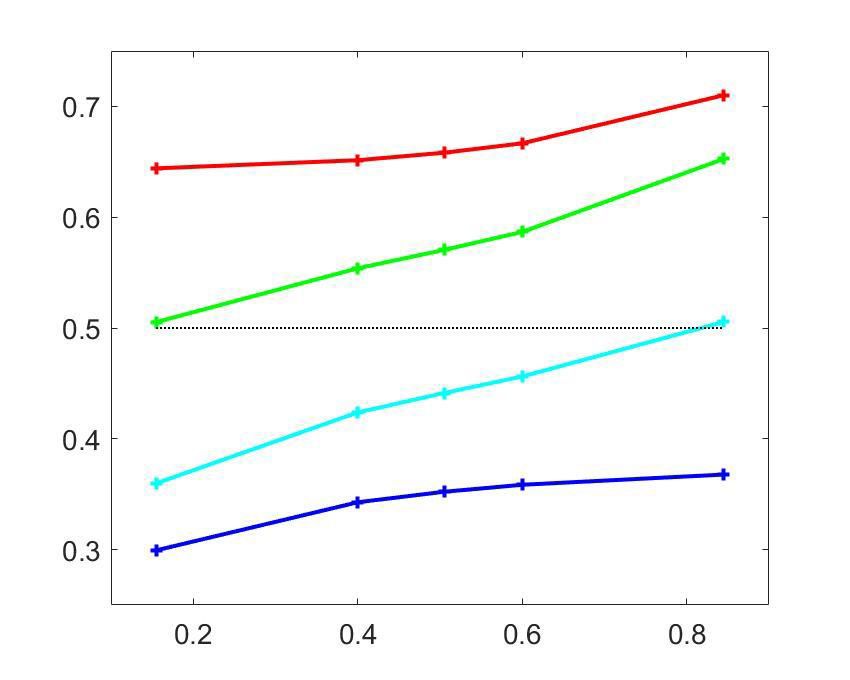
Research article                                                                                                      Neuroscience

                                    for pCR close to 0 or one in agreement with the model. For cells with average CP lower than 0.5, the
                                    modulation was not significant (p ¼ 0:26). While the actual absence of a modulation would imply that
                                    the choice-related signals in these neurons are not mediated by a continuous intermediate decision-
                                    variable but may be, for example, due to categorical feedback, we point out the lower power of this
                                    statistical test due to fewer neurons being in the CP0:5 and p ¼ 0:21 for CP0:5 suggests that cell-specific modulations are introduced through CCi ðpCR Þ. While the variabil-
                                    ity of individual CPi ðpCR Þ profiles (Figure 3C) is expected to reflect substantially the high estimation

Chicharro et al. eLife 2021;10:e54858. DOI: https://doi.org/10.7554/eLife.54858                                                       10 of 39
Research article Neuroscience
a c d
Dimension 2 (Degree of asymmetry)
cluster 2 N = 74 p = 0.0007
Dimension 2 (subclusters)
cluster 1 N = 33 p = 0. 2109
4
5
7
CP
2 6
3
1
8
pCR ≡ p(choice = 1) Dimension 1 ( µ CP-0.5 ) Dimension 1 ( µ CP-0.5 )
b e cluster 3
cluster 3 N = 26 p = 0.0026 cluster 2
cluster 2 N = 48 p = 0.0008 = 0.01
cluster 1
cluster 1 N = 33 p = 0.2109 = 0.1
Dimension 2 (asymmetry)
CP
CP
pCR ≡ p(choice = 1) pCR ≡ p(choice = 1) Dimension 1 ( µCP-0.5 )
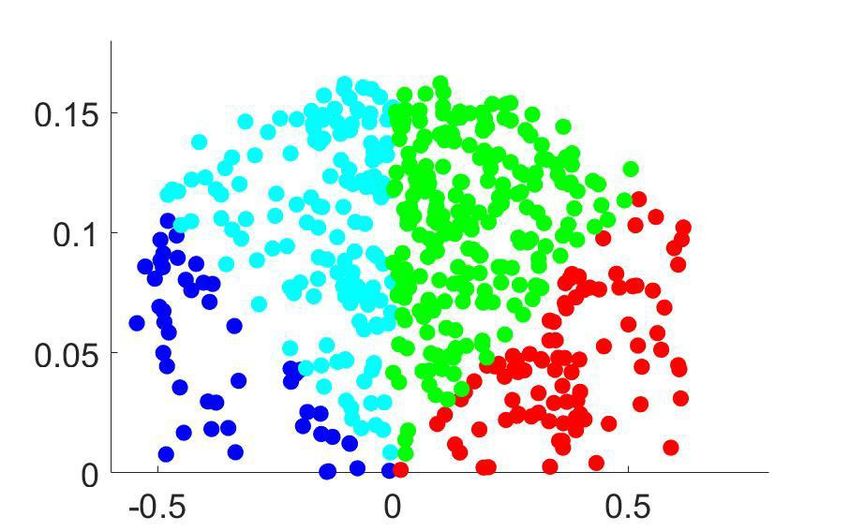
Figure 4. Clustering analysis of choice probability as a function of pCR . (a–b) CP as a function of pCR for clusters of the MT cells determined by k-means
clustering. Each CPðpCR Þ profile corresponds to the center of a cluster. Significance of the modulation was quantified as in Figure 3. (a) Two clusters
(Nc ¼ 2) for all cells. (b) Further subclustering of cells with average CP>0:5 into two subclusters. (c) Representation of the CPðpCR Þ profiles in a two-
dimensional space spanned by the cluster means. The horizontal axis is defined by clusters 1 and 2 and closely aligned with CP 0:5. Vertical axis is
defined as perpendicular to horizontal axis in the plane defined by the subcluster means. Colors correspond to the clusters of panel b, with blue and
cyan further indicating subclusters of cells with average CP0:5 cluster with a significant CPðpCR Þ profile,
excluding from our analysis cells within the CP0:5 are shown in Figure 4B. For both subclusters the CPðpCR Þ dependence is significant
(p ¼ 0:0008 for cluster two and p ¼ 0:0026 for cluster 3, respectively, in Figure 4B). The larger cluster
has a more symmetric shape of dependence on pCR , with an increase of CP in both directions when
the stimulus is informative, consistent with the prediction of a threshold-induced CP stimulus depen-
dence hðpCR Þ. For the smaller cluster the dependence is asymmetric, with a CP increase when the
stimulus direction is consistent with the preferred direction of the cells and a decrease in the oppo-
site direction. We verified that no significant difference exists between the firing rates of the cells in
the two subclusters (Wilcoxon rank-sum test, p ¼ 0:23). The monotonic shape of the second subclus-
ter mirrors the dependency produced by response gain fluctuations as predicted by the gain model
described above. This suggests that the neurons in this subcluster differ from the neurons in the
Chicharro et al. eLife 2021;10:e54858. DOI: https://doi.org/10.7554/eLife.54858 11 of 39Research article Neuroscience
other subcluster by a substantially larger gain-induced variability, a testable prediction for future
experiments and further discussed below.
Introducing a second cluster allows for representing each neuron’s CPðpCR Þ-dependency in the
two-dimensional space (Figure 4C) spanned by the mean profiles for each of the three clusters. The
horizontal axis corresponds to the separation between the two initial clusters, and is closely aligned
to the departure of the average CP from 0.5. The vertical axis is defined by the vectors correspond-
ing to the centers of the two subclusters and hence is determined separately for the cells with aver-
age CP higher and lower than 0.5 (see Methods for details, and Appendix 3—figure 1A). The
vertical axis is associated with the degree to which the CPðpCR Þ dependence is symmetric or asym-
metric with respect to pCR ¼ 0:5. Cells for which the CP increases consistently with its preferred
direction of motion coherence lie on the upper half-plane. To further support this interpretation of
the axis, we repeated the clustering procedure replacing the nonparametric k-means procedure with
a parametric procedure that defines the subclusters with a symmetric and an asymmetric template,
respectively. The data is distributed approximately equally in both spaces (Figure 4C–D).
Similar results were also obtained when increasing the number of clusters non-hierarchically.
Introducing a third cluster for all cells leaves almost unaltered the cluster of cells with CP lower than
0.5 (Appendix 3—figure 1B). The cluster of cells with CP higher than 0.5 splits into two subclusters
analogous to the ones found from cells with CP higher than 0.5 alone. The distinction between cells
with more symmetric and asymmetric CPðpCR Þ dependencies is robust to the selection of a larger
number of clusters, that is, clusters with this type of dependencies remain large when allowing for
the discrimination of more patterns (Appendix 3—figure 1C). However, we do not mean to claim
that the variety of CPðpCR Þ profiles across cells can be reduced to three separable clusters. As
reflected in the distributions in Figure 4C–D, the clusters are not neatly separable. Indeed, a richer
variety of profiles would be expected if the properties of CPðpCR Þ profiles across cells were associ-
ated with their tuning properties and the structure of feedback projections, as we further argue in
the Discussion. The predominance of a symmetric and asymmetric pattern would only reflect which
are the predominant CPðpCR Þ shapes shared across cells.
This clustering analysis confirms the presence of shared patterns of CP stimulus-dependence
across cells, whose shape is compatible with the analytical predictions from the threshold- and gain-
related dependencies. The symmetric component of CP stimulus dependence is congruent with
hðpCR Þ (Equation 6), albeit with a larger magnitude than predicted (Figures 2A and 3A, and addi-
tional analysis of the statistical power in Appendix 1). This stronger modulation suggests an addi-
tional symmetric contribution of the choice correlation CCðpCR Þ and/or a dynamic feedback
reinforcing the stronger modulation for highly informative stimuli. However, while the cluster analysis
separates the predominant CPðpCR Þ patterns, the Britten et al. data lacks the statistical power to fur-
ther distinguish between hðpCR Þ and symmetric CCðpCR Þ contributions with a similar shape.
Gain-induced CP stimulus dependencies in the MT responses
Three key features of the CPðpCR Þ dependencies observed for the MT cells are qualitatively
explained by introducing shared gain fluctuations in the decision threshold model described above
(Figure 4E) – the first two manifesting itself on the population (cluster) level and the third one on an
individual neuron level. First, a shared gain variability predicts the existence of the asymmetric CP
stimulus dependence seen in cluster 3 (Equation 11 and Figure 2C). Second, the average CP of the
asymmetric cluster 3 is lower than the average CP of the symmetric cluster 2 (compare red and
green profiles in Figure 4B+E). And third, if gain variability is indeed a driving factor for the
observed asymmetry in cluster 3, then within this cluster, neurons with a higher amount of gain vari-
ability should also have a steeper CPðpCR Þ profile, a prediction we could confirm as described in the
next paragraph.
In order to test this prediction, for each neuron in cluster 3, we first computed the degree of
asymmetry of its CPðpCR Þ profile from the data directly, by simply fitting a quadratic function to
CPðpCR Þ (Methods). Next, and independently of this, we used the method of Goris et al., 2014 to
estimate the amount of gain variability for each neuron. Knowing each neuron’s gain variability
allowed us to predict each neuron’s degree of asymmetry (slope of CPðpCR Þ as determined by bpCR ,
using Equation 11). We indeed found a significant correlation between the predicted and the
observed slopes (r ¼ 0:58, p ¼ 0:0018) supporting the conclusion that shared gain variability underlies
Chicharro et al. eLife 2021;10:e54858. DOI: https://doi.org/10.7554/eLife.54858 12 of 39Research article Neuroscience
the observed asymmetric shape of CPðpCR Þ for the neurons in cluster 3. For cluster 2, in which the
symmetric pattern is predominant, no analogous correlation was found (r ¼ 0:15, p ¼ 0:35). It is
important to note that the asymmetry predicted by the gain variability overestimates the actually
observed one by an order of magnitude (average observed slope of 0:002 0:0003 compared to an
average predicted slope of 0:034 0:008). However, this is not surprising given our simplifying
assumption of a single global gain factor across the whole population whereas in practice the gain
fluctuations are likely inhomogeneous across the population. Furthermore, the actual read-out used
by the brain may deviate from the optimal one, further reducing the expected match between pre-
dictions and observations. A more precise modeling of CP–stimulus dependencies would require
measurements of the cross-neuronal correlation structure that is not available from the single unit
recordings of Britten et al., 1996 but will be for future population recordings.
Modeling stimulus-dependent choice-related signals with GLMs
The implications of a stimulus-dependent relationship between the behavioral choice and sensory
neural responses are not restricted to measuring them as CPs, for which activity-choice covariations
are quantified without incorporating other explanatory factors of neural responses. To further sub-
stantiate the existence of this stimulus-dependent relationship in MT data, and to understand how
our model predictions could help to refine other analytical approaches, we examined how represent-
ing that relationship can improve statistical models of neural responses. In particular, we study how
the stimulus-dependent choice-related signals that we discovered may inform the refinement of
Generalized Linear Models (GLMs) of neural responses (Truccolo et al., 2005; Pillow et al., 2008).
In the last few years, GLMs have been used for modelling choice dependencies together with the
dependence on other explanatory variables, such as the external stimulus, response memory, or
interactions across neurons (Park et al., 2014; Runyan et al., 2017). Typically, in a GLM of firing
rates each explanatory variable contributes with a multiplicative factor that modulates the mean of a
Poisson process. In their classical implementation, the choice modulates the firing rate as a binary
gain factor, with a different gain for each of the two choices (Park et al., 2014; Runyan et al., 2017;
Pinto et al., 2019). The multiplicative nature of this factor already introduces some covariation
between the impact of the choice on the rate and the one of the other explanatory variables. How-
ever, using a single regression coefficient to model the effect of the choice on the neural responses
may be insufficient if choice-related signals are stimulus dependent, as suggested by our theoretical
and experimental analysis.
We developed a GLM (see Methods) that can model stimulus-dependencies of choice signals (or,
in other words, stimulus-choice interactions) by including multiple choice-related predictors that
allow for a different strength of dependence of the firing rate on the choice for different subsets of
stimulus levels (via the choice rate, pCR ). We fitted this model, which we call the stimulus-dependent-
choice GLM, to MT data and we compared its cross-validated performance against two traditional
GLMs. In the first type, called the stimulus-only GLM, the rate in each trial is predicted only based
on the external stimulus level. In a second type, that we called stimulus-independent-choice GLM
and that corresponds to the traditional way to include choice signals in a GLM (Park et al., 2014;
Runyan et al., 2017; Scott et al., 2017; Pinto et al., 2019; Minderer et al., 2019), additionally the
effect of choice is included, but using only a single, stimulus-independent choice predictor.
To compare the models, we separated the trials recorded from each MT cell (Britten et al.,
1996) into training and testing sets, and calculated the average cross-validated likelihood for each
type of model on the held-out testing set. To quantify the increase in predictability when adding the
choice as a predictor we defined the relative increase in likelihood (RIL) as the relative increase of
further adding the choice as a predictor relative to the increase of previously adding the stimulus as
a predictor. RIL measures the relative influence of the choice and the sensory input in the neural
responses. Figure 5A compares the cross-validated RIL values obtained on MT neural data when fit-
ting either the stimulus-independent-choice or the stimulus-dependent-choice GLMs. We found that
RIL values were mostly higher when allowing for multiple choice parameters, both in terms of aver-
age RIL values (Figure 5C) and in terms of the proportion of cells in each cluster for which the RIL
was higher than a certain threshold, here selected to be at 10% (Figure 5B).
GLMs that include stimulus-choice interaction terms can be used not only to better describe the
firing rate of neural responses, but also to individuate more precisely the neurons or areas by their
choice signals. To illustrate this point, we show how adding the interaction terms may change the
Chicharro et al. eLife 2021;10:e54858. DOI: https://doi.org/10.7554/eLife.54858 13 of 39Research article Neuroscience
a b
2
RIL multiple choice parameters
Cluster 2
3 1
Prob. RIL>0.1
1+2+3
Cluster 1 Others
Cluster 3
1 >1 1 >1 1 >1 1 >1 1 >1
c RIL single choice parameter d Number of choice parameters
Average RIL
CP
1 >1 1 >1 1 >1 1 >1 1 >1
Number of choice parameters P(choice = 1)
Figure 5. Modeling stimulus-dependent choice-related signals with GLMs. (a) Scatter plot of the cross-validated relative increase in likelihood (RIL),
with respect to a stimulus-only model, of the stimulus-dependent-choice GLMs (multiple choice parameters) versus the stimulus-independent-choice
GLMs (a single choice parameter). (b) Proportion of cells with RIL>0.1 for the two types of models, grouped by the clusters as in Figure 4B. Cells not
included in the set of 107 cells for which a CP value could be estimated for each bin of pCR are labeled as ‘Others’. (c) Average RIL values, grouped as
in b. (d) CPðpCR Þ profiles of the three cells with the highest RIL in the stimulus-dependent-choice GLMs, as numbered in panel a.
relative comparison of cells by their RIL values. Consider the three neurons with highest RIL for the
stimulus-dependent-choice GLM (Figure 5A, and with corresponding CPðpCR Þ profiles shown in
Figure 5D). The ranking of cells 1 and 2 by RIL flips with respect to the stimulus-independent-choice
GLM because of the higher CPðpCR Þ modulation of cell 2. Similarly, while the RIL with multiple choice
parameters for cells 1 and 3 are close, the RIL of cell 3 is substantially lower with a single choice
parameter, indicating that its pattern of stimulus dependence is less well captured by a single
parameter. The degree to which a model with interaction terms improves the predictability will
depend on the shape of the CPðpCR Þ patterns, which themselves are expected to vary across areas
or across cells with different tuning properties. For example, we see in Figure 5C that for the cluster
with an asymmetric CPðpCR Þ profile (cluster 3), the average RIL with only one choice parameter sug-
gests that this type of cells are not choice driven. The reason is that for the cells in this cluster the
sign of the choice influence on the rate can be stimulus dependent, which is impossible to model by
a single choice parameter. Furthermore, the profile of the GLM choice parameters across stimulus
levels provides a characterization of stimulus-dependent choice-related signals analogous to the
CPðpCR Þ profile, in this case within the GLM framework, hence allowing efficient inference including
Chicharro et al. eLife 2021;10:e54858. DOI: https://doi.org/10.7554/eLife.54858 14 of 39Research article Neuroscience
principled regularization and the ability to account for a range of factors beyond choices and stimuli.
Overall, we expect that accounting for stimulus-choice interactions in GLMs will allow for a more
accurate assessment of the relative importance of stimulus and choice on neural responses.
Discussion
Our work makes several contributions to the understanding of how choice and stimulus signals in
neural activity are coupled. The first is that we derived a general analytical model of perceptual deci-
sion-making predicting how the relationship between sensory responses and choice should depend
on stimulus strength, regardless of whether this relationship is due to feedforward or feedback
choice-related signals. The key model assumption is that the link between sensory responses and
choices is mediated by a continuous decision variable and a thresholding mechanism. Second, we
designed new, more powerful methods to measure within-cell dependencies of choice probabilities
(CPs) on stimulus strength. Third, we studied CP stimulus dependencies in the classic dataset by
Britten et al., 1996. Interestingly, we found a rich and previously unknown structure in how CPs in
MT neurons depend on stimulus strength. In addition to a symmetric dependence predicted by the
thresholding operation, we found an asymmetric dependence which we could explain by incorporat-
ing previously proposed gain fluctuations (Goris et al., 2014) in our model, thereby introducing a
stimulus-dependent component in the cross-neuronal covariance. Finally, we showed that general-
ized linear models (GLMs) that account for stimulus-choice interactions better explain sensory
responses in MT and allow for a more accurate characterization of how stimulus-driven and how
choice-driven a cell’s response is.
Advances on analytical solutions of choice probabilities
Previous work has demonstrated that solving analytically models of perceptual decision-making can
lead to important new insights on the interpretation of the relationship between neural activity and
choice in terms of decision-making computations (Bogacz et al., 2006; Gold and Shadlen, 2007;
Haefner et al., 2013). In particular, previous analytical work on CPs has shown how experimentally
measured CPs relate to the read-out weights by which sensory neurons contribute to the internal
stimulus decoder in a feedforward model, assuming both choices are equally likely (Haefner et al.,
2013; Pitkow et al., 2015). Here, we provided a general analytical solution of CPs in a more general
model, with informative stimuli resulting in an unbalanced choice rate, and valid both for feedfor-
ward and feedback choice signals. We derived the analytical dependency of CP on the probability of
one of the choices (pCR pðchoice ¼ 1Þ), which mediates the dependence of the CP on the stimulus
strength. Our model is therefore directly applicable to both discrimination and detection tasks, for
any stimulus strength that elicits both choices. As we demonstrated, these advances in the analytical
solution of the decision-threshold model allowed for detecting and interpreting stimulus dependen-
cies of choice-related signals in neural activity.
Characterization of patterns of choice probability stimulus-dependencies
from sensory neurons
Characterizing within-cell stimulus dependencies of activity-choice covariations at the population
level requires isolating these dependencies from across-cells heterogeneity in the magnitude of the
CP values. Our analytical analysis suggests possible reasons why previous attempts failed to find
stimulus dependencies of CPs in real neural data. First, the magnitude of the CP dependence on pCR
is proportional to the magnitude of choice-related signals (i.e. on how different CPs are from 0.5).
This implies that neuron-specific dependencies need to be characterized for each cell individually,
relative to the CP obtained with the uninformative stimulus. Only neurons for which a full individual
CP profile can be estimated should be averaged to determine stimulus dependencies at the popula-
tion level, or otherwise the overall average CP profile of stimulus dependence will be dominated by
variability associated with the different subsets of neurons contributing to the CP estimate at each
stimulus level. Second, the threshold-induced predicted direction of CP dependence on pCR is differ-
ent for neurons with CP larger or smaller than 0.5, that is, neurons more responsive to opposite
choices. This opposite modulation can cancel out the magnitude of the overall threshold-induced
dependence of the CP on stimulus strength when averaging over all neurons, as done in previous
Chicharro et al. eLife 2021;10:e54858. DOI: https://doi.org/10.7554/eLife.54858 15 of 39Research article Neuroscience
analyses (Britten et al., 1996). Informed by these insights we characterized the within-cell depen-
dencies of choice-related signals on stimulus strength. The application of our refined methods to the
classic neural data from MT neurons during a perceptual decision-making task of Britten et al.,
1996 allowed us to find stimulus dependencies of CPs, while previous analyses had not detected a
significant effect.
Our understanding of how CP-stimulus dependencies may arise within the decision-making pro-
cess, and the methods we used to measure these dependencies in existing data, will allow future
studies to perform more fine-grained analyses and interpret more appropriately choice-related sig-
nals. Traditional analyses computed a single CP value for each neuron by either concentrating on
zero-signal trials (e.g. Dodd et al., 2001; Parker et al., 2002; Krug et al., 2004; Wimmer et al.,
2015; Katz et al., 2016; Wasmuht et al., 2019) or calculating grand CPs (Britten et al., 1996)
across stimulus levels (e.g. Cai and Padoa-Schioppa, 2014; Verhoef et al., 2015; Latimer et al.,
2015; Pitkow et al., 2015; Smolyanskaya et al., 2015; Liu et al., 2016; Bondy et al., 2018). Grand
CPs are calculated directly as a weighted average of the CPs estimated for each stimulus level, or by
pooling the responses from trials of all stimulus levels, after subtracting an estimate of the stimulus-
related component (Kang and Maunsell, 2012). Our theoretical CP analysis shows that the latter
procedure also corresponds to a specific type of weighted average (Appendix 2). Using the so com-
puted individual CP values for each cell, areas or populations were then often ranked in terms of
their averaged CP values per neurons. Areas with higher CP values are then identified as areas key
for decision-making (e.g. Nienborg and Cumming, 2006; Cai and Padoa-Schioppa, 2014;
Pitkow et al., 2015; Yu et al., 2015).
However, if CPs depend on pCR , it is clear that a single grand CP value cannot summarize this
dependence. The use of average single CPs may thus introduce confounds in their comparison and
miss important cell-specific information. For example, CPðpCR Þ patterns with different sign for differ-
ent pCR values will result in lower average CP values. Similarly, the comparison of the grand CP of a
cell across tasks may mostly reflect changes in the sampling in each task of stimulus levels, leading
to a change in how much the CP(s) associated with each stimulus level contributes to the grand CP.
As a result, the change in the grand CP may be interpreted as indicating the existence of task-
dependent choice-related signals, even if the CP(s) profile is invariant. In the same way, if the struc-
ture of CPðpCR Þ patterns covaries with the tuning properties, the comparison of the grand CP across
cells with different tuning properties may mostly depend on the sampling of stimulus levels. This lim-
itation is not specific to average CP values, and applies to other measures that consider choice-
related and stimulus-driven components of the response as separable, such as partial correlations
(e.g. Zaidel et al., 2017). Our work instead indicates that the shape of the CPðpCR Þ patterns cannot
be summarized in the average, and this shape may be informative about the role of the activity-
choice covariations, when comparing across cells with different tuning properties, cells from different
areas, or across tasks (e.g. Romo and Salinas, 2003; Nienborg and Cumming, 2006;
Nienborg et al., 2012; Krug et al., 2016; Sanayei et al., 2018; Shushruth et al., 2018;
Jasper et al., 2019; Steinmetz et al., 2019). Our new methods allow quantifying these CP patterns
to better characterize the covariations between neural activity and choice across neurons and
populations.
A key novelty introduced in our study is the development of a model-inspired methodological
procedure for identifying genuine within-cell CPðpCR Þ profiles, that would otherwise be masked by
across-cells heterogeneity in the magnitude of the CP values. As representative examples of how
our procedure may find previously unnoticed patterns of CP dependencies, we discuss the previous
analyses in Britten et al., 1996 and in Dodd et al., 2001. Britten et al., 1996 analyzed the depen-
dence of the CP on the stimulus strength at the population level (see their Figure 3). In particular,
for each stimulus level they averaged the CP of all cells for which an estimate of the CP was calcu-
lated, without separating cells with CP higher or lower than 0.5. Furthermore, in their data set, the
stimulus levels vary across cells, and hence in their analysis different subsets of cells contribute to
the CP average at each stimulus level. Dodd et al., 2001 presented a scatter plot of the CPs for all
cells and stimulus levels (see their Figure 6). Although this analysis did not average cells with CP>0:5
and CPYou can also read