Nonlinear plant-plant interactions modulate impact of extreme drought and recovery on a Mediterranean ecosystem
←
→
Page content transcription
If your browser does not render page correctly, please read the page content below
Research

Nonlinear plant–plant interactions modulate impact of extreme
drought and recovery on a Mediterranean ecosystem
Simon Haberstroh1,2 , Maria C. Caldeira2 , Raquel Lobo-do-Vale2                                                      , Joana I. Martins2                 , Julia Moemken3                 ,
Joaquim G. Pinto3 and Christiane Werner1
1
Ecosystem Physiology, Faculty of Environment and Natural Resources, University Freiburg, Freiburg 79110, Germany; 2Forest Research Centre, School of Agriculture, University of Lisbon,
Lisbon 1349-017, Portugal; 3Institute for Meteorology and Climate Research (IMK-TRO), Karlsruhe Institute of Technology (KIT), Karlsruhe 76131, Germany

                                                          Summary
Author for correspondence:                                 Interaction effects of different stressors, such as extreme drought and plant invasion, can
Simon Haberstroh                                          have detrimental effects on ecosystem functioning and recovery after drought. With ongoing
Email: simon.haberstroh@cep.uni-
                                                          climate change and increasing plant invasion, there is an urgent need to predict the short- and
freiburg.de
                                                          long-term interaction impacts of these stressors on ecosystems.
                                                           We established a combined precipitation exclusion and shrub invasion (Cistus ladanifer)
Received: 14 April 2021
Accepted: 20 May 2021                                     experiment in a Mediterranean cork oak (Quercus suber) ecosystem with four treatments: (1)
                                                          Q. suber control; (2) Q. suber with rain exclusion; (3) Q. suber invaded by shrubs; and (4) Q.
                                                          suber with rain exclusion and shrub invasion. As key parameter, we continuously measured
New Phytologist (2021) 231: 1784–1797                     ecosystem water fluxes.
doi: 10.1111/nph.17522                                     In an average precipitation year, the interaction effects of both stressors were neutral. How-
                                                          ever, the combination of imposed drought and shrub invasion led to amplifying interaction
Key words: Cistus ladanifer (gum rockrose),               effects during an extreme drought by strongly reducing tree transpiration. Contrarily, the
ecosystem functioning, extreme drought,                   imposed drought reduced the competitiveness of the shrubs in the following recovery period,
Quercus suber (cork oak), recovery, shrub                 which buffered the negative effects of shrub invasion on Q. suber.
invasion, stress interaction.                              Our results demonstrate the highly dynamic and nonlinear effects of interacting stressors
                                                          on ecosystems and urges for further investigations on biotic interactions in a context of cli-
                                                          mate change pressures.

                                                                                               Imperata cylindrical in a Pinus palustris ecosystem, where the
Introduction
                                                                                               invader ameliorated the impact of experimental drought on the
Over the past decades, environmental stresses caused by extreme                                ecosystem by increasing soil moisture. Similar to those examples,
drought and plant invasion have increased in frequency and                                     interacting drought and plant invasion or competition have been
intensity in many terrestrial ecosystems, with strong detrimental                              shown to alter ecosystem transpiration and the resilience of native
impacts on ecosystem functioning, stability and resilience                                     species (Rascher et al., 2011; Caldeira et al., 2015), change N-
(Bradley et al., 2012; Diez et al., 2012; Doblas Miranda et al.,                               composition in the soil (Castro et al., 2020), impact biodiversity
2017). Both stressors have been studied extensively, demonstrat-                               (Vetter et al., 2020), facilitate the invasion of other competitive
ing their profound and often detrimental impact on terrestrial                                 plants (White et al., 2001; Scott et al., 2010; Manea et al., 2016),
ecosystems (for reviews, see Gaertner et al., 2009; Vilà et al.,                              decrease tree growth and increase mortality rates (Gleason et al.,
2011; Diez et al., 2012; Allen et al., 2015). Nevertheless, still lit-                         2017; Young et al., 2017), or even provoke permanent ecosystem
tle is known about the interaction of these stressors and results                              state changes when tipping points are reached (Klose et al.,
are hard to generalize (Sorte et al., 2013; Côté et al., 2016). Pre-                         2019).
diction of the impact of interacting stressors is difficult and com-                              It might be assumed that the direction of an interaction effect
plex, as interaction effects can be amplifying, neutral or even                                between stressors should be consistent over time (e.g. buffering,
buffering. For the interaction of drought and plant invasion,                                  neutral or amplifying). However, there is evidence that interac-
amplifying as well as buffering effects have been observed                                     tions often induce highly diverse, surprising and counterintuitive
recently. Esch et al. (2019) detected amplifying effects in a                                  processes (Côté et al., 2016), which change the direction of inter-
Mediterranean ecosystem, dominated by the shrubs Salvia mellif-                                action effects over time or in dependence on environmental con-
era and Artemisia californica, where drought and invasive annuals                              ditions. Thus, such a change in the direction of an interaction,
mutually altered the shrubs phenological sensitivity and ecosys-                               which cannot be predicted from the effects of the single stressors,
tem productivity. On the other hand, Fahey et al. (2018)                                       can be considered as nonlinear. For example, Alba et al. (2019)
observed buffering effects of drought and the non-native grass                                 demonstrated that the interaction effect of drought and the
1784     New Phytologist (2021) 231: 1784–1797                                                                                                                           Ó 2021 The Authors
        www.newphytologist.com                                                                                                          New Phytologist Ó 2021 New Phytologist Foundation
                                                             This is an open access article under the terms of the Creative Commons Attribution-NonCommercial License, which permits use,
                                                          distribution and reproduction in any medium, provided the original work is properly cited and is not used for commercial purposes.
New
Phytologist                                                                                                                              Research 1785

invasive grass I. cylindrical shifted unexpectedly from facilitation     Mediterranean Q. suber ecosystem (1) in the natural drought
to competition over time. Similar changes in the direction of            periods in summer and (2) in the recovery periods after autumn
interaction effects in ecosystems can be provoked by different           and winter rains, to capture the direction and dynamic of the
levels of environmental stress (Armas & Pugnaire, 2005; Brooker          interaction effects over time and seasons. To this end, we estab-
et al., 2005; Brooker, 2006), plant age (Miriti, 2006), species          lished a rain exclusion (RE) and shrub removal experiment in a
composition (Maestre et al., 2009; Grant et al., 2014) or tree           Q. suber ecosystem invaded by C. ladanifer. We hypothesize that
diversity (Grossiord, 2019). Without exact knowledge of the              both experimental stressors reduce tree transpiration and lead to
underlying processes, mechanisms and directions of interaction           highly dynamic interaction effects in the natural summer drought
effects, the short- and long-term impact on terrestrial ecosystems       and the recovery period in winter with potentially detrimental
is difficult to predict. Potentially, the stress gradient hypothesis     effects on the ecosystems’ functioning and persistence.
(SGH) (Bertness & Callaway, 1994; Callaway & Walker, 1997;
Maestre et al., 2009) can provide a valuable framework to shed
                                                                         Materials and Methods
light onto the complex plant–plant interactions under varying
drought conditions. The SGH predicts the prevalence of compet-
                                                                         Experimental site
itive or facilitative plant–plant interactions along a stress gradient
(Maestre et al., 2009). In ecosystems where water resources are          The investigated Quercus suber L. ecosystem is part of the Tapada
limiting, competition is expected to dominate plant–plant inter-         Real in Vila Viçosa, Portugal (marked by a red star in Fig. 1a).
actions under low and high water stress conditions, whereas facil-       The site has a Mediterranean climate (Cs; Kottek et al., 2006),
itation is expected to occur under moderate drought stress               with dry summers and wet winters. Soils on site were classified as
(Maestre et al., 2009). Yet, studies of interacting drought and          haplic Leptosols with a high gravel content of the dominant
plant invasion provide the opportunity to investigate the response       bedrock schist (Caldeira et al., 2014). The shallow, poorly
of a plant species to different drought stress levels with and with-
out plant–plant interactions.                                             (a)
   Extreme drought and plant invasion have been increasing
problems in the Mediterranean basin in recent years (Hoerling
et al., 2011; Seneviratne et al., 2012; Doblas Miranda et al.,
2017). Mediterranean ecosystems are biodiversity (Médail &
Quézel, 1999; Sala et al., 2000) and climate change hotspots
(Giorgi, 2006; Guiot & Cramer, 2016), rendering these systems
particularly worth preserving. To study interacting stressors
under field conditions, we used a man-made, savannah-type cork
oak (Quercus suber L.) ecosystem. Q. suber is a species with a
strong control of transpiration water loss during dry seasons and
well-adapted to natural drought (David et al., 2007; Kurz-Besson
et al., 2014). However, these ecosystems have been progressively          (b)
invaded by successional pioneer species, such as gum rockrose
(Cistus ladanifer L.) (Acácio et al., 2009; Costa et al., 2009;
Bugalho et al., 2011). A rapid range expansion in monospecific
stands (Acácio et al., 2009; Costa et al., 2009) following climate
change-induced alterations, such as higher temperatures and
extended drought, and human disturbances, such as soil and land
degradation (Acácio & Holmgren, 2014), argue for C. ladanifer
as a native invasive species (cf. Simberloff, 2011; Carey et al.,
2012). Furthermore, shrubs express high growth rates, transpira-
tion and phenotypic plasticity, reacting strongly to changes in
environmental conditions (Correia et al., 1987; Correia & Ascen-
sao, 2016; Haberstroh et al., 2018), which further illustrate the
invasive characteristics of this species (cf. Leishman et al., 2007;
Cavaleri & Sack, 2010; Funk, 2013; Sorte et al., 2013). A first
study of interacting effects of drought and shrub invasion pointed
towards detrimental amplifying effects on Q. suber ecosystems            Fig. 1 Climatology of annual precipitation (mm) for 1981–2010 over the
(Caldeira et al., 2015), in which tree transpiration was strongly        Iberian Peninsula. The red star marks the study site in Vila Viçosa (a).
                                                                         Temporal evolution of accumulated precipitation anomalies (relative to
reduced during and after a severe drought, potentially driving tree
                                                                         climatology 1981–2010) along the hydrological year (1 October–30
mortality (Caldeira et al., 2015).                                       September) for the red box (10°W–5°W, 37°N–40°N) in (a). Depicted are
   The main objectives of this study are to investigate the impact       the five driest/wettest years since 1950 and the years of the measurement
of extreme drought, plant invasion and their interaction in a            with/without rain exclusion (RE) (b).

Ó 2021 The Authors                                                                                            New Phytologist (2021) 231: 1784–1797
New Phytologist Ó 2021 New Phytologist Foundation                                                                       www.newphytologist.com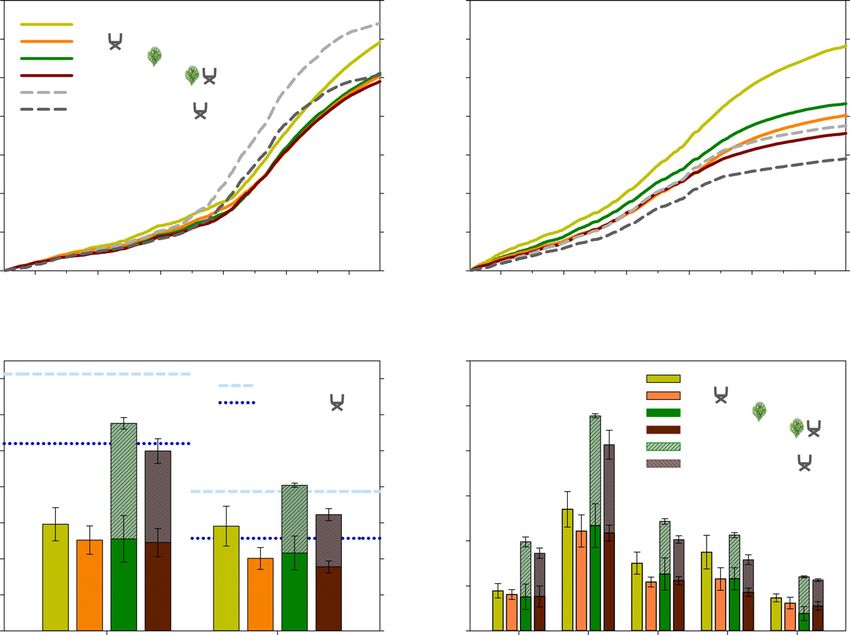
New
1786 Research                                                                                                                       Phytologist

     developed soils seldom exceed a depth of 0.4 m (Haberstroh            were calibrated individually in the laboratory before installation
     et al., 2018). All investigated plots were invaded by Cistus          in the field. The laboratory calibration was complemented by fre-
     ladanifer L. before 2011, when the shrubs were cut on half of         quent soil coring under field conditions to verify the sensor cali-
     the plots, allowing a sparse grass layer to repopulate the under-     bration. As a consequence of the high level of volumetric soil
     storey (Caldeira et al., 2015). In November 2017, an RE experi-       skeleton with ≤ 0.61 g skeleton cm–3 soil at 0.40 m depth, a cor-
     ment was implemented by mounting nontransparent half-pipe-            rection factor was introduced for some sensors. Data gaps caused
     PVC-tubes of 12.5 cm diameter 10–40 cm aboveground to                 by logger or sensor failure were gap filled with linear regressions.
     assure water run-off and minimize the influence on the soil sur-
     face. Plots were situated at flat positions in the landscape with a
                                                                           Sap flux density and transpiration
     negligible slope. At the start of the experiment, the RE coverage
     was 30% of the plot area, which was increased to 45% in April         Trees were equipped with Granier-type sap flow sensors (SFS2,
     2019. For measurements under ambient precipitation condi-             Type M-M12; UP GmbH, Ibbenbüren, Germany) at c. 1 m
     tions, we also established respective control plots, which resulted   height. The sensor probes with a 20-mm heating zone were
     in four different treatments: Control with Q. suber trees; RE         inserted 30 mm into conducting sapwood. Sapwood coring
     with Q. suber trees (RE); Q. suber trees invaded by C. ladanifer      revealed that the functional sapwood area of Q. suber was always
     shrubs (Invasion); and a RE invaded by C. ladanifer shrubs            > 30 mm (Caldeira et al., 2015). Sap flow calculations (see
     (Invasion + RE). As we were investigating different periods of        Haberstroh et al., 2020) followed the standard procedure sug-
     the hydrological year, including recovery phases, we use the          gested by Granier (1985) and Granier & Gross (1987). To deter-
     term reduced water availability for the RE treatments. In each        mine the maximum temperature difference between the needles,
     treatment, three trees and three shrubs (in invaded plots) were       which is required for the sap flow calculation, an average moving
     chosen randomly for long-term monitoring. For replication, we         window of three days was applied (Haberstroh et al., 2020).
     applied a randomized block design, with each treatment being          Shrub sap flow was measured with custom-made sap flow gauges,
     randomly assigned in each of three separate blocks, giving 12         comparable to the SGA13 (Dynamax Inc., Houston, TX, USA),
     experimental plots with a total of 36 trees and 18 shrubs. The        following the stem heat balance method (Sakuratani, 1984). All
     plot size of 180 m2 was sufficient as the measured trees and          sensors were recorded as half-hourly average on data loggers
     shrubs were positioned in the middle of the respective plots          (CR300/CR800/CR1000 and AM16/32 multiplexer; Campbell
     with a buffer zone at the edges. The lateral root system with         Scientific). Missing data resulting from sensor or data logger fail-
     sinkers of Q. suber was found to be within the tree crown             ure were gap-filled with linear regressions before and after the
     (David et al., 2013), which had an average size of 29.6  1.5         malfunctioning period for trees and shrubs. Shrub sap flow was
     m2 for the investigated trees. Shrub density was set to 11 000        corrected with an allometric equation for the increment of the
     individuals ha–1 at the start of the experiment in March 2018         functional sapwood area. For a better comparison of tree and
     in all invaded plots by cutting surplus shrubs. Measurements          shrub sap flow, sap flow per sapwood area was computed (sap
     were conducted in the hydrological years 2018 (October 2017–          flux density). We are aware that the use of two different sap flow
     September 2018), 2019 (October 2018–September 2019) and               measurement systems can hamper the upscaling to transpiration
     in the first half of the hydrological year 2020 (October 2019–        rates, which should thus be interpreted with care. Nevertheless,
     March 2020). Further information about the experimental               these sap flow methods have been applied successfully in the past
     design, field site and experiments are available in the Supporting    (Caldeira et al., 2015; Haberstroh et al., 2018) and there is evi-
     Information (Figs S1, S2) and previous studies (Caldeira et al.,      dence that they are comparable (Tournebize & Boistard, 1998).
     2015; Haberstroh et al., 2018, 2019; Dubbert et al., 2019).           The determination of sapwood area and the shrub increment cor-
                                                                           rection are presented in Methods S1, S2, Table S1 and Fig. S3.
                                                                              Daily transpiration was calculated as sap flux density (m3 m–2)
     Local meteorological conditions and volumetric soil water
                                                                           and the sapwood area per ground area (m²) for both species. The
     content
                                                                           exact values and procedures for the determination of sapwood per
     Meteorological parameters were monitored on each block. Pre-          ground area can be retrieved from Methods S3 and Table S2.
     cipitation was measured with rain gauges (ARG100, Campbell            The transpiration was summed up for each hydrological year to
     Scientific, Logan, UT, USA; RG1, Delta-T Devices Ltd, Cam-            calculate the ecosystem water balance. In addition, the study
     bridge, UK) and stored half-hourly on data loggers (CR300/            period was separated into three winter and two summer periods
     CR800, Campbell Scientific). The meteorological stations              according to the development of the sap flux density. The sum-
     included an air temperature and relative humidity sensor (RHT2,       mer periods were defined as the interval where sap flux was
     AT2, Delta-T Devices Ltd; S-THB-M002, Onset, MA, USA).                decreasing continuously up to the first increase after the autumn
     Data were stored every 30 min on independent data loggers             precipitation. For all periods, average transpiration rates per day
     (HOBO USB Micro Station Data Logger, Onset; ECH2O                     were calculated to account for the varying lengths of the different
     Em50, METER Group Inc., Pullman, WA, USA). Volumetric                 periods. Subsequently, we calculated the drought legacy effects for
     soil water content (VWC) was measured at three depths (0.05,          the different treatments in the winter periods, as the difference
     0.20, 0.40 m) with ECH2O 5TM probes (METER Group). Per                between actual tree transpiration in each treatment and expected
     plot, we installed two profiles to preclude sensor failure. Sensors   transpiration without stressor (Control) as following with Eqn 1:

     New Phytologist (2021) 231: 1784–1797                                                                                     Ó 2021 The Authors
     www.newphytologist.com                                                                       New Phytologist Ó 2021 New Phytologist Foundation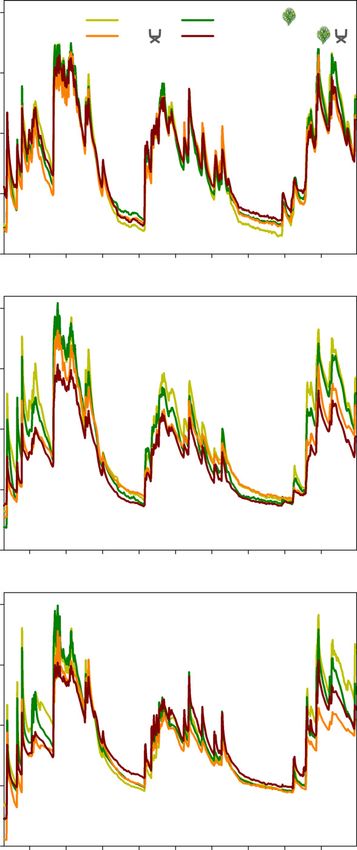
New
Phytologist                                                                                                                           Research 1787

                      E treatment  E control                           regional climate. E-OBS is issued by the European Climate
Legacy effect ð%Þ ¼                            100           Eqn 1     Assessment & Dataset project (ECA&D) and provides regularly
                              E control
                                                                        updated gridded temperature and precipitation fields for Euro-
(Etreatment, tree transpiration in one of the three applied treat-      pean land areas. The current ensemble version V20e (Cornes
ments (Invasion, RE, Invasion + RE); Econtrol, transpiration of         et al., 2018) has a regular 0.1° × 0.1° grid. The long-term clima-
trees in the Control treatment). This equation was adapted from         tology of annual temperature and precipitation was estimated for
Sala et al. (2012) to be consistent with the terminology used in        1981–2010 (reference period) focussing on hydrological years (1
arid and semi-arid ecosystems. To account for the absolute differ-      October to 30 September). Statistics were derived for the nearest
ence between the winter periods, results were standardized with         E-OBS grid point to the site location, the nine surrounding
the expected transpiration (Econtrol).                                  points, and for Southwestern (SW) Iberia (red box in Fig. 1a).
                                                                        The information is summarized in Table S3, together with the
                                                                        meteorological site measurements for 2017/2018 and 2018/
Definition of interaction effects                                       2019. Anomalies relative to the mean annual precipitation were
For the assessment of interaction effects on tree transpiration, we     computed to identify wet (exceedances) and dry periods
defined interaction effects stronger than the exposure to the single    (deficits). Finally, the temporal development of cumulative pre-
stressors as amplifying and interaction effects weaker than the         cipitation anomalies along the individual hydrological years was
exposure to the single stressors as buffering. Interaction effects,     analyzed for SW Iberia, allowing a direct comparison of the site
which did not differ substantially from the single stressors (         measurements with the wettest/driest years on record since 1950.
10%) were deemed neutral. The terms amplifying and buffering
are sometimes used as synonym for synergy and antagonism (e.g.          Data analysis
Cannon et al., 2017). However, for the determination of syn-
ergies or antagonisms, an additive or multiplicative null-model         We applied linear mixed effect models (package NLME) in R (R
usually is defined (Piggott et al., 2015; Côté et al., 2016), which   core team, 2020) to account for the randomized block design. Dif-
could lead to unrealistically low transpiration rates for our ecosys-   ferences in VWC were assessed by comparing the four different
tem. Hence, we base our argumentation on the comparison                 treatments, the three depths (0.05, 0.20, 0.40 m) and their interac-
between the interaction effect and the effect of the stronger single    tion in the same model. Tree and shrub sap flux density were ana-
stressor (cf. Holmstrup et al., 2010).                                  lyzed separately with treatment as fixed factor. For ΨPD, trunk
                                                                        increment, LAI, transpiration and legacy effect in tree transpira-
                                                                        tion, treatment and measurement periods were treated as fixed
Leaf water potential, leaf area index and trunk increment               effects and their interaction considered. For all linear mixed effect
Leaf water potential was measured at pre-dawn (ΨPD) with a              models, we handled block and tree/shrub identity, if applicable, as
Scholander-type pressure chamber (PMS 1000; PMS Instruments,            random effects. For a species comparison of sap flux densities and
Corvalis, OR, USA) between 02:00 and 06:00 h. For each tree             transpiration rates, we applied additional linear mixed effect mod-
and shrub, we measured two leaves (trees) or small branches             els and handled the experimental treatment as supplementary ran-
(shrubs). Leaf area index (LAI) was measured at dusk and dawn           dom factor. Model assumptions (normal distribution of residuals
with the LAI-2000 plant canopy analyser (Li-Cor Inc., Lincoln,          and variance homogeneity) were checked visually and supported
NE, USA). For trees, one measurement was taken in an open               by the Shapiro–Wilk and Levene tests in R (R Core Team, 2020).
space; subsequently 10 measurements were taken under the canopy         In the case of violations, data were square-root- or log-
with the same orientation. Afterwards, we removed the 68° ring          transformed. Subsequently, differences between treatments and
from the measurement with the software FV2200 (Li-Cor), as this         measurement periods were assessed by a pairwise Tukey-adjusted
outer ring was most likely measuring clear sky (Li-Cor, 1992). For      comparison of the means. The exact packages and commands can
shrubs, we measured 15 points along each transect (n = 3) of 10         be found in Table S4. In this publication, we will try not to base
m per plot. For all measurements, we used the 45° view cap to           our argumentation and conclusions solely on P-values, but rather
avoid any influence of the operator or tree trunks (Li-Cor, 1992).      use them to support our argumentation (Wasserstein et al., 2019).
LAI measurements were conducted each spring after the growing
period in late June and each autumn after the natural summer            Results
drought in October. In March 2018, all trees were equipped with
dendrometers (DB20 manual band dendrometer; EMS, Brno,                  Abiotic conditions: meteorology and volumetric soil water
Czech Republic) at breast height and read manually at least every       content
month to calculate the tree trunk increment.
                                                                        In terms of mean air temperature, both hydrological years were
                                                                        comparable with 15.9°C in 2018 and 16.4°C in 2019 at the site,
Meteorological and climatic conditions
                                                                        which were similar to the long-term average of 16.7–16.8°C for
We evaluated the temperature and precipitation conditions for           E-OBS (Table S3). The comparison with precipitation records
the two measurement years based on the observational dataset E-         since 1950 revealed that the hydrological year of 2018 corre-
OBS (Haylock et al., 2008) and put these in context of the              sponded to an average year for SW Iberia. When looking at

Ó 2021 The Authors                                                                                         New Phytologist (2021) 231: 1784–1797
New Phytologist Ó 2021 New Phytologist Foundation                                                                    www.newphytologist.com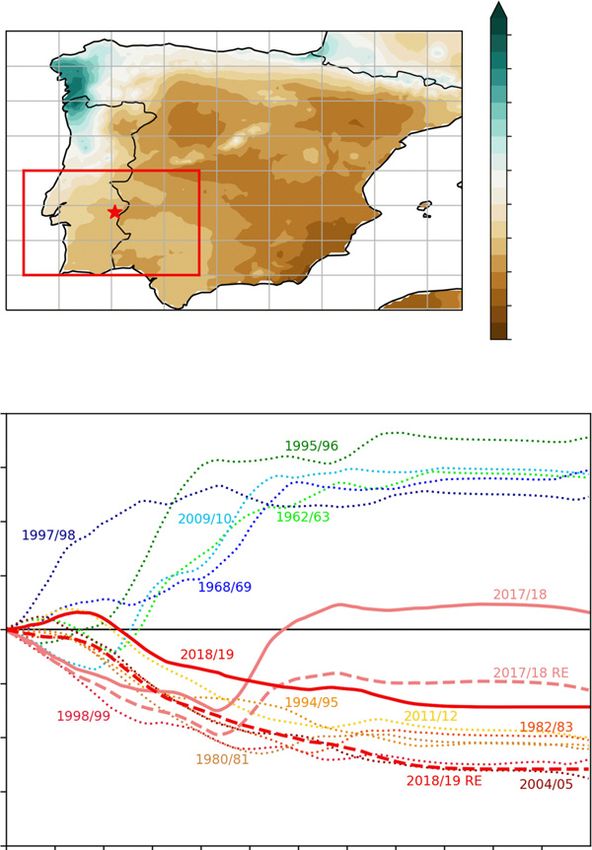
New
1788 Research                                                                                                                           Phytologist

     seasonal trends (Fig. 1b), 2018 was characterized by a precipita-
                                                                                         (a)
     tion deficit in winter, which was compensated by rainfall starting
     in early spring. Under the RE, 2018 was a moderately dry year.
     2019 was a moderately dry year under ambient conditions (–112
     mm by the end of September; Fig. 1b), with below-normal pre-
     cipitation in all months except November and December. With
     the RE, 2019 became an extremely dry year (–258 mm; Fig. 1b),
     similar to the driest year on record since 1950, namely 2004/05
     (–276 mm; Garcı́a-Herrera et al., 2007). Overall, the site mea-
     surements are largely consistent with the E-OBS data, with
     exception of a strong deviation in precipitation in 2018 (713 mm
     vs 518 mm; Table S3). This large deviation is associated with the
     occurrence of localized convective precipitation events (thunder-
     storms) in late February and March 2018. Given the nature of
     this type of rainfall events, which produce very heterogeneous
     spatial precipitation patterns, these large precipitation amounts                   (b)
     were not captured by the (area averaged) E-OBS data (Fig. S4).
        The VWC developed according to the precipitation occur-
     rence (Fig. 2). Soils were wet from November 2017 until June
     2018, followed by the summer dry-down period from July to
     mid October 2018. Frequent precipitation occurrence until April
     2019 was superseded by an extended drought period from April
     to the end of October 2019, which was reflected in low VWC
     during this period. Overall, there were strong differences between
     treatments, depths and their interaction (all P < 0.001). Inte-
     grating over the complete soil profile, strong variations could be
     observed between ambient precipitation (Control and Invasion)
     and RE treatments (Fig. 2; all P < 0.001). At 0.20 m depth all
     treatments differed in their VWC (P < 0.001): in the summer
     drying periods, the Invasion and Invasion + RE (Fig. 2b) treat-
                                                                                         (c)
     ments showed a stronger dry-down in the soil profile. Overall, on
     the one hand, the VWC at 0.20 m depth (Fig. 2b) for Inva-
     sion + RE (0.11  0.04 m3 m–3) was reduced by 18% on aver-
     age during the summer periods in comparison to the Control
     (0.13  0.06 m3 m–3). On the other, in the winter periods when
     soil water resources recharged, both RE treatments with and
     without Invasion received less precipitation (Fig. 2). In these
     periods, trees and shrubs in the Invasion + RE treatment
     (0.18  0.06 m3 m–3) received 24% less water on average at
     0.20 m depth (Fig. 2b) than the Control treatment
     (0.24  0.08 m3 m–3).

     Plant water status
     The patterns observed in precipitation and VWC (Fig. 2) were
     reflected in tree and shrub water status, which led to different       Fig. 2 Volumetric water content in m3 m–3 for Control, Invasion, rain
                                                                            exclusion (RE) and Invasion + RE treatments at 0.05 (a), 0.20 (b) and
     patterns of sap flux density and leaf water potential during the
                                                                            0.40 m (c) depth (n = 6 per treatment and depth).
     two hydrological years (Fig. 3). Although mean tree sap flux den-
     sities varied only marginally between treatments (P = 0.11), dif-
     ferences emerged after dividing the study period into several          onset of summer drought (Fig. 3a). Similar sap flux densities
     seasons (Fig. 3a). During summer 2018, all experimentally              were observed in trees under Invasion and trees under RE, which
     stressed trees reached similar sap flux densities, and only Control    were distinctly lower than Control trees. In general, shrub sap
     trees had slightly higher values. In 2019, maximum sap flux den-       flux densities were higher than those of trees (P < 0.001). In
     sities were lower compared to 2018 for all trees, yet to a different   2018, they were approximately four-fold higher (max.
     extent. In particular, trees with Invasion + RE reached a lower        8.66  0.83 m3 m–2 d–1) but only two-fold higher in 2019
     maximum and their sap flux densities decreased earlier with the        (max. 4.69  0.31 m3 m–2 d–1) compared to Control trees,

     New Phytologist (2021) 231: 1784–1797                                                                                        Ó 2021 The Authors
     www.newphytologist.com                                                                          New Phytologist Ó 2021 New Phytologist Foundation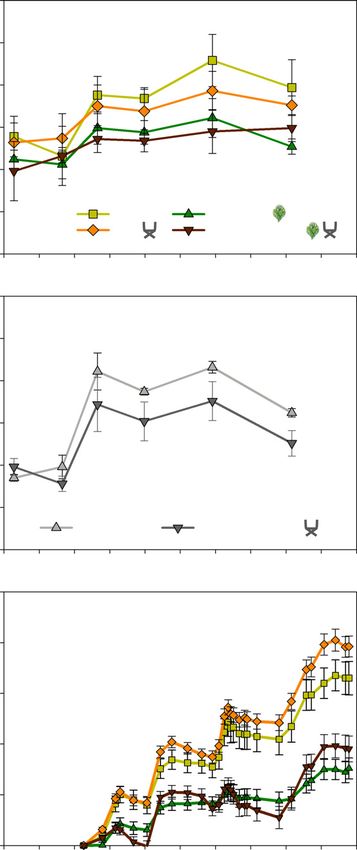
New
Phytologist                                                                                                                                        Research 1789

             (a)                                                                           (b)

             (c)                                                                           (d)

Fig. 3 Daily sap flux density for Quercus suber (n = 9 per treatment) (a) and Cistus ladanifer (n = 9 per treatment) (c) in m3 m–2 d–1 with 95%
confidence interval and pre-dawn leaf water potential for Q. suber (n = 9 per treatment) (b) and C. ladanifer (n = 9 per treatment) (d) in MPa with
standard error (1 SE). Sap flux density was smoothed for plotting purposes (negative exponential). Asterisks indicate significance level (pairwise Tukey-
adjusted comparison of the means): *, P < 0.05; **, P < 0.01; ***, P < 0.001. Note the different scales between species. RE, rain exclusion.

indicating a strong reduction from 2018 to 2019 (Fig. 3c). The                   interesting patterns (Fig. 3a,c). In 2018, all trees and shrubs had
RE reduced the overall sap flux densities of the shrubs substan-                 similar sap flux densities, and in the following recovery period in
tially (P < 0.001). Also, for ΨPD, the different drying patterns of              winter 2019, Control trees had higher sap flux densities compared
the two years were evident (Fig. 3b,d). In 2019, ΨPD of all trees                to all other treatments. However, in winter 2020, an interesting
and shrubs decreased earlier in the year and the recovery after the              pattern emerged when comparing the trees under shrub Invasion
autumn rainfalls was slower compared to 2018. Treatment differ-                  with and without RE: trees under Invasion + RE did recover with
ences between trees with Invasion and trees with the RE were                     only slightly lower sap flux densities (max. 0.85  0.12 m3 m–
                                                                                 2 –1
moderate, but became distinct in September 2018 (P < 0.05;                         d ) than Control trees (max. 1.02  0.21 m3 m–2 d–1). Sur-
Fig. 3b). Moreover, ΨPD of Control trees was higher (–1.46                      prisingly, sap flux densities of trees under Invasion under ambient
0.09 MPa) compared to trees under Invasion +RE (–1.64                           rainfall did not recover to the same extent (max.
0.10 MPa) during the summer drying period in July 2019 (P <                      0.45  0.11 m3 m–2 d–1) (Fig. 3a). Shrubs in the same treat-
0.05), which reflected sap flux density measurements (Fig. 3a).                  ment, however, showed a strong recovery in sap flux densities
   Differences between leaf water potentials of Control (–0.46                  (max. 3.80  0.30 m3 m–2 d–1), almost reaching the maximum
0.05 MPa) and trees under Invasion + RE (–0.64  0.08 MPa)                       rates of the previous year 2019 (4.69  0.31 m3 m–2 d–1) (Fig.
(P < 0.05) persisted during the winter period in late October and                3c). By contrast, sap flux densities of shrubs under RE recovered
early December 2019 (Fig. 3b). Likewise, differences were evident                more slowly (max. 2.88  0.32 m3 m–2 d–1) (Fig. 3c).
for shrub leaf water potentials with –0.60  0.04 MPa in the
Invasion treatment and –0.85  0.03 MPa under the RE treat-
                                                                                 Ecosystem transpiration
ment (P < 0.001) in March 2020 (Fig. 3d). In the winter recovery
periods of 2018 and 2019, no clear differences were detected in                  Figure 4 illustrates the cumulative transpiration rates for all treat-
shrubs ΨPD. However, the daily sap flux densities revealed                       ments, species and hydrological years. Although the Control trees

Ó 2021 The Authors                                                                                                      New Phytologist (2021) 231: 1784–1797
New Phytologist Ó 2021 New Phytologist Foundation                                                                                 www.newphytologist.com
New
1790 Research                                                                                                                                  Phytologist

                                                                   (a)                                                                            (b)

                                                                                            (d)
                  (c)

     Fig. 4 Transpiration for the hydrological year 2017/2018 (a) and 2018/2019 (b) for all tree (n = 9 per treatment) and shrub (n = 9 per treatment)
     treatments in mm. Ecosystem transpiration for the hydrological year 2017/2018 and 2018/2019 with standard error (1 SE) (c) for all ecosystems (n = 9 per
     species and treatment) in mm and daily average ecosystem transpiration in mm d–1 (n = 9 per species and treatment) for winter and summer phases
     throughout the study period with 1 SE (d). For winter and summer phases see Figure 3. Different letters indicate a P-value < 0.05 (pairwise Tukey-
     adjusted comparison of the means) for each hydrological year/season separately. RE, rain exclusion.

                                                                                   reduced their maximum sap flux densities in 2019 compared to
                                                                                   2018 (Fig. 3a), overall cumulative rates remained stable at
                                                                                   around 300 mm between years (Fig. 4a–c, 2018: 296  46 mm;
                                                                                   2019: 291  55 mm). For all other treatments, cumulative tran-
                                                                                   spiration was reduced in 2019 (Fig. 4b,c). This effect was most
                                                                                   pronounced for shrub transpiration, which declined by 41%
                                                                                   (Invasion, P < 0.01) and 43% (RE, P < 0.001). Tree transpira-
                                                                                   tion was reduced by 14% for trees under Invasion, 16% for trees
                                                                                   under RE and 23% for trees under Invasion + RE relative to
                                                                                   2018, respectively (all P > 0.05) (Fig. 4a–c). Ecosystem transpi-
                                                                                   ration (Fig. 4c) dropped by 30% (Invasion) and 34% (Inva-
                                                                                   sion + RE) (both P < 0.01) from 2018 to 2019. In 2019, the
                                                                                   transpiration of the invaded ecosystem with and without RE were
                                                                                   close to or surpassed the precipitation input without taking into
     Fig. 5 Transpiration legacy for Quercus suber trees (n = 3) in % in
                                                                                   account evaporation losses (Fig. 4c). These results should be han-
     comparison to the Control treatment with standard error (1 SE) for the
     winter periods 2018, 2019 and 2020. For calculations see Eqn 1. RE, rain      dled with care, as uncertainties during transpiration upscaling
     exclusion.                                                                    cannot be excluded. However, Q. suber trees do mainly use deep

     New Phytologist (2021) 231: 1784–1797                                                                                                Ó 2021 The Authors
     www.newphytologist.com                                                                                  New Phytologist Ó 2021 New Phytologist Foundation
New
Phytologist Research 1791
The overall highest transpiration rates were observed during the
(a) summer of the normal precipitation year 2018 (P < 0.001),
where the invaded treatments with and without RE had a clearly
higher ecosystem transpiration compared to Control and RE
without shrubs (P < 0.001). The situation changed during sum-
mer drought in the following year 2019, where Control trees
transpired slightly more water on average than shrubs and trees
combined under the RE. This was mostly the consequence of a
substantial reduction in tree transpiration (–47% vs Control
trees), especially compared to the effect of the single stressors in
this period (Fig. 4d). An extensive comparison of the reductions
in tree transpiration is given in the Table S5.
Winter transpiration was slightly higher in 2019 compared to
2018, but lowest in 2020 (P < 0.05) after the severe summer
drought. Although there was a clear differentiation between non-
(b)
invaded and invaded treatments in the winter period 2018 (P <
0.05), differences started to vanish in the 2019 recovery period
(Fig. 4d). In winter 2020, Control and trees under RE reached
slightly lower, but similar transpiration levels as in winter 2018.
The ecosystem transpiration in Invasion and Invasion + RE,
however, did not reach comparable levels (Fig. 4d). For the
ecosystem under Invasion, the majority of this reduction was
attributable to a decline in tree transpiration, which showed a
legacy of 51% compared to the Control ecosystem (Fig. 5). Yet,
in the ecosystem with Invasion + RE, shrubs and trees con-
tributed equally to ecosystem transpiration (Fig. 4d). Trees only
expressed a legacy of 25% compared to the Control tree transpi-
ration (Fig. 5). Such patterns were not evident in the winter peri-
(c) ods before 2020, when trees in all three experimental treatments
showed a similar legacy (Fig. 5).
Growth indicators
After 2017, which was a dry year, the LAI increased for trees and
shrubs (Fig. 6a,b). For Q. suber this pattern continued in 2019
(Fig. 6a), whereas shrubs reduced their leaf area (Fig. 6b). Shrubs
under the RE had a clearly lower LAI after April 2018 (P <
0.05). Invaded trees, independent of the RE, had a lower LAI
than the ones in the Control or RE treatment (Fig. 6a). In April
2018 and 2019, Control trees differed clearly from trees with
Invasion + RE (P < 0.05). However, in spring 2020 the
strongest variation was found between Control and Invaded trees
(Fig. 6a; P < 0.05). Dendrometer readings of the trunk incre-
Fig. 6 Leaf area index for Quercus suber (n = 9 per treatment) (a) and
ment supported the LAI measurements (Fig. 6c). Control and
Cistus ladanifer (n = 9 per treatment) (b) in m2 m–2 with standard error (1
SE) and trunk increment in mm for Q. suber (n = 7–9 per treatment) with trees under RE had higher trunk increments than invaded trees
1 SE (c). Asterisks indicate significance level (pairwise Tukey-adjusted with or without RE over time.
comparison of the means): *, P < 0.05; **, P < 0.01; ***, P < 0.001. RE,
rain exclusion.
Discussion
groundwater for transpiration in the summer periods (e.g. Kurz- Reduced water availability and shrub invasion both pose strong
Besson et al., 2014). threats to the functioning and recovery of Quercus suber ecosystems
Dividing the study period into summer and winter periods in the Mediterranean basin. With this study, we investigated both
(Fig. 3a) revealed different seasonal patterns of ecosystem tran- stressors and their interaction in the natural drought and recovery
spiration between treatments (Fig. 4d). In general, the ecosystem periods to determine the effect dynamics. Interestingly, there was
under Invasion had the highest transpiration rates in all seasons, an amplifying interaction of reduced water availability and shrub
followed by the ecosystem with Invasion + RE, Control and RE. invasion during the severe summer drought in 2019, which shifted
Ó 2021 The Authors New Phytologist (2021) 231: 1784–1797
New Phytologist Ó 2021 New Phytologist Foundation www.newphytologist.comNew
1792 Research Phytologist
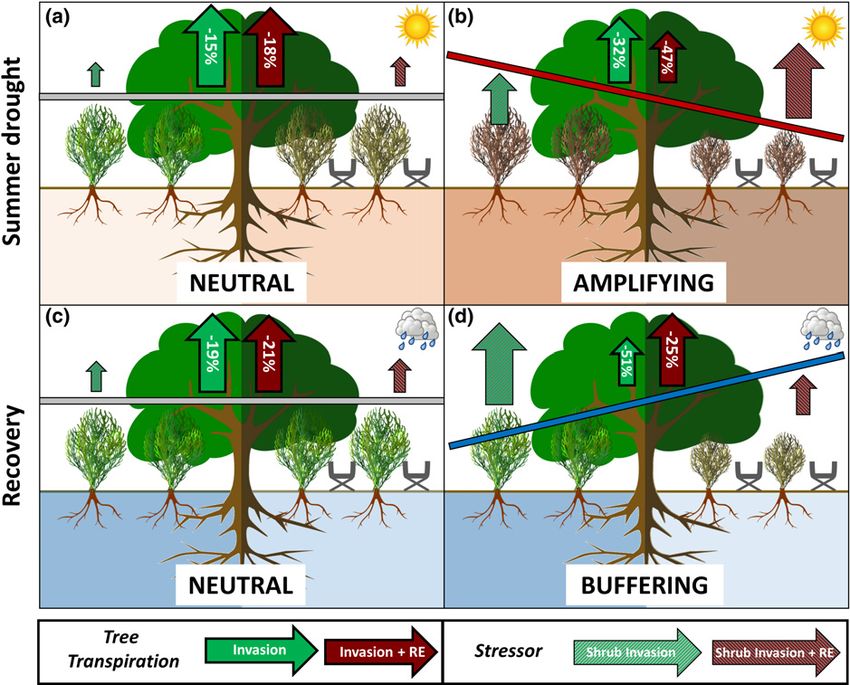
Fig. 7 Conceptual illustration of the interaction effects of shrub invasion and extreme drought for the summer drought period 2018 (a) and 2019 (b) and
the recovery periods 2018/2019 (c) and 2019/2020 (d) for Quercus suber trees growing under invaded (left side) and invaded and RE conditions (right
side). The size of the arrows above the trees is proportional to the absolute tree transpiration. The numbers in the arrows show the reduction in tree
transpiration compared to Control trees. The size of the arrows above the shrubs (and RE) illustrates the impact of the stressors shrub invasion and RE. The
bars indicate the interaction direction of extreme drought and plant invasion. Grey = neutral; red = amplifying; blue = buffering. RE, rain exclusion.
to a buffering effect in the following recovery period (Fig. 7). This However, trees under the RE without shrubs were affected
demonstrates the highly dynamic nature of these interaction only mildly by the RE. The slight reduction in transpiration
effects, which will be discussed in detail in the following. might be a result of diminished winter and spring precipitation,
as our experiment continuously excluded 30–45% of water from
the ecosystem. Lower transpiration rates also have been demon-
Reduced water availability and shrub invasion act
strated for experimentally drought stressed holm oak (Quercus
amplifying during extreme drought
ilex) trees all year round, even under well-watered conditions
During the investigated summer periods, reduced water availabil- (Limousin et al., 2009). Winter and spring precipitation is criti-
ity and shrub invasion acted either neutral (2018) or strongly cal for plants in semi-arid ecosystems to withstand summer
amplifying (2019) on the tree transpiration (Fig. 7a,b). In 2019, drought (Piayda et al., 2014; Caldeira et al., 2015; Forner et al.,
where we imposed the second driest year on record since 1950 a 2018).
strong competition for water resources between trees and shrubs Large spring rainfalls in 2018 also reduced the competitive
was triggered in the combined treatment (Fig. 7b), which was effects of shrubs on trees in the Invasion + RE treatment (Fig.
reinforced by the high water use strategy of Cistus ladanifer. This 7a). Leaf water potentials indicated a higher water availability for
supports the prediction of the stress gradient hypothesis (SGH) Q. suber than in dry years (Kurz-Besson et al., 2014; Haberstroh
that competitive effects occur under extremely low water avail- et al., 2018) and in dry years under invasion (Caldeira et al.,
ability (Armas & Pugnaire, 2005; Maestre et al., 2009; Michalet 2015). Net facilitation, as predicted by the SGH (Maestre et al.,
et al., 2014; O’Brien et al., 2016). The strong reduction in tree 2009), did not occur. This implies that shrubs did not strongly
transpiration by 47% can severely limit C uptake, induce xylem increase nor decrease the overall water availability for trees, but
embolism and lead to a chronical decline of Q. suber trees rather used different soil water resources, which resulted in neu-
(Camilo-Alves et al., 2017), potentially with detrimental drought tral interaction effects (Fig. 7a). This fits the concept of hydro-
legacy effects on the whole ecosystem (Caldeira et al., 2015; logical niche segregation (Araya et al., 2011), where co-existing
Seneviratne & Ciais, 2017). Thus, the results for 2019 confirm plants occupy different temporal and spatial niches under moder-
our hypothesis that the interaction of shrub invasion and drought ate drought conditions and do not necessarily compete strongly
has detrimental effects on the ecosystems’ functioning in the for water resources so long as water reserves are sufficient
summer drought period in extremely dry years. (Rodrı́guez-Robles et al., 2020).
New Phytologist (2021) 231: 1784–1797 Ó 2021 The Authors
www.newphytologist.com New Phytologist Ó 2021 New Phytologist FoundationNew
Phytologist Research 1793
Quercus macrocarpa can switch on a daily basis from competition
Buffering interaction effects in the recovery after a severe
to facilitation, depending on the predominant environmental
drought
conditions. It also has been pointed out that tree diversity per se
By contrast with all other assessed periods (Fig. 7), the interac- does not systematically increase drought resistance in forests, as
tion of reduced water availability and shrub invasion resulted in a changing environmental conditions lead to complex interactions
buffering effect in the recovery after the dry year 2019 (Fig. 7d), between tree species with both, negative and positive impacts on
which contradicts our hypothesis, that detrimental interaction ecosystems (Grossiord, 2019).
effects occur in the winter recovery periods. Instead, transpiration In future decades, meteorological conditions similar to our RE
of invaded trees under ambient precipitation was reduced by experiment might become more prevalent, given that the fre-
>50%, whereas tree transpiration in the combined treatment was quency, intensity and duration of drought are projected to
diminished only by 25%. These contrasting tree responses are increase under changing climate conditions for large parts of the
best explained by investigating the response of the invader: shrubs Mediterranean including the Iberian Peninsula (Seneviratne
under RE showed a drought legacy as a consequence of the sum- et al., 2012; Kirtman et al., 2013; Touma et al., 2015; Seager
mer drought 2019. This supports the hypothesis that under cer- et al., 2019; Spinoni et al., 2020). Based on the new Climate
tain conditions the competitive strength of invaders declines in a Model Intercomparison Project – Phase 6 ensemble (CMIP6;
low-resource environment (Brooker et al., 2005), even after stress Eyring et al., 2016), Ukkola et al. (2020) detected enhanced and
relief. Our RE experiment induced a stress effect on shrubs more consistent drought changes during the 21st Century com-
beyond a critical threshold, where their recovery was strongly pared to CMIP5 (Taylor et al., 2012). In particular, Cook et al.
diminished (Fig. 7d), resulting in lower sap flux densities, tran- (2020) identified an increasing intensity and incidence of
spiration and leaf area index (LAI). By contrast, shrubs under drought in our study region for a wide range of scenarios. Cook
ambient precipitation were not stressed as strongly during the et al. (2020) argued that soil moisture and runoff reduction
summer drought 2019 (Fig. 7b) and, therefore capable of profit- apparently play a more crucial role than the changes in precipita-
ing from the increased water availability in the following winter tion itself, indicating the importance of temperature-sensitive
(Fig. 7d). Shrubs thus were strong competitors under wet condi- drought processes such as evapotranspiration. Given this marked
tions, confirming results obtained in other ecosystems (Callaway impact of reduced water availability and shrub invasion during
& Walker, 1997; Ploughe et al., 2019). Hence, the recovery of drought and recovery periods, the persistence of valuable Q. suber
tree transpiration was determined by the drought legacy effects ecosystems and similar invaded systems is uncertain and strongly
on shrubs. This response of the shrubs potentially is related to a threatened by ongoing climate change. Thus, management strate-
precipitation threshold, determining their competitiveness in the gies, such as reducing the density of shrubs or removing them
following recovery period. There is evidence that the shrubs are completely from the ecosystem are highly recommended to
still highly competitive at an annual precipitation of c. 400 mm increase the resilience of ecosystems to extreme drought. Such
(Caldeira et al., 2015), which precisely matched our measure- positive effects resulting from thinning have been demonstrated
ments for the shrubs under ambient precipitation in the hydro- in a Mediterranean Q. ilex forest (Gavinet et al., 2019) and
logical year 2019. provide evidence that management strategies can have a stronger
impact on ecosystem functioning than simulated climate change
in the form of precipitation manipulation. Nevertheless, further
Stress interactions are highly dynamic and nonlinear
studies are required to determine the implications of drought for
This study highlights that invasive shrubs modulated the transpi- Q. suber and comparable Mediterranean ecosystems, as progress-
ration response of Q. suber trees in a highly dynamic way. The ing drought and plant invasion might trigger detrimental nonlin-
direction of interaction was strongly dependent on the predomi- ear responses in the future, potentially contributing to the global
nant meteorological conditions and ranged from neutral to tree mortality patterns observed already (Allen et al., 2015).
amplifying to buffering responses (Fig. 7). This implies that the
interaction of shrub invasion and drought did not reduce the tree
Conclusion
transpiration in a linear way. This deduction is based on the fact
that the competitive impact of the shrubs cannot increase linearly Our study demonstrates that noninvaded Q. suber ecosystems
with increasing drought stress, as shrubs are, at some point, also seem to be well-adapted to withstand regular drought impacts.
negatively affected by reduced water availability. Physiological However, (additional) shrub invasion strongly enhanced transpi-
responses of plants to environmental stressors often are nonlinear ration losses, which could lead to a long-term groundwater deple-
(e.g. Malkinson & Tielbörger, 2010; Holmgren et al., 2012), tion (Acharya et al., 2018). Yet, as Q. suber relies on groundwater
which further supports the notion that nonlinear responses of in the summer periods (David et al., 2013; Dubbert et al., 2019),
ecosystem processes to interacting stressors might actually be a this might be critical for survival (Mendes et al., 2016) and over-
common effect (Côté et al., 2016). For example, Sheffer et al., all ecosystem functioning (Peñuelas et al., 2017). Other measures
(2020) observed negative effects of Pinus halepensis on Quercus such as lower LAI and trunk increments of invaded trees point
calliprinos water status during summer drought, which shifted to towards a persistent lower tree C assimilation, which in the long
a neutral or buffering effect in the wet winter periods. Wright term may lead to C legacies (Anderegg et al., 2015) with trees
et al. (2015) even demonstrated that plant interactions involving unable to fully recover their ability for C assimilation after stress
Ó 2021 The Authors New Phytologist (2021) 231: 1784–1797
New Phytologist Ó 2021 New Phytologist Foundation www.newphytologist.comNew
1794 Research Phytologist
relief. Such processes could further jeopardize the persistence of Data availability
Q. suber ecosystems. Thus, it will be of high importance to inves-
tigate if the invaded ecosystem might change in favour of the The data that support the findings of this study are available from
invasive species (cf. Prieto et al., 2009; Caldeira et al., 2015; the corresponding author upon reasonable request. All data used
Lloret et al., 2016; Ogaya & Peñuelas, 2020) or if drought legacy in the meteorological and climatological modelling is freely avail-
effects on shrubs will result in a decline of the invader. able at http://www.uerra.eu and https://www.ecad.eu.
In conclusion, this study clearly demonstrates that the interac-
tion of drought and shrub invasion is highly dynamic and non- References
linear, ranging from amplifying to neutral to buffering effects. Acácio V, Holmgren M. 2014. Pathway for resilience in Mediterranean cork oak
These effects change in dependence of the predominant environ- land use systems. Annals of Forest Science 71: 5–13.
mental conditions, as well as during drying and recovery periods. Acácio V, Holmgren M, Rego F, Moreira F, Mohren GMJ. 2009. Are drought
In this regard, further experimental evidence and combined mod- and wildfires turning Mediterranean cork oak forests into persistent shrublands?
elling efforts could help to improve our understanding of these Agroforestry Systems 76: 389–400.
Acharya BS, Kharel G, Zou CB, Wilcox BP, Halihan T. 2018. Woody plant
nonlinear interaction effects and help preserve valuable ecosys- encroachment impacts on groundwater recharge: a review. Water 10: 1466.
tems around the globe. Alba C, Fahey C, Flory SL. 2019. Global change stressors alter resources and shift
plant interactions from facilitation to competition over time. Ecology 100:
e02859.
Acknowledgements Allen CD, Breshears DD, McDowell NG. 2015. On underestimation of global
vulnerability to tree mortality and forest die-off from hotter drought in the
We would like to acknowledge funding from the DFG (WE Anthropocene. Ecosphere 6: 1–55.
2681/10-1 and PI 1179/2-1) and FCT (Lisboa-01-0145- Anderegg W, Schwalm C, Biondi F, Camarero Jj, Koch G, Litvak M, Ogle K,
FEDER-030406–PTDC/ASP-SIL/3406/2017). RL-d-V was Shaw Jd, Shevliakova E, Williams Ap et al. 2015. Pervasive drought legacies in
funded by FCT researcher contracts (PTDC/ASP-SIL/3406/ forest ecosystems and their implications for carbon cycle models. Science 349:
2017 and CEECIND/02735/2018). Centro de Estudos 528–532.
Araya YN, Silvertown J, Gowing DJ, McConway KJ, Linder HP, Midgley G.
Florestais (CEF) is a research unit funded by FCT, Portugal 2011. A fundamental, eco-hydrological basis for niche segregation in plant
(UID/AGR/00239/2019). JGP thanks the AXA Research Fund communities. New Phytologist 189: 253–258.
for support. SH was partially funded by a scholarship of the Ger- Armas C, Pugnaire FI. 2005. Plant interactions govern population dynamics in a
man Academic Foundation. We sincerely thank Maren Dubbert, semi-arid plant community. Journal of Ecology 93: 978–989.
Helena Boedekker and Joaquim Mendes for help and support Bertness MD, Callaway R. 1994. Positive interactions in communities. Trends in
Ecology & Evolution 9: 191–193.
during the field and laboratory work. Thanks to Fundação da Bradley BA, Blumenthal DM, Early R, Grosholz ED, Lawler JJ, Miller LP,
Casa de Bragança for permission to undertake research in Tapada Sorte CJB, D’Antonio CM, Diez JM, Dukes JS et al. 2012. Global change,
Real de Vila Viçosa. We acknowledge the E-OBS dataset from global trade, and the next wave of plant invasions. Frontiers in Ecology and
the EU-FP6 project UERRA (http://www.uerra.eu) and the Environment 10: 20–28.
Copernicus Climate Change Service, and the data providers in Brooker RW. 2006. Plant-plant interactions and environmental changes. New
Phytologist 171: 271–284.
the ECA&D project (https://www.ecad.eu). Brooker R, Kikvidze Z, Pugnaire FI, Callaway RM, Choler P, Lortie CJ,
Michalet R. 2005. The importance of importance. Oikos 109: 63–70.
Bugalho MN, Caldeira MC, Pereira JS, Aronson J, Pausas JG. 2011.
Author contributions Mediterranean cork oak savannas require human use to sustain biodiversity and
CW and MCC conceived and designed the experiment; SH per- ecosystem services. Frontiers in Ecology and Environment 9: 278–286.
Caldeira MC, Ibá ñez I, Nogueira C, Bugalho MN, Lecomte X, Moreira A,
formed the experimental fieldwork, collected the data and main- Pereira JS. 2014. Direct and indirect effects of tree canopy facilitation in the
tained the measuring system with RL-d-V, JIM and MCC; SH recruitment of Mediterranean oaks. Journal of Applied Ecology 51: 349–358.
analyzed the data; JM and JGP analyzed the climatic/meteorolog- Caldeira MC, Lecomte X, David TS, Pinto JG, Bugalho MN, Werner C. 2015.
ical data; and SH wrote the manuscript with input from CW and Synergy of extreme drought and shrub invasion reduce ecosystem functioning
MCC. All co-authors contributed significantly and discussed the and resilience in water-limited climates. Scientific Reports 5: 15110.
Callaway RM, Walker LR. 1997. Competition and facilitation: a synthetic
manuscript. approach to interactions in plant communities. Ecology 78: 1958–1965.
Camilo-Alves CSP, Vaz M, Esteves Da Clara MI, Ribeiro NM. 2017. Chronic
cork oak decline and water status: new insights. New Forests 48: 753–772.
ORCID Cannon JB, Peterson CJ, O’Brien JJ, Brewer JS. 2017. A review and
Maria C. Caldeira https://orcid.org/0000-0002-3586-8526 classification of interactions between forest disturbance from wind and fire.
Forest Ecology and Management 406: 381–390.
Simon Haberstroh https://orcid.org/0000-0002-6097-6633 Carey MP, Sanderson BL, Barnas KA, Olden JD. 2012. Native invaders –
Raquel Lobo-do-Vale https://orcid.org/0000-0003-4566- challenges – challenges for science, management, policy, and society. Frontiers
5420 in Ecology and Environment 10: 373–381.
Joana I. Martins https://orcid.org/0000-0002-8620-6856 Castro SP, Esch EH, Eviner VT, Cleland EE, Lipson DA. 2020. Exotic
Julia Moemken https://orcid.org/0000-0002-9432-0202 herbaceous species interact with severe drought to alter soil N cycling in a semi-
arid shrubland. Geoderma 361: 114111.
Joaquim G. Pinto https://orcid.org/0000-0002-8865-1769 Cavaleri MA, Sack L. 2010. Comparative water use of native and invasive plants
Christiane Werner https://orcid.org/0000-0002-7676-9057 at multiple scales: a global meta-analysis. Ecology 91: 2705–2715.
New Phytologist (2021) 231: 1784–1797 Ó 2021 The Authors
www.newphytologist.com New Phytologist Ó 2021 New Phytologist FoundationNew Phytologist Research 1795 Cook BI, Mankin JS, Marvel K, Williams AP, Smerdon JE, Anchukaitis KJ. Giorgi F. 2006. Climate change hot-spots. Geophysical Research Letters 33: 2020. Twenty-first century drought projections in the CMIP6 forcing L08707. scenarios. Earth’s Future 8: e2019EF001461. Gleason KE, Bradford JB, Bottero A, D’Amato AW, Fraver S, Palik BJ, Cornes R, van der Schrier G, van den Besselaar EJM, Jones PD. 2018. An Battaglia MA, Iverson L, Kenefic L, Kern CC. 2017. Competition amplifies ensemble version of the E-OBS temperature and precipitation datasets. Journal drought stress in forests across broad climatic and compositional gradients. of Geophysical Research: Atmospheres 123: 9391–9409. Ecosphere 8: e01849. Correia O, Ascensao L. 2016. Summer semi-deciduous species of the Granier A. 1985. Une nouvelle méthode pour la mesure du flux de sève brute Mediterranean landscape: a winning strategy of cistus species to face the dans le tronc des arbres. Annales des Sciences Forestières 42: 193–200. predicted changes of the Mediterranean climate. In: Ansari AA, Gill SS, Abbas Granier A, Gross P. 1987. Mesure du flux de sève brute dans le tronc du Douglas ZK, Naeem M, eds. Plant biodiversity. Monitoring, assessment and conservation. par une nouvelle méthode thermique. Annales des Sciences Forestières 44: 1–14. Wallingford, UK: CAB International, 195–217. Grant K, Kreyling J, Heilmeier H, Beierkuhnlein C, Jentsch A. 2014. Extreme Correia O, Catarino FM, Tenhunen JD, Lange OL. 1987. Regulation of water weather events and plant–plant interactions: shifts between competition and use by four species of Cistus in the scrub vegetation of the Serra da Arrábida, facilitation among grassland species in the face of drought and heavy rainfall. Portugal. In: Tenhunen JD, Catarino FM, Lange OL, Oecehel WC, eds. Plant Ecological Research 29: 991–1001. responses to stress. Functional analysis in Mediterranean ecosystems. Berlin, Grossiord C. 2019. Having the right neighbours: how tree species diversity Germany: Springer-Verlag, 247–258. modulates drought impacts on forests. New Phytologist 228: 42–49. Costa A, Pereira H, Maderia M. 2009. Landscape dynamics in endangered cork Guiot J, Kramer W. 2016. Climate change: The 2015 Paris Agreement oak woodlands in Southwestern Portugal (1958–2005). Agroforestry Systems 77: thresholds and Mediterranean basin ecosystems. Science 354: 465–468. 83–96. Haberstroh S, Caldeira MC, Lobo-do-Vale R, Dubbert M, Werner C. Côté IM, Darling ES, Brown JB. 2016. Interaction among ecosystem stressors 2020. Determination of zero-flow for the thermal dissipation method of and their importance in conservation. Proceedings of the Royal Society of London. sap flow measurements in Mediterranean climates. Acta Horticulturae Series B: Biological Sciences 283: 20152592. 1300: 29–36. David TS, Henriques MO, Kurz-Besson C, Nunes J, Valente F, Vaz M, Pereira Haberstroh S, Kreuzwieser J, Boeddeker H, Eiblmeier M, Gutte H, Lobo-do- JS, Siegwolf R, Chaves MM, Gazarini LC et al. 2007. Water-use strategies in Vale R, Caldeira MC, Werner C. 2019. Natural carbon isotope composition two co-occurring Mediterranean evergreen oaks: surviving the summer distinguishes compound groups of biogenic volatile organic compounds drought. Tree Physiology 27: 793–803. (BVOC) in two Mediterranean woody species. Frontiers in Forests and Global David TS, Pinto CA, Nadezhdina N, Kurz-Besson C, Henriques MO, Quilhó Change 2: 55. T, Cermak J, Chaves MM, Pereira JS, David JS. 2013. Root functioning, tree Haberstroh S, Kreuzwieser J, Lobo-do-Vale R, Caldeira MC, Dubbert M, water use and hydraulic redistribution in Quercus suber trees: a modeling Werner C. 2018. Terpenoid emissions of two Mediterranean woody species in approach based on root sap flow. Forest Ecology and Management 307: 136– response to drought stress. Frontiers in Plant Science 9: 1071. 146. Haylock MR, Hofstra N, Klein Tank AMG, Klok EJ, Jones PD, New M. 2008. Diez JM, D’Antonio CM, Dukes JS, Grosholz ED, Olden JD, Sorte CJB, A European daily high-resolution gridded data set of surface temperature and Blumenthal DM, Bradley BA, Early R, Ibá ñez I et al. 2012. Will extreme precipitation for 1950–2016. Journal of Geophysical Research: Atmosphere 113: climatic events facilitate biological invasions? Frontiers in Ecology and D20119. Environment 10: 249–257. Hoerling M, Eischeid J, Perlwitz J, Quan X, Zhang T, Pegion P. 2011. On the Doblas-Miranda E, Alonso R, Arnan X, Bermejo V, Brotons L, de las Heras J, increased frequency of Mediterranean drought. Journal of Climate 25: 2146– Estiarte M, Hódar JA, Llorens P, Lloret F et al. 2017. A review of the 2161. combination among global change factors in forests, shrublands and pastures of Holmgren M, Gómez-Aparicio L, Quero JL, Valladares F. 2012. Non-linear the Mediterranean Region: Beyond drought effects. Global and Planetary effects of drought under shade: reconciling physiological and ecological models Change 148: 42–54. in plant communities. Oecologia 169: 293–305. Dubbert M, Caldeira MC, Dubbert D, Werner C. 2019. A pool-weighted Holmstrup M, Bindesbøl A-M, Oostingh GJ, Duschl A, Scheil V, Köhler H-R, perspective on the two-water-worlds hypothesis. New Phytologist 222: 1271– Loureiro S, Soares AMVM, Ferreira ALG, Kienle C et al. 2010. Interactions 1283. between effects of environmental chemicals and natural stressors: A review. Esch EE, Lipson DA, Cleland EE. 2019. Invasion and drought alter phenological Science of the Total Environment 408: 3746–3762. sensitivity and synergistically lower ecosystem production. Ecology 100: e02802. Kirtman B, Power SB, Adedoyin JA, Boer GJ, Bojariu R, Camilloni I, Eyring V, Bony S, Meehl GA, Senior CA, Stevens B, Stouffer RJ, Taylor KE. Doblas-Reyes FJ, Fiore AM, Kimoto M, Meehl GA et al. 2013. Near- 2016. Overview of the Coupled Model Intercomparison Project Phase 6 term climate change: projections and predictability. In: Stocker TF, Qin D, (CMIP6) experimental design and organization. Geoscientific Model Plattner G-K, Tignor M, Allen SK, Boschung J, Nauels A, Xia Y, Bex V, Devevelopment 9: 1937–1958. Midgley PM, eds. Climate change 2013: the physical science basis. Fahey C, Angelini C, Flory SL. 2018. Grass invasion and drought interact to Contribution of working group I to the fifth assessment report of the alter the diversity and structure of native plant communities. Ecology 99: 2692– Intergovernmental Panel on Climate Change. Cambridge, UK & New York, 2702. NY, USA: Cambridge University Press. Forner A, Valladares F, Bonal D, Granier A, Grossiord C, Aranda I. 2018. Klose AK, Karle V, Winkelmann R, Donges JF. 2019. Dynamic emergence of Extreme droughts affecting Mediterranean tree species’ growth and water-use domino effects in systems of interacting tipping elements in ecology and efficiency: the importance of timing. Tree Physiology 38: 1127–1137. climate. arXiv 1910: 12042. Funk JL. 2013. The physiology of invasive plants in low resource environments. Kottek M, Grieser J, Beck C, Rudolf B, Rubel F. 2006. World map of the Conservation Physiology 1: 1–17. Köppen-Geiger climate classification updated. Meteorologische Zeitschrift 15: Gaertner M, Den Breeyen A, Hui C, Richardson DM. 2009. Impacts of alien 259–263. plant invasion on species richness in Mediterranean-type ecosystems: a meta- Kurz-Besson CK, Lobo-do-Vale R, Rodrigues ML, Almeida P, Herd A, Grant analysis. Progress in Physical Geography 33: 319–338. OM, David TS, Schmidt M, Otieno D, Keenan TF et al. 2014. Cork oak Garcı́a-Herrera R, Hernández E, Barriopedro D, Paredes D, Trigo RM, Trigo physiological responses to manipulated water availability in a Mediterranean IF, Mendes MA. 2007. The outstanding 2004–2005 drought in the Iberian woodland. Agricultural and Forest Meteorology 184: 230–242. Peninsula: Associated atmospheric circulation. Journal of Hydrometeorology 8: Leishman MR, Haslehurst T, Ares A, Baruch Z. 2007. Leaf trait relationships of 483–498. native and invasive plants: community- and global-scale comparisons. New Gavinet J, Ourcival JM, Limousin JM. 2019. Rainfall exclusion and thinning can Phytologist 176: 635–643. alter the relationships between forest functioning and drought. New Phytologist Li-Cor. 1992. LAI-2000 plant canopy analyzer: instruction manual. Lincoln, NE, 223: 1267–1279. USA: Li-Cor Inc. Ó 2021 The Authors New Phytologist (2021) 231: 1784–1797 New Phytologist Ó 2021 New Phytologist Foundation www.newphytologist.com
You can also read