Controls on zooplankton methane production in the central Baltic Sea - Biogeosciences
←
→
Page content transcription
If your browser does not render page correctly, please read the page content below

Biogeosciences, 16, 1–16, 2019
https://doi.org/10.5194/bg-16-1-2019
© Author(s) 2019. This work is distributed under
the Creative Commons Attribution 4.0 License.

Controls on zooplankton methane production
in the central Baltic Sea
Beate Stawiarski1 , Stefan Otto1 , Volker Thiel2 , Ulf Gräwe1 , Natalie Loick-Wilde1 , Anna K. Wittenborn1,2 ,
Stefan Schloemer3 , Janine Wäge1 , Gregor Rehder1 , Matthias Labrenz1 , Norbert Wasmund1 , and Oliver Schmale1
1 Leibniz Institute for Baltic Sea Research Warnemünde, Seestrasse 15, 18119 Rostock, Germany
2 Geoscience  Center, Georg-August University of Göttingen, Goldschmidtstr. 3, 37077 Göttingen, Germany
3 Federal Institute for Geosciences and Natural Resources, Stilleweg 2, 30655 Hannover, Germany

Correspondence: Oliver Schmale (oliver.schmale@io-warnemuende.de)

Received: 18 July 2018 – Discussion started: 9 August 2018
Revised: 23 October 2018 – Accepted: 27 November 2018 – Published: 7 January 2019

Abstract. Several methanogenic pathways in oxic surface           ticularly high methane concentrations coincided with sta-
waters were recently discovered, but their relevance in the       tions showing a high abundance of DMSP/DMSO-rich Dino-
natural environment is still unknown. Our study examines          phyceae. Lipid biomarkers extracted from phytoplankton-
distinct methane (CH4 ) enrichments that repeatedly occur         and copepod-rich samples revealed that Dinophyceae are a
below the thermocline during the summer months in the cen-        major food source of the T. longicornis dominated zooplank-
tral Baltic Sea. In agreement with previous studies in this re-   ton community, supporting the proposed link between cope-
gion, we discovered differences in the methane distributions      pod grazing, DMSP/DMSO release, and the build-up of sub-
between the western and eastern Gotland Basin, pointing to        thermocline methane enrichments in the central Baltic Sea.
in situ methane production below the thermocline in the latter
(concentration of CH4 14.1 ± 6.1 nM, δ 13 C CH4 −62.9 ‰).
Through the use of a high-resolution hydrographic model
of the Baltic Sea, we showed that methane below the ther-         1   Introduction
mocline can be transported by upwelling events towards
the sea surface, thus contributing to the methane flux at         Climate change, caused by increased greenhouse gas con-
the sea–air interface. To quantify zooplankton-associated         centrations in the atmosphere, has an indisputable influence
methane production rates, we developed a sea-going methane        on societal and economical evolution on local, regional and
stripping-oxidation line to determine methane release rates       global scales. In order to better predict future climate devel-
from copepods grazing on 14 C-labelled phytoplankton. We          opment, a more precise quantitative and mechanistic under-
found that (1) methane production increased with the num-         standing of individual sources and sinks of relevant green-
ber of copepods, (2) higher methane production rates were         house gases, such as methane, is crucial. Methane as an at-
measured in incubations with Temora longicornis (125 ±            mospheric component has a relevant impact on the earth’s
49 fmol methane copepod−1 d−1 ) than in incubations with          climate (Etminan et al., 2016; IPCC, 2013). In general, bio-
Acartia spp. (84 ± 19 fmol CH4 copepod−1 d−1 ) dominated          genic sources of methane are associated with microorgan-
zooplankton communities, and (3) methane was only pro-            isms (Archaea) in anoxic habitats, for example, in the ocean
duced on a Rhodomonas sp. diet, and not on a cyanobacte-          and lake sediments, wetlands, landfills, rice fields or the gas-
ria diet. Furthermore, copepod-specific methane production        trointestinal tracts of termites and ruminants (IPCC, 2013).
rates increased with incubation time. The latter finding sug-     However, recent studies demonstrated that methanogene-
gests that methanogenic substrates for water-dwelling mi-         sis also occurs in oxic environments. These unconventional
crobes are released by cell disruption during feeding, defe-      methanogenic pathways are mediated by aerobic prokary-
cation, or diffusion from fecal pellets. In the field, par-       otes (Yao et al., 2016) as well as eukaryotes, including
                                                                  plants (Keppler et al., 2006; Lenhart et al., 2016), animals

Published by Copernicus Publications on behalf of the European Geosciences Union.
2                                B. Stawiarski et al.: Controls on zooplankton methane production in the central Baltic Sea

(Tuboly et al., 2013), lichens (Lenhart et al., 2015), and fungi       the biology of the ecosystem (Feistel et al., 2008, and ref-
(Lenhart et al., 2012).                                                erences therein). It consists of several sub-basins, of which
   Methane concentrations in the oxygenated surface ocean              the eastern Gotland Basin is the largest. The eastern Got-
and lake waters show strong regional and seasonal fluctua-             land Basin has a maximum depth of 248 m and establishes a
tions (e.g. Jakobs et al., 2014; Donis et al., 2017). Large ar-        seasonal thermocline at 10–30 m water depth in the summer
eas are supersaturated with methane and act as a net source to         months, and a permanent halocline at 70–90 m (Omstedt et
the atmosphere (e.g. Bange et al., 1994; Lamontagne et al.,            al., 2004). In general, bottom waters in this basin are anoxic,
1973; Tang et al., 2014). It is assumed that climate-driven            unless episodic inflow events of more saline and oxygen-rich
modifications in aquatic systems such as increasing water              North Sea water into the deep basins lead to temporary oxic
temperatures, enhanced stratification, and nutrient limitation         conditions (Franck et al., 1987; Mohrholz et al., 2015).
could further reinforce aquatic methane production (Karl et               Methane concentrations in the Baltic Sea tend to increase
al., 2008). Such modifications are particularly important for          with depth due to its release from the anoxic sediments
shallow oxic methane production that largely bypasses mi-              (Schmale et al., 2010). However, recent studies revealed a
crobial methane consumption as it places the methane source            recurring methane accumulation in oxic waters right below
close to the water surface, intensifying fluxes to the atmo-           the thermocline during the summer months (Jakobs et al.,
sphere. However, the origin of methane in the oxic upper               2014; Schmale et al., 2018). Stable carbon isotopes indi-
water column is still unclear and hence also referred to as            cated an in situ biogenic methane origin, whereas clonal se-
the “methane paradox” (Scranton and Brewer, 1977).                     quences pointed towards methanogenic Archaea as poten-
   Recently, a growing number of studies have identified               tial producers (Schmale et al., 2018). It was further shown
several pathways that could explain methane enrichments                that zooplankton-associated methane production contributed
in shallow oxic waters. The postulated CH4 production                  to the subthermocline methane enrichment (Schmale et al.,
pathways include (i) direct CH4 production by algae from               2018). The authors found that methane increased with in-
methyl sulfides such as methionine (Lenhart et al., 2016);             creasing amounts of zooplankton and they suggested that
(ii) bacterial break-down of methylphosphonate (MPn) un-               changes in the copepod community and food web structure
der phosphate-stressed conditions (Repeta et al., 2016; Karl           may influence the spatial heterogeneity of methane accu-
et al., 2008; Wang et al., 2017; Teikari et al., 2018); (iii) trans-   mulation in the upper part of the water column. However,
fer of diazotroph-derived hydrogen among methanogens at-               zooplankton-associated methane production rates alone were
tached to algae (Grossart et al., 2011); (iv) CH4 production           not sufficient to fully explain the observed methane enrich-
through microbial degradation of dimethylsulfide (DMS),                ment. They concluded that this was most likely a conse-
dimethylsulfoniopropionate (DMSP) and dimethylsulfoxide                quence of using incubations with very dense and probably
(DMSO; Damm et al., 2010; Zindler et al., 2013); (v) photo-            food-limited zooplankton communities (1000 times the nat-
chemical production of methane from coloured dissolved or-             ural density), leading to results that are difficult to trans-
ganic matter (chromophoric dissolved organic matter, Zhang             fer into the natural environment (Schmale et al., 2018).
and Xie, 2015); and (vi) the microbial formation of methane            To overcome these experimental deficits, we developed
in anoxic microniches within decaying organic aggregates               a methane stripping-oxidation line to study zooplankton-
or zooplankton fecal pellets (Holmes et al., 2000; Karl and            associated methane production rates in the field. Our ship-
Tilbrook, 1994; Oremland, 1979). The latter hypothesis is              based incubation experiments were performed with different
supported by oxygen microsensor studies that showed that               zooplankton communities obtained from either the surface or
anoxic conditions can exist in carbon- and nutrient-rich ag-           from below the thermocline. We used almost natural cope-
gregates (Ploug, 2001; Ploug et al., 1997, 2008; Ploug and             pod densities (1.5–8.5 times the natural density), and differ-
Jørgensen, 1999). Furthermore, molecular biological stud-              ent diets of 14 C-labelled phytoplankton. In conjunction with
ies identified methanogenic archaea within fecal pellets pro-          field investigations of methane concentrations and plankton
duced by Temora longicornis and Acartia clausi (Ditchfield             distributions, the present study gives important insights into
et al., 2012). These results are in agreement with the stud-           the controls of zooplankton-associated methane production
ies conducted by de Angelis and Lee (1994), who observed               in the central Baltic Sea.
methane production during experimental zooplankton graz-
ing on unialgal cultures. The authors used selected growth
stages (adult and C5 stages) from pure cultures of T. longi-           2     Methods
cornis, Acartia tonsa, and Calanus pacificus, which had been
isolated from the coastal waters from the North Atlantic. In           2.1    Hydrographical and chemical characteristics of the
these laboratory experiments, methane production was only                     water column
detected in incubations containing T. longicornis.
   The Baltic Sea is characterized by pronounced lateral               During cruise AL483 on R/V Alkor in August 2016 in the
gradients including e.g. temperature, salinity, oxygen and             central Baltic Sea, seven stations in the western (TF0283,
methane concentrations, which altogether strongly influence            TF0284) and eastern (from south to north: TF0250, TF0260,

Biogeosciences, 16, 1–16, 2019                                                                 www.biogeosciences.net/16/1/2019/

B. Stawiarski et al.: Controls on zooplankton methane production in the central Baltic Sea                                        3

                                                                     TF0271, TF0284 and TF0286 (Fig. 1). Equal amounts of
                                                                     water from the mixed layer (depths: 0–1, 2.5, 5, 7.5 and
                                                                     10 m) were pooled in accordance with the guidelines of the
                                                                     Helsinki Commission (HELCOM, 2017). At stations char-
                                                                     acterized by a distinct subthermocline methane enrichment
                                                                     (TF0271, TF0260, TF0285 and TF0286), additional samples
                                                                     were taken from the subthermocline chlorophyll a maximum
                                                                     at about 20 m water depth. At station TF0271, three samples
                                                                     were taken on 12 and 18 August to investigate the temporal
                                                                     variability in the community composition at this location. All
                                                                     phytoplankton samples were transferred into 250 mL brown
                                                                     glass bottles and preserved with 1 mL of acetic Lugol solu-
                                                                     tion (2 % final concentration). For later community analyses,
                                                                     25 mL sub-samples were concentrated in settling chambers
                                                                     (Utermöhl, 1958). They were counted using an inverted mi-
                                                                     croscope and the counts were converted into carbon biomass
Figure 1. Map of sampling stations in the western Gotland Basin
                                                                     using the cell volumes (Olenina et al., 2006; HELCOM,
(WGB) and the eastern Gotland Basin (EGB). Symbols describe
the sampling gear. Stations with a distinct subthermocline methane
                                                                     2017).
enrichment are marked in red.                                           Zooplankton samples for water column community analy-
                                                                     ses were collected with a WP2 net (towed at 0.5 m s−1 , mouth
                                                                     opening, 25 m2 , mesh size 100 µm, according to HELCOM,
TF0271, TF0286, TF0285) Gotland Basin (Fig. 1) were in-              2017) independent of daytime. Vertically integrated hauls
vestigated. At each station, the hydrographical variables, in-       from two depth intervals were taken to obtain zooplankton
cluding temperature, salinity and oxygen concentrations, of          samples: (i) thermocline to surface (e.g. 20–0 m, depending
the water column were examined along vertical profiles us-           on the physical structure of the water column), and (ii) halo-
ing a SBE 911 plus CTD system (Seabird Electronics, USA;             cline to thermocline (e.g. 60–20 m). The concentrated sam-
see Sect. S1 in the Supplement). In addition, the vertical           ples (500 mL) were preserved in borax-buffered formalin
methane distribution pattern and the stable carbon isotope           (4 % final concentration). For later copepod-specific commu-
ratio of methane (δ 13 C CH4 ) were measured to differentiate        nity analyses, sub-samples were counted using a compound
between regions affected and regions unaffected by subther-          microscope until at least 500 individual copepods were tax-
mocline methane production. For these studies, subsamples            onomically classified. Nauplii were pooled together for all
were taken from the rosette water sampler and analysed in the        copepod species, while C1–C5 copepodite stages and adults
home laboratory using a purge and trap system for methane            were pooled for individual species. Finally, to exclude po-
concentration measurements and a continuous-flow isotope             tential daytime effects through vertical migration of the zoo-
ratio mass spectrometer (IRMS) for stable carbon isotope             plankton communities above the halocline, counts from both
analyses (see Sect. S1). In order to investigate whether sta-        integrated hauls were averaged according to the filtered vol-
tion TF0284 was affected by coastal upwelling during the             ume. Similar to the phytoplankton sampling strategy, three
time of sampling, we analysed the output of a numerical              samples at TF0271 were taken in a period of 10 days to inves-
ocean model, covering the North Sea/Baltic Sea. This hy-             tigate the temporal variability in the community composition
drodynamical model computed a reconstruction of the state            at this station.
of the Baltic Sea with a spatial resolution of 1 nautical mile          Lipid biomarkers were analysed to obtain information on
and 50 vertical levels. Further details of the model are given       the trophic relationships of copepods in the field at sta-
in Gräwe et al. (2015).                                              tion TF0271 that showed a distinct methane enrichment be-
   Surface water methane saturation is calculated following          low the thermocline. For this purpose, their putative food
Eq. (1), where SV is the saturation value, Cw the measured           source, phytoplankton in the mixed layer, was sampled with
concentration of methane in seawater and Cequi the concen-           an Apstein net. The phytoplankton were separated from co-
tration in equilibrium with the atmosphere using the solubil-        sampled zooplankton using a simple self-built trap consisting
ity coefficient given by Wiesenburg et al. (1979).                   of a 1.5 L transparent plastic bottle with a closable outlet at
            Cw                                                       the bottom. The zooplankton were attracted towards the trap
SV [%] =         · 100                                        (1)    using a light source attached close to the outlet, and drained
           Cequi
                                                                     off. Then the phytoplankton, which remained in the bottle,
2.2   Plankton community and lipid biomarker analyses                were sampled. The target copepod T. longicornis has been
                                                                     known to migrate diurnally from the light-penetrated surface
Phytoplankton samples for water column community anal-               layer towards greater depths to escape predation (Hansen et
ysis were taken from the 10 L free-flow bottles at stations          al., 2006; Schmale et al., 2018). For lipid biomarker studies,

www.biogeosciences.net/16/1/2019/                                                                 Biogeosciences, 16, 1–16, 2019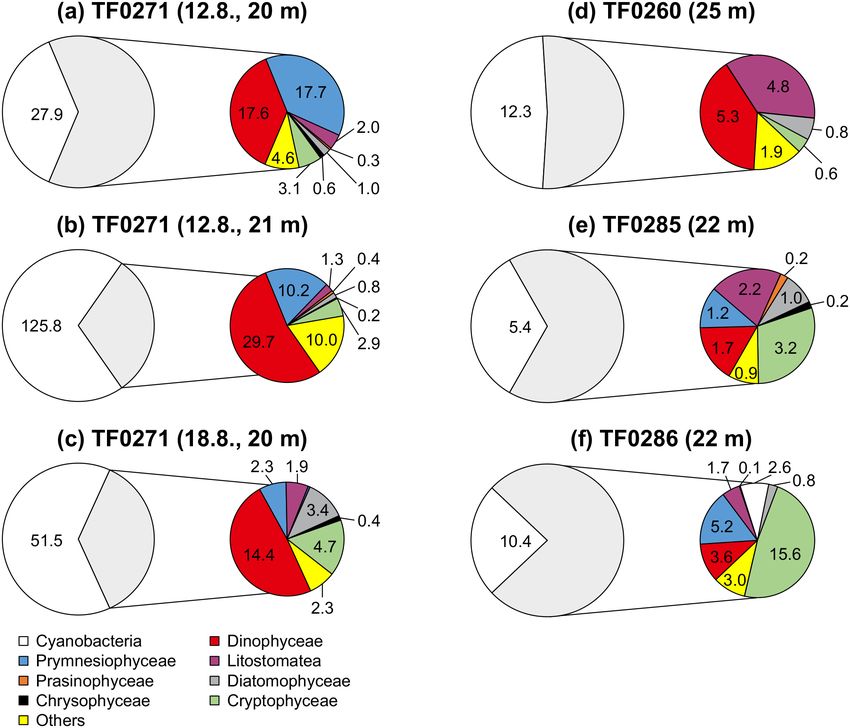
4                              B. Stawiarski et al.: Controls on zooplankton methane production in the central Baltic Sea

a concentrated sample of zooplankton rich in T. longicornis        to avoid injured animals, and checked for species composi-
was retrieved, avoiding major co-sampling of phytoplankton.        tion under the dissecting microscope before subsamples were
This sampling was performed at station TF0271 by hauling a         used for the grazing experiments. The sampling took place
WP-2 net (see above) in the subthermocline layer (25–60 m)         at 14:00 UTC, before vertical migration of one of the target
during the daytime. For comparison, a zooplankton sample           copepods, T. longicornis, started (Hansen et al., 2006). This
was taken at station TF0250 without a distinct methane en-         time was chosen because it was more likely that T. longicor-
richment below the thermocline. Here, the community com-           nis in the deeper water column would be starved and, thus,
position was low in T. longicornis and instead was domi-           would start grazing within the experiments.
nated by Acartia spp. and Pseudocalanus spp. All samples              Two phytoplankton compositions were used to test for
were concentrated by sieving (20 µm) and kept frozen until         the influence of the diet on zooplankton-associated methane
further workup in the home laboratory. The samples were            production: (i) a Rhodomonas sp. (Cryptophyceae) labora-
lyophilized and extracted (3×, ultrasound, 15 min, 20 ◦ C)         tory culture, and (ii) a Nodularia spumigena (Cyanophyceae)
with dichloromethane (DCM) / methanol (MeOH) (2 : 1, v :           dominated culture from the surface mixed layer in the field,
v), DCM / MeOH (3 : 1, v : v) and DCM / n-hexane (2 : 1,           which is typically found in these waters of the central Baltic
v : v). From the resulting total organic extract, neutral lipids   Sea in summer (Wasmund, 1997). The laboratory culture of
(NL, largely containing storage lipids such as triglycerides,      Rhodomonas sp. was grown in f/2 medium (Guillard, 1962),
wax esters, and sterols) were separated using silica gel col-      prepared in autoclaved bottles from 0.2 µm filtered seawa-
umn chromatography by elution with DCM / acetone (9 :              ter from 10 m depth. A new sub-culture was established ev-
1, v : v). After drying, fatty acids (FA) in the NL frac-          ery 3–5 days and the inoculum was chosen to be sufficient
tion were transesterified by reaction with trimethylchlorosi-      to keep the culture in exponential growth (cf. Knuckey et
lane (TMCS) / MeOH (1 : 9, v : v; 90 min, 80 ◦ C). After par-      al., 2005). The second phytoplankton culture was established
titioning into n-hexane (3×, 1 mL) and drying, alcohols            from the top chlorophyll a fluorescence maximum (0–10 m)
contained in the NL were converted to their trimethylsi-           sampled with an Apstein net (55 µm mesh size, Hydro-Bios).
lyl (TMS-) derivatives by reacting with 200 µl of a n-             The culture was re-suspended in 500 mL of seawater and left
hexane/BSTFA/pyridine mixture (5 : 3 : 2, v : v : v; 40 ◦ C,       for an hour to allow the N. spumigena cells to float on top.
60 min). The derivatized NL fractions were analysed by cou-        The cells were carefully collected with a pipette and trans-
pled gas chromatography–mass spectrometry (GC–MS), as              ferred into an autoclaved 1 L glass bottle, which was filled up
described elsewhere (Thiel and Hoppert 2018).                      with surface seawater. Then, 36.2 µM of NaH2 PO4 as for the
                                                                   f/2 medium was added. Both the Rhodomonas sp. and the N.
2.3   Sampling for ship-based laboratory experiments               spumigena culture bottles were incubated in 90 L tubs, which
                                                                   were placed in a shaded location on deck and continuously
Three ship-based grazing experiments were conducted at sta-        flushed with sea surface water at a temperature of ∼ 18.5 ◦ C.
tion TF0271, where a persistent and distinct methane en-           A third phytoplankton culture was collected from a subther-
richment below the thermocline was detected during the             mocline chlorophyll a peak closely below the thermocline
cruise. These experiments were designed to examine how             (∼ 20 m depth), where mixotrophic Dinophyceae were ex-
(i) the abundance of copepods and (ii) their food source im-       pected to be dominant (Carpenter et al., 1995; Hällfors et al.,
pact zooplankton-associated methane production, and how            2011). For this, up to 150 L of seawater was obtained from
(iii) the methane production rates vary between different          a CTD rosette and concentrated on a 20 µm mesh. However,
copepod communities. To measure copepod species-specific           this culture did not grow sufficiently under similar temper-
methane production rates, zooplankton communities were             ature and light conditions as in situ, and could not be used
sampled from the surface (e.g. 20–0 m) and from the sub-           within the grazing experiments.
thermocline waters (e.g. 60–20 m). In the central Baltic Sea,
these layers are commonly dominated by Acartia spp. and            2.4   Phytoplankton 14 C-labelling
T. longicornis, respectively (Hansen et al., 2006), and will
be referred to as the surface and subthermocline commu-            Once a phytoplankton culture was selected for grazing ex-
nities. For the sampling hauls the cod end of the WP2 net          periments, three aliquots were split between three autoclaved
was sealed from outside and towed 0.1 m s−1 to reduce dam-         1 L incubation bottles (DURAN® , borosilicate glass 3.3,
age to the zooplankton, and the content was transferred im-        clear, GL45) and filled up with the corresponding medium.
mediately into a 25 L bucket filled with seawater from the         One of these bottles was spiked with 18.5 MBq of 14 C-
depth where the zooplankton was sampled (i.e. surface or           labelled sodium bicarbonate (NaHCO3 , 2.18 GBq mmol−1 ,
subthermocline water). The zooplankton mainly comprised            Moravek Biochemicals, USA) for 14 CH4 production mea-
copepods and was left in the cold room at 10 ◦ C for an hour       surements (Sect. 2.5.1 Methane production and consumption
to allow damaged individuals to settle to the bottom of the        rates). The other two bottles received equal amounts of un-
bucket. A subsample of living copepods was removed gen-            labelled NaHCO3 for measuring the particulate organic car-
tly with a 500 mL beaker from the upper layer of the bucket        bon concentration (Sect. 2.5.2 Analysis of particulate organic

Biogeosciences, 16, 1–16, 2019                                                             www.biogeosciences.net/16/1/2019/
B. Stawiarski et al.: Controls on zooplankton methane production in the central Baltic Sea 5
Table 1. Experimental conditions for the zooplankton grazing experiments (exp.). SAphy is the specific activity of the phytoplankton fed
to the copepods. POC stands for particulate organic carbon. No. of copepods is the average amount of copepods used in the incubation
experiments.
Exp. Food SAphy POC conc. POC conc. Zooplankton No. of Duration of
(MBq mmol−1 ) at start at end community copepods the exp. (d)
(mg C L−1 ) (mg C L−1 )
1 Rhodomonas sp. 695.23 1.34 ± 0.04 1.24 ± 0.08 subthermocline 25 ± 3 1
56 ± 2
73 ± 2
1.22 ± 0.04 3.57 ± 0.38 surface 25 ± 8
50 ± 12
76 ± 18
2 Rhodomonas sp. 613.46 1.61 ± 0.61 1.73 ± 0.45 subthermocline 64 ± 3 1–3
3 Nodularia 299.33 3.17 ± 0.26 3.09 ± 1.18 subthermocline 66 ± 7 1–3
spumigena
carbon) and microbial methane consumption (Sect. 2.5.1 whether there was (i) a linear relationship between methane
Methane production and consumption rates). All bottles were produced and the number of copepods incubated, and (ii) a
incubated for 3–5 days to allow cells to grow and to take difference in methane production between the surface and
up the 14 C label (Welschmeyer and Lorenzen, 1984). The subthermocline zooplankton communities. In experiment 2
specific activity of the labelled phytoplankton (SAphy ) was only the subthermocline zooplankton community was used
measured daily by filtering 1–5 mL of the culture through and the incubation time was varied from 1 to 3 days to
a 0.45 µm cellulose nitrate filter (Millipore) and rinsing it test whether the increase in methane was stable over time
thoroughly with Milli-Q water. The filter was then dissolved and the production rate per copepod stayed constant. In
in Filter Count scintillation cocktail (Perkin Elmer) by vor- experiments 1 and 2 a laboratory strain of Rhodomonas
texing and the amount of 14 C label that was incorporated sp. (Cryptophyceae), a standard food for copepod culturing
into particles was measured on a liquid scintillation counter (Dutz et al., 2008), was fed to the zooplankton communities.
(Perkin Elmer, Tri-Carb 2800TR). Blanks for the specific ac- Rhodomonas sp. may be considered a model representative
tivity of the cultures were collected and analysed immedi- of the Cryptophyceae, which account for 5.5 % of the total
ately after the label had been added to the incubation bottle. phytoplankton biomass in the Baltic Sea in summer 2016
SAphy was calculated using Eq. (2) and used for calculat- (IOW monitoring database: https://www.io-warnemuende.
ing methane production rates (de Angelis and Lee, 1994), de/datenportal.html, last access: February 2018). In experi-
where SAphy is the specific activity of the phytoplankton, ment 3 the subthermocline zooplankton community was fed
Disintegrationsfilter are the disintegrations mL−1 on the fil- the cyanobacterium N. spumigena and the incubation time
ter, Volumeculture is the total volume of the incubated culture, was varied the same way as in experiment 2. Here we se-
6 × 10⁷ dpm MBq−1 is the constant for converting dpm into lected N. spumigena as a food source, because this species
units of MBq, activityadded is the total activity of the tracer, was the dominant phytoplankton in the surface waters dur-
which was added to the incubation, and SAtracer is the spe- ing our field campaign and accounted for 23 % of the phyto-
cific activity of the tracer. plankton biomass. The different phytoplankton communities
fed in these experiments allow one to assess the impact of
MBq the food source on zooplankton-associated methane produc-
SAphy =
mmol tion rates.
h i
disintegrationsfilter dpm Each of the three grazing experiments consisted of three
mL × Volumeculture [mL]
h i sets of incubations. The first set of incubations was con-
dpm
6 × 10⁷ MBq ducted with zooplankton grazing on 14 C-labelled phyto-
plankton for methane production measurements (Sect. 2.5.1
1 MBq
× × SAtracer (2) Methane production and consumption). The second set of in-
activityadded MBq mmol cubations was conducted with zooplankton grazing on unla-
2.5 Zooplankton grazing experiments belled phytoplankton to determine the food availability over
the course of the grazing experiments (Sect. 2.5.2 Analysis
Three experiments with zooplankton grazing on phytoplank- of particulate organic carbon). Also, the third set of incuba-
ton (Table 1) were conducted. In experiment 1 we tested tions was conducted with zooplankton grazing on unlabelled
www.biogeosciences.net/16/1/2019/ Biogeosciences, 16, 1–16, 20196 B. Stawiarski et al.: Controls on zooplankton methane production in the central Baltic Sea
phytoplankton to measure the loss of methane by micro- Microbial methane oxidation rates were measured and the
bial oxidation under the experimental conditions (Sect. 2.5.1 production rates corrected accordingly. For these measure-
Methane production and consumption). ments, 14 C-labelled methane was injected into 600 mL in-
In selective incubations the oxygen saturation was moni- cubation bottles, which were filled with the corresponding
tored over time using oxygen spots (5 mm, PreSens Precision volumes of plankton and water as in the incubations for
Sensing) and an optode (Single Channel Oxygen Meter, Fi- methane production measurements. The amount of produced
box 3 LCD, PreSens Precision Sensing). The average oxygen 14 CO was measured according to the method of Jakobs
2
saturation was 75.2 ± 2.9 % throughout the experiments. et al. (2013). The rates were similar in all incubations and
in the range of 0.13–0.44 pM d−1 . Neither the presence of
2.5.1 Methane production and consumption rates copepods nor the composition of their community or their
food had a significant influence on the methane consumption
For the methane production incubations, 250 mL gastight rates. In incubations with Rhodomonas sp., methane oxida-
bottles (DURAN® , borosilicate glass 3.3, clear, GL45) were tion rates were 0.13–0.39 pM d−1 and accounted for a loss
used. The bottle lids were modified with one inlet and one of 0.2–2.3 % of the produced methane. In incubations with
outlet tube (Fig. 2), each sealed with autoclaved silicone cyanobacteria, the oxidation rates were slightly higher (0.3–
stoppers. The inlet tube was long enough to reach into the 0.44 pM d−1 ).
lower third of the medium and had a glass frit attached at All sets of incubations included two to three replicates.
the end. The outlet tube was short enough to remain in the To estimate the linear or exponential trends in methane con-
headspace of the bottle. Each bottle was filled with 50 mL centration or production in relationship with the number of
of 14 C-labelled phytoplankton and 3–15 mL of zooplankton copepods or time, the Gauss–Newton method was used for
stock culture and topped up to a total volume of 200 mL with minimizing the sum of squares between the fits and the mea-
0.2 µm filtered seawater (Millipore GVWP filter) from either surements (Mystat 12, Systat software).
10 or 20 m depth, according to the depth from which the zoo-
plankton community was obtained. All bottles were kept in
the dark at in situ temperature for 1 to 3 days in temperature- 2.5.2 Analysis of particulate organic carbon
controlled incubators. The methane, which was produced
within the time of incubation, was finally measured with a The particulate organic carbon (POC) content in the incuba-
methane stripping-oxidation line (modified following de An- tions was quantified at the beginning and end of our incu-
gelis and Lee, 1994; Fig. 2; details on the work principle in bation experiments to determine the food availability over
Sect. S2). In brief, the bottles were connected to the line, the course of the grazing experiments. For this, a larger
the water samples were purged with helium carrier gas and volume of sample was required for later POC analysis us-
the methane (and other hydrocarbons) was concentrated on ing a Carlo Erba Elemental Analyser (Typ EA 1110; Carlo
a cold trap. After heating the trap the methane was released Erba; Nieuwenhuize et al., 1994), and 1 L bottles (DURAN® ,
and separated from other hydrocarbons by gas chromatog- borosilicate glass 3.3, clear, GL45) were used for incuba-
raphy (GC) and transferred to a furnace, where it was con- tions. To achieve similar concentrations of zooplankton and
verted to 14 C-labelled carbon dioxide (CO2 ). The 14 CO2 was phytoplankton (mL−1 ) as in the first set of incubations, stock
trapped in scintillation vials and the activity was measured culture volumes were increased accordingly. For ambient
by liquid scintillation counting. Finally, the activities were POC analysis, one 50 mL sample was taken from each bot-
used for calculating methane production rates with Eq. (3), tle at the beginning and at the end of the experiment on pre-
where activityzoo + phy is the activity measured in incubations combusted GF/F filters. The initial sample was removed from
containing zooplankton and phytoplankton, and activityphy is the experimental bottle before the copepods were added to
the activity measured in blank incubations. it, and the final sample was taken after copepods had been
removed with a 50 µm sieve. All POC measurements (Ta-
14
CH4 produced [mmol] = ble 1) at the beginning and at the end of the incubations ex-
ceeded the threshold for food limitation of 1–0.5 mg C L−1
activityzoo + phy MBq − activityphy MBq
h i (3) (Berggreen et al., 1988). As the food was diluted with 0.2 µm
MBq
SAphy mmol filtered seawater, all POC at the beginning of the experiments
can be assigned to the diet that was added. However, at the
Blank incubations were conducted with phytoplankton end of the grazing experiments, excreted fecal pellets of the
and seawater only and the volume of zooplankton was re- zooplankton may have added up to the organic carbon pool.
placed with the corresponding amount of GF/F (Whatman) Further, it was difficult to separate the copepods from N.
filtered seawater in which the zooplankton was kept before spumigena by the 50 µm sieve, as N. spumigena typically ex-
incubations. The CH4 concentrations of all blank incubations ceeds 50 µm in size. In consequence, no grazing rates based
were not different from the blank of the methane stripping- on the decrease in POC were calculated for the individual
oxidation line (Mann–Whitney U test, p = 0.9, df = 1). incubations.
Biogeosciences, 16, 1–16, 2019 www.biogeosciences.net/16/1/2019/B. Stawiarski et al.: Controls on zooplankton methane production in the central Baltic Sea 7
Figure 2. Schematic view of the methane stripping-oxidation line. Position 1 (displayed): the cold trap is placed in a −120 ◦ C ethanol bath
to retain the hydrocarbons. Position 2: the cold trap is transferred into a water bath at 90 ◦ C to release the hydrocarbons towards the gas
chromatograph (GC). A detailed description is included in Sect. S2.
3 Results and discussion
3.1 Subthermocline methane distribution
Surface waters were oversaturated with methane with re-
spect to the atmosphere at all stations (saturation values
between 118 % and 198 %) using the mean atmospheric
methane concentrations for August 2016 obtained from at-
mospheric tower measurements at Utö (1919 ppb; position
59◦ 460 50 N, 21◦ 220 23 E; Juha Hatakka, Finnish Meterologi-
cal Institute, personal communication, 2018). However, the
eastern Gotland Basin had much higher maximum subther-
mocline methane concentrations than the western Gotland
Basin (14.1±6.1 nM vs. 8.7±0.3 nM; Fig. 3). Such regional
differences have previously been documented in the central
Baltic Sea (Schmale et al., 2010, 2018; Jakobs et al., 2014).
Concentration profiles and stable carbon isotopes obtained
in these earlier studies indicated that the subthermocline
methane enrichments resulted from in situ production within Figure 3. Vertical profiles of temperature (T ), oxygen (O2 ) and
the oxic water body. A transport from the deep anoxic wa- methane (CH4 ) concentrations in the central Baltic Sea: (a) sta-
ters was excluded because the methane from this pool is ef- tions with a distinct, and (b) stations without a distinct subthermo-
ficiently oxidized by aerobic methanotrophic bacteria situ- cline methane enrichment; stable carbon isotope values of methane
(δ 13 C) are presented for station TF0284 (western Gotland Basin)
ated in the oxic–anoxic transition zone at about 100 m water
and TF0271 (eastern Gotland Basin).
depth (Jakobs et al., 2013; Schmale et al., 2012, 2016). As
their metabolism favours the turnover of 12 CH4 , the remain-
ing 13 CH4 becomes enriched and δ 13 C CH4 values in the
respective water layer are comparably high (e.g. −40 ‰ in et al., 2014; Schmale et al., 2018). Upwelling events can
80 m water depth; Jakobs et al., 2013). In the present study, offset water column stratification through a replacement of
subthermocline methane enrichments in the eastern Gotland warm, mostly nutrient-depleted surface water by cooler and
Basin were characterized by strikingly depleted δ 13 C CH4 usually nutrient-enriched subthermocline waters (Gidhagen,
values (−62.9 ‰ at 27 m at TF0271, Fig. 3), supporting the 1987; Lehmann and Myrberg, 2008; Reissmann et al., 2009).
idea that the pronounced methane anomaly in this area orig- Such events may also cause a rapid decline in phytoplankton
inated from in situ biogenic production. In contrast, stable biomass in the surface water and affect the plankton compo-
isotope ratios of methane in the upper water column of the sition (Vahtera et al., 2005; Nausch et al., 2009; Wasmund
western Gotland Basin showed δ 13 C CH4 values of −47.7 ‰ et al., 2012). Upwelling significantly increase surface water
at 20 m water depth (TF0284, Fig. 3) that are close to atmo- methane concentrations in the area around Gotland during
spheric equilibrium (−47 ‰). the summer (Gülzow et al., 2013; Schneider et al., 2014).
Seasonal observations in the Baltic Sea revealed that the During our field campaign the sea surface temperature at sta-
development of a thermocline, which functions as a bar- tion TF0284 in the western Gotland Basin dropped from 18
rier and limits fluxes to the atmosphere, was essential for to 12 ◦ C, as indicated by our oceanographic model output
the build-up of subthermocline methane enrichments (Jakobs (Fig. 4; see also the temperature profile of station TF0284 in
www.biogeosciences.net/16/1/2019/ Biogeosciences, 16, 1–16, 20198 B. Stawiarski et al.: Controls on zooplankton methane production in the central Baltic Sea
Figure 4. Development of sea surface temperatures in the central Baltic Sea between 3 and 11 August 2016 using the oceanographic model
of Gräwe et al. (2015). The coloured dots represent the sampling stations.
tions were not affected by upwelling events during the time
of sampling. Even though our oceanographic model output
indicated that the water mass at station TF0283 (sampled on
11 August) was located at the upwelling front (Fig. 4), our
field measurements showed that the station was not affected
by the event, as there is no drop in the surface water tem-
perature visible (Fig. 3). However, our study indicates that
in contrast to the deep water methane pool, which is effi-
ciently separated from the surface water through the halo-
cline at about 60 m depth (Schmale et al., 2010; Jakobs et al.,
2014), upwelling of subthermocline waters has to be consid-
ered an important mechanism that contributes to the sea–air
methane fluxes in the Baltic Sea.
3.2 Controls on zooplankton associated methane
production
We obtained species- and food-specific methane production
rates in incubations, which contained field copepods (surface
and subthermocline communities, Fig. 5) in nearly natural
abundances (1.5–8.5 times the natural density) by using the
methane stripping-oxidation line. We found a substantial in-
Figure 5. Relative zooplankton community composition of the crease in methane production with the number of copepods
three zooplankton grazing experiments listed in Table 1. (a) Sub- in the incubations, but no production in controls containing
thermocline (used in experiments 1–3) and (b) surface zooplankton phytoplankton only (Fig. 6). This implies that the production
community composition (used in experiment 1). Adults and cope- of methane is associated with the active grazing of zooplank-
podite stages C1–C5 were pooled for individual species, but Nauplii
ton.
were pooled together for all copepod species.
The incubations with a high proportion of T. longicor-
nis had higher production rates than the Acartia spp. domi-
nated setups (125±49 vs. 84±19 fmol CH4 copepod−1 d−1 ).
Fig. 3). Assuming the thermocline was located at 18–20 m This indicates that methane production may depend on the
depth we estimated that the upwelled water masses must composition of the zooplankton community (Fig. 6a). How-
have had originated from a depth of 25–35 m. Upwelling of ever, the differences were not significant (Kruskall–Wallis
cold, methane-rich subthermocline water can plausibly ex- test; p = 0.150, df = 1), which may be a consequence of
plain the strong surface water methane oversaturation ob- the limited number of incubations. Similar observations were
served at TF0284 (saturation value of 198 %). The other sta- made in laboratory experiments using cultured species from
Biogeosciences, 16, 1–16, 2019 www.biogeosciences.net/16/1/2019/B. Stawiarski et al.: Controls on zooplankton methane production in the central Baltic Sea 9
Figure 6. (a) Experiment 1: methane production as a function of the number of copepods in the surface (dominated by Acartia spp.) and
subthermocline zooplankton communities (dominated by Temora longicornis). (b) Experiments 2 and 3: copepod-specific methane produc-
tion over time when using the cryptophyte alga Rhodomonas sp. (experiment 2) or the cyanobacterium Nodularia spumigena (experiment 3)
as food sources.
ences (e.g. animal size) between the copepods used (length T.
longicornis North Atlantic: 1300 µm vs. Baltic Sea: 700 µm).
The methane production rates may also be lower for younger
development stages of copepods, which contributed to the
natural surface community used in our incubations (Fig. 5).
Animal size affects the oxygen gradient in the guts of these
copepods and affects the dimension of produced fecal pel-
lets and, thus, the penetration depth of oxygen into the pellet
(Ploug and Jörgensen, 1999; Tang et al., 2011). Alternatively,
lower methane production rates observed in our experiments
may have reflected a response of the animals to stress of be-
ing removed from their natural environment. In contrast to
the study of de Angelis and Lee (1994), who used cultured
animals in their experiments, we immediately transferred the
Figure 7. Experiments 2 and 3: copepod-specific methane produc-
field copepods into incubation bottles and fed phytoplankton
tion rates over time for the two food sources Rhodomonas sp. and
cyanobacterium Nodularia spumigena.
that were not representative of the phytoplankton biomass
of the Baltic Sea (i.e. the cryptophyte Rhodomonas sp.) and
thus did not belong to their natural food source. To lower the
capture stress, we selected a rather gentle method for sam-
the North Atlantic (de Angelis and Lee, 1994). These au- pling, and we avoided food shortage, which was shown to be
thors observed methane production in all experiments for more influential on the decrease in physiological rates (Ikeda
T. longicornis grazing on phytoplankton, but not for Acar- and Skjoldal, 1980). Also, we used a food source which was
tia tonsa. These differences may be due to species-specific previously shown to be of good quality (e.g. Knuckey et al.,
differences in grazing rates, food preferences and gut flo- 2005; Koski and Breteler, 2003). Another factor which may
ras. Furthermore, the methane production rates per cope- have led to lower methane production rates than measured by
pod reported by de Angelis and Lee (1994) were 2 or- de Angelis and Lee (1994) is the quality of the filtered seawa-
ders of magnitude higher (4–20 pmol CH4 copepod−1 d−1 ) ter used in the incubations. In our experiments we used filters
than the rates measured in our experiments. Still, our re- with a pore size of 0.2 µm, while de Angelis and Lee (1994)
sults are in agreement with those of previous zooplankton used filters with a pore size of 1.2 µm to prepare the incu-
incubation experiments conducted in the central Baltic Sea bation water. Our intention was to exclusively investigate the
(0.3 pmol CH4 copepod−1 d−1 , Schmale et al., 2018). This methane production by zooplankton while minimizing the in-
similarity is notable as the previous experiments used zoo- fluence of particulate material (e.g. fecal pellets) in the sea-
plankton abundances that were about 1000 times higher than water. However, we are aware that the smaller pore size used
the natural density in the field. The obvious discrepancy in our studies reduced the number of bacteria in the incuba-
from the methane production rates reported by de Angelis tion water, which may have been important for the methane
and Lee (1994) might be related to the physiological differ- production outside the body of the copepods.
www.biogeosciences.net/16/1/2019/ Biogeosciences, 16, 1–16, 201910 B. Stawiarski et al.: Controls on zooplankton methane production in the central Baltic Sea
the second case, the fecal pellets could temporarily act as
anoxic microenvironments for methanogenic archaea (Orem-
land et al., 1979; Bianchi et al., 1992; Marty et al., 1993; Karl
and Tilbrook, 1994; Ditchfield et al., 2012). However, it is
debatable whether anoxic conditions can persist within fecal
pellets outside of the anoxic digestive tracts of the copepods
(Ditchfield et al., 2012; Ploug et al., 2008). For T. longicornis
fed on Rhodomonas sp., the diffusive boundary layer of the
fecal pellets through which the exchange of gases occurs was
shown to be very thin, and no indications of anoxic condi-
tions were detected (Ploug et al., 2008). Studies investigating
the anoxic potential within particle aggregates were only able
to confirm anoxic conditions in the interior of nutrient- and
carbon-rich particles >600 µm and suggest that anoxia in ma-
rine aggregates is more likely to occur in an oxygen-depleted
water column (Ploug et al., 1997; Ploug et al., 2001). On our
cruise, a fecal pellet size of onlyB. Stawiarski et al.: Controls on zooplankton methane production in the central Baltic Sea 11
Figure 9. Phytoplankton community composition within the subthermocline chlorophyll a maximum (mg C m−3 ) at three stations with a
distinct subthermocline methane enrichment (a–e) and at one station without a distinct enrichment (f). The grey shaded non-cyanobacteria
community is described in detail in the coloured circles. Three replicate samples were taken at TF0271 in a period of 7 days (a–c) showing
that the prevalence of Dinophyceae below the thermocline is a consistent feature at this station.
can lead to an accumulation of DMSP in phytoplankton cells
(Sunda et al., 2007) that exceeds 10 % of the cell carbon
(Matrai, 1994). In the central Baltic Sea a pronounced DMS
maximum was detected during summer months in the sur-
face waters (Leck et al., 1990). No correlation was identified
between high DMS concentrations and any particular phy-
toplankton species. Instead, DMS production in the surface
water was accelerated through phytoplankton growth under
nitrogen-limited conditions, and correlated significantly with
copepod and total zooplankton biomass. Hence, the release
of DMSP, DMSO and DMS from phytoplankton was sug-
gested to be controlled by zooplankton and heterotrophic
bacteria (Leck et al., 1990; Kwint et al., 1996; Wolfe et al.,
1997; Simo et al., 2002; Lee et al., 2003).
Similar to phytoplankton, zooplankton, in particular cope-
pods, may use DMSP for osmoregulation and were shown
to increasingly assimilate DMSP at higher salinities (Tang et
al., 1999). Likewise, DMSP ingestion by copepods increased
with increasing DMSP content of the food (Tang et al., 1999).
Figure 10. Average zooplankton community composition between De Angelis and Lee (1994) showed that T. longicornis feed-
the sea surface and the halocline for stations with distinct (left bars) ing on Dinophyceae (Prorocentrum minimum) resulted in the
and without distinct (right bars) subthermocline methane enrich-
highest methane production rates per copepod, which sug-
ments. Three replicate samples were taken at station TF0271 in a
gests a link between the DMSP/DMSO content of the diet
period of 10 days to investigate the temporal variability in the com-
munity composition at this location. and zooplankton-associated methane production. Based on
the observed zooplankton and phytoplankton distributions
(Figs. 8, 9 and 10), we speculate that the development of
distinct subthermocline methane enrichments in the central
www.biogeosciences.net/16/1/2019/ Biogeosciences, 16, 1–16, 201912 B. Stawiarski et al.: Controls on zooplankton methane production in the central Baltic Sea
To retrieve further information about potential trophic re-
lationships between T. longicornis and Dinophyceae, lipid
biomarkers of concentrated plankton samples from two
depths, the surface layer and subthermocline waters were
analysed. Also, samples from stations with (TF0271) and
without (TF0250) distinct subthermocline methane enrich-
ment were compared. Although individual fatty acids have
to be assigned cautiously to specific taxonomic groups, the
distribution of these compounds in copepod neutral lipids
has been shown to largely reflect the lipid composition of the
prey (Peters et al., 2013). Figure 11a shows the neutral lipids
extracted from the surface-layer phytoplankton obtained at
station TF0271. The fatty acids contained in samples from
this depth revealed major contributions from cyanobacteria
(typically high in 16:0 and C18 fatty acids), diatoms (high in
20:5), and Dinophyceae (22:6; cf. Peters et al., 2013), which
corresponds to the phytoplankton community composition
observed at this station by microscopy (Fig. 8a). The rela-
tively high abundance of Dinophyceae in the surface layer
was further reflected in the presence of 24-norcholesta-5,22-
dien-3β-ol (265,22 ), an unusual sterol that is regarded as a
specific marker for these algae in temperate waters (Rampen
et al., 2007).
Compounds extracted from the subthermocline zooplank-
ton community at station TF0271, dominated by T. longicor-
nis (52 %), revealed a broad similarity to the phytoplankton-
derived lipids, and reflected the diurnal feeding behaviour of
these copepods in the surface mixed layer (Fig. 11b). No-
tably though, lipids of putative dinophyte origin were con-
siderably enriched, supporting the idea of a preferential up-
take of these algae by T. longicornis. In contrast, mixed zoo-
plankton obtained at reference station TF0250 contained few
T. longicornis (10 %) but relatively more Acartia spp. (37 %)
Figure 11. GC–MS chromatograms of neutral lipids (methyl es-
and Pseudocalanus spp. (32 %). This sample showed much
ter/TMS derivatives) from mixed-layer phytoplankton (a) and sub-
lower relative amounts of the Dinophyceae-derived biomark-
thermocline zooplankton (b) at station TF0271 (with a distinct sub-
thermocline methane enrichment). Data from subthermocline zoo- ers 22 : 6ω3 and 265,22 , indicating only a minor importance
plankton at TF0250 (without a distinct subthermocline methane of this food source at the reference station (Fig. 11c). Alto-
enrichment) are shown as a reference (c). Main compounds are gether, our biomarker data further corroborate our suggestion
labelled and interpreted as follows (see text for further discus- that the feeding of T. longicornis on (DMSP/DMSO-rich)
sion); 16:0, n-hexadecanoic acid (unspecific, high in bacteria); Dinophyceae may be an essential factor in the development
14OH / 16OH, n-tetradecanol and n-hexadecanol (copepod wax es- of subthermocline methane enrichments in the central Baltic
ters); 18:1, oleic acid (unspecific, high in heterotrophs but also Sea.
in (cyano)bacteria); 20:5, n-eicosapentaenoic acid (phytoplankton, We further assume that zooplankton-associated production
high in diatoms); Std, internal standard; 22:6, n-docosahexaenoic of fecal pellets and the transit of these pellets through the
acid (phytoplankton, high in Dinophyceae); 265,22 , 24-norcholesta-
water column play a critical role in the build-up of the pool
5,22-dien-3β-ol (specific for Dinophyceae); 275 , cholesterol (un-
of organic sulfur compounds in the central Baltic Sea. Sink-
specific, high in zooplankton, but also found in some algae in-
cluding Dinophyceae). Compounds indicating contributions from ing velocities are low for pellets produced from Dinophyceae
Dinophyceae-derived lipids are highlighted with an arrow. Note en- (Hansen and Bech, 1996; Thor et al., 2003). Hence, we pro-
hanced levels of these biomarkers in T. longicornis-dominated zoo- pose that high degradation rates of those fecal pellets and
plankton at the station with a distinct subthermocline methane en- an efficient microbial turnover of the contained organic sul-
richment (TF0271). fur compounds (e.g. DMSP; Tang, 2001) contribute to the
subthermocline methane enrichment. The gradual loss of or-
ganic sulfur compounds from fecal pellets could plausibly
Baltic Sea is influenced by the combination of T. longicornis explain the increase in copepod-specific methane production
and relatively high abundances of Dinophyceae. over time, as measured in our incubation study (Figs. 6b and
Biogeosciences, 16, 1–16, 2019 www.biogeosciences.net/16/1/2019/B. Stawiarski et al.: Controls on zooplankton methane production in the central Baltic Sea 13
7). Unfortunately, no Dinophyceae culture was available for analysis. UG performed the oceanographic modelling of the up-
our field experiments, because of their relatively low growth welling event. SS performed the stable carbon isotope analyses. GR,
rates (Carpenter et al., 1995) and mixotrophic feeding re- ML, and NW helped with the data analyses and interpretation. All
quirements (Tong et al., 2010) that did not allow an ade- the authors co-wrote the manuscript.
quate radio labelling of the culture with sodium bicarbon-
ate. Likewise, the relatively low production rates observed
in our experiments could be explained by the lack of appro- Competing interests. The authors declare that they have no conflict
of interest.
priate substrates for methane production, as Cryptophyceae
(i.e. Rhodomonas sp.) contain only low amounts of DMSP as
compared to other phytoplankton groups (Dong et al., 2013).
Acknowledgements. We thank Nicole C. Power Guerra for her help
Furthermore, we used 0.2 µm filtered seawater in our incu- at sea and in the laboratory. We would also like to thank Michael
bations, which was depleted in microorganisms. However, Glockzin for producing the map and Juha Hatakka (Finnish
these microorganisms might be relevant for the turnover of Meteorological Institute) for providing the atmospheric methane
DMSP to methane outside of the copepod bodies. concentration data from station Utö. Further, we appreciate the
critical comments by Jörg Dutz. We thank the captain and crew
of R/V Alkor for technical support. This work was supported by
4 Summary and conclusions the German Research Foundation (DFG) through grant SCHM
2530/5-1 to Oliver Schmale, DFG grant LA 1466/10-1 to Matthias
Several processes that produce methane in oxic waters have Labrenz, and DFG grant LO 1820/4-1 to Natalie Loick-Wilde.
been recently identified and it is assumed that climate change
will impact their source strength, with far-reaching conse- The publication of this article was funded by the
quences for methane flux and climate feedback. However, Open Access Fund of the Leibniz Association.
mechanisms and magnitudes of these sources remain vague.
Based on our findings, we conclude that zooplankton con- Edited by: Helge Niemann
Reviewed by: Susan Mau and one anonymous referee
tributes to subthermocline methane enrichments in the cen-
tral Baltic Sea by (1) direct methane production within the
digestive track of copepods and/or (2) indirect contribution
to methane production through release of methane precursor
substances into the surrounding water, followed by micro- References
bial degradation to methane outside the copepod’s body. Fur-
Bange, H. W., Bartell, U. H., Rapsomanikis, S., and Andreae, M. O.:
ther, our field observations combined with lipid biomarker
Methane in the Baltic and Noth Seas and a reassessment of the
studies indicate that a distinct food web segment consisting marine emission of methane, Global Biogeochem. Cy., 8, 465–
of DMSP-rich Dinophyceae and the copepod T. longicornis 480, 1994.
may foster the build-up of methane anomalies in oxic waters Berggreen, U., Hansen, B., and Kiørboe, T.: Food size spectra, in-
of the central Baltic Sea. For future studies, we recommend gestion and growth of the copepod Acartia tonsa during devel-
using unfiltered in situ water for the incubations. We further opment: Implications for determination of copepod production,
suggest cultivating Dinophyceae under controlled laboratory Mar. Biol., 99, 341–352, 1988.
conditions before the field campaign and feeding these radio- Bianchi, M., Marty, D., Teyssié, J.-L., and Fowler, S. W.: Strictly
labelled organisms to in situ copepods directly after sampling aerobic and anaerobic bacteria associated with sinking particu-
in the field. These incubations should be accompanied by a late matter and zooplankton fecal pellets, Mar. Ecol. Prog. Ser.,
quantification of the DMSP and DMS content in phytoplank- 88, 55–60, 1992.
Carpenter, E. J., Janson, S., Boje, R., Pollehne, F., and Chang, J.:
ton and zooplankton as well as in the water column.
The dinoflagellate Dinophysis norvegica: biological and ecolog-
ical observations in the Baltic Sea, Eur. J. Phycol., 30, 1–9, 1995.
Caruana, A. M. N. and Malin, G.: The variability in DMSP con-
Data availability. The data presented here are included in the Sup- tent and DMSP lyase activity in marine dinoflagellates, Prog.
plement. Oceanogr., 410–424, 120, 2014.
Damm, E., Helmke, E., Thoms, S., Schauer, U., Nöthig, E., Bakker,
K., and Kiene, R. P.: Methane production in aerobic oligotrophic
Supplement. The supplement related to this article is available surface water in the central Arctic Ocean, Biogeosciences, 7,
online at: https://doi.org/10.5194/bg-16-1-2019-supplement. 1099–1108, https://doi.org/10.5194/bg-7-1099-2010, 2010.
De Angelis, M. A. and Lee, C.: Methane production during zoo-
plankton grazing on marine phytoplankton, Limnol. Oceanogr.,
Author contributions. BS, OS, and SO designed and built the 39, 1298–1308, 1994.
methane stripping-oxidation line and performed the incubation ex- Ditchfield, A. K., Wilson, S. T., Hart, M. C., Purdy, K. J., Green, D.
periments. JW and NLW supported the plankton sampling and the H., and Hatton, A. D.: Identification of putative methylotrophic
grazing experiments. VT and AKW conducted the lipid biomaker and hydrogenotrophic methanogens within sedimenting material
www.biogeosciences.net/16/1/2019/ Biogeosciences, 16, 1–16, 2019You can also read