Maritime Transport and Maritime Spatial Planning - Cross-border case study Simo Haanpää, Liisi Lees, Meeli Roose, Annina Vuorsalo
←
→
Page content transcription
If your browser does not render page correctly, please read the page content below
Simo Haanpää, Liisi Lees, Meeli Roose, Annina Vuorsalo

Maritime Transport and Maritime Spatial Planning
                 Cross-border case study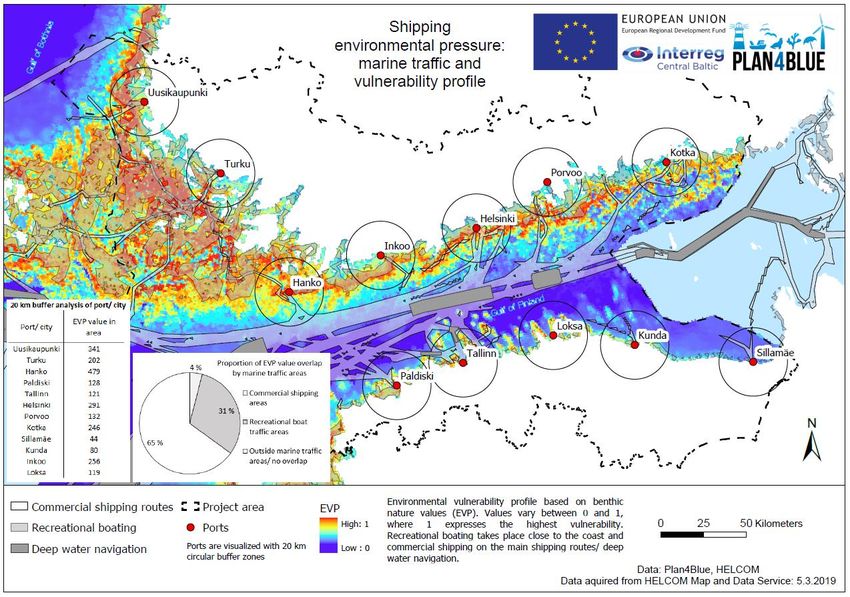
ABSTRACT

Title: Maritime transport and Maritime Spatial Planning

Author(s): Simo Haanpää, Liisi Lees, Meeli Roose, Annina Vuorsalo

Abstract: The general aim of this study is to examine the role of the maritime transport in Maritime Spatial
Planning (MSP). The target group are planners, stakeholders, decision makers.

The study outlines and maps the marine space contemporary and potential requirements related to expected
developments of maritime transport and ports in the Plan4Blue project area.

The case also looks at how MSP can support sustainable development of maritime transport.

During the publishing of this report both the Estonian and Finnish MSP processes were ongoing. According to
directive 2014/89/EU national maritime spatial plans shall be established as soon as possible, and at the latest
by 31 March 2021.

Acknowledgements

The authors are thankful for INTERREG Central Baltic programme for co-funding the Plan4Blue project. Authors
would also like to thank their colleagues and project team members for their valuable input and support.

The document should be sited as follows:

Haanpää, S., Lees, L., Roose, M., Vuorsalo, A. (2019). Maritime Transport and Maritime Spatial Planning.
Plan4Blue report.

                                                                                                            2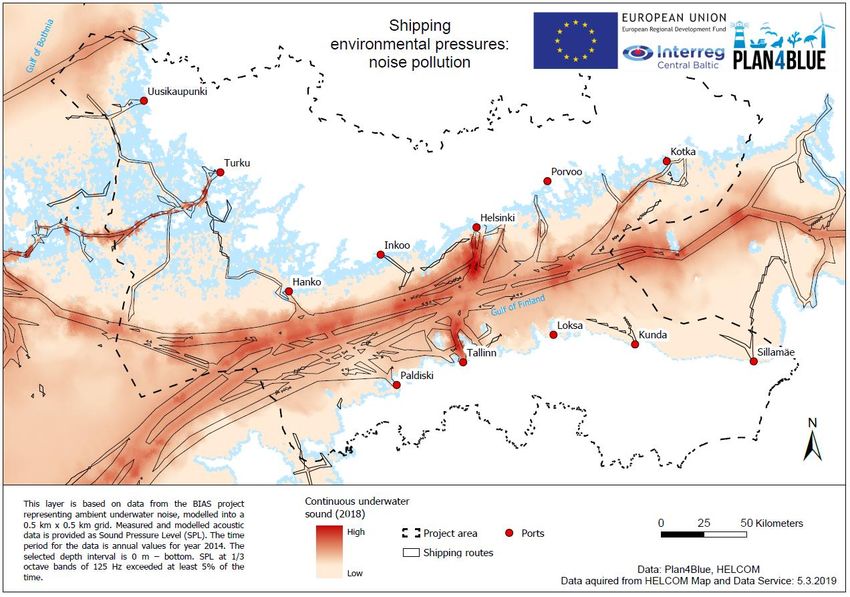
CONTENTS

1. BACKGROUND ............................................................................................................... 4
1.1      Objective of the report...............................................................................................................................5

2. MARITIME TRANSPORT IN ESTONIA AND FINLAND .................................................. 7
2.1 Estonian and Finnish strategies related to shipping ..................................................................................8
  2.1.1 Estonian strategies.....................................................................................................................................8
  2.1.2 Finnish strategies .......................................................................................................................................9

2.2 Spatial background information ................................................................................................................ 10

2.3 Developments in Maritime Transport ........................................................................................................ 18
  2.3.1 Economic developments ......................................................................................................................... 19
  2.3.2 Technological developments .................................................................................................................. 19
  2.3.3 Environmental developments .................................................................................................................. 20
  2.3.4 Safety and security developments .......................................................................................................... 21
  2.3.5    Port developments ............................................................................................................................. 21

3. MARITIME TRANSPORT IN MARITIME SPATIAL PLANNING ................................... 28

4. CONCLUSION ............................................................................................................... 29
   4.1 Key messages to MSP ............................................................................................................................... 29

REFERENCES ..................................................................................................................... 31

                                                                                                                                                              3
1. BACKGROUND

International Maritime Organization (IMO) is the intergovernmental organization tasked to regulate global mari-
time transport. “IMO is the United Nations specialized agency with responsibility for the safety and security of
shipping and the prevention of marine and atmospheric pollution by ships. Its main role is to create a regulatory
framework for the shipping industry that is fair and effective, universally adopted and implemented. IMO measures
cover all aspects of international shipping to ensure that the sector remains safe, environmentally sound, energy
efficient and secure” (IMO, 2019).
The aim of EU regulation is to safeguard free movement of goods and people within the EU. Most of the actions
on community level concerning maritime transport have been taken as a response by the member states to the
changes in the international maritime environment. Such changes have mainly been caused by marine accidents
and oil spills. A good example of EU regulation is the Port State Control Directive which targets substandard
ships (EUR-Lex, 2009). In 2014 EU established a framework for maritime spatial planning (MSP)” aimed at
promoting the sustainable growth of maritime economies, the sustainable development of marine areas and the
sustainable use of marine resources” (EUR-Lex, 2014). According to the framework Member States shall estab-
lish a maritime spatial plan, which is a tool for long-term planning of marine space.
MSP follows all the relevant existing regulations and conventions. In Estonia MSP itself is regulated by Planning
act and in Finland by Land Use and Building Act. There will be one marine plan for the whole Estonian marine
area, where internal waters and EEZ are part of this area while in Finland eight coastal Regional Councils will
conduct actual planning which results in 3 MSPs. In Estonia MSP is in principle a legally binding document while
in Finland it is treated more as a strategic document.

Maritime transport is one of the key activities in the sea space. Navigation rules are agreed and set by IMO and
most of the agreed regulations are ratified and integrated into national laws by the states around the Baltic Sea.
One of the principles mentioned in the United Nations Convention on the Law of the Sea (UNCLOS) are “innocent
passage” and “transit passage”. Innocent passage is a right of free passage through territorial waters which exists
only as long as the foreign vessel respects coastal state regulations and do not interfere with or threaten the
tranquillity of the coastal state. (Smith, 1976 via Burke et al., 1983). Transit passage is solely for the purpose of
continuous and expeditious transit of the strait between one part of the high seas or an exclusive economic zone
and another part of the high seas or an exclusive economic zone. (UNCLOS, 1982) IMO has also highlighted the
Baltic Sea as a Particularly Sensitive Sea Area (PSSA) within which certain specific measures are to be taken,
including traffic management and the stricter application of requirements in respect of discharges and equipment
(Kopti et al., 2016).
MSP does not foresee considerable spatial changes to maritime transport in the project area. Estonian MSP
reflects the shipping lanes published in the navigation information and determines marine traffic areas based on
the traffic density and main driving directions. Marine traffic areas have been designated in cooperation with the
Estonian Maritime Administration by assessing AIS data. (Rahandusministeerium, Hendrikson&KO, 2019). In
Finland existing navigation and port information is taken into account and maritime transport is tackled as one of
the main sectors in MSP.
The shipping routes are transnational by nature, which means that efficient, effective, sustainable and safe plan-
ning requires cross-border cooperation. Baltic Sea is one of the most intensively trafficked areas in the world with
a sensitive and vulnerable ecosystem and occasionally rough weather conditions, which makes its coordinated
planning essential (Baltic LINes, 2016). Furthermore, European "Blue Growth" agenda is expected to encourage
even more activities to take up space and resources in the limited and sensitive sea area. MSP could play a
crucial role in managing shipping when considering the new developments (unmanned and autonomous ship-
ping, offshore wind farms, etc.), larger ships, increased trade volumes and new policy guidelines.

So far, the Estonian and Finnish maritime sectors have not experienced any spatial conflicts with other interests
in the planning context. Shipping industry is dependent on many variables: economic fluctuations, standards,
guidelines and regulations, technological developments and climate change. Artificial structures and other new
uses in the sea may raise the discussion about the potential increase of navigational risk, and may push the
development of risk management plans.

Information used in this report is based on the literature review and stakeholder workshops. Workshop partici-
pants were a mix of academia, industry and government representatives, whose daily work is connected with
maritime transport.

                                                                                                                 4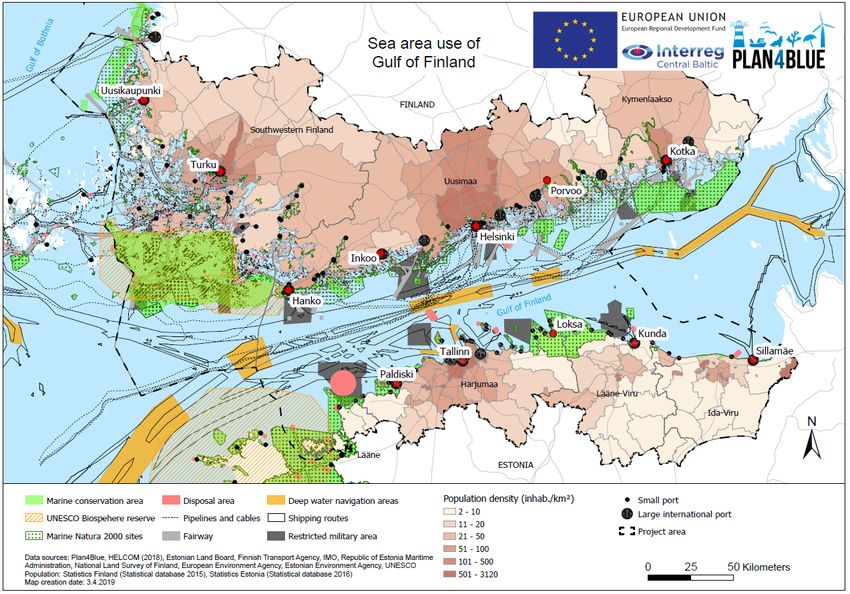
1.1            Objective of the report
Plan4Blue maritime transport case aims to outline and map the marine space contemporary and potential re-
quirements related to expected developments of maritime transport and ports in the project area.

The case also looks at how MSP can support sustainable development of maritime transport. Shipping induced
environmental pressures are analysed together with the stakeholders.

The objective is to explore issues that are most vital to the maritime transport - safety, continued operation,
business success and efficiency of sustainable eco-socio-technical maritime transportation system. The aim of
MSP in the Gulf of Finland region is to allocate the necessary marine space for effective and efficient development
of maritime transport and other Blue Economy sectors concerned.

Figure 1. Sea area use and population density in the Gulf of Finland area.

The Gulf of Finland sea area is characterized by sensitive environment, heavy maritime traffic and the multi-use
of marine space (Figure 1). According to IMO, the Baltic Sea Area has some of the densest maritime traffic in the
world. The Baltic Sea was designated as a Particularly Sensitive Sea Area (PSSA) at IMO Marine Environment
Protection Committee’s 53rd session in July 2005.

The population in the coastal areas around Gulf of Finland area is 3,1 million (compared to total population of 1,3
million in Estonia and 5.5 million in Finland), 74% of which is on the Finnish side and 26 % on the Estonian side
(Table 1). Nearly half (~46%) of the total combined population lives in the coastal areas.

                                                                                                               5
Table 1. Number of people living in the coastal areas around Gulf of Finland.

                                                                                6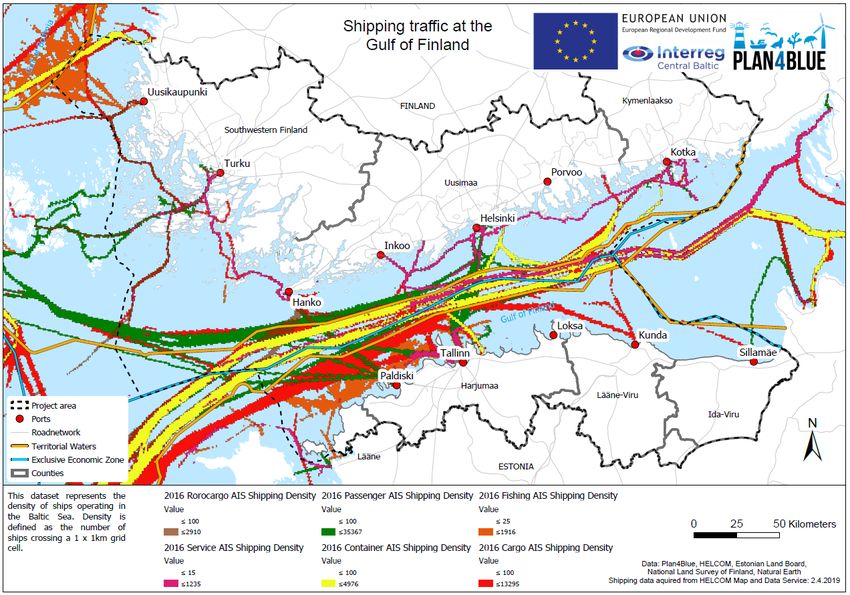
2. MARITIME TRANSPORT IN ESTONIA AND FINLAND

Finland is highly dependent on maritime transport, as 90 % of exports and 80 % of imports are shipped (Liikenne-
ja viestintäministeriö, 2014). In 2016, 48,4 million tons of good were exported through Finnish harbours and 46,5
million tons of goods imported, while passenger traffic totalled close to 19 million persons, nearly half of these
from Helsinki to Tallinn (Finnish Transport Agency, 2017). In all, the maritime cluster offers some 43 500 jobs.
The Finnish fleet consists of more than 1200 ships, out of which 118 are merchant vessels. These in turn handle
about 30 percent of total exports. International shipping routes serve more than 18 million passengers annually
(Liikenne- ja viestintäministeriö, 2014).

“In 2018, approximately 10.7 million passengers used the services of Estonian ports in international sea traffic,
which is less than in 2017 (10.9 million in 2017). The drop was mainly due to a decrease in the number of
passengers travelling between Estonia and Finland, where the number of passengers transported reached 8.9
million. Between Estonia and Sweden, 1.3 million sea passengers were transported, i.e. slightly less than the
year before. In the cruise season from April to October, 652,790 cruise passengers arrived by sea to Estonia, i.e.
a tenth more than the year before” (Statistics Estonia, 2019a).

60% of Estonia’s export and import is done by sea and most of the transit is carried out through harbours (Esto-
nian Ministry of Economic Affairs and Communications, 2010). According to Statistics Estonia, in 2018, com-
pared to 2017, the number of passengers on the main scheduled domestic ship lines increased by 3% (to 2.5
million), the number of international traffic passengers served by Estonian ports decreased by 1% (6.9 million),
the freight volume of ports in tonnes increased by around 3%. (Statistics Estonia, 2019; Statistics Estonia, 2019a).
There are currently 27 cargo harbours in Estonia. The bigger cargo harbours are Muuga (1157 foreign vessels
in 2017), Paldiski North Harbour (993), Paldiski South Harbour (844), Sillamäe (703) (Rahandusministeerium,
Hendrikson&KO, 2019). Estonian state fleet is 325 vessels (Vitismann, 2018) and in total there are 358 ships in
the ship register in 2017 (Estonian Maritime Administration, 2018).

Statistics Estonia (2019a) states that “in 2018, Estonian ports handled 35.9 million tonnes of cargo, which is 1.1
million tonnes more than in 2017. 24.5 million tonnes of goods were loaded (4% increase from 2017) and 11.4
million tonnes of goods were unloaded (1% increase from 2017) in Estonian ports in 2018. Transit goods were
loaded and unloaded in ports in the amount of 19.1 million tonnes (7 % increase from 2017). 14 million tonnes of
transit cargo were loaded and 5.1 million tonnes unloaded in Estonian ports. The most frequently handled group
of transit goods in Estonian ports were refined petroleum products (12 million tonnes), the transport of which
increased by 6% in a year. The loading and unloading of chemicals and chemical products as transit goods
amounted to 6 million tonnes, which is a fifth more than the year before. Sea container transportation through
ports increased by 5% compared to the previous year.”

According to the Estonian Maritime Information System (via Statistics Estonia, 2019a), in 2018, the largest num-
ber of ships arriving in Estonian ports from foreign ports (9,322) were general cargo vessels (incl. Ro-Ro passen-
ger ships), in addition 944 liquid bulk carriers, 295 container ships, 159 dry bulk carriers, 117 specialised carriers
and 340 cruise ships arrived in Estonian ports from foreign ports.

As in Estonia, short sea shipping prevails in Finland. Although the Finnish ports are capable of handling all types
of cargo, a majority of all cargo handled by the ports is bulk cargo. Dry bulk is typically delivered by RoRo and
RoPax vessels. This is due to the need to deliver the cargo domestically by trucks and due to the trade routes
focusing on southern Baltic sea, Baltic states and Sweden. Container traffic mainly arrives to Finland from South
Baltic, especially from Lübeck (Fridel, 2015). Regular and comprehensive passenger traffic between Tallinn and
Helsinki and partly between Helsinki and Turku and Stockholm is a special feature for the Finnish maritime sector,
that also serves cargo traffic and benefits both. (Helsingin satama, 2012). About a quarter of all bulk cargo is
transported with passenger vessels operating between Finland and Estonia and Finland and Sweden (Liikenne-
ja viestintäministeriö, 2014). Apart from passengers the Helsinki-Tallinn route carries considerable amount of
cargo, 2.8 million tons, rising to 4 million tons by 2022 (Helsingin satama, 2012).

                                                                                                                  7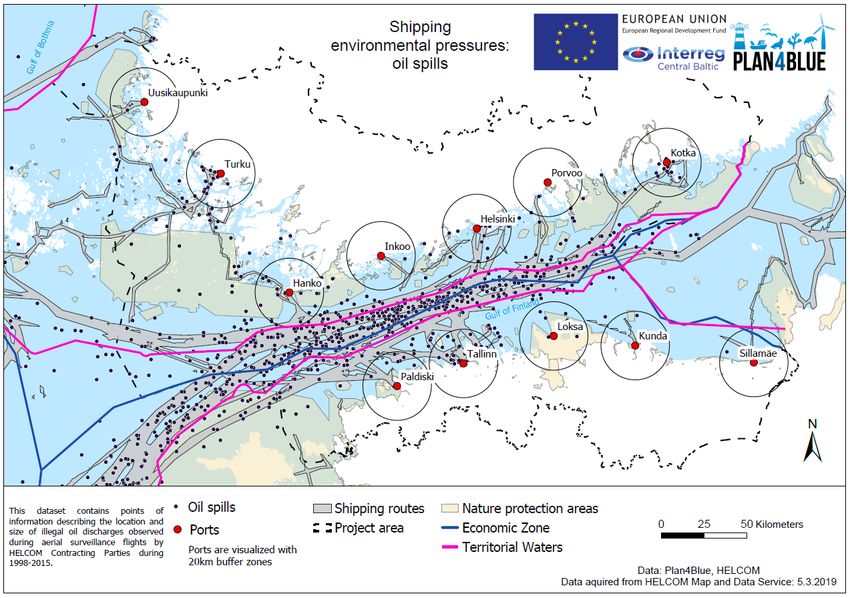
Although Finland currently has about 50 harbours used in international shipping, about 80 % of transnational
cargo is guided through the ten biggest ports. Four of these are located within the project area (ports of Turku,
Hanko, Helsinki and Sköldvik). Outside of container traffic Finnish ports handle products from timber and metal
industry. Growth in mining industry may in the future have a major influence on shipping, but this scenario in-
cludes great uncertainties. Crude oil and petroleum products form a major part of bulk cargo both in Southern
Finland and the Gulf of Finland as a whole. (Liikenne- ja viestintäministeriö, 2014).

Finland and Estonia are sole countries in the world where all harbours freeze over during a normal winter season.
Functioning of the infrastructure in winter is to be secured by stressing the need for adequate ice breaking ca-
pacity. Tough ice conditions in the winter require specialised fleet, which slows down the rate of change of the
fleet serving Finnish ports (Fridel, 2015).

At the moment, many ports in Southern Finland are upgrading their infrastructure and increasing the draft of their
fairways. The main ports also have a readiness to expand and adjust their services to suit any rising needs.
Therefore, although changes in the operating environment of the ports are ongoing, it seems that the current port
network is well suited to meet foreseeable future demands. Improvements in harbour logistics and infrastructure
and in road network and introduction of new service models are ways to increase the competitiveness of the
ports further and to maintain current customer relations.

It is to be noted that recent upgrading of the Russian deep-water terminals of Primorsk and Ust-Luga has over
the past few years had a major impact on the cargo volumes in the Baltic sea area, as well as on the share of
different cargo types and on the balance in transport volumes between eastern and western Baltic. In all, some
40 % of all cargo transported by sea was liquid cargo in 2014 and a vast majority of this crude oil and petroleum
products. Over the previous decade the total volume of seaborne cargo transport rose by a fifth. It is seen that
this trend will prevail in the coming years (Fridel, 2015). Russia is a major player in container traffic, too, and this
strongly impacts the economy and quantity of container traffic in Finnish ports especially through Russia-bound
transit traffic. Growth in transportation to Russia not only increases traffic to Finnish ports, but also brings empty
containers available for export, thus lowering export costs. Numerous uncertainties on the future of Russian
transport exist however, outside economics and trade politics including development of Russian ports both in the
Baltic sea and Black sea regions (Venäläinen, 2018).

Overall there is a global trend for the increase in cargo transport, which can be noticed in Estonia and Finland.
Maritime sector continues to be very important sector for both Estonia and Finland. In addition, fishing vessels
account for a significant part of maritime traffic, especially trawling traffic between the ports and fishing areas.
Recreational traffic and leisure boating increases during the summer season, which adds pressure to the coastal
areas. (Rahandusministeerium, Hendrikson&KO, 2019).

2.1 Estonian and Finnish strategies related to shipping

2.1.1 Estonian strategies

National Spatial Plan “Estonia 2030+” states that Estonia is open to the sea. International passenger ship
services have clustered in the capital. The Old City Harbour in Tallinn handles more than eight million passengers
annually (2011) but is ready to receive 1.5 times more. Regular connections by passenger ships could be orga-
nized also out of the harbours of Paldiski, Sillamäe and Kunda. Planning is under way for routes between Kunda
and Kotka and between Tartu and Pskov. On the Kunda–Kotka route, the ship does not need to sail through the
territorial waters of Russia, as it did on the Sillamäe–Kotka route, which made the travel time too long and even-
tually unprofitable. (Estonian Ministry of the Interior, 2013)

One of the drivers of Estonia’s development is international freight transport. Providing transit and logistics ser-
vices is a great export opportunity for Estonia. A location on the east coast of the Baltic Sea provides opportunities
to channel both west-east and north-south trade flows. Efficient utilisation of marine space and connecting ports
to other infrastructure is one of the main factors in improving Estonia’s international competitiveness, enabling it
to participate in trade between Russia, Asia and Europe. The cargo ports (particularly Muuga) with their railway

                                                                                                                    8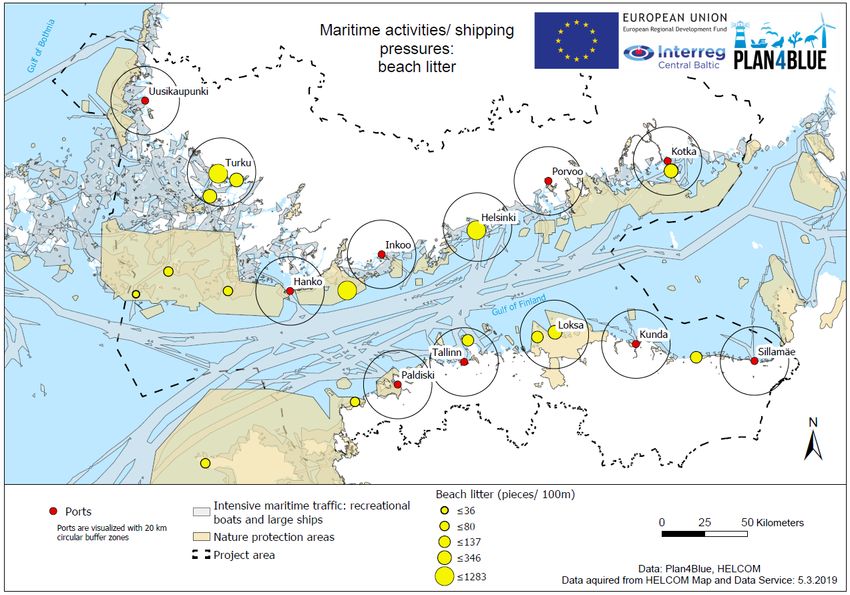
and road connections in the Tallinn area are an important transit and logistics hub. The high-potential harbours
of Paldiski and Sillamäe need to be involved in international transport more than currently. The capacities of the
harbours of Muuga and Sillamäe are yet to be fully exploited. A number of harbours with a good export potential
remain untouched by international transit flows, some ports could improve the competitiveness of the local econ-
omies and export or import goods important for those regions (Pärnu, Virtsu, Roomassaare, Kunda). (Estonian
Ministry of the Interior, 2013)

Estonian Marine Policy 2012–2020: a long-term planning basis for the marine sector. The goal of the develop-
ment plan is to use and maintain Estonia’s marine resources as much as possible and contribute to the develop-
ment of the marine sector. For that purpose, the development of marine business should be supported, mainly
accompanied by the improved safety of vessel traffic and other marine-related activities, the protection of marine
and coastal environment and marine cultural heritage (Estonian Ministry of Economic Affairs and Communica-
tions, 2019).

National Transport Development Plan 2014-2020 describes the plans for both international passenger and
carriage of goods. Economic efficiency and environmental soundness have become the most important aspects
for planning the development of the transport sector. It is stated that overall simplification of port-related formali-
ties is an important initiative (Estonian Ministry of Economic Affairs and Communications, 2019a).

Programme of measures of the Estonian marine strategy 2016-2020. Obligation stemming from European
Unions’ Marine Strategy Framework Directive (MSFD, 2008/56/EC), all member states have to establish and
implement the programme of measures to achieve or maintain good environmental status of the marine areas by
2020. The composed programme of measures covers the whole Estonian marine area, including internal waters,
territorial sea and exclusive economic zone. Some measures directly linked to shipping are: ratification and
implementation of the International Convention for the Control and Management of Ships' Ballast Water and
Sediments (BWMC), and participating in the regional information system; creating the readiness to use liquefied
natural gas (LNG) as ship fuel; managing environmental risks concerning bunkering at sea (Estonian Ministry of
Environment, 2012).

Internal Security Strategy for 2015–2020. Marine-related instruments are ensuring sea rescue capability and
responding to marine pollution (Estonian Ministry of the Interior, 2018).

Estonian Environmental Strategy 2030. Marine related goals: preservation, addition and development of the
existing network of protected areas; formulation of measures to exclude non-indigenous species and avoid the
spread of new potentially invasive non-indigenous species (Estonian Ministry of Environment, 2007).

2.1.2 Finnish strategies

Finland’s maritime strategy 2014–2022, prepared by the Ministry of Transport and communications, transport
policy department (Liikenne- ja viestintäministeriö, 2014) aims to serve the Finnish economy, business life and
employment, while taking into account the new environmental norms. The strategy observes both the current
state and future challenges of the sector and outlines a vision for 2030. The main themes addressed in the
strategy are international competitiveness in the form of fairway dues and winter and environmental technology
and in skills and know-how of the maritime cluster. The strategy also acknowledges recreational activities and
tourism, which depend on high-quality maritime services and safe and clean water. The Finnish know-how is also
seen as an export asset, especially as regarding sustainable logistics concepts.

A major issue discussed in the maritime strategy is the level of national fairway dues, which has an impact on
the competitiveness of the Finnish economy and that of the Finnish ports compared to the Nordic and Baltic
countries and Russia. Another factor impacting the operating costs is the sulphur directive, which raises operating
costs and may lead to re-routing of transport of goods.

In relation to this the overall service level, competitiveness and attractiveness of maritime traffic in itself and in
relation to other transport modes are themes to be focused on in the future, according to the strategy. Developing
of the logistics and services of the industry for example by utilizing knowledge and technology to the fullest is
seen as a key strategy in maintaining the competitiveness of the industry. Depending on the type of cargo, many
maritime transportations can be re-routed with relative ease. Integrating harbour functions deeper into the logis-
tics network by new types of service provision is a means to find new business operations and to anchor the old
customers to certain ports.

                                                                                                                   9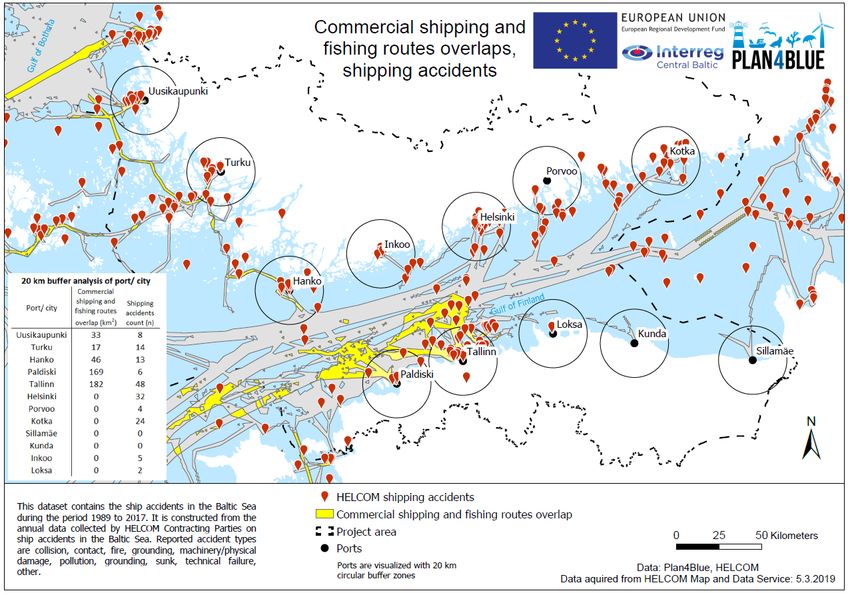
Developing of maritime infrastructure has a limited role in the strategy. These needs are shortly referred to in
relation to energy efficiency of maritime transport, where the characteristics of ports and shipping lanes play a
role, alongside with engine technology, travel speed and energy sources used. Drive for energy efficiency and
reduction of sulphur emissions also may have an impact on vessel size and through that on the demands for
shipping lines. However, demands specific to Gulf of Finland such as the need for hull modifications (fortification)
against ice conditions and customer demand impacting on the types of freight slow down the rate of change of
the fleet. As a specific means to support the competitiveness of Finnish economy the need to deepen the shipping
line to Vuosaari harbour in Helsinki is mentioned.
It is seen that the global economy and the political and economic development in Russia alongside with port
infrastructure development especially in Russia have a major impact on the maritime transport and with it to the
investments made in developing the maritime infrastructure. The nature of transportation network in Finland and
its geographical location seem to slow down the changes expected in other parts of the world, such as strong
increase in container traffic and the growth of vessel size. The current port network is adequate for current and
foreseeable needs and should major changes occur in the future, these would mainly be due to changes in trade
routes and would mainly impact the relative importance of individual harbours, rather than driving port infrastruc-
ture developments on currently unoccupied sites.
2.2 Spatial background information
Geographic information is vital in spatial decision-making and planning. Maps have a central function in providing
visual interpretation of data. Visualisation of the MSP background information, scenarios and spatial plans on
maps are much more effective in communicating the information than narratives (Nylén et al. 2017). Maps help
in assessing a large set of background information and help to guide the decision-making process.
Regional datasets of Gulf of Finland were obtained from HELCOM Map and Data Service – an open access
server specialised in datasets on human activities and marine use which are free for downloading. Datasets used
in the following maps are compared and contrasted with an aim to discover spatial relationships and networks.
Common uses of spatial data involve comparing natural features with human activity. This set of maps is intended
to present maritime transport case core activities on the sea and related pressures. Accordingly, following exam-
ple layout themes are selected to present current maritime transport status of the Plan4Blue project area in 2019:
• oil spills, shipping routes, economic zone and territorial water (Figure 2)
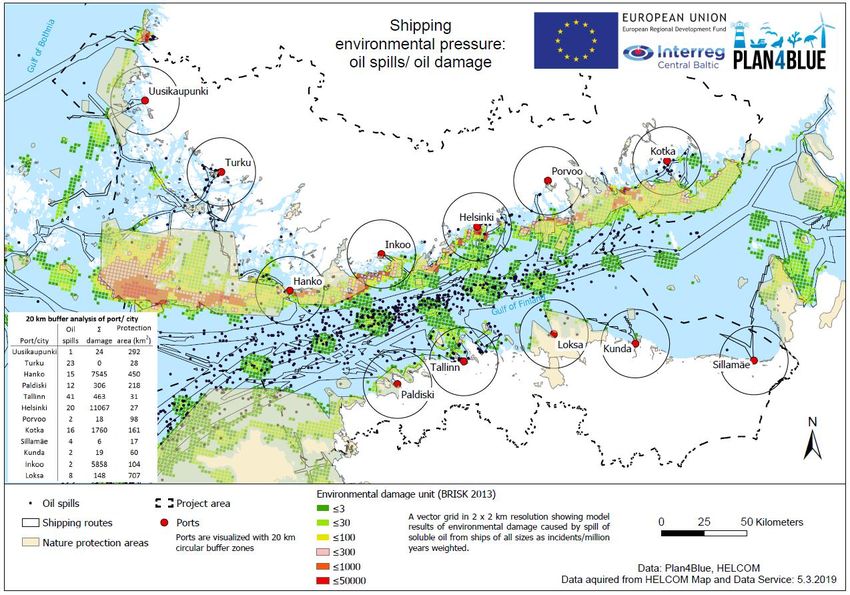
• oil spills, shipping routes and environmental damage unit (Figure 3)
• beach litter, shipping routes and nature protection areas (Figure 4)
• maritime traffic (commercial shipping and recreational boating) and environmental vulnerability profile
(Figure 5)
• noise pollution and shipping routes (Figure 6)
• commercial shipping and fishing routes (Figure 7)
• commercial shipping and fishing routes overlap areas and accidents (Figure 8)
The maps presented in this report have been produced for illustration purposes only. They are partly hypothetical
and do not represent the real situation or established view of the researchers, planners or stakeholders involved
in the Plan4Blue project.
Table 2. Datasets used in layout themes.
MAP LAYOUT Description of Data type Source Comment Other related da-
THEME the main layer tasets available
oil spills oil spills distri- vector, point Observed dur- Further infor- Oil slicks and
bution shapefile .shp ing aerial sur- mation: spills, Radioactive
veillance http://www.hel- substances Ce-
flights by HEL- com.fi/baltic- sium 137 (sea-
COM Con- sea- water, fish, herring,
tracting Parties flatfish), Risk of oil
spills from ship
10during 1998- trends/mari- acitivies (ground-
2015 time/illegal- ing, collision,
spills/
environmental environmental vector grid produced by Damage risk Environmental vul-
damage damage risk by .shp, 2 x 2 km COWI data vary de- nerability (summer,
oil, all ship resolution (www.cowi.dk) pending from fall, winter, spring),
types for the BRISK the ship sizes polluting ship acci-
project (small, large), dents, physical dis-
type of cause turbance or dam-
(chemical, oil) age to seabed
noise pollu- input of contin- raster grid .rst produced for dataset repre- pressure related
tion uous anthropo- the BIAS pro- sent modelled datas: Baltic Sea
genic sound ject acoustic data Impact Index
collected in (BSII), Baltic Sea
one year Pressure Index
(2014) (BSPI)
marine litter categorized vector, point provided by no underwater Sandy beaches as
sum value of shapefile .shp HELCOM con- litter from sea- point, sandy
beach litter tracting parties floor beaches as pol-
items in rela- in response to yline
tion to a 100 m data call for
strip of beach State of the
Baltic sea re-
port
ships routes IMO registered raster .rst based on HEL- datas from dif- Shipping density
and density ships operating COM AIS (Au- firent ships 2011-2015, Vessel
in the Baltic tomatic Identi- types and year storage capacity,
Sea fication Sys- (2006-2016) IMO ships routen-
tem) data are available ing guide, NOx
emissions from
ships, AIS pas-
sage line crossing
by ship type, Risk
of oil spills on colli-
sions/ fixed objects
on route (2020)
maritime acci- all accidents, vector, point collected by dataset con- Polluting ship acci-
dents which took shapefile .shp HELCOM tains the ship dents, AIS pas-
place in territo- Contracting accidents in sage line crossing
rial seas or Parties the Baltic Sea by ship type,
EEZ are re- during the pe- Depth contours
ported riod 1989 to
2017
environmental
vulnerability
Administrative Economic vector, line Marine back-
boundaries zone, Territorial shapefile .shp ground: MSP ar-
waters eas, Coastline,
Depth contours,
Depth relief map,
Baltic Sea Bathym-
etry Database,
Baltic Sea
11Pollution Load
Compilation sub
basins
Protection ar-
eas
Background map datasets selection is oriented from Maritime Activities in the Baltic Sea report (HELCOM, 2018).
In the report, the following shipping and environment interactions are observed: ship emissions, sewage, oil dis-
charges, chemicals discharges, ballast water, marine litter, underwater sound, anti-fouling systems.
Transforming spatial analysis results into meaningful implications for MSP facilitates work of planners, authorities
and stakeholders across sectoral borders (Nylén et al. 2019). Spatial analysis used in following map examples
are distance analysis (buffer), overlay analysis, grouping and reclassifying. Results are hypothetical conclusions
based on existing data.
Background maps use data of human activities (oil spills, noise pollution, recreational boating, beach litter), ship-
ping (oil spills damage, AIS shipping and fishing density, protection areas, shipping accidents), and background
data (economic zones, territorial waters). Plan4Blue project team provided environmental vulnerability profile
(Herkül et al. 2017), background data (protection area, ports, project area) (Nylén & Tolvanen 2017), and cur-
rently presented new analysis results (routes overlap, port profile analysis, vulnerability proportional distribution
analysis).
Figure 2. Map presentation of oil spills, main shipping routes, economic zone and territorial water.
Oil spills (Figure 2) are presented in relation to main shipping routes (IMO registered all ship types), administrative
boundaries, and protection areas (Table 2). Dataset contains points of information describing the location of
illegal oil discharges observed during aerial surveillance by HELCOM Contracting Parties during 1998-2015.
Majority of oil spills occur on the main shipping routes both on Finland and Estonian side. Main oil spills
12concentration is located in territorial waters. However, the number of spills has dropped significantly, from around
400–600 observed spills during the early 1990s to the 80 spills in 2015. Nowadays ports reception of oil is covered
with environmental fees to shipping and there is no economic reason to discharge oil to the sea. It is therefore
likely that these spills are (at least partly) the result of action by uninformed mariners from other sea areas who
are simply not aware of the rules and practices in the Baltic Sea (HELCOM, 2018).
Figure 3. Map presentation of oil spills, damage value, protection areas.
Oil spills damage to natural environment is presented on the second oil spills layer, where one can observe oil
spill locations, protection areas and modeled damage value (risk) for the environment (Figure 3). Additionally,
area in distance of 20 km from selected ports is compared. Helsinki, Hanko and Inkoo ports are situated at the
riskiest area in means of possible damage. Turku has 0 value in means of damage. Most oil spills are detected
around Tallinn (n=41). From Finnish side most oil spills are detected around Turku (n=23) and Helsinki (n=20).
In Estonia, Loksa area has most coverage of protection zone (707 km 2), and accordingly Hanko in Finland (450
km2).
13Figure 4. Map presentation of beach litter in the study area.
Spatial distribution of marine beach litter along the coastline in the basins of the Gulf of Finland is presented on
Figure 4. Marine litter from ships is challenging to map, as it can be transported long distances by water cur-
rents. Large part of the total amount of the litter is deposited on the seafloor (Galgani et al. 2015). Floating litter
accumulates on the shore and at that moment it is impossible to link to the source. HELCOM provides beach
litter data, which is collected as solid littler from the beach line.
14Figure 5. Map presentation of environmental vulnerability profile and marine transport pathways.
Plan4Blue project team has developed special dataset presenting environmental vulnerability based on benthic
values. It is seen that coastal area is the most vulnerable and as it goes deeper vulnerability profile reduces
sharply to low values. During the workshop the relation of recreational/small boating and high vulnerability profile
values were discussed. Map presentation also emphasizes the result that in the whole project area, 31% of the
most vulnerable area is located where recreational boating is performed the most (Figure 5).
15Figure 6. Noise pollution and shipping routes.
Sound pollution in project area is visualized in Figure 6. Underwater sound can affect natural environment by
changing animal behavior. The primary sound pollution source in marine area is associated with ships propel-
lers, hull form, on-board machinery and operational aspects (HELCOM, 2018).
16Figure 7. Commercial shipping and fishing routes.
HELCOM AIS (Automatic Identification System) registers all shipping movement. For workshop purposes traffic
statistic was visualized in commercial shipping and fishing categories (Figure 7). Overlap of the two sectors is
analyzed in relation to shipping accidents (Figure 8).
17Figure 8. Commercial shipping and fishing routes overlap areas and accidents.
This dataset presents the ship accidents and overlaps of intensive shipping and fishing routes. Main overlaps
are in Tallinn, Paldiski, Hanko, Uusikaupunki, Turku. In Finland, fishing ship activities are located on the east-
ern coast and in Estonia on the northern coast. Sea area is deeper in these locations which concentrates the
fishing activities in certain points (e.g. trawling cannot be done near the Gulf of Finland coast, as it has more
shallow water sea floor. Moreover, notable overlap areas e.g. in Paldiski and Tallinn coasts have notable differ-
ence in means of accident history. One could observe that lot of overlap does not necessarily mean lot of acci-
dents. Accidents data contains all types of collision accidents (e.g. including collision with fixed structures,
grounding etc).
Overlaps map presented in Figure 8 has been produced for illustration purposes only. It is hypothetical and do
not represent the real situation or established view of the researchers, planners or stakeholders involved in the
Plan4Blue project.
2.3 Developments in Maritime Transport
This chapter is based on a literature review with an aim to research on economic, technological, environmental
and safety and security developments. The chapter also touches on port developments looking at bigger Finnish
and Estonian ports in the project area.
The Review of Maritime Transport 2018, an annual United Nations publication issued by the United Nations
Conference on Trade and Development (UNCTAD), has highlighted seven key trends that are currently redefining
the maritime transport landscape and shaping the sector’s outlook. The Review of Maritime Transport (2018)
highlights these seven global key trends as follows:
181) geopolitical, economic uncertainty and trade policy risks are causing negative impact on maritime
transport
2) major implications to maritime transport from continued unfolding of digitalization and e-commerce and
the implementation of the Belt and Road Initiative
3) overly optimistic carriers competing for market share may order excessive new capacity, thereby leading
to worsened shipping market conditions, which will upset the supply and demand balance and have
repercussions on freight-rate levels and volatility, transport costs and earnings
4) effects of cooperative arrangements and mergers, liner shipping consolidation through mergers and alli-
ances has been on the rise in recent years in response to lower demand levels and oversupplied shipping
capacity dominated by mega container ships. This may impact global competition and smaller compa-
nies.
5) alliance restructuring and larger vessel deployment are also redefining the relationship between ports
and container shipping lines
6) value of shipping is not only determined by scale but also on the ability of the sector to use technological
innovations
7) environmental performance of international shipping is remaining high on the agenda.
2.3.1 Economic developments
Since historic times the Baltic Sea has been an important route for maritime trade (Helcom, 2018a). The Baltic
Blue Growth Agenda has showed that out of all maritime sectors, shipping is still by far the greatest generator of
gross value added in the region (Beyer, Schultz-Zehden et al. 2017). Shipping sector is highly dependent on the
global and regional economic development. Changes in the economic development have a direct effect on the
transport demand and, thus, on the well-being of the commercial shipping market (BalticLINes, 2016).
Over 80 per cent of global trade by volume and more than 70 per cent of its value is being carried on board ships
and handled by seaports worldwide, so the importance of maritime transport for trade and development cannot
be overemphasized. Uncertainty and various positive and negative risk factors are shaping the world economic
and merchandise trade outlook. As an example of recent positive development there is are Economic Partnership
Agreement concluded between the European Union and Japan in July 2017 and the Comprehensive Economic
and Trade Agreement (CETA) between the EU and Canada which provisionally entered into force in September
2017 (UNCTAD, 2017). The agreement with Japan contains obligations to maintain open and non-discriminatory
access to international maritime services as well as access to ports and port services (European Commission,
2017). European companies will have more opportunities to provide specialized maritime services like dredging,
moving empty containers, or shipping certain cargo within Canada (European Commission, 2017). In the longer
term, growing cross-border electronic commerce (e-commerce) could also support demand for container ship-
ping. Negative risk factors include the continued rebalancing of the Chinese economy towards domestic demand,
the emerging trade policy direction of the United States of America, as well as uncertainties associated with the
decision of the United Kingdom of Great Britain and Northern Ireland to leave the European Union (UNCTAD,
2017).
The economic impacts originate from two sources: the use of marine waters and the state of the marine environ-
ment. Human activities that are dependent on the sea bring substantial economic benefits, both in terms of their
effect on the national economy and employment and more broadly on citizens’ well-being (HELCOM, 2017).
2.3.2 Technological developments
Due to environmental pressures and technological advancements several changes are expected. An ongoing
trend is the increase in vessel size and the related growth of shipping companies. While transport volumes in-
crease, the shipping fleet mainly only grows in terms of the size of the vessels. This is connected to the practice
of slow steaming, that was originally picked up in response to rising fuel costs and oversupply of tonnage due to
global economic downturn. Now also hailed as a way to reduce emissions from shipping, largest vessels capable
19of carrying more than 18 000 TEU are from the start designed for slow steaming, while balancing between car-
rying capacity and reasonable draft of 15 meters or less. These vessels typically sail on the Asia to Europe route
ending in ports in Belgium or in the Netherlands, while smaller vessels serve the route forward to Gdansk, Poland
(Fridel, 2015). Container transport is on the rise on short sea routes from Middle Europe, too, but according to
Port of Helsinki will only grow moderately. On shorter routes bulk cargo transport prevails.
The increase in vessel size also applies to cruise ships, which frequently visit the ports of Helsinki and Tallinn
and lately also Kotka (HaminaKotka harbours in Mussalo and Kantasatama). Following the increase in vessel
size, HELCOM data suggests that the number of ports stay the same in the BSR but existing medium and large
ports are likely to grow by more than 50% in the next ten years to cope with larger ships.
The European Commission is seeing to strengthen e-navigation and pave the way for autonomous shipping as
one of the strategic action fields for shipping by 2030 (Beyer, Schultz-Zehden et al. 2017). We are at the beginning
of the development of autonomous shipping, which could change the sea use patterns (Trauthwein, 2018). In
order to promote autonomous traffic around the globe, the One Sea – Autonomous Maritime Ecosystem has
introduced roadmaps towards an autonomous maritime future (World Maritime News, 2017a). The Finnish col-
laboration gathers together the leading marine experts and is a strategic combination of top research, state-of-
the-art information technology and business (One Sea Autonomous Maritime Ecosystem, 2018). The work began
in 2016 to enable fully remote-controlled vessels in the Baltic Sea by 2020 and to achieve autonomous commer-
cial maritime traffic by 2025 (World Maritime News, 2017a).
At first, short sea shipping will use autonomous ships. This also implies increased competitiveness to move
transport from the road to the sea, where the gains are increased efficiency and reduction of emissions
(Trauthwein, 2018). However, the current international shipping law states that ocean-going vessels must be
properly crewed and therefore fully autonomous, unmanned ships are not allowed in international waters (The
Maritime Executive, 2017).
In 2017 IMO began discussions that could allow unmanned ships to operate across oceans (Matthews, 2017).
The first test area for projects related to autonomous shipping has been opened in Finland - the Jaakonmeri Test
Area (outside of project area). The test area is the first one in the world to be globally open to anyone wishing to
test autonomous maritime traffic, vessels, or related technologies (World Maritime News, 2017). There is also a
pressure to look for alternative fuels to comply with the stricter environmental standards and to become inde-
pendent from the oil market (Baltic LINes, 2016).
For years there has been a discussion on the possibility to build a tunnel to connect Helsinki and Tallinn. Mobility
between Helsinki and Tallinn has increased throughout the 2000’s. According to a study by KPMG commissioned
by the City of Helsinki and based on data from Statistics Finland, commuters from Tallinn to Helsinki in 2012
exceeded those from other large Finnish cities including Turku, Tampere and cities of Eastern Finland (FinEst
Link Project, 2019). The total cost estimate of the tunnel project has been estimated at 9-13 billion euros. If the
project received 40% of public funding of the total costs, the project could be economically sustainable. After
project initiation, financial negotiations and project planning the construction of the tunnel could start in 2025 at
the earliest, and the railway tunnel could be operational in the 2030’s. A 90 km long railway tunnel would cut the
travel time between Helsinki-and Tallinn down to 30 minutes. (FinEst Link Project, 2019a) The significantly shorter
travel time is expected to change the transport patterns in the Gulf of Finland and possibly reduce passenger
transport with ships.
2.3.3 Environmental developments
A number of policies are in place to reduce shipping-induced environmental pressures. Shipping is global by
nature; therefore, the key regulatory framework is coming from International Maritime Organization (IMO). Envi-
ronmental protection of the Baltic Sea also results from HELCOM, EU and different national, regional and local
policies.
The increasing environmental performance standards may pose a challenge to the shipping industry as IMO
regulations are transferred to the EU directives and national level regulations. The IMO has adopted regulations
on air emissions concerning energy efficiency and greenhouse gas emissions (GHG), nitrogen oxides (NOX),
sulphur oxides (SOX) as well as water emissions, such as the antifouling convention or regulations concerning
invasive species. Regional legislation mainly comes in the form of the Baltic Sea Action Plan, which aims to
restore the good ecological status of the Baltic Sea by 2021 (Abhold, 2015).
20The EU agreed in 2015 to lower the limit of sulphur content in the fuel of vessels operating in the Baltic sea to
0,1 %. It is actually possible that to an extent the tightening sulphur regulations mitigate the modal shift from land
to sea or change the ports of call; in Finland the south-western Port of Hanko has seen some growth during last
few years that can be attributed to this. The directive may also direct cargo traffic flows towards land-based
connections through Sweden and the Baltic states, supporting sea traffic between Helsinki and Tallinn but less
so between Helsinki and Stockholm, as this line is optimized for passenger needs; the Turku-Stockholm-connec-
tion is seen more suitable for westbound cargo (Fridel, 2015).
The Baltic Sea is ecologically unique and very sensitive marine ecosystem. Environmental standards and re-
quirements for the shipping sector are increasing. The IMO's Marine Environment Protection Committee adopted
a strategy requiring the shipping industry to reduce its total GHG emissions by 50% by 2050 (compared to 2008),
as well as cutting carbon dioxide emissions "per transport work" by at least 40% by 2030 (IMO, 2018). To follow
these cuts new vessels and technologies are needed.
As an example of innovative means to reach these goals, Norwegian tourist vessel owner and operator The
Fjords has taken delivery of a new 42-meter-long carbon fibre all-electric catamaran offering completely emission-
free transport. The vessel has a unique charging solution: 40-meter-long, 5-meter-wide floating glass fibre dock
housing a 2.4 MWh battery pack. This charges steadily throughout the day via connection to the local grid net-
work, which does not have the capacity to charge the vessel directly. The solution allows the vessel to stably,
efficiently and cost-effectively ‘refill’ in just 20 minutes. The dock also stores consumables, fuel for sister vessels,
and allows black water to be offloaded for treatment on land. (MarineLink, 2018)
Climate change can have a strong impact on shipping traffic as well as port development in the Baltic Sea.
Changes in global shipping routes due to climate change can have an effect to the shipping in Baltic Sea (Baltic
LINes, 2016). Gulf of Finland ports could possibly also benefit from ice-free conditions due to climate change.
2.3.4 Safety and security developments
The new spatial demands (e.g. offshore wind energy parks and its related infrastructure, marine protected areas)
and expected increase in leisure traffic will demand more sea space which can increase the risk of shipping
accidents (Baltic LINes, 2016). It is necessary to follow the international standards set, monitor trends and take
this information in careful consideration when planning the marine areas.
Maritime industry may be one of the oldest in the world, but modern shipping relies on modern Information and
Communication Technology (ICT) to compete and thrive in the global transport industry. Maritime industry is
relying on ICT for cargo documents, port arrangements, crew management and all the other services that ships
need to operate efficiently and competitively, ICT is widely used onboard in engineering systems and cargo
control and monitoring. ICT is not only used for commercial effectiveness, but for the safety of those onboard,
the wider society and the environment (Patraiko, 2016).
Unfortunately, cybersecurity on board vessels and at major ports has stayed behind compared with office-based
computer systems and competing industries throughout the world. It is necessary for the maritime industry to
adopt a proactive response to the growing cybersecurity threat (Belmont, 2015). The consequences of a cyber-
attack could be wide-ranging. For example, ship collisions could result from hacking of e-navigation. The Mari-
time Safety Committee (MSC) adopted Resolution MSC.428(98) on Maritime Cyber Risk Management in Safety
Management Systems in 2017. Based on the recommendations in MSC-FAL.1/Circ.3, Guidelines on maritime
cyber risk management, the resolution confirms that existing risk management practices should be used to ad-
dress the operational risks arising from the increased dependence on cyber enabled systems. IMO Resolution
MSC.428(98) encourages IMO member states to ensure that cyber risks are addressed in safety management
systems no later than the first annual verification of a company’s Document of Compliance after 1 January 2021.
(Gard, 2017).
2.3.5 Port developments
The developments in shipping industry (e.g. new types of vessels, new ways of handling cargo, etc.) are heavily
interlinked with port developments. Ports are important locations for trading goods, servicing passengers and
21supporting tourism. The maritime ports related marine space contemporary use and potential requirements are
outlined and mapped considering the actual development plans of significant Estonian and Finnish maritime ports
in the project area. From Estonian side the following significant ports are included in the case study: Port of
Tallinn harbours (Old City, Muuga, Paldiski, Paljassaare) and Port of Sillamäe. From Finnish side four interna-
tional ports are located within the project area: ports of Turku, Hanko, Helsinki and Sköldvik. (Liikenne- ja
viestintäministeriö, 2014).
2.3.5.1.
Figure 9. Estonian ports
Shipping traffic at the Gulf of Finland.
Port of Tallinn
Port of Tallinn (2019) is a partly state-owned company which got listed at Tallinn Stock Exchange in 2018. Port
of Tallinn is the biggest port authority in Estonia. The activities of Port of Tallinn are mainly cargo and its handling
activities; passengers and activities related to serving them; real estate development; shipping. Port of Tallinn
operates as a landlord type of port with no cargo handling operations of its own.
Port of Tallinn consists of five constituent harbours:
- Old City Harbour (+ Old City Marina)
- Muuga Harbour
- Paldiski South Harbour
- Paljassaare Harbour
- Saaremaa Harbour
Port of Tallinn also owns Muuga and Paldiski South Harbour Industrial and Logistics Parks.
22Old City Harbour
Old City Harbour is one of the biggest and busiest passenger harbours in the Baltic region and the biggest pas-
senger harbour in Estonia. Regular traffic is performed round the year from Tallinn to Helsinki, Stockholm, St.
Petersburg. Passenger service is available at two passenger terminals: A and D. As of today, the Old City Harbour
terminals are handling predominantly ro-ro cargo (rolling stock) (Port of Tallinn, 2019).
Table 3. Old City Harbour (Port of Tallinn, 2019)
General data
Territory 56 ha
Aquatory 94.0 ha
Number of berths 24
Total length of berths 4986 m
Max. depth 11 m
Max. length of a vessel 340 m
Max. width of a vessel 42 m
Terminals 2 passenger terminals (incl. ro-ro facilities)
Covered warehouse area 5 000 m²
The development plans of the Port of Tallinn envisage the Old City Harbour being converted fully into a passenger
port and therefore gradually moving cargo handling out of Old City Harbour to Muuga and Paldiski South Har-
bours. The territory released from under the cargo handling are closely associated with urban environment cre-
ation (connecting the port to the city) and real estate development (Port of Tallinn, 2019).
Most of the development plans for the years 2018-2023 concentrate on opening the port to the public, making it
more comfortable for passengers and others users. These plans do not have big impact on sea space. In 2018-
2023 it is planned to reconstruct the D-Terminal, build a movable pedestrian bridge to connect A and D Terminals,
create Smart Port (traffic management system in port and automatic check-in for passengers with vehicles),
install equipment to the quay to provide on-shore electricity power, install automatic mooring equipment, construct
of D-terminal parking garage, development of new cruise terminal (Port of Tallinn, 2019).
Old City Harbour 2030+: a long-term comprehensive detailed development plan integrating the port area (closed
area), areas of port-city-related activities (semi-public area) and areas of urban development (public areas) into
united functional system comprising a human-centred and integrated approach combining commercial, socio-
economic, spatial and environmental aspects giving maximum financial and spatial value to the seaside area.
Real estate development will cover approx. 16 ha of land in Old City Harbour and a possible extension by land
reclamation. The total volume of built-up gross area will be up to 400 000 m 2 commercial and residential premises
(Port of Tallinn, 2019).
Muuga Harbour
Muuga Harbour is the biggest and deepest modern cargo port in Estonia. Water depth extends to 18 meters,
which allows to service all ships passing through the Danish Straits. The cargo volume handled accounts for
around 50% of the total cargo volume of Port of Tallinn and approximately 40% of the transit cargo volume
passing through Estonia. In terms of land availability for extension, Muuga Harbour possesses the greatest de-
velopment potential in the whole region (Port of Tallinn, 2019).
23Table 4. Muuga Harbour (Port of Tallinn, 2019)
General data Terminals Storage area:
Territory 566.8 ha 6 liquid bulk terminals Warehouse area: 230 000
m²
Aquatory 682.0 ha general cargo terminals Open storage area: 695 000
(incl. reefer complex) m²
Number of berths 29 container terminal Reefer warehouse area: 13
500 m²
Total length of berths 6879 m ro-ro terminal Oil tank capacity: 1 550 150
m³
Max. depth 18 m dry bulk terminals Grain silo: 300 000 t
Max.length of a vessel 300 m grain terminal Fertilizer terminal: 192 000 t
Max. width of a vessel 48 m fertilizer terminal
Muuga Harbour 2018-2023: According to the development plans of Muuga Harbour, the harbour area is ex-
tended eastwards towards the area in-between the existing container and coal terminals (Port of Tallinn, 2019).
According to Port of Tallinn (2019) other development plans of Muuga Harbour include:
• New LNG bunker terminal nearby the quay No 33 is going to be constructed by Vopak in the eastern part of the
Muuga Harbor to supply the vessels running on LNG-fuel and the gas grid;
• Development of a food production and logistics complex in the eastern part of Muuga Harbor;
• Implementation of the Smart Port application for heavy traffic vehicles to make the harbor services for the ro-ro
ships more efficient;
• Development of ro-ro cargo handling facilities in order to increase the volume of ro-ro cargo in Muuga Harbor;
• Development of a woodchip production/logistics centre;
• Single Window system development for railways - cargo related documentation data input and exchange with
a tracking solution of the cargo from a single window;
• Connecting the Muuga Harbor with Rail Baltica's Freight terminal to ensure the railway connection via both the
Russian and the European rails’ width (respectively 1520 mm and 1435 mm) to the terminals of Muuga Harbour.
Paldiski South Harbour
Paldiski South Harbour is Port of Tallinn´s second cargo harbour 45 km west of Tallinn. The core activity of the
harbour is focused on the handling of Estonian export and import cargo and transit cargo. Mainly Ro-Ro cargo,
scrap metal, timber, peat and oil products are handled there (Port of Tallinn, 2019).
Table 5. Paldiski South Harbour (Port of Tallinn, 2018)
General data Terminals:
Territory 118.7 ha Passenger Terminal
24You can also read