GLOBAL- & LOCAL ECONOMIC INDICATORS & BARGAINING COUNCIL SPECIFIC ISSUES: SARPBAC
←
→
Page content transcription
If your browser does not render page correctly, please read the page content below
GLOBAL- & LOCAL ECONOMIC
    INDICATORS & BARGAINING COUNCIL
                            SPECIFIC ISSUES:

                         RESEARCH REPORT

Prepared by:   Yolandi Raath-Booyens
               BA (Hon)(Industrial Psychology), MA(Educational Leadership)
               Assessor (generic management, supply chain management, project management,
               ETDP),
               Moderator Assessor (generic management, supply chain management, project
               management, ETDP),
               Fellow of American Association of Project Managers

                                                                                 1|Page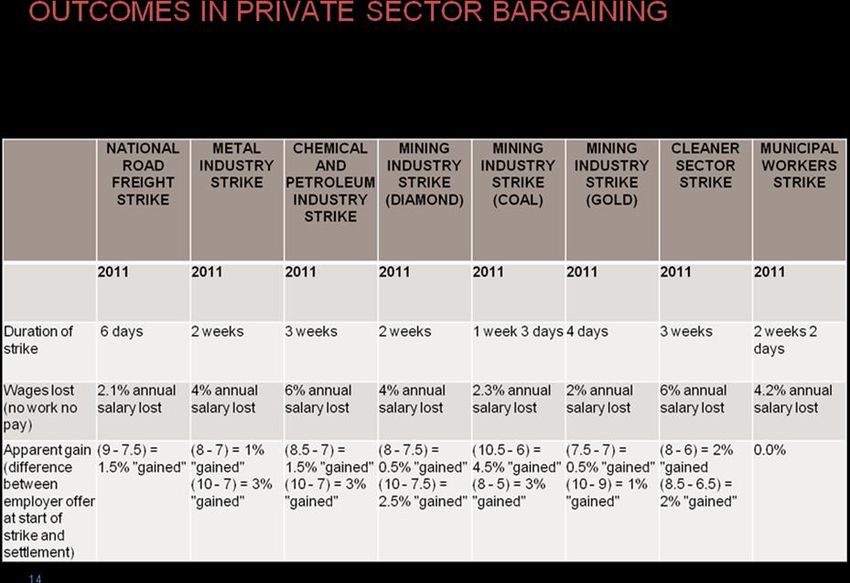
CONTENTS
1.    Introduction and Overview ......................................................................................................... 5
1.1   Research Brief ............................................................................................................................ 5
1.2   Content Summary ...................................................................................................................... 6
1.3   Comparison of Global vs Local Economic Indicators ................................................................. 7
1.4   Global and Local Collective Bargaining Trends .......................................................................... 7
2.    Global Economic Indicators: ....................................................................................................... 8
2.1   Prospects for the world economy in 2012-2013:....................................................................... 8
2.2   Growth and Expenditure: ......................................................................................................... 10
      Table 2.1: Growth of world output, 2005-2013 ....................................................................... 10
      Graph 2.1: Growth of world gross product, 2006 - 2013 ......................................................... 11
      Graph 2.2: Growth of GDP per capita, by level of development, 2000 - 2013 ........................ 11
      Graph 2.3: GDP growth in the least developed countries, 2010-2011 and 2012 .................... 12
      Graph 2.4: GDP growth of selected major economies and country groupings, 2009-2016 .... 12
2.3   Inflation: ................................................................................................................................... 13
      Graph 2.5: Post-recession employment recovery in the US, euro area and developed
      economies, 2007 – 2011 and projections for 2011 - 2015 ....................................................... 13
2.4   Monetary Sector: ..................................................................................................................... 14
      Graph 2.6: Net capital flows to developing countries, 2000-2012 .......................................... 14
      Graph 2.7: Exchange rate of major reserve currencies ........................................................... 15
      Graph 2.8: Exchange rates of selected currencies, US Dollar, 2008-2011 (BRICS) .................. 15
      Graph 2.9a: Developed countries with low borrowing costs................................................... 16
      Graph 2.9b: Developed countries with high and/or rising borrowing costs............................ 16
2.5   Commodity Prices: ................................................................................................................... 16
2.6   Employment Statistics:............................................................................................................. 17
      Graph 2.10: Employment rates of selected major economies and country groupings, 2008-
      2016 .......................................................................................................................................... 17
      Graph 2.11: Long-term unemployment in developed and developing countries, 2009 and
      2011 .......................................................................................................................................... 18
3.    South African Economic Indicators: .......................................................................................... 18
      Table 3.1: South Africa Economic Indicators (Actual, Previous, Highest, Lowest, Unit) .......... 19
3.1   Growth and expenditure .......................................................................................................... 21
      Graph 3.1: Real GDP (percentage change year ago) ................................................................ 21
      Graph 3.2: South Africa GDP Growth Rate .............................................................................. 21
      Graph 3.3: Trade ...................................................................................................................... 22
3.2   Inflation: ................................................................................................................................... 23
      Graph 3.4: CPI and CPIX ........................................................................................................... 23

                                                                                                                                      2|Page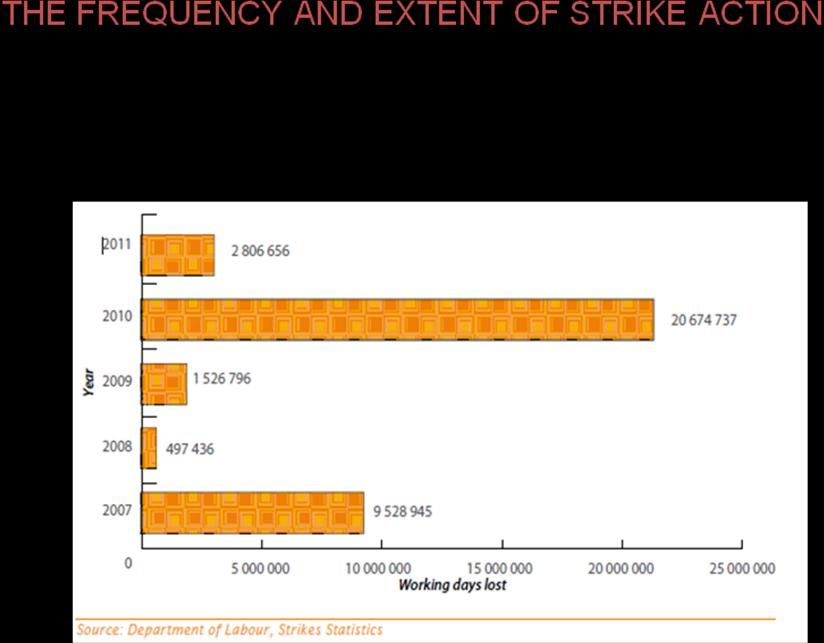
Graph 3.5: SA Inflation Rate (Jan 2011 – Jul 2012) .................................................................. 23
      Graph 3.6: PPI........................................................................................................................... 24
      Table 3.2A: Domestic Output ................................................................................................... 24
      B: Exported Commodities ........................................................................................................ 24
      C: Imported Commodities ........................................................................................................ 24
      Table 3.3: Contributions to the annual % change in the PPI for domestic output of SA
      industry groups ......................................................................................................................... 25
3.3   Monetary sector:...................................................................................................................... 25
      Graph 3.7: Money supply and credit: ...................................................................................... 25
      Table 3.4: Money supply and bank credit ................................................................................ 26
      Graph 3.8: Interest Rates for African Countries:...................................................................... 26
      Graph 3.9: Interest Rates for BRIC Countries:.......................................................................... 27
      Graph 3.10: Interest Rates for South Africa: ............................................................................ 27
      Graph 3.11: Exchange rates ..................................................................................................... 28
3.4   Commodity prices .................................................................................................................... 29
      2.4.1 Brent Crude Oil .............................................................................................................. 29
      Graph 3.12: Brent Crude Oil: .................................................................................................... 29
      2.4.2 Gold................................................................................................................................ 29
      Graph 3.13: Gold ...................................................................................................................... 29
      2.4.3 Platinum: ........................................................................................................................ 30
      Graph 3.14: Platinum ............................................................................................................... 30
3.5   South Africa Unemployment Rate ........................................................................................... 31
      Graph 3.15: SA Unemployment Rate ....................................................................................... 31
4.    Impact of SA Economy on Road Passenger Industry: ............................................................... 31
      Table 4.1: Transport Mode used by all Household members during week days ..................... 32
4.1   Division of Revenue Act (DORA)............................................................................................... 33
      4.1.1 Introduction and brief policy overview ......................................................................... 34
      4.1.2 Funding issues ................................................................................................................ 34
      4.1.3 Taxi industry issues ........................................................................................................ 35
      4.1.4 Issues Summary ............................................................................................................. 35
      4.1.5 Possible Solutions .......................................................................................................... 36
      4.1.6 DORA Schedules 2012:................................................................................................... 37
4.2   Road Passenger (Buses) ........................................................................................................... 40
      4.2.1 Cape Town - Golden Arrow Bus Services (Pty) Ltd ........................................................ 40
      4.2.2 City of Johannesburg - Metrobus .................................................................................. 41
      4.2.3 Pretoria and Johannesburg - PUTCO ............................................................................. 41
5.    Is the economy working for Industry? ...................................................................................... 42

                                                                                                                                  3|Page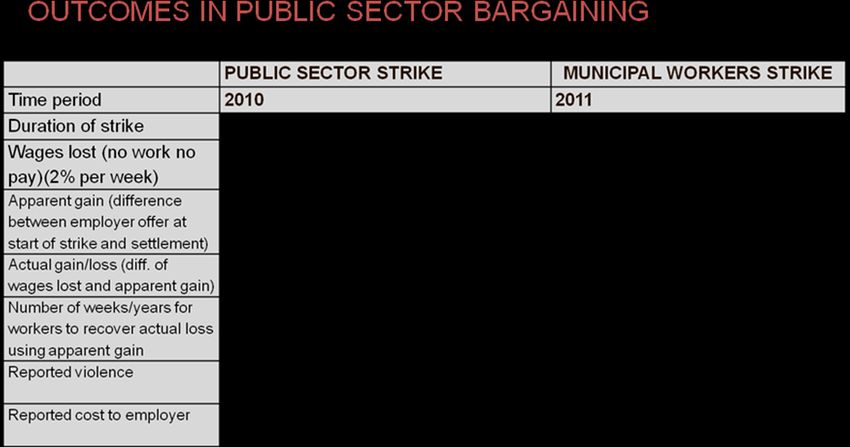
6. Industry Comparisons in relation to Wage Negotiations:......................................................... 43
6.1 Increases in other Bargaining Councils over the last 10 years ................................................. 43
Table 6.1: Current Monthly Wage income of Unskilled, Semi‐skilled and Skilled workers in BC
(excluding PSCBC)..................................................................................................................... 43
6.2 Minimum wages in South Africa .............................................................................................. 44
Graph 6.1: Minimum wage by Sector 2010 ............................................................................. 45
Graph 6.2: Monthly minimum wage by industry 2010 ............................................................ 45
Graph 6.3: Minimum wages by Industry and main sub-sector 2010 ....................................... 46
Graph 6.4: Minimum wages by bargaining level, 2011............................................................ 48
Graph 6.5: Minimum wages by industry, 2011 ........................................................................ 48
7. Settlement Levels in South Africa (%) ....................................................................................... 49
7.1 Wage Settlements .................................................................................................................... 49
Graph 7.1: Wage Settlements against Inflation (2007 – 2011) ................................................ 49
Graph 7.2: Median settlement levels by industry in 2011 ....................................................... 49
7.2 Conditions of Employment....................................................................................................... 50
Graph 7.3: Conditions of Employment settlements (2006, 2009, 2011) ................................. 50
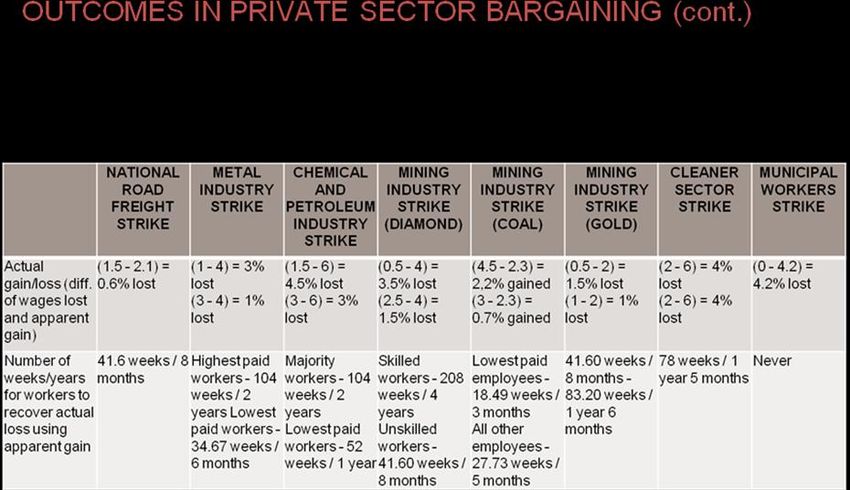
7.3 Outcomes of Negotiations and Strike Action ........................................................................... 54
7.4 Working Days Lost as a result of strike action ......................................................................... 55
8. SARPBAC at a glance ................................................................................................................. 56
8.1 Period of Collective Agreement: .............................................................................................. 56
8.2 Main Members: ........................................................................................................................ 56
8.3 Scope of Application: ............................................................................................................... 56
8.4 Current Bargaining Indicators and collective agreement content ........................................... 56
9. Conclusion ................................................................................................................................. 58
10. References ................................................................................................................................ 59
Annexure A: Joint Statistical Publication on BRICS 2011
Annexure B: Bargaining Councils
Annexure C: National Transport Policy Framework: South Africa
Annexure D: Word Bank Study on Road Passenger
Annexure E: Bus Industry Overview
Annexure F: Collective Bargaining: Brazil Experience
Annexure G: Global Local Comparison Bargaining Councils, July 2012
4|Page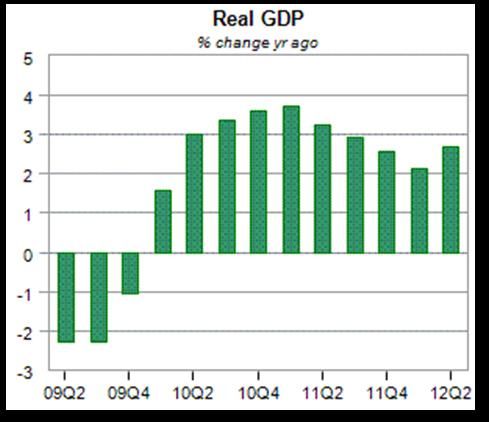
1. Introduction and Overview
1.1 Research Brief
This document has been prepared for the South African Road Passenger Bargaining Council in light
of the imperative for the industry bodies to prepare its negotiating mandate for the discussions that
commences in the year 2013.
This document contains the preliminary and independent results of an investigation into South
Africa’s road passenger transport services.
In light of the imperative to provide a sound and consistent negotiating base for the South African
Road Passenger Bargaining Council and its Employer - and Labour representatives, the objectives of
the present study were to:
1. Describe the status of the world economy
2. Discuss its impact on the SA economy in light of the economic crunch of 2008 and beyond
3. Illustrate the impact of SA economy on the Road Passenger Industry in the Transport Sector
4. Draw industry comparisons in relation to wage negotiations:
Increases in other Bargaining Councils over the last 10 years
Conditions of Employment
– Retirement Contributions
– Bonus
– Hours of Work
Absolute Minimums
5. List pertinent legislated changes that affect the Road Passenger Industry
6. Current economic indicators such as CPI, CPIX and its impact on the Road Passenger Industry
7. List settlements in SARPBAC vs Economic Indicators
8. Discuss possible Bargaining Strategies
· Identify successful approaches to collective bargaining
· How best do you cater for Diverse Sub-Sectors in a Bargaining Council
· The benefits of Long Term Agreement vs Annual Agreements
· Weigh the Pro’s and con’s of Centralised vs Plant Level Bargaining
9. Sustainability of employment in the bus industry (numbers of employees in the industry
compared to GDP over the last 10 years)
The document is structured as per discussions around the above objectives.
5|Page
1.2   Content Summary

      Research Requirement             Addressed in Research Report                 Status

      Global Economic Outlook          Section 1:
                                       Statistics have been included for the
                                       following economic indicators:
                                            1. Financial
                                            2. Fiscal
                                            3. Economic Growth
                                            4. Business Cycle
                                            5. Inflation (CPI, CPIX)
                                            6. Balance of Payment
      South African Economic           Section 2:
      Outlook                          Statistical analyses from 2000 – 2011, and
                                       include forecasts for 2012 - 2013
      Industry Specific Requirements   Section 3:
                                       Where possible analyses were included
                                       for the Transport industry. However,
                                       road passenger specific information could
                                       not be sourced due to non-availability
      Industry comparisons in          Comparisons were included between the
      relation to wage negotiations    Transport Industry and the major
                                       industries in South Africa, such as
                                       Agriculture, Finance, Motor and others .
      Pertinent legislated changes     Various references to legislation (LRA,
      that affect the Road Passenger   BCEA, Road Passenger Act, new Road
      Industry                         Transport Strategy, etc)

      Economic indicators such as Section 1:
      CPI, CPIX and its impact on the Information not readily available (Stats
                                      SA for instance only focuses on public
      Road Passenger Industry
                                      sector road transport, not private sector)
      Settlements in SARPBAC vs       Section 3:
      Economic Indicators             SARPBAC overview
                                      Reference to DORA subsidies, the ceding
                                      of subsidy responsibilities to
                                      Municipalities, backlogs in payment of
                                      subsidies, extension of Collective
                                      Agreement to SMMEs within the road
                                      passenger industry
      Possible Bargaining Strategies  Section 3:
                                      Annexure F on Brazil case study
      Sustainability of employment in Section 3:
      the bus industry                Partly addressed through industry
                                      snapshot and cost analysis of collective
                                      bargaining and strike action. Also
                                      addressed in Annexures C, D and E.

                                                                                      6|Page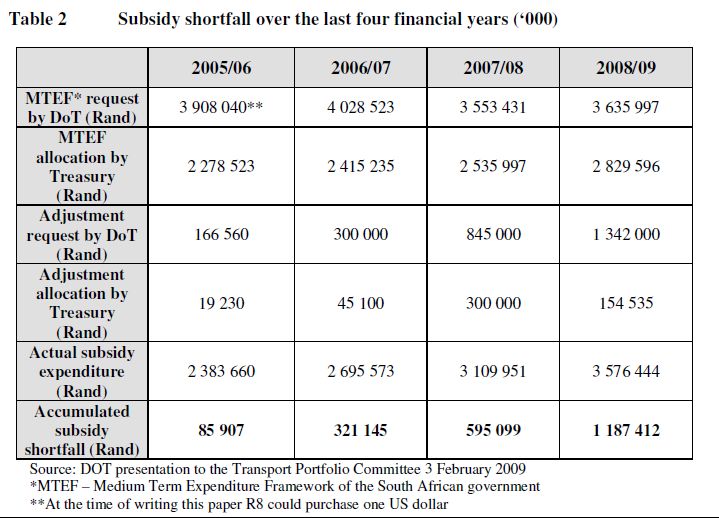
1.3 Comparison of Global vs Local Economic Indicators

This shows that South Africa, whilst running virtually parallel to the world trend in Output Growth,
GDP Growth and Inflation Rate, is experiencing considerably higher levels of unemployment in
relation to the rest of the world.

1.4 Global and Local Collective Bargaining Trends
Holtzhauzen, et al, (A comparison of some global collective bargaining trends with developments in
the South African private sector centralised collective bargaining system, July 2012) has concluded
that the following trends are prevalent within the Collective Bargaining environment:
    1. Trend 1: Globally, trade union membership, as well as their power is on the decline.
    2. Trend 2: Employers’ organisations membership is declining, and they focus more on
        reducing their dependence on services associated with collective bargaining, and specifically,
        centralised collective bargaining.
    3. Trend 3: Collective bargaining as a mechanism to determine wages and conditions of service
        are on the decline, with a steady move towards the individual contract.
    4. Trend 4: The coverage of collective agreements through extensions is reducing.
    5. Trend 5: Where collective bargaining does take place, the level that it is conducted at, is
        diminishing – if at a national level, it seems to be shifting to an industry level, and again from
        industry level, to plant-level.

                                                                                              7|Page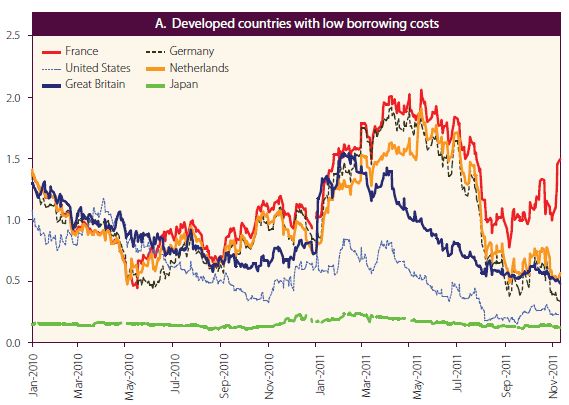
6. Trend 6: The level of detail contained in the agreements of national and industry level is
         decreasing. Agreements at the highest level are increasingly reflecting minimum standards
         and policy frameworks or objectives, with more operational flexibility possible at
         implementation level. More information available in Annexure G.

2.       Global Economic Indicators:

2.1      Prospects for the world economy in 2012-2013:
Following two years of anaemic and uneven recovery from the global financial crisis, the world
economy is teetering on the brink of another major downturn. Output growth has already
slowed considerably during 2011, especially in the developed countries. The baseline forecast
foresees continued anaemic growth during 2012 and 2013. Such growth is far from sufficient to deal
with the continued jobs crises in most developed economies and will drag down income growth in
developing countries. Even this sombre outlook may be too optimistic. A serious, renewed global
downturn is looming because of persistent weaknesses in the major developed economies related to
problems left unresolved in the aftermath of the Great Recession of 2008-2009.

                                                                                        8|Page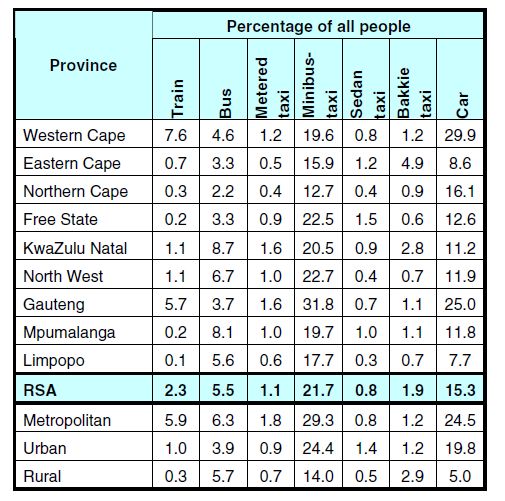
The problems stalking the global economy are multiple and interconnected. The most pressing
challenges are the continued jobs crisis and the declining prospects for economic growth, especially in
the developed countries. As unemployment remains high, at nearly 9 per cent, and incomes stagnate,
the recovery is stalling in the short run because of the lack of aggregate demand. But, as more and
more workers remain out of a job for a long period, especially young workers, medium-term growth
prospects also suffer because of the detrimental effect on workers’ skills and experience.

The rapidly cooling economy is both a cause and an effect of the sovereign debt crises in the euro
area, and of fiscal problems elsewhere. The sovereign debt crises in a number of European countries
worsened in the second half of 2011 and aggravated the weaknesses in the balance sheets of banks
sitting on related assets. Even bold steps by the Governments of the euro area countries to reach an
orderly sovereign debt workout for Greece were met with continued financial market turbulence
and heightened concerns of debt default in some of the larger economies in the euro zone, Italy in
particular. The fiscal austerity measures taken in response are further weakening growth and
employment prospects, making fiscal adjustment and the repair of financial sector balance sheets all
the more challenging. The United States economy is also facing persistent high unemployment,
shaken consumer and business confidence, and financial sector fragility. The European Union (EU)
and the United States of America form the two largest economies in the world, and they are deeply
intertwined. Their problems could easily feed into each other and spread to another global recession.
Developing countries, which had rebounded strongly from the global recession of 2009, would be hit
through trade and financial channels.

The financial turmoil following the August 2011 political wrangling in the United States regarding
the debt ceiling and the deepening of the euro zone debt crisis also caused a contagious sell-off in
equity markets in several major developing countries, leading to sudden withdrawals of capital and
pressure on their currencies.

Political divides over how to tackle these problems are impeding needed, much stronger policy
action, further eroding the already shattered confidence of business and consumers. Such divides
have also complicated international policy coordination. Nonetheless, as the problems are deeply
intertwined, the only way for policymakers to save the global economy from falling into a dangerous
downward spiral is to take concerted action, giving greater priority to revitalizing the recovery in
output and employment in the short run in order to pave more solid ground for enacting the
structural reforms required for sustainable and balanced growth over the medium and

                                                                                             9|Page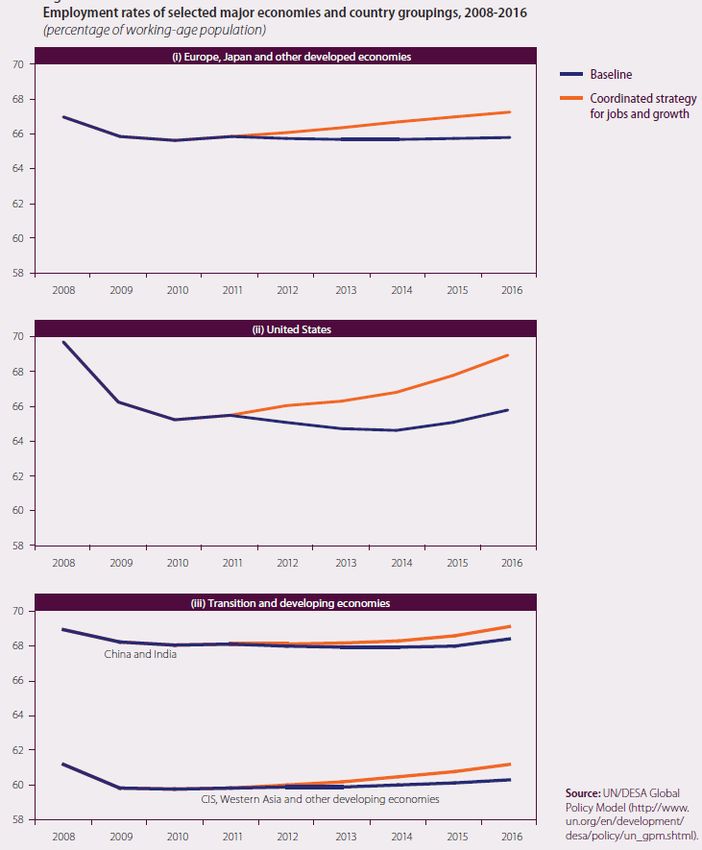
2.2       Growth and Expenditure:

Table 2.1: Growth of world output, 2005-2013
                                               Annual percentage change
                                                                                                           Change from June

                                                                                                            2011 forecast d
                                               2005-                                                        2011       2012

                                               2008a       2009        2010b    2011c    2012c    2013c
 World                                          3.3         -2.4        4.0      2.8      2.6      3.2      -0.5       -1.0
   Developed economies                         1.9          -4.0        2.7     1.3      1.3      1.9       -0.7       -1.1
        United States of America               1.8          -3.5        3.0     1.7      1.5      2.0       -0.9       -1.3
        Japan                                  1.3          -6.3        4.0     -0.5     2.0      2.0       -1.2       -0.8
        European Union                         2.2          -4.3        2.0     1.6      0.7      1.7       -0.1       -1.2
          EU-15                                2.0          -4.3        1.9     1.5      0.5      1.6       -0.2       -1.2
          New EU members                       5.4          -3.7        2.3     2.9      2.6      3.1       -0.2       -1.4
          Euro area                            2.0          -4.3        1.9     1.5      0.4      1.3       -0.1       -1.2
        Other European countries               2.6          -1.9        1.5     1.0      1.1      1.6       -1.0       -0.9
        Other developed countries              2.6          -1.0        2.9     1.4      2.2      2.5       -1.4       -0.5
   Economies in transition                     7.1          -6.6        4.1     4.1      3.9      4.1       -0.3       -0.7
     South-Eastern Europe                      5.0          -3.7        0.6     1.7      2.3      3.2       -0.5       -0.8
     Commonwealth of Independent States and
      Georgia                                  7.3          -6.9        4.5     4.3      4.0      4.2       -0.3       -0.8
      Russian Federation                        7.1         -7.8        4.0     4.0      3.9      4.0       -0.4       -0.7
   Developing economies                         6.9         2.4         7.5     6.0      5.6      5.9       -0.2       -0.6
     Africa                                     5.4         0.8         3.9     2.7      5.0      5.1       -0.9       -0.4
       North Africa                             5.0         3.2         4.0     -0.5     4.7      5.5       -1.2       -0.3
       Sub-Saharan Africa                       5.9         1.7         4.8     4.4      5.3      5.0       -0.5       -0.2
           Nigeria                              4.6         -8.3        2.8     6.3      6.8      7.0       0.6        0.5
           South Africa                         5.0         -1.7        2.8     3.1      3.7      3.5       -0.6       -1.1
           Others                               6.7         3.6         5.1     4.8      5.8      5.3       -1.1       0.1
     East and South Asia                        8.3         5.2         8.8     7.1      6.8      6.9       -0.1       -0.4
       East Asia                                8.5         5.1         9.2     7.2      6.9      6.9       -0.1       -0.3
          China                                11.9         9.2        10.4     9.3      8.7      8.5       0.2        -0.2
       South Asia                               7.8         5.5         7.2     6.5      6.7      6.9       -0.4       -0.3
          India                                 9.0         7.0         9.0     7.6      7.7      7.9       -0.5       -0.5

                                                        Table I.1 (cont’d)
                                                                                                           Change from June
                                                                                                            2011 forecastd
                                                                                                            2011       2012
                                               2005-
        Western Asia                            5.4         -0.9        6.3      6.6      3.7      4.3       0.8       -0.5
                                               2008 a
        Latin America and the Caribbean         5.0         2009
                                                            -2.1        6.0 b
                                                                       2010      4.3 c
                                                                                2011      3.3 c
                                                                                         2012      4.2 c
                                                                                                  2013       -0.2      -1.6
           South America                        5.6         -0.4        6.4      4.6      3.6      4.5       -0.4      -1.6
             Brazil                             4.6         -0.6        7.5      3.7      2.7      3.8       -1.4      -2.6
          Mexico and Central America            3.5         -5.7        5.6      3.8      2.7      3.6       0.0       -1.6
             Mexico                             3.2         -6.3        5.8      3.8      2.5      3.6       0.1       -1.8
          Caribbean                             7.1          0.9        3.5      3.4      3.6      4.3       -0.6      -1.1
  By level of development
    High-income countries                       2.1         -3.7         3.0     1.6      1.5      2.0
    Upper middle income countries               7.5         1.2          7.3     6.1      5.5      6.0
    Lower middle income countries               7.0         4.3          6.8     5.9      6.4      6.6
    Low-income countries                        6.2         4.8          6.1     5.7      6.0      5.9

                                                                                                    10 | P a g e
Least developed countries 7.8 5.2 5.6 4.9 6.0 5.7 -0.7 0.2
Memorandum items
World tradee 6.8 -9.9 12.8 6.6 4.4 5.7 -0.5 -2.4
World output growth with
PPP-based weights 4.4 -0.9 4.9 3.7 3.6 4.1 -0.4 -0.8
Source: UN/DESA.
a Average percentage change.
b Actual or most recent estimates.
c Forecasts, based in part on Project LINK and baseline projections of the UN/DESA World Economic
Forecasting Model.
d See United Nations, World economic situation and prospects as of mid-2011 (E/2011/113).
e Includes goods and services.
Graph 2.1: Growth of world gross product, 2006 - 2013
Graph 2.2: Growth of GDP per capita, by level of development, 2000 - 2013
11 | P a g eGraph 2.3: GDP growth in the least developed countries, 2010-2011 and 2012
Graph 2.4: GDP growth of selected major economies and country groupings, 2009-2016
Developing country growth remains strong, but is decelerating because of the economic problems in developed countries.
Developing countries and economies in transition are expected to continue to stoke the engine of
the world economy, growing on average by 5.6 per cent in 2012 and 5.9 per cent in 2013 in the
12 | P a g ebaseline outlook. This is well below the pace of 7.5 per cent achieved in 2010, when output growth
among the larger emerging economies in Asia and Latin America, such as Brazil, China and India,
had been particularly robust.
Even as economic ties among developing countries strengthen, they remain vulnerable to economic
conditions in the developed economies. From the second quarter of 2011, economic growth in most
developing countries and economies in transition started to slow notably to a pace of 5.9 per cent for
the year.
Initially, this was the result, in part, of macroeconomic policy tightening in attempts to curb
emerging asset price bubbles and accelerating inflation, which in turn were fanned by high capital
inflows and rising global commodity prices. From mid-2011 onwards, growth moderated further
with weaker external demand from developed countries, declining primary commodity prices and
some capital flow reversals. While the latter two conditions might seem to have eased some of the
macroeconomic policy challenges earlier in the year, amidst increased uncertainty and volatility, they
have in fact complicated matters and have been detrimental to investment and growth.
The economic woes in many developed economies are a major factor behind the slowdown in
developing countries. Economic growth in developed countries has already slowed to 1.3 per cent in
2011, down from 2.7 per cent in 2010, and is expected to remain anaemic in the baseline outlook, at
1.3 per cent in 2012 and 1.9 per cent in 2013. At this pace, output gaps are expected to remain
significant and unemployment rates will stay high.
2.3 Inflation:
Graph 2.5: Post-recession employment recovery in the US, euro area and developed economies,
2007 – 2011 and projections for 2011 - 2015
13 | P a g eInflation does not pose a present danger in developed countries but remains a concern among developing countries
Inflation has increased worldwide in 2011, driven by a number of factors, particularly the supply-side
shocks that have pushed up food and oil prices and strong demand in large developing economies
as a result of rising incomes and wages. Inflation rates surpassed policy targets by a wide margin in a
good number of developing economies. The monetary authorities of these economies have
responded with a variety of measures, including by tightening monetary policy, increasing subsidies
on food and oil, and providing incentives to domestic production. In the outlook, along with an
anticipated moderation in global commodity prices and lower global growth, inflation in most
developing countries is also expected to decelerate in 2012-2013.
2.4 Monetary Sector:
Capital Cash Flows:
Graph 2.6: Net capital flows to developing countries, 2000-2012
Private capital flows increased further in 2011
Net private capital inflows to emerging and developing economies increased to about $575 billion
in 2011, up by about $90 billion from 2010 levels. The recovery in capital inflows from their
precipitous decline during the global financial crisis continued until the middle of 2011 but suffered
a strong setback with the sharp deterioration in global financial markets in the third quarter of
the year. The current level of inflows remains well below the pre-crisis peak registered in 2007. As a
share of GDP of developing countries, net capital inflows are at about half of their peak levels. The
outlook for external financing will be subject to uncertainty owing to counteracting forces during
2012 and 2013.
14 | P a g e Exchange Rates:
Graph 2.7: Exchange rate of major reserve currencies
There are concerns that the present process of global rebalancing will be addressed at the expense of job growth and will not
help stabilize exchange rates
Graph 2.8: Exchange rates of selected currencies, US Dollar, 2008-2011 (BRICS)
Indeed, exchange rates among major international reserve currencies, namely, the United States
dollar, euro and Japanese yen, continued to display large fluctuations during 2011. Developing
countries also witnessed greater exchange-rate volatility. The dollar continued its downward trend
against other major currencies in the first half of the year, but rebounded notably against the euro
in the third quarter when concerns about the sovereign debt crisis in the euro area intensified,
and devalued again later in the year after some agreements were reached in Europe on scaling
up measures to deal with the debt crisis. Over the year as a whole, the Japanese yen appreciated
against both the dollar and the euro, despite interventions by the Bank of Japan to curb the
appreciation.
15 | P a g e Interest Rates:
Graph 2.9a: Developed countries with low borrowing costs
Graph 2.9b: Developed countries with high and/or rising borrowing costs
More short-term fiscal stimulus is needed, not less
The spreads on interest rates on public borrowing have increased significantly for Greece and a few
other European economies, but they remain low (and have even decreased further) for Germany,
Japan, the United States and other developed countries.
2.5 Commodity Prices:
Surrounded by great uncertainties, the United Nations baseline forecast is premised on a set of
relatively optimistic conditions, including the assumptions that the sovereign debt crisis in Europe
will, in effect, be contained within one or just a few small economies, and that those debt problems
can be worked out in more or less orderly fashion. As indicated in box I.1, it further assumes that
monetary policies among major developed countries will remain accommodative, while the shift to
fiscal austerity in most of them will continue as planned but not move to deeper cuts. The baseline
16 | P a g ealso assumes that key commodity prices will fall somewhat from current levels, while exchange rates
among major currencies will fluctuate around present levels without becoming disruptive.
The short-term policy concern for many developing countries will be to prevent rising and volatile food
and commodity prices and exchange-rate instability from undermining growth and leading their
economies into another boom-bust cycle. These countries would need to ensure that macroeconomic
policies are part of a transparent counter-cyclical framework that would include the use of fiscal
stabilization funds and strengthened macro- prudential financial and capital-account regulation to
mitigate the impact of volatile commodity prices and capital inflows. Strengthened social policies would
need to offer sufficient income protection for the poor and vulnerable against higher food and energy
prices.
2.6 Employment Statistics:
Graph 2.10: Employment rates of selected major economies and country groupings, 2008-2016
To make up for the employment deficit left by the crisis, 64 million jobs need to be created worldwide
17 | P a g eDecrease in unemployment in major economies is good for the global economy, but recovery will be
too slow to prevent a second recessionary dip. The developing economies can leverage this to their
advantage.
Graph 2.11: Long-term unemployment in developed and developing countries, 2009 and 2011
Despite employment recovery, long-term unemployment is also a concern in developing countries
In developing countries, employment recovery has been much stronger than in developed
economies. For instance, unemployment rates are back to or below pre- crisis levels in most Asian
developing countries, while employment has recovered in most countries in Latin America also.
However, developing countries continue to face major challenges owing to the high number of
workers that are underemployed, poorly paid, have vulnerable job conditions or lack access to any
form of social security. At the same time, open unemployment rates remain high, at well over 10 per
cent in urban areas, with the situation being particularly acute in a number of African and Western
Asian countries. Long-term unemployment has also increased in developing countries
3. South African Economic Indicators:
18 | P a g eTable 3.1: South Africa Economic Indicators (Actual, Previous, Highest, Lowest, Unit)
ACTUAL PREVIOUS HIGHEST LOWEST UNIT
MARKETS
Government Bond 10Y 6.75 6.56 20.69 6.44 Percent View
Stock Market 36440.05 35757.98 36588.67 4308.02 View
Exchange Rate 8.64 8.32 12.45 0.67 View
Currency 8.60 8.32 12.45 0.67 View
GDP
GDP 408.24 363.70 408.24 7.34 Billion USD View
GDP per capita 3825.09 3745.34 3825.09 2207.37 USD View
GDP per capita PPP 11034.82 10540.24 11034.82 4183.73 USD View
GDP Growth Rate 3.20 2.70 7.60 -6.30 Percent View
GDP Annual Growth
3.00 2.10 7.10 -2.70 Percent View
Rate
Gross National
1988686.00 1987165.00 1988686.00 355030.00 ZAR MIL View
Product
LABOUR
Employed Persons 8425000.00 8383000.00 8512000.00 3694977.00 Persons View
Labour Costs 318.00 318.40 318.40 3.20 Index Points View
Unemployment Rate 24.90 25.20 31.20 21.90 Percent View
Thousand
Unemployed Persons 4470.00 4526.00 4843.00 3873.00 View
Persons
Wages 352479000.00 348922000.00 365373000.00 14639220.00 ZAR THO View
Wages in
43808000.00 43066000.00 47015000.00 11800149.00 ZAR THO View
Manufacturing
Population 50.59 49.99 50.59 17.40 Million View
PRICES
Producer Prices 230.50 229.00 230.50 4.10 Index Points View
Export Prices 199.60 197.00 201.00 1.50 Index Points View
Consumer Price Index
124.20 123.90 124.20 1.89 Index Points View
(CPI)
Import Prices 163.60 160.10 163.60 1.70 Index Points View
Inflation Rate 5.00 4.90 20.80 0.10 Percent View
MONEY
Interest Rate 5.00 5.00 23.99 5.00 Percent View
Foreign Exchange
420491.00 404126.00 420491.00 153.00 ZAR MIL View
Reserves
Loans to Private
2339226.00 2325869.00 2339226.00 4051.00 ZAR MIL View
Sector
19 | P a g eMoney Supply M0 157120.00 153641.00 158666.00 415.00 ZAR MIL View
Money Supply M2 1819456.00 1801595.00 1819456.00 2887.00 ZAR MIL View
Money Supply M3 2323359.00 2304517.00 2323359.00 4796.00 ZAR MIL View
TRADE
Balance of Trade -12.21 -6.67 10.33 -17.38 Billion ZAR View
Exports 61417.00 63508.00 68457.00 3544.00 Million ZAR View
Imports 73622.00 70180.00 76502.00 2982.00 Million ZAR View
Current Account -152600.00 -110200.00 14045.00 -179311.00 Million ZAR View
Current Account to
-3.30 -2.80 6.00 -7.50 Percent View
GDP
GOVERNMENT
Government Debt To
38.80 35.30 43.50 27.40 Percent View
GDP
Government Budget -4.80 -4.20 0.90 -7.40 Percent of GDP View
Government External
119029.00 118461.00 119029.00 33262.00 USD MIL View
Debt
Government Spending 413959.00 409789.00 413959.00 44897.00 ZAR MIL View
BUSINESS
Business Confidence 47.00 41.00 91.00 10.20 View
Industrial Production 3.00 6.30 10.80 -22.10 Percent View
Capacity Utilization 81.30 80.50 86.30 76.90 Percent View
Car Registrations 33892.00 31389.00 39204.00 5155.00 Cars View
Bankruptcies 241.00 147.00 511.00 63.00 Companies View
CONSUMER
Consumer Confidence -1.00 -3.00 23.00 -33.00 View
Consumer Spending 1278883.00 1269659.00 1278883.00 189019.00 ZAR MIL View
Personal Savings 289.00 -151.00 17075.00 -22527.00 ZAR MIL View
Retail Sales MoM 2.00 0.08 4.20 -5.00 Percent View
Retail Sales YoY 6.40 4.20 15.40 -6.80 Percent View
BUSINESS
Changes in Inventories 6996.00 5860.00 45990.00 -42839.00 ZAR MIL View
MONEY
Bank Lending Rate 8.50 8.50 25.50 5.50 Percent View
Interbank Rate 4.79 4.82 23.50 1.58 Percent View
TRADE
External Debt 119029.00 118461.00 119029.00 33262.00 USD MIL View
20 | P a g e3.1 Growth and expenditure
GDP:
Graph 3.1: Real GDP (percentage change year ago)
The Gross Domestic Product (GDP) in South Africa expanded 3.20 percent in the second quarter of
2012 over the previous quarter. Historically, from 1993 until 2012, South Africa GDP Growth Rate
averaged 3.3 Percent reaching an all time high of 7.6 Percent in December of 1994 and a record low
of -6.3 Percent in March of 2009. The Gross Domestic Product (GDP) growth rate provides an
aggregated measure of changes in value of the goods and services produced by an economy. South
Africa has a two-tiered economy; one rivalling other developed countries and the other with only
the most basic infrastructure. It is therefore a productive and industrialized economy that exhibits
many characteristics associated with developing countries, including a division of labour between
formal and informal sectors and an uneven distribution of wealth and income. The primary sector,
based on manufacturing, services, mining, and agriculture, is well developed.
Graph 3.2: South Africa GDP Growth Rate
21 | P a g e Balance of payments:
Graph 3.3: Trade
Gold and foreign exchange reserves
(Foreign exchange may be defined as currency or other financial instruments that allow one country
to settle amounts owed to other countries.)
The following is a list of the top largest systems by foreign exchange reserves:
Rank Country Billion USD (end of month)
[7]
1 People's Republic of China $ 3,240 (Jun 2012)
2 Japan $ 1,272 (Jul 2012)[8]
- Eurozone $ 883 (Jun 2012)[9] [10]
3 Saudi Arabia $ 592 (May 2012)[11]
4 Russia $ 530 (Oct 2012)[12]
5 Switzerland $ 479 (Jul 2012)[13]
6 Republic of China (Taiwan) $ 394 (Aug 2012)[14]
7 Brazil $ 378 (Oct 2012)[15]
8 South Korea $ 312 (Jun 2012)[16]
- Hong Kong $ 295 (Jun 2012)[17]
9 India $ 289 (Jun 2012)[16]
10 Germany $ 245 (Jun 2012)[16]
22 | P a g e3.2 Inflation:
CPI:
Graph 3.4: CPI and CPIX
The inflation rate in South Africa was recorded at 5.00 percent in August of 2012. Historically, from
1981 until 2012, South Africa Inflation Rate averaged 9.7 Percent reaching an all time high of 20.8
Percent in January of 1986 and a record low of 0.1 Percent in January of 2004. Inflation rate refers to
a general rise in prices measured against a standard level of purchasing power. The most well known
measures of Inflation are the CPI which measures consumer prices, and the GDP deflator, which
measures inflation in the whole of the domestic economy.
Graph 3.5: SA Inflation Rate (Jan 2011 – Jul 2012)
23 | P a g e PPI:
Graph 3.6: PPI
Table 3.2A: Domestic Output
B: Exported Commodities
C: Imported Commodities
24 | P a g eTable 3.3: Contributions to the annual % change in the PPI for domestic output of SA industry groups
3.3 Monetary sector:
Graph 3.7: Money supply and credit:
South Africa - Money Supply - M3 The definition of M3 (the broadest measure of money supply) is
notes and coins in circulation plus cheque and transmission deposits, other demand deposits, plus all
other short-, medium- and long term deposits of the domestic private sector held with monetary
institutions. Source: Reserve Bank.
Money supply rose strongly in July, while credit increased in line with expectations.
Annual growth in broad money supply rose to 8,3% in July from 7% in June, stronger than the
consensus forecast of 6,7%, mainly pushed up by government claims which rose by R46,6 billion
following a R17,6 billion drop in June.
Private sector credit extension growth moderated slightly to 8,3% y-o-y from 8,7% in June,
almost in line with the consensus forecast of 8,2.
Household credit demand continued to drive the headline credit figure, rising by 0,5% m-o-m
and 8,1% y-o-y while growth corporate credit demand moderated further.
25 | P a g e Household credit demand is expected to remain moderate during the second half of the year as
consumer confidence is weighed by the poor economic outlook and worries about job security.
Corporate demand will also be slow as the private sector remains wary of accelerating capital
expenditure.
Growth in demand for credit is likely to remain modest in the months ahead. (This concept is
questionable, however, due to increase in consumer demand). The Reserve Bank’s Monetary
Policy Committee is likely to maintain its accommodative monetary policy stance until there is
clearer direction on the global outlook and the local economy starts looking less vulnerable. We
expect the committee to keep interest rates unchanged until at least the fourth quarter of 2013.
Source: Nedbank, Economic Commentary: 31 August 2012
Table 3.4: Money supply and bank credit
Interest Rates:
Graph 3.8: Interest Rates for African Countries:
26 | P a g eGraph 3.9: Interest Rates for BRIC Countries:
Graph 3.10: Interest Rates for South Africa:
The benchmark interest rate in South Africa was last reported at 5.00 percent. Historically, from
1998 until 2012, South Africa Interest Rate averaged 13.5 Percent reaching an all time high of 24.0
Percent in June of 1998 and a record low of 5.0 Percent in July of 2012. In South Africa, the interest
rates decisions are taken by the South African Reserve Bank’s Monetary Policy Committee (MPC).
The official interest rate is the repo rate. This is the rate at which central banks lend or discount
eligible paper for deposit money banks, typically shown on an end-of-period basis.
27 | P a g eGraph 3.11: Exchange rates
US$ / ZAR EUR / ZAR
GBP / ZAR YEN / ZAR
ZAR / US$: 2009 to 2012:
The USDZAR spot exchange rate appreciated 0.5066 or 6.15 percent during the last 30 days.
Historically, from 1972 until 2012, the USDZAR averaged 4.5500 reaching an all time high of 12.4500
in December of 2001 and a record low of 0.6700 in June of 1973. The USDZAR spot exchange rate
specifies how much one currency, the USD, is currently worth in terms of the other, the ZAR. While
28 | P a g ethe USDZAR spot exchange rate is quoted and exchanged in the same day, the USDZAR forward rate
is quoted today but for delivery and payment on a specific future date.
3.4 Commodity prices
2.4.1 Brent Crude Oil
Graph 3.12: Brent Crude Oil:
Brent Crude Oil futures contracts rallied 2 dollars or 1.61 percent during the last 12 months.
Historically, from 1983 until 2012, Brent crude oil averaged 37.7 USD/BBL reaching an all time high
of 146.1 USD/BBL in July of 2008 and a record low of 9.8 USD/BBL in December of 1998. The ICE
Brent Crude futures contract is a deliverable contract based on EFP delivery with an option to cash
settle. Brent Crude is sourced from the North Sea. The name 'Brent' comes from the naming policy
of Shell Oil , which originally named all of its fields after birds (in this case the Brent Goose). Oil
production from Europe, Africa and the Middle East flowing West tends to be priced relative to this
oil, i.e. it forms a benchmark. However, large parts of Europe now receive their oil from the former
Soviet Union especially through Russia.
2.4.2 Gold
Graph 3.13: Gold
29 | P a g eGold futures contracts rallied 81 dollars or 4.84 percent during the last 12 months. Historically, from
1969 until 2012, Gold averaged 428.0 USD/t oz. reaching an all time high of 1900.7 USD/t oz. in
September of 2011 and a record low of 34.9 USD/t oz. in January of 1970. The biggest producers of
gold are China, Australia, United States, South Africa, Russia, Peru and Indonesia. The biggest
consumers of gold jewellery are India, China, United States, Turkey, Saudi Arabia, Russia and UAE.
Gold Futures are available for Trading in the Commodity Exchange (COMEX) which merged with the
New York Mercantile exchange in 1994 and became the division responsible for metals trading. Half
of the gold consumption in the world is in jewellery, 40% in investments, and 10% in industry.
However, Gold is not only a precious metal but also a commodity vital for many industries. Gold is an
excellent conductor of electricity, is extremely resistant to corrosion, and is one of the most
chemically stable of the elements, making it critically important in electronics and other high-tech
applications.
2.4.3 Platinum:
Graph 3.14: Platinum
Platinum futures contracts rallied 120 dollars or 7.73 percent during the last 12 months. Historically,
from 1968 until 2012, Platinum averaged 557.8 USD/t oz. reaching an all time high of 2253.0 USD/t
oz. in March of 2008 and a record low of 97.7 USD/t oz. in January of 1972. Platinum is among the
world's scarcest metals. Supplies of platinum are concentrated in South Africa, which accounts for
approximately 80% of supply; Russia, 11%; and North America, 6%. Because of the metal's
importance as an industrial material, its relatively low production, and concentration among a few
suppliers, prices can be volatile. For this reason, it is often considered attractive to investors.
30 | P a g e3.5 South Africa Unemployment Rate
Graph 3.15: SA Unemployment Rate
The unemployment rate in South Africa was last reported at 24.9 percent in the second quarter of
2012. Historically, from 2000 until 2012, South Africa Unemployment Rate averaged 25.5 Percent
reaching an all time high of 31.2 Percent in March of 2003 and a record low of 21.9 Percent in
December of 2008. The unemployment rate can be defined as the number of people actively looking
for a job as a percentage of the labour force.
4. Impact of SA Economy on Road Passenger Industry:
‘In today’s globalised economy, road passenger transport has become instrumental in
driving economic growth, social progress and, ultimately, prosperity by ensuring the
sustainable mobility of people everywhere in the world, through its highly flexible, door-
to-door services.’
Road transport, including Road Passenger Transport, is the backbone of competitive economies and
dynamic societies. It must be recognised as such by policy makers and therefore be promoted and
further facilitated, as any penalty on road transport is an even greater penalty on the economy as a
whole.
“In his State of the Nation Address in February 2012, His Excellency President Jacob Zuma
highlighted the strategic role of transport as one of the drivers of growth in other sectors of the
economy such as tourism, agriculture and mining.
Domestic and international tourists depend on transport to move from one place to another, and
their choice of destinations is largely influenced by the state of transport. Similarly, mining and
31 | P a g eagricultural goods have to be transported to local and international destinations through the road,
rail, maritime and aviation modes of transport.” (Speech delivered by the Minister of Transport,
Honourable Dikobe Ben Martins, Mthatha-Thursday, 04 October 2012)
According to the National Household Travel Survey (NHTS; DoT, 2003) ‘the country’s commuters are
overwhelmingly dependent on road transport:
Table 4.1: Transport Mode used by all Household members during week days
Respondents to the NHTS reported a number of concerns, the chief one being lack of access to
public transport (50% of households), while 75%, 40% and 75% reported no access at all to rail
services, buses and cars, respectively. Other concerns identified by households included safety
(33%), affordability (20%) and security. Thirty percent of households spent more than 20% of their
income on public transport (including taxi’s) in 2003; since then, petrol and diesel prices have more
than trebled.
The South African Bus Operators Association (SABOA, 2012) on their website reports the following:
“The bus industry in South Africa has for many years made a vital contribution to the economic and
social development of the country. As a provider of bus services it has and continues to provide
mobility to millions of people who are dependent on public transport, for example, learners who
require transport to and from school, workers who require transport to and from their jobs, and
individuals who are seeking employment or access to hospitals and other services.
32 | P a g eAvailable statistics indicate that 80 per cent of South Africa’s population is totally dependent on
public transport (bus, commuter rail and taxis) for its mobility needs.
There are about 22,000 buses in the industry in South Africa of which about 17,000 are involved in
formal public transport activities (for reward). The other 5,000 buses are found in commerce and
industry and government institutions where they are mostly used for in-house purposes (not for
reward).
The economic impact of buses used for public transport can be summarised as follows:
The 17,000 buses have an estimated replacement value of R17-billion.The public transport
buses travel an estimated 1.02 billion kilometres per annum and use about 453 million litres
of diesel fuel.
This section of the industry provides direct employment to about 30,600 people throughout
the country with about 153,000 people indirectly dependent on the industry (directly related
to employment in companies).
The public transport operators undertake approximately 816 million passenger trips per
annum.
The industry also supports a large number of suppliers such as bus and chassis
manufacturers, fuel and tyre companies that are also in some way dependent on the
industry for employment.”
4.1 Division of Revenue Act (DORA)
The political, social and economic climate of South Africa in the 21st century has highlighted the
need to reform the existing transport network that has its roots in the era of apartheid. With the
majority of black South Africans living in decentralised areas a considerable distance from the city
centres (and, hence, their places of work), it is estimated that 13 % of South Africa's work force is
effectively "stranded": Either there is no access to public transport (because of the remote or
inaccessible locations) or public transport is simply too costly.
The Department of Transport has, over the last two decades, paid subsidies to bus and rail
commuter services to assist with the escalating costs of public transport. Roughly 35 % of all public
commuting costs are subsidised by the Government, with increasing pressure to extend the areas in
which these subsidies are in effect. The 2002/2003 government expenditures on transport subsidies
and bus and rail infrastructure funding totaled R3 737 million. The Department of Transport,
however, has indicated that within the next decade the subsidy structure will be reviewed so that
government expenditure can be reduced while only those commuters who really need but cannot
afford public transport costs will be subsidised.
33 | P a g eToday, the division of passengers according to the three road and rail-based transport means shows
that the minibus taxi is the most popular, with two out of every three public transport users making
use of them. Buses, on the other hand, account for one out of every five public transport users, and
trains transport only one in seven.
4.1.1 Introduction and brief policy overview
• Interim contracts (subsidy based on ticket sales) make out 68% of the subsidy budget
• Over the last number of years, due to economic growth, increasing urbanisation,
increased traffic congestion, improved safety and reliability of the bus fleet, escalating
costs of using private cars etc. the bus industry has grown its passenger base significantly
(about 12% per annum) resulting in a major increase in bus subsidies
• Government has increasingly been unable to afford this escalation
• For 8 years it has approved no new subsidised routes, nor has it increased
the original baseline subsidy for 12 years
• Also not been able to put services out to tender due to the expected higher costs due to
operators operating services without subsidies (that will need to be included in new
designs) and the correction of the original cost base (last confirmed in 1997)
4.1.2 Funding issues
• In late 2008 government indicated that it would not be in a
• position to fund the industry’s contracts for the last four months of the financial year
• This was unacceptable to industry
• It was decided to enforce the contractual obligations of the state through high court
cases in Cape Town and Pretoria.
• The result was that the DoT was compelled, in a settlement agreement with the industry
(made an order of the court), to make the necessary funds available (obtained from
Treasury) to the respective provinces for the funding of the contracts.
• This resulted in strained relations between government, provinces and industry. In the
Gauteng province a settlement agreement was resisted to the very last minute,
• Treasury felt that the DOT had no control over the subsidy
• budget (due to it being mostly passenger based (Interim contracts))
34 | P a g e• Decided to include the subsidy budget in the Division of Revenue Act (DORA) (a
mechanism used by government to ensure that funds are spent where they are supposed
to be spent but also to limit expenses by way of legislation)
• Three years’ budget included in the 2009 Act
• Ticket subsidy system had to be converted to a km-based subsidy before the end of Sept 09
(so that expenses can be controlled through a limitation on kilometres operated)
• Provinces had to agree with bus operators to convert ICs to km-based contracts as well as
to cap their overall subsidy claims in terms of DORA
• Tendered and negotiated contracts also adjusted
• Various approaches being followed by the provinces, despite guidelines provided by DOT
• After more than 7 months of major issues between operators and certain provinces sanity
prevailed and agreements reached (in some cases not yet signed off)
• The smaller budget will have impacts on levels of service to communities
• This gives rise to tension between government and industry as
government
4.1.3 Taxi industry issues
• Promises about participation in formal systems without
• proper planning and well thought through implications - promises that are and
will be difficult to fulfil in the “real world”
• A taxi recap programme that is having difficulty in getting off the ground
• Promises about subsidies (in whatever form) with an already major
shortage in PT funding
• Intra-industry rivalry that is difficult to contend with from a policy viewpoint
4.1.4 Issues Summary
• Funding of bus contracts– especially over the last four years.
• Interaction between Treasury and DOT – who calls the policy and funding shots?
• Lack of well-thought through policy initiatives – what are the intended and unintended
consequences?
35 | P a g e• Lack of policy implementation and monitoring at all levels
• Policy adjustments without proper motivation
• Competency issues at all levels
• Interaction between DOT and Provinces – and then we
• have not even addressed the relationship between
• DOT/Provinces and Metros/Local government!
• Provincial versus national agendas, especially over the last number of years
(Funding/DORA implementation issues)
• BRTs
– Promises about subsidy free BRTs??
– Introduction of BRTs without sign-off on the business models
– Over hasty implementation agenda
• IPTNs and IRPTNs (with stakeholder buy-in?)
4.1.5 Possible Solutions
• Additional funding sources have to be found at the local and provincial spheres of government
• The PT function should be devolved to the Metro/Local govt levels the relationship
with provinces need to be clarified (what will their roles be?)
• The skills shortage across the PT arena need to be addressed systematically
• Consultant reports have to be peer reviewed, this is good governance
• There is a need for a new collaboration framework for the management of PT, the current
framework is unclear and results in major issues between the respective spheres of
government
• Centre of Excellence to assist national/provincial and local government with policy issues
• There is a major need to ensure policy implementation, monitoring, there is just too
little formalisation in this area
• Public transport policy research should be institutionalized and policy amendments based
on thorough research findings and the dissemination thereof in wider forums
• Proper planning should precede implementation- the JHB BRT is an example where the
business model is not yet finalised which results in stress and negative publicity
36 | P a g eYou can also read