Humic surface waters of frozen peat bogs (permafrost zone) are highly resistant to bio- and photodegradation - Biogeosciences
←
→
Page content transcription
If your browser does not render page correctly, please read the page content below
Biogeosciences, 16, 2511–2526, 2019
https://doi.org/10.5194/bg-16-2511-2019
© Author(s) 2019. This work is distributed under
the Creative Commons Attribution 4.0 License.

Humic surface waters of frozen peat bogs (permafrost zone) are
highly resistant to bio- and photodegradation
Liudmila S. Shirokova1,2 , Artem V. Chupakov2 , Svetlana A. Zabelina2 , Natalia V. Neverova2 ,
Dahedrey Payandi-Rolland1 , Carole Causserand1 , Jan Karlsson3 , and Oleg S. Pokrovsky1,4
1 Geoscience   and Environment Toulouse, UMR 5563 CNRS, University of Toulouse, 14 Avenue Edouard Belin,
31400 Toulouse, France
2 Institute of Ecological Problems of the North, N. Laverov Federal Center for Integrated Arctic Research,

Nab Severnoi Dviny 23, Arkhangelsk 163000, Russia
3 Climate Impacts Research Centre (CIRC), Department of Ecology and Environmental Science, Umeå University,

901 87 Umeå, Sweden
4 BIO-GEO-CLIM Laboratory, Tomsk State University, 35 Lenina Pr., Tomsk 634050, Russia

Correspondence: Oleg S. Pokrovsky (oleg.pokrovsky@get.omp.eu)

Received: 27 December 2018 – Discussion started: 14 January 2019
Revised: 27 May 2019 – Accepted: 11 June 2019 – Published: 28 June 2019

Abstract. In contrast to the large number of studies on humic    1   Introduction
waters from permafrost-free regions and oligotrophic wa-
ters from permafrost-bearing regions, the bio- and photola-      Boreal and subarctic waters contain large amounts of plant,
bility of DOM from the humic surface waters of permafrost-       soil and dissolved organic matter of peat origin (Wilkin-
bearing regions has not been thoroughly evaluated. Follow-       son et al., 2013; Kaiser et al., 2017), and the proportion
ing standardized protocol, we measured biodegradation (at        of land-derived organic carbon (C) in these waters is likely
low, intermediate and high temperatures) and photodegrada-       to increase with ongoing permafrost thaw (Wauthy et al.,
tion (at one intermediate temperature) of DOM in surface wa-     2018). Heterotrophic bacteria degrade this DOM (Karls-
ters along the hydrological continuum (depression → stream       son et al., 2007; McCallister and del Georgio, 2008), caus-
→ thermokarst lake → Pechora River) within a frozen peat-        ing net heterotrophic conditions (gross primary productiv-
land in European Russia. In all systems, within the experi-      ity < respiration) and CO2 emission to the atmosphere from
mental resolution of 5 % to 10 %, there was no bio- or pho-      surface waters (Ask et al., 2012; Lapierre et al., 2013). Be-
todegradation of DOM over a 1-month incubation period. It        tween 10 % and 40 % of the dissolved organic carbon (DOC)
is possible that the main cause of the lack of degradation is    in the lakes, rivers and soil waters in the boreal zone may
the dominance of allochthonous refractory (soil, peat) DOM       be available for bacterial uptake over a time frame of sev-
in all waters studied. However, all surface waters were su-      eral weeks (Berggren et al., 2010; Roehm et al., 2009). The
persaturated with CO2 . Thus, this study suggests that, rather   biodegradability of DOM leached from permafrost and non-
than bio- and photodegradation of DOM in the water col-          permafrost soils was recently reviewed by Vonk et al. (2015),
umn, other factors such as peat pore-water DOM processing        who concluded that aquatic DOC is more biodegradable
and respiration of sediments are the main drivers of elevated    in regions with continuous permafrost compared with re-
pCO2 and CO2 emission in humic boreal waters of frozen           gions without permafrost. At the same time, among all Arc-
peat bogs.                                                       tic rivers, the highest annual (20 %) and winter (ca. 45 %)
                                                                 biodegradable DOC (BDOC) was reported for the Ob River,
                                                                 which drains through peatlands with minimal influence from
                                                                 permafrost (Wickland et al., 2012). Furthermore, based on 14
                                                                 studies of BDOC and their own research, Vonk et al. (2015)
                                                                 demonstrated zero BDOC loss in aquatic systems without

Published by Copernicus Publications on behalf of the European Geosciences Union.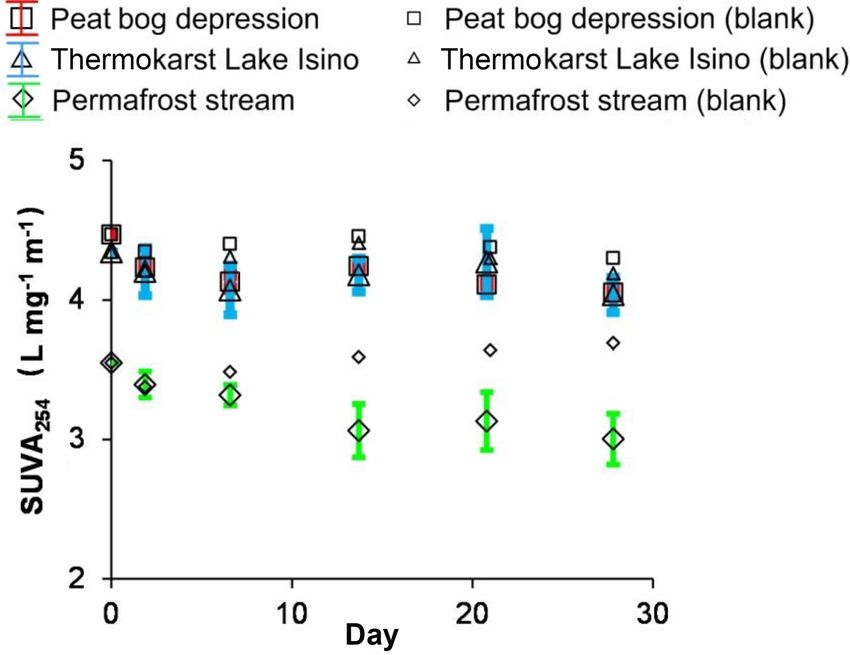
2512                          L. S. Shirokova et al.: Frozen peat waters are highly resistant to bio- and photodegradation

permafrost, which is contradictory to the general understand-      riched in DOC compared with other permafrost-affected re-
ing of the biodegradation of aquatic DOM as major driver           gions (Manasypov et al., 2014; Pokrovsky et al., 2015) and
of CO2 emission in boreal waters. It is also important to          may provide a disproportionally high contribution to the total
note that all of the available biodegradation studies of inland    DOM bio- and photo-degradability in the Arctic and subarc-
waters in permafrost regions have dealt with either tundra         tic regions.
ecosystems, with shallow peat soils overlaying the mineral            Numerous experiments in permafrost-bearing and
substrate, or mountain regions, with essentially mineral soil      permafrost-free aquatic environments, including both or-
substrates in Alaska or Canada (Holmes et al., 2008; Wick-         ganic and mineral soil substrates that are relatively poor
land et al., 2012; Ward et al., 2017) and with the yedoma          in DOC, have demonstrated that the headwater streams
soils of eastern Siberia (Mann et al., 2014, 2015; Spencer et      and soil leachate contain the most biodegradable and pho-
al., 2015).                                                        todegradable DOM (Ilina et al., 2014; Mann et al., 2014,
   Similarly, although the photolysis of DOM in boreal and         2015; Larouche et al., 2015; Spencer et al., 2015; Vonk
subarctic aquatic environments contributes to CO2 emission         et al., 2015). Photooxidation and biodegradation have also
from the inland waters to the atmosphere (Cory et al., 2014),      been shown to play an important role in small streams of
the overwhelming majority of photodegradation studies in           temperate peatlands in the UK and Scotland (Moody et
the Arctic have been conducted on oligotrophic lake wa-            al., 2013; Pickard et al., 2017; Dean et al., 2019). In the
ters and streams draining mineral soils of mountain regions        present study, we hypothesized that, given the nutrient-poor
(Ward and Cory, 2016; Cory et al., 2013, 2015). The dom-           nature of Sphagnum peat from Histosols, the bioavailability
inance of photolytic processes in DOM processing in Arc-           of essentially recalcitrant DOM in the surface waters of
tic waters has been reported for North America (Cory et al.,       frozen peatlands would be low. Furthermore, we expected
2014; Ward et al., 2017), Canadian surface waters of the tem-      a gradient in the degree of the bio- and photolability of
perate zone (Winter et al., 2007; Porcal et al., 2013, 2014,       DOM from permafrost subsidence, head water streams,
2015) and small Swedish humic-rich headwater catchments            thermokarst lakes and large rivers, corresponding to the
(Köhler et al., 2002). In contrast, several other studies from     increase in water residence time (Mann et al., 2012).
Scandinavia (Groeneveld et al., 2016; Koehler et al., 2014),          To test these hypotheses, we used a recommended stan-
Canada (Laurion and Mladenov, 2013; Gareis and Lesack,             dardized protocol for DOM biodegradation (Vonk et al.,
2018) and northwestern Russia (Oleinikova et al., 2017; Chu-       2015) and applied it for four main aquatic components of
pakova et al., 2018) have demonstrated the sizable removal         a hydrological continuum: permafrost subsidence → small
of colored (chromophoric) DOM but a quite small (≤ 10 %)           stream → large thermokarst lake → large river (the Pe-
impact of sunlight irradiation on the bulk DOC concentration       chora). We chose the largest frozen peatlands in Europe,
in streams, rivers and lakes. Note here that the interaction be-   the Bolshezemelskaya Tundra of northeast European Russia.
tween bio- and photodegradation is more important than the         The Bolshezemelskaya Tundra is represented by flat-mound
individual processes, as photooxidation may transform DOM          (palsa) peat bog (discontinuous and continuous permafrost
molecular structures into more bioavailable forms (e.g., Cory      zone) and belongs to the watershed of the largest European
and Kling, 2018; Sulzberger et al., 2019).                         permafrost-affected river, the Pechora. The specific goals of
   Overall, available data demonstrate that an emerging            this study were (i) to assess the difference in the BDOC and
paradigm regarding the importance of bio- and photodegra-          photodegradable (PDOC) fraction of DOM in the surface wa-
dation may not be as consistent across the Arctic as previ-        ters of a frozen peat bog along the hydrological continuum,
ously thought, which outlines a need for further studies of        from permafrost depressions to large rivers, (ii) to quantify
these processes, encompassing a wider range of aquatic set-        the impact of temperature on the biodegradation potential of
tings. The numerous surface waters located within the dis-         surface waters from frozen peat bogs and predict the possi-
continuous to continuous permafrost zone of northern Eura-         ble impact of warming on DOM biodegradation efficiency,
sia, where most aquatic systems are drained through frozen         and (iii) to relate the BDOC and PDOC concentrations to the
peat rather than mineral substrates, are poorly studied re-        snapshot CO2 concentration and emission.
garding bio- and photo-degradability of aquatic DOM. How-
ever, these regions (northeast European Russia or the Bol-
shezemelskaya Tundra, the western Siberian lowland, the            2     Study site and methods
northern Siberian lowland, Kolyma and the Yana–Indigirka
lowland) occupy > 2 million km2 , which is more than 10 %          2.1    Geographical context and hydrological continuum
of the total permafrost-affected land area, and they exhibit,             of the Pechora River basin
on average, a 10 times higher concentration of soil organic
carbon – in the form of a 0.5 to 3 m thick peat layer – than       The water samples were collected in the middle of July 2017,
the rest of the circumpolar regions (Tarnocai et al., 2009;        which is the midsummer period, consistent with the time pe-
Raudina et al., 2018). As a result of the dominance of His-        riods used by other researchers for biodegradation assays.
tosols, the surface waters draining frozen peatlands are en-       The Bolshezemelskaya Tundra (BZT) peatland (continuous

Biogeosciences, 16, 2511–2526, 2019                                                    www.biogeosciences.net/16/2511/2019/
L. S. Shirokova et al.: Frozen peat waters are highly resistant to bio- and photodegradation                                 2513

to discontinuous permafrost zone) belongs to the Pechora          were performed in laminar hood box (class A100) under ster-
River watershed (Fig. S1 in the Supplement), the largest Eu-      ile environmental conditions: the working space was steril-
ropean Arctic river draining permafrost-bearing terrain (the      ized using an ultraviolet (UV) light before preparation. Trip-
watershed covers 322 000 km2 and has a mean annual dis-           licate 30 mL aliquots of 0.7 µm filtered water were placed
charge of 4140 m3 s−1 ). The northern part of the Pechora         into pre-combusted (4.5 h at 450 ◦ C) dark borosilicate glass
River watershed is covered by permafrost: discontinuous in        bottles with a volume of 40 mL without nutrient amend-
the eastern part and sporadic to isolated on the western part     ment, were wrapped in aluminum foil to prevent any pho-
(Brittain et al., 2009). The BZT is a hilly moraine lowland       tolysis and were stored at 23 ± 1 ◦ C in the dark. The bot-
located between the Pechora and Usa rivers to the west and        tles were closed with sterilized PVC caps. As recommended,
south and the Polar Urals and the Pai-Khoi ridge to the east.     the caps were left loose and the bottles were shaken manu-
The dominant altitudes are between 100 and 150 m, and are         ally once a day; the liquid touching the cap during shaking
created by hills and moraine ridges, which are composed           was avoided. The incubated samples were refiltered through
of sands and silt with boulders. Between the moraines and         pre-combusted 0.7 µm GF/F filters using sterilized dismount-
ridges there are many lakes, mostly of thermokarst origin.        able Sartorius 25 mm filter holder and a cleaned sterile sy-
The dominant soils are the Histosols of peat bogs and podzol-     ringe after 0, 2, 7, 14 and 28 d of exposure. Filtered samples
gley soils in the southern forest–tundra zone. The mean an-       were acidified with 30 µL of concentrated (8.1 M) double-
nual temperature is −3.1 ◦ C, and the mean annual precipita-      distilled HCl, tightly capped and stored in the refrigerator
tion is 503 mm. The dominant vegetation in the tundra zone        before DOC analyses. The non-acidified portion of the fil-
is mosses, lichens and dwarf shrubs. Over past decades, the       trate was used for pH, specific conductivity, DIC (dissolved
lakes of the BZT have exhibited a sizable increase in summer      organic carbon), and UV254 nm and optical spectra measure-
time temperature and pCO2 , presumably due to the enhanced        ment. Control runs were 0.22 µm sterile-filtered water which
bacterial respiration of allochthonous DOM from thawing           was incubated in parallel to the experiments and refiltered
permafrost (Drake et al., 2019).                                  through 0.7 µm GF/F filters on the day of sampling.
   We sampled surface waters along the typical hydrological           In addition to this “classic” protocol, we used an alterna-
continuum (shown in Fig. S1) that consisted of (1) depres-        tive biodegradation experiment procedure to test the maxi-
sions in the moss and lichen cover of an upland frozen peat       mum possible DOM removal by bacteria. For this, we re-
bog, filled with water from the thawing of ground ice (per-       placed the initial 0.7 µm GF/F filtration with 3 µm filtration
mafrost subsidence, 2.5 m × 3 m size and 0.3 m depth); (2) a      through sterilized nylon Sartorius membranes in order to in-
small stream (∼ 2 km length) originating from an upland peat      crease the amount of bacterial cells capable to degrade DOM
bog; (3) a small thermokarst, Lake Isino (Sarea = 0.005 km2 ),    during incubation. The reason for this was that conventional
located within the peat bog; and (4) the mainstream of the        0.7 µm (GF/F) filtration might remove too many microbial
Pechora River. A similar hydrological continuum principle         cells (Dean et al., 2018). In addition, re-filtration through the
was considered in the Kolyma River biodegradation experi-         same filter pore size as that recommended in the classic pro-
ments (Mann et al., 2012). The list of the water bodies sam-      tocol (0.7 µm) may not necessarily remove the newly formed
pled along with their physical, chemical and microbiologi-        microbial biomass, as the cell size of bacteria grown dur-
cal characteristics, and parameters of the CO2 system is pre-     ing incubation may not exceed 0.7 µm. In this regard, initial
sented in Table 1. The surface waters were collected from the     3 µm filtration is equivalent to the 100 % inoculum used by
shore (depression and stream) or using a PVC boat (Pechora        Vonk et al. (2015) and can be considered to be the maxi-
River and Lake Isino). The water samples were placed into         mal enhancement of DOM biodegradation without the addi-
2 L Milli-Q pre-cleaned PVC jars and kept refrigerated until      tion of nutrients. Furthermore, instead of 0.7 µm re-filtration
their arrival to the laboratory, which occurred within 2–3 h of   for sampling, we employed a 0.22 µm filter pore size for
collection.                                                       DOC sampling during incubation. This allowed for the re-
                                                                  moval of all particulate organic carbon formed via micro-
2.2     Experimental setup                                        bial metabolism, as well as some newly grown microbial
                                                                  cells; therefore, this should enhance the degree of biodegra-
2.2.1    Biodegradation                                           dation, calculated as the difference between the initial 3 µm
                                                                  filtration and the 0.22 µm filtration on the date of sampling.
For biodegradation assays we followed the standardized pro-       The control runs were filtered through sterile 0.22 µm fil-
tocol for assessing biodegradable DOC of Arctic waters            ters and incubated parallel to the experiments, following the
(Vonk et al., 2015). To facilitate the implementation of rec-     standard approach for control abiotic experiments in incuba-
ommended protocol, we used exactly the same filter tow-           tion experiments (Köhler et al., 2002). They were refiltered
ers, inline filter holders and vacuum devices as those de-        through 0.22 µm membrane on the day of experimental sam-
picted in Vonk et al. (2015). Initial samples were filtered       pling. To ensure the lack of DOC release from the sterilized
through pre-combusted (4.5 h at 450 ◦ C) Whatman GF/F fil-        nylon membrane, we ran blank (Milli-Q) filtration through
ters of a 0.7 µm nominal pore size. All of the manipulations      both 0.7 µm GF/F and 0.22 µm nylon filters; in both cases the

www.biogeosciences.net/16/2511/2019/                                                     Biogeosciences, 16, 2511–2526, 2019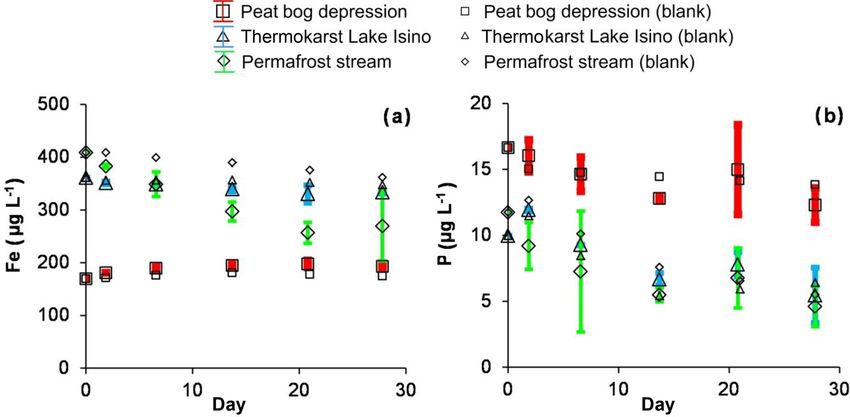
2514                                     L. S. Shirokova et al.: Frozen peat waters are highly resistant to bio- and photodegradation

Table 1. Landscape setting, hydrochemical characteristics and CO2 concentration, and emission flux of the waters studied. “S.C.” refers to
specific conductivity, and “TBC” is total bacteria count (using the DAPI fluorescence method).

  Sample                              BZ-2-17                        BZ-24-17                           BZ-12                                    P5
  GPS coordinates                     67◦ 360 48,800 N,              67◦ 36.530 N,                      67◦ 360 47,700 N,                        67◦ 400 09,400 ,
                                      53◦ 540 29.800 E               53◦ 50.260 E                       53◦ 540 38.500 E                         52◦ 390 30.800
  Description                         Depression in peat bog,        Stream in frozen peatland,         Thermokarst lake (Lake Isino),           Pechora River,
                                      Sarea = 7.5 m2                 Swatershed = 7.5 km2               Sarea = 0.005 km2                        Swatershed = 322 000 km2
  T (◦ C)                             24                             25                                 24.1                                     20
  pH                                  3.85                           6.52                               5.30                                     6.92
  S.C. (µS cm−1 )                     59.2                           31.5                               12.9                                     65.1
  DOC (mg L−1 )                       43.9                           16.6                               15.6                                     8.20
  DIC (mg L−1 )                       0.992                          2.52                               0.808                                    6.11
  SUVA254                             4.08                           3.32                               4.10                                     3.82
  P-PO4 (µg L−1 )                     2.3                            9.8                                4.4                                      26.7
  Ptotal (µg L−1 )                    14.6                           N.D.                               7.3                                      37.5
  N-NO2 (µg L−1 )                     14.6                           5.0                                3.6                                      1.67
  N-NO3 (µg L−1 )                     14.6                           N.D.                               76.6                                     111
  N-NH4 (µg L−1 )                     13                             152                                117                                      36.5
  Ntotal (µg L−1 )                    228                            N.D.                               200                                      438
  Si (µg L−1 )                        22                             392                                100                                      2690
  TBC × 106 (cell mL−1 )              0.81                           5.72                               5.36                                     3.51
  pCO2 (ppm)                          440                            2370                               1200                                     1860 (night), 780 (day)
  CO2 flux (mmol m−2 d−1 )            34                             30–300a                            74                                       100–130b
a By analogy with small streams of the western Siberian peatlands in the discontinuous permafrost zone, which are located in a similar environmental context;
b by analogy with the Taz and Pur rivers of the western Siberian peatlands (Serikova et al., 2018).

DOC blank was below 0.1–0.2 mg L−1 , which is less than                                     is within the range of solar radiation at the latitude of the po-
1 % of the DOC concentration in our samples. The glass bot-                                 lar circle during this period of the year. Overall, we followed
tles were incubated in triplicates at 4±2, 22±1 and 37±3 ◦ C                                the conventional methodology for photodegradation, which
using a refrigerator and incubators and agitated manually at                                is the exposure of 0.2 µm sterile filtered samples in quartz re-
least once a day over the 4-week exposure period.                                           actors in an outdoor pool (Vähätalo et al., 2003; Chupakova
                                                                                            et al., 2018; Gareis and Lesack, 2018), solar simulator (Lou
2.2.2     Photodegradation                                                                  and Xie, 2006; Amado et al., 2014) or directly in lake water
                                                                                            (Laurion and Mladenov, 2013; Groeneveld et al., 2016). Note
For photodegradation incubations, water samples of all sites                                that 0.22 µm sterile filtration is the only way to conduct pho-
except the river were collected in polypropylene jars and                                   todegradation experiments, given that the autoclave steriliza-
sterile filtered (0.22 µm Nalgene Rapid-Flow sterile systems)                               tion of DOM-rich natural water would coagulate humic ma-
within 2 h of sampling before they were refrigerated. The fil-                              terial and is, therefore, not suitable (Andersson et al., 2018).
trates were transferred under a laminar hood box into ster-                                 We chose a 4-week exposure time for consistency with the
ilized, acid-washed quartz tubes (150 mL volume, 20 % air                                   biodegradation experiments described above and following
headspace) and placed at a 3 ± 2 cm depth into an outdoor                                   previous studies on photodegradation under sunlight, which
pool that was filled with river water with a light transparency                             is typically from 15 to 70 d (Moran et al., 2000; Vähätalo
similar to that of the Pechora River (1.5–2.0 m Secchi depth).                              and Wetzel, 2004; Mostofa et al., 2007; Helms et al., 2008;
In situ measurements of sunlight intensity were conducted                                   Chupakova et al., 2018). Dark control experiments were con-
using a submersible sunlight sensor. The outdoor pools were                                 ducted in duplicates, using sterilized glass tubes filled with
placed in an unshaded area at a latitude similar to that of                                 sterile 0.22 µm filtered water, wrapped in aluminum foil and
the sampling sites. Slight wind movement and regular man-                                   placed in the same outdoor pool as the experiments. The
ual shaking allowed for sufficient mixing of the interior of                                headspace (approx. 20 % of total reaction volume) was sim-
the reactors during exposure. All of the experiments were                                   ilar in the experimental and control reactors. The individual
run in triplicates. The water temperature was 19 ± 3 ◦ C over                               reactors were sterile sampled at the beginning of the experi-
the 28 d exposure period (17 July–14 August 2017), with                                     ment and on days 2, 7, 14, 21 and 28 of exposure. Each sam-
an average magnitude of diurnal water temperature variation                                 pling sacrificed the entire reactor. The Milli-Q blanks were
of 6 ◦ C (recorded every 3 h using EBRO EBI 20 series log-                                  collected and processed to monitor for any potential sample
gers). The day light intensity was typically between 5000 and                               contamination introduced by our filtration, incubation, han-
20 000 lux (10 000 lux or 14 ± 5 W m−2 on average), which

Biogeosciences, 16, 2511–2526, 2019                                                                                     www.biogeosciences.net/16/2511/2019/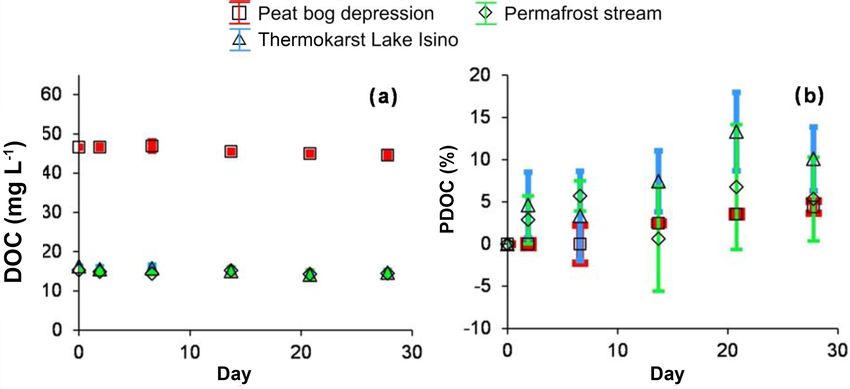
L. S. Shirokova et al.: Frozen peat waters are highly resistant to bio- and photodegradation                                   2515

dling and sampling procedures. The organic carbon blanks of           The bio- and photodegradable DOC (BDOC and PDOC,
filtrates never exceeded 0.2 mg L−1 .                              respectively) were calculated in percent loss relative to the
                                                                   control at each sampling time point t (0, 2, 7, 14 and 28 d)
2.3   Analyses and treatment                                       according to the following equation:
The temperature, pH, O2 and specific conductivity of surface       BDOC(%)t = 100 % × (DOCt,control − DOCt )/DOCt,control        (1)
waters were measured in the field, as described previously
(Shirokova et al., 2013b). The dissolved CO2 concentration         Alternatively, the BDOC and PDOC were calculated in per-
was measured using a submersible Vaisala CARBOCAP®                 cent loss at time point t relative to the initial concentration of
GM70 hand-held carbon dioxide meter with GMP222 probes             DOC (DOCt=0 ) following Vonk et al. (2015):
(accuracy 1.5 %), see Serikova et al. (2018, 2019) for
methodological details. The diffusional CO2 flux was cal-          BDOC(%)t = 100 % × (DOCt=0 − DOCt )/DOCt=0 .                  (2)
culated using a wind-based model (Cole and Caraco, 1998)
with k600 = 2.07 + 0.215 × u1.7 10 , where u10 is the wind speed
                                                                   For most treatments and waters sampled, the difference be-
at a height of 10 m. In the filtrates, we measured optical den-    tween the percent loss calculated by the two methods of bio-
sity at 254 nm and at selected wavelengths (365, 436, 465          /photodegradable DOC concentration was statistically negli-
and 665 nm) of the visible spectrum. The specific UV ab-           gible. To assess the variability of the results, shown as verti-
sorbency (SUVA254 , L mg−1 m−1 ) and E4 : E6 ratios were           cal uncertainties in the graphs, we used the percentage ratio
used as a proxies for aromatic carbon, molecular weight and        of the standard deviation of n replicates on the ith day of ex-
DOM source (Weishaar et al., 2003; Peacock et al., 2014;           posure to the initial DOC concentration using the following
Ilina et al., 2014).                                               equation:
   The DOC and DIC were analyzed by high-temperature                       v
catalytic oxidation using a TOC-VCSN instrument                            u
                                                                           u           (BDOC1i −BDOCmeani  )2
(Shimadzu® ; uncertainty ±2 %, 0.1 mg L−1 detection                        t +(BDOC2 −BDOCmean )2 +...(BDOCn −BDOCmean )2
                                                                                      i        i                i        i
                                                                   SDi =                                                         (3)
limit). The DIC was measured after sample acidification                                                n
with HCl, and the DOC was analyzed in acidified samples                       SDi
after sparging it with C-free air for 3 min at 100 mL min−1        %SDi =         · 100.                                         (4)
                                                                             DOC0
as non-purgeable organic carbon (NPOC). Selected quartz
reactors in photodegradation experiments were utilized to          (The results are presented as %BODi ± SDi .)
measure dissolved O2 using an Oxi 197i oximeter with a                To assess the uncertainties during photodegradation exper-
CellOx® 325 galvanic submersible sensor (WTW, Germany;             iments, we used the percentage of the standard deviation on
±0.5 % uncertainty). For this, the O2 galvanic sensor was          n replicates on the ith day of exposure to the DOC concen-
introduced into the quartz tube immediately after the reactor      tration in the dark (control) reactors as follows:
was opened and was allowed to equilibrate for 5–10 min;
during this procedure, the open end of the tube was protected      PDOCni = DOCblank
                                                                               i     − DOCni                                     (5)
from exchange with atmospheric oxygen by wrapping it                              PDOC1i + PDOC2i + . . .PDOCni
in aluminum foil. All filtered samples collected from the          PDOCmean
                                                                       i    =                                                    (6)
                                                                                                   n
photodegradation experiments were acidified with ultrapure
                                                                                 PDOCmean
                                                                                     i
nitric acid and analyzed for major and trace elements              %PDOCi =                    · 100                             (7)
following procedures employed by GET (Géosciences                                DOCblank
                                                                                    i
                                                                           v
Environnement Toulouse) for the analysis of boreal humic                   u
                                                                           u            (PDOC1i −PDOCmean
                                                                                                        i  )2
waters (Oleinikova et al., 2017, 2018).                                    t +(PDOC2 −PDOCmean )2 +...(PDOCn −PDOCmean )2
                                                                                      i        i            i        i
   To account for possible microbial development in                SDi =                                                         (8)
                                                                                                       n
biodegradation experiments, we performed an oligotrophic                        SDi
and eutrophic bacteria count during the course of incuba-          %SDi =                 · 100.                                 (9)
                                                                             DOCblank
                                                                                i
tion, following the standard methodology used in biodegra-
dation experiments of peat waters (Stutter et al., 2013), as de-   (The results are presented as %PDOCi ± SDi .)
scribed previously (Shirokova et al., 2017b; Chupakova et al.,        Note that if negative values were provided by Eq. (2), the
2018). In addition, we measured the total bacterial number         BDOC was taken as 0 % following the conventional practice
and quantified the dominant cell size morphology using the         in biodegradation experiments (Vonk et al., 2015). The un-
DAPI fluorescence method (Porter and Feig, 1980). Control          certainties of the BDOC percentages were between ±5 % and
experiments did not demonstrate the presence of any count-         ±10 % for experiments, at 4, 23 and 37 ◦ C using the modified
able cells in the observation fields.                              (3 and 0.22 µm filtration) protocol. Using the “classic” pro-
                                                                   tocol (0.7 µm GF/F filtration) the uncertainties were as high
                                                                   as 10 %–15 % at the end of experiment. We believe that such

www.biogeosciences.net/16/2511/2019/                                                        Biogeosciences, 16, 2511–2526, 2019
2516 L. S. Shirokova et al.: Frozen peat waters are highly resistant to bio- and photodegradation
high uncertainties are linked to a high initial DOC concentra-
tion, triplicate measurements and simultaneous monitoring
of the experimental and control runs.
Statistical treatment included the least squares method and
the Pearson correlation method, as the data were normally
distributed. The ANOVA method was used to test the dif-
ferences in the average DOC concentration versus time in
incubation experiments and in the controls and to assess the
difference between the light experiments and the dark con-
trol for photodegradation experiments. All calculations were
performed in STATISTICA version 10 (at p = 0.05; StatSoft
Inc.,Tulsa).
3 Results
3.1 Assessment of biodegradable DOC Figure 1. The DOC concentration over time in the biodegradation
experiments at 23 ◦ C. The experiments are shown using solid sym-
The waters of the hydrological continuum within the Pe- bols and the control runs are shown using open symbols: red squares
chora River basin are highly diverse (Table 1), with pH val- represent peat bog depression, green diamonds represent permafrost
stream, blue triangles, represent thermokarst Lake Isino and black
ues ranging from 3.8 (frozen peat depression) to 6.9 (Pe-
circles represent the Pechora River. The error bars represent ±1 SD
chora River). The soluble salt concentrations were low, as the
of the three replicates and are often within the symbol size.
specific conductivity ranged from 20 ± 10 µS cm−1 (stream
and thermokarst lake) to ∼ 60 µS cm−1 (in the peat bog de-
pression and the Pechora River). The DOC concentration
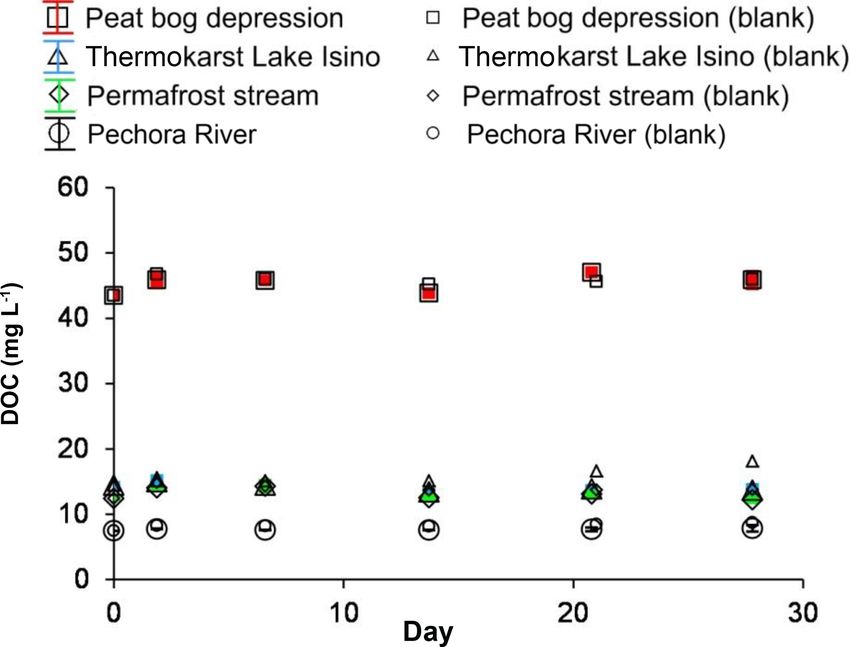
decreased from 44 mg L−1 in frozen peat depressions to ∼ could not be assessed, presumably due to instrument limita-
8 mg L−1 in the Pechora River following the order of wa- tion (the intrinsic uncertainty of NPOC analyses (ca. 2 % of
ter residence time (flow direction)” depression
stream 15 mg L−1 of DOC), which did not allow for the measure-
≥ thermokarst lake > Pechora River. The DOC concentra- ment of C changes smaller than 0.3 mg L−1 .
tion was generally similar (within ±2 %) between samples The UV254 nm absorbency of samples over the course of
that had initially undergone respective 3, 0.7 and 0.22 µm the dark aerobic exposure demonstrated a slight decrease
pore size filtration, which was in agreement with former with time (ca. between 5 % and 10 % over 28 d) in the peat
size fractionation measurements in Arctic and subarctic sys- bog depression using the classic protocol (Fig. S2). How-
tems (Vasyukova et al., 2010; Pokrovsky et al., 2012, 2016). ever, in all other treatments, the control was indistinguishable
All sampled surface waters exhibited CO2 supersaturation from the experimental runs, and the SUVA254 remained con-
with respect to the atmosphere (from 440 to 2400 ppm) and stant within the uncertainties of the triplicates (ca. ±5 % to
a net CO2 emission (diffusion) flux ranging from 30 to ±10 %). Similarly, no measurable change in the optical prop-
300 mmol CO2 m−2 d−1 (Table 1). erties of DOM (absorbency at 365, 465, and 665 nm, and in
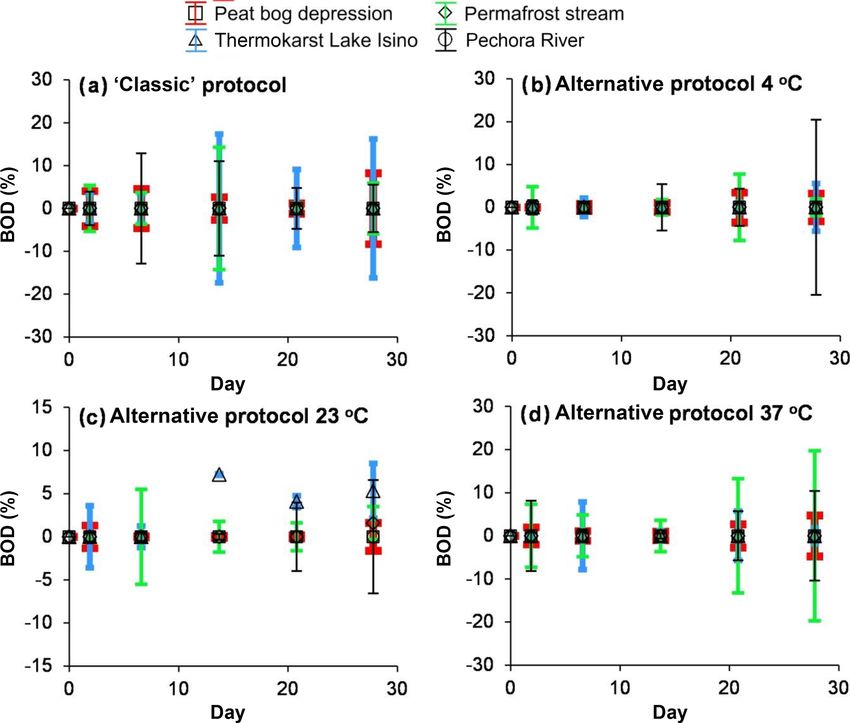
In both biodegradation experiment protocols, two major the E4 : E6 ratio) could be detected during the experiment.
features were noted: (1) the concentrations of 0.7 µm and The microbial consortium of all systems was dominated by
0.22 µm filtered DOC did not decrease during the expo- cocci (0.23 µm median size) and rods (0.96 µm× 0.20 µm) as
sure period, and (2) there was no sizable (> 10 %) differ- revealed from DAPI fluorescent imaging. The number of cul-
ence between the control run and the incubation experiment turable oligotrophic bacteria increased by a factor of ∼ 100
(Fig. 1). Using the classic biodegradation experiment pro- after the first 2–7 d of exposure at 22 ◦ C, in both the GF/F-
tocol (0.7 µm GF/F filtration) at 23 ◦ C, the BDOC fraction filtered and the 3 µm filtered samples, and then remained sta-
ranged between 0 % and 10 % for all surface waters. The ble at ca. 10 000 to 20 000 CFU mL−1 until the end of the
modified procedure (3 µm initial filtration and 0.22 µm sam- experiments (Fig. S3a, c). The highest concentration of olig-
pling) did not detect any significant biodegradation for any otrophic bacteria was observed in the Pechora River, whereas
of the waters studied (the average was 5 ± 5 % at 4, 23 and the other samples were not significantly different from one
37 ◦ C – Fig. 2b, c, d, respectively). The DIC concentrations another. The CFU value at 4 ◦ C ranged between 1000 and
remained constant (±5 % of the initial value) in all exper- 5000 CFU mL−1 and did not demonstrate any clear pattern
iments, but increased in stream water incubated at 37 ◦ C, with time of incubation (Fig. S3b). The number of eutrophic
where we measured a ∼ 10 % increase over 28 d of expo- bacteria ranged between 1000 and 15 000 CFU mL−1 in the
sure (not shown). This increase was equal to 0.2 mg L−1 of following order: Pechora River > stream ≥ peat bog depres-
DIC. Note that equivalent decrease in the DOC concentration sion ≥ thermokarst lake. There was no growth of eutrophic
Biogeosciences, 16, 2511–2526, 2019 www.biogeosciences.net/16/2511/2019/L. S. Shirokova et al.: Frozen peat waters are highly resistant to bio- and photodegradation 2517
Figure 2. Percentage of biodegradable DOC as a function of time. (a) The classic protocol of 0.7 µm GF/F filtration at 23 ◦ C; (b–d) the
alternative protocol of 3 µm filtered solution incubated at 4 ◦ C (b), 23 ◦ C (c) and 37 ◦ C (d) and filtered through 0.22 µm at each sampling.
The error bars are ±1 SD of the triplicates or, in a few cases, duplicates.
or oligotrophic bacteria at 37 ◦ C. The total cell number grad- The bacterial count in photodegradation reactors at the
ually increased over the course of the experiment at 22 ◦ C beginning of exposure and after 14 and 28 d of incubation
(Fig. S3d) with the maximum changes observed in the peat yielded between 1 and 100 CFU mL−1 . This is a factor of
bog depression and the Pechora River (by a factor of 30 and 100 to 1000 lower than the number of cells in biodegrada-
40, respectively). There was a progressive increase of rod- tion experiments run in non-sterilized waters over the same
shaped bacillus relative to coccus in the Pechora River and duration (Sect. 3.1). As such, the microbial degradation was
a permafrost stream, whereas the thermokarst lake and peat considered negligible for our experimental conditions with
bog depression did not exhibit any systematic change in dom- respect to sunlight exposure.
inant bacteria morphologies during the biodegradation exper- There was no sizable decrease in the DOC concentration
iments. Note that the total cell number in the surface waters during the 28 d of sunlight exposure (Fig. 3a). This rela-
of the Bolshezemelskaya Tundra was similar to values ob- tive change in the DOC concentration ranged from −5 % to
tained in incubation experiments (see Table 1, Fig. S3). +5 %, and it did not exceed the non-systematic variability
among the triplicates. Although the triplicates agreed within
3.2 Photodegradation of DOM from frozen peatlands less than 2 % (the symbol size in Fig. 3), the small change of
DOC in the peat depression was similar in the light experi-
The pH of sunlight-exposed samples did not exhibit any sys- ment and the dark control. The %PDOC (relative to starting
tematic variation within 0.5 pH units. The DIC remained solution) as a function of exposure time over the 28 d of the
fairly stable (within 0.5 mg L−1 ) without any significant experiment ranged from 0 % to 5 % in the peat bog depres-
change during incubation (R 2 < 0.5; p > 0.05), regardless of sion and 0 % to 10 % in the thermokarst lake and permafrost
the type of system, DOC and DIC concentration (not shown). spring (Fig. 3b).
The exposed water remained oxygenated (average O2 satura- The SUVA254 nm in photodegradation experiments de-
tion close to 90 %) with no detectable change (i.e., > 10 %) creased much more strongly than the DOC. The SUVA de-
over the course of experiment. Specific conductivity also re- crease relative to the control was most pronounced in the
mained highly stable over full period of exposure. permafrost stream (Fig. 4). The optical properties of DOC
demonstrated a sizable decrease of the E365 : E470 ratio cor-
www.biogeosciences.net/16/2511/2019/ Biogeosciences, 16, 2511–2526, 20192518 L. S. Shirokova et al.: Frozen peat waters are highly resistant to bio- and photodegradation
Figure 3. Concentration (a) and percentage (b) of degradable DOC in photodegradation experiments. The experiments are shown using solid
symbols and the control runs are shown using open symbols: red squares represent the peat bog depression, green diamonds represent the
permafrost stream and triangles represent the thermokarst Lake Isino. The error bars are ±1 SD of the triplicates.
in the thermokarst lake and permafrost stream (not shown).
Overall, the magnitude of the decrease in P, Fe, Ti, V and Zn
in photodegradation experiments occurred in the following
order: permafrost stream > thermokarst lake > permafrost
depression.
4 Discussion
4.1 High stability of DOM to biodegradation in surface
waters from frozen peatland
The unexpected result of this study was the very low BDOC
fraction, measured not only in a large river (Pechora) but
also in a small stream, a thermokarst lake and in peatland
depressions formed due to permafrost subsidence. Accord-
ing to a compilation of available biodegradation studies, the
Figure 4. SUVA254 nm over time in photodegradation experiments. BDOC fraction (28 d exposure period) ranges from 3 % to
The error bars are ±1 SD of the triplicates. 18 % (mean 13 %) in waters of a continuous permafrost zone
and from 5 % to 15 % (mean 14 %) in a discontinuous per-
mafrost zone (Vonk et al., 2015). This is higher than the
responding to UV/vis absorbing functional groups (Fig. S4a), 0 % to 10 % BDOC measured for all water bodies from the
which was consistent with decreasing SUVA254 nm during discontinuous permafrost zone in this study. Note that very
sunlight exposure. The E254 : E436 ratio, corresponding to au- few biodegradability studies in aquatic systems have dealt
tochthonous versus terrestrial DOM, did not demonstrate any with frozen peatlands, and all previous incubation experi-
sizable change over the course of experiment (Fig. S4b). ments have used water from mountainous regions on mineral
Most of the major and trace elements did not show any soils in Scandinavia, on Alaskan slopes and in Canada, in
significant change (at p < 0.05) in concentration over the yedoma regions in eastern Siberia, or in the Yenisey Basin.
photodegradation experiments. Only a few nutrients (P, Fe, Only one former biodegradation study in a peat mire con-
Zn and B) and trace metals (Zn, Ti, V, Zr, Nb and Th) text demonstrated the sizable bioavailability of soil leachate
demonstrated a decrease in concentration. The decrease of to lake water bacteria (Roehm et al., 2009); however, Roehm
Fe was most pronounced in the permafrost stream, and did et al. (2009) did not deal with a pure aquatic end-member, as
not occur in the permafrost depression (Fig. 5a), whereas to- was the case in this study. Instead, the BDOC of frozen peat-
tal dissolved phosphorus systematically decreased, by 20 % land surface waters measured for the Bolshezemelskaya Tun-
to 50 %, over the 28 d of sunlight exposure in the per- dra inland waters was comparable with the value suggested
mafrost depression, thermokarst lake and permafrost stream by Vonk et al. (2015) for non-permafrost aquatic DOC (0 %–
(Fig. 5b). A decrease in Ti, Zn, Nb and Th also occurred 1 %).
Biogeosciences, 16, 2511–2526, 2019 www.biogeosciences.net/16/2511/2019/L. S. Shirokova et al.: Frozen peat waters are highly resistant to bio- and photodegradation 2519 Figure 5. Fe (a) and P (b) concentrations over time in photodegradation experiments. The error bars are ±1 SD of the triplicates. Another important point revealed in previous work on of stable DOC (e.g., Textor et al., 2018) in natural settings, biodegradation in Arctic waters was that aquatic BDOC in although this effect could not be tested in this study. large streams and rivers decreased as the Arctic summer Mechanistic reasons for the extremely low bioavailabil- progressed (Vonk et al., 2015), although this pattern was ity of DOC from studied peatlands remain unclear and re- absent for soil leachates and small streams. In our case, quire an in-depth analysis of the DOM molecular structure thermokarst Lake Isino and the Pechora River can be con- and stoichiometry as well as high-resolution microbial ap- sidered to be sufficiently large hydrological systems. The proaches. It is known that the DOM released from frozen sampling was performed at the end of July, which is al- soils contains high proportions of biologically labile protein- ready summer baseflow period, and, as such, the 0 % to 5 % like and photochemically reactive aromatic substances (Gao biodegradable DOC measured for Lake Isino and the Pe- et al., 2018). Following the pioneering study of Ward et chora River in this study is comparable with the 0 % to 20 % al. (2017), we hypothesize that, similar to DOC from the BDOC loss reported in large streams and rivers on Julian organic (non-permafrost) layer, the concentration of highly day ∼ 200 (Vonk et al., 2015). However, small stream and labile, aliphatic-like DOC in surface waters of frozen peat- permafrost subsidence clearly remain at the very low end of lands is too low to sustain microbial populations, or that this BDOC % loss reported for soils and streams in summer. In aquatic DOC, remaining after the microbial processing of the estuarine zone of largest European Arctic permafrost- soil pore-water DOC, is of low lability for microbes capable free river, the Severnaya Dvina, there was no measurable of degrading aliphatic-like DOC and inhabiting the aerobic biodegradation in spring, when the DOM was dominated by zone of permafrost surface waters. The constant pattern of allochthonous sources, but a 15 % to 20 % decrease of DOC UV254 absorbency in biodegradation experiments was con- occurred during first 300 h in river water collected in Au- sistent with the negligible change in BDOC over the 28 d in- gust, when sizable phytoplankton productivity was observed cubation period. In comparison, the biodegradation of peat (Shirokova et al., 2017b). In laboratory experiments with water from the European boreal zone was associated with individual cultures, moss and peat leachates were also siz- an increase in SUVA by up to 7.4 %, which also implies an ably biodegraded over 1–2 d of exposure (Shirokova et al., increase in the proportion of aromatic compounds (Hulatt 2017a), whereas the same bacterial species were not capa- et al., 2014). The total bacterial number in the surface wa- ble of degrading DOM from surface waters draining peatland ters studied (0.5 to 5 × 10⁶ cell mL−1 ) is in excellent agree- and moss-covered bogs (Oleinikova et al., 2018). Following ment with other studies on thermokarst peatland lake waters a recommended protocol for biodegradation assays (Vonk et (Deshpande et al., 2016). Following these researchers, we al., 2015), in this work we incubated natural water without suggest that the reason for the low biodegradability of peat- nutrients. This creates a potential bias regarding the appli- land humic waters is that the majority of the active bacteria cation of obtained results to various subarctic settings. For are associated with particles (> 3 µm) rather than present as example, one should note that nutrients and labile DOM ad- free-living cells (< 1 µm) capable of processing DOC. In ad- dition downstream (away from the oligotrophic bogs) can in- dition, the bacterial communities are not just shaped by size crease the capacity of biodegradation and related CO2 emis- fractionation by filtration, but also by the presence or absence sion in a large river, before its discharge to the Arctic Ocean. of bacterial grazers (Dean et al., 2018). However, further Furthermore, it is possible that the input of bio-labile DOC mechanistic studies of model aquatic bacterial communities from terrestrial vegetation may enhance the bioavailability www.biogeosciences.net/16/2511/2019/ Biogeosciences, 16, 2511–2526, 2019
2520                          L. S. Shirokova et al.: Frozen peat waters are highly resistant to bio- and photodegradation

capable of affecting the degradation of DOM from different        or in its tributaries and streams (Stubbins et al., 2017). An-
terrestrial sources are necessary (Logue et al., 2016).           other recent study of DOM photodegradation in boreal high-
   Interestingly, there was no measurable difference in           latitude peatland streams of the White Sea watershed demon-
BDOC at 4, 23 and 37 ◦ C, as the proportion of BDOC at            strated only a 10 % decrease in the DOC concentration over
all temperatures for each system was below 5 %–10 %. This         a 10 d incubation period under sunlight (Oleinikova et al.,
result allows for the preliminary prediction of the possi-        2017). In the estuarine zone of the largest European Arctic
ble consequence of climate change and surface water heat-         river draining wetland- and forest-dominated permafrost-free
ing at high latitudes. In a short-term climate warmings sce-      territory (Severnaya Dvina), we did not find any measurable
nario, or assuming the fast heating of surface waters due         photodegradation of DOM over 1 month of exposure (Chu-
to prolonged heat waves or drought occurring both in Eu-          pakova et al., 2018). This comparison clearly demonstrates
ropean, permafrost-free (Shirokova et al., 2013a) and west-       highly contrasting DOM photolability between the aquatic
ern Siberian (Pokrovsky et al., 2013) permafrost-bearing          systems of North America, draining through mineral soil
peatlands, we do not foresee any measurable change in             substrates, and that of boreal and subarctic peatlands.
the biodegradability of DOM from the water column. Un-               Furthermore, due to the high homogeneity of the organic
der even the most extreme heating scenario for thermokarst        substrate surrounding the waters studied and the similar al-
lakes, rivers and depressions of the frozen peatland territo-     lochthonous origin of the DOM in all surface waters of
ries, the short-term bioprocessing of aquatic DOM may re-         frozen peatlands, there was no dramatic difference in the
main close to zero.                                               DOM photo-degradability over the hydrological continuum
                                                                  in the northeastern European Arctic, which also contrasts
4.2    Negligible impact of photodegradation on DOM               with results obtained in aquatic systems on mineral soils
       transformation in inland waters of frozen peatlands        (Cory et al., 2007, 2013; Reader et al., 2014). It is possi-
                                                                  ble that either (1) photochemical degradation of humic peat
The second main result of this work was the high stability of     waters occurs very fast during the first hours to days upon
surface water DOM to sunlight exposure. Over the 28 d incu-       their exposure to sunlight, or (2) that the nature of DOM is
bation period in outdoor pools at conditions corresponding        so refractory that much longer exposure periods, of the order
to the surface water layer (< 0.05 m depth) of thermokarst        of several months to years (as in the Arctic coast) are neces-
lakes and streams of the permafrost zone, the change in the       sary to photo-degrade the DOM from frozen peatlands. The
DOC concentration was less than 5 %–10 % of the initial           first explanation is consistent with recent experiments on the
value and was not distinguishable from that of the dark con-      photodegradation of fresh peat mire water, collected in the
trol (Fig. 3a, b). Therefore, the DOM of the frozen peatland      Taiga region of northwestern Russia, where about 50 % of
is quite refractory and not subject to measurable photodegra-     bog water DOC was photo-degraded over 2 d of exposure to
dation over 4 weeks of exposure. This period is comparable        sunlight (Oleinikova et al., 2017).
with the water residence time in small depressions of frozen         As such, it is possible that all surface waters sampled
peatlands (Novikov et al., 2009) and small thermokarst thaw       for the experiments in this study, including stagnant wa-
ponds of frozen palsa peat bogs (Manasypov et al., 2015), but     ter in permafrost depression, had already undergone con-
it is much higher than the water travel time in small streams     tact with sunlight for more than several days and had there-
(< 10 km long) and in the lower reaches of the Pechora River,     fore became photo-resistant. Assuming the maximal pos-
from the sampling site to the Arctic Ocean (ca. several days).    sible DOC loss due to photolysis assessed in our experi-
This result apparently contradicts the recent paradigm that       ments (0.1 mg C L−1 d−1 corresponding to a loss of 3 mg L−1
photochemical oxidation may account for 70 % to 95 % of to-       over 28 d) and the light penetration depth of 0.5 m, which is
tal DOC processed in the water column of Arctic lakes, rivers     comparable to the typical depth of the water bodies stud-
and soils (Cory et al., 2013, 2014; Ward and Cory, 2016;          ied, photodegradation would contribute to less than 10 %
Ward et al., 2017). However, the conclusion of this group         of the total CO2 emission flux from the water surfaces of
of authors is based on a study of distilled water leachates       frozen peatlands (0.4–0.8 g C m−2 d−1 in this work; 0.8 to
of mineral soils, headwater streams, fresh permafrost thaw        4.4 C m−2 d−1 in western Siberian rivers and streams, located
sites and lakes of northern Alaskan slopes, developed on          in a very similar environmental context – frozen peat bogs;
mineral substrates. In contrast, the results of DOM photol-       Serikova et al., 2018). The maximal PDOC value measured
ysis in polygonal and runnel ponds located in frozen peat-        in this work is also at the lower end of the range of the DOM
lands (2 m peat, 40–60 cm active layer thickness) of contin-      photodegradation contribution to the C flux in north Euro-
uous permafrost regions (Canada High Arctic) demonstrated         pean boreal and subarctic settings. Thus, DIC annual photo-
a relatively fast decay of water color and fluorescence, but an   production contributed between 1 % and 8 % of CO2 emis-
insignificant loss of DOC over a 12 d exposure period (Lau-       sions from a humic lake in the south of Sweden (Groeneveld
rion and Mladenov, 2013). Recently, no measurable photo-          et al., 2016), and globally, in the boreal and subarctic zone,
chemical loss of ancient permafrost DOC has been revealed         sunlight-induced CO2 emissions represent about one-tenth of
in the thawing yedoma permafrost sites of the Kolyma River,

Biogeosciences, 16, 2511–2526, 2019                                                   www.biogeosciences.net/16/2511/2019/
L. S. Shirokova et al.: Frozen peat waters are highly resistant to bio- and photodegradation 2521
the CO2 emissions from lakes and reservoirs (Koehler et al., other studies at high latitudes, we assessed the bio- and
2014). photo-degradability of DOM during the midsummer period.
The evolution of the optical properties of DOM as a func- Not accounting for the spring freshet, which represents more
tion of exposure time in different samples was consistent than 60 % of the annual DOM transport in similar boreal and
with the mechanisms of photosensitive DOM removal dur- subarctic rivers of European Russia (Pokrovsky et al., 2010)
ing irradiation. The E365 : E470 ratio is known to correlate and western Siberia (Pokrovsky et al., 2015; Vorobyev et al.,
with the degree of condensation of DOM aromatic groups 2019), may create a substantial bias when extending our re-
and with the degree of humification (Chin et al., 1994; Hur sults to other territories of the subarctic during the full open
et al., 2006), whereas UV254 is used as proxy for aromatic C water period. However, it was recently shown that during
and the source of DOM (Chen et al., 1977; Uyguner and Bek- spring flood, the DOM in the largest European Arctic River,
bolet, 2005). The optical properties of DOC were much less the Severnaya Dvina, which is similar to the Pechora River, is
conservative under sunlight exposure compared with the total not at all biodegradable (Shirokova et al., 2017b). Moreover,
dissolved C concentration, as UV254 nm and the E365 : E470 the springtime period does not exhibit any particularly high C
ratio sizably decreased over the course of the experiments. concentrations in the thaw ponds and thermokarst lake waters
Numerous studies of allochthonous riverine DOM also re- of frozen peatlands (Manasypov et al., 2015), and CO2 emis-
vealed that photodegradation of colored DOM (CDOM) and sions from rivers and lakes of the permafrost-affected wet-
SUVA254 were much greater than DOC losses (Spencer et lands of western Siberia were not much higher in spring than
al., 2009; Reche et al., 2000; Vähätalo and Wetzel, 2004; during other seasons (Serikova et al., 2018, 2019). There-
Mostofa et al., 2011; Bittar et al., 2015; Gareis and Lesack, fore, although our seasonally restricted data set is not repre-
2018). A decrease of E365 : E470 corresponded to a removal sentative for the pan-Arctic environment, and further studies
of UV rather than visual light absorbing functional groups, with high spatial resolution across different climate zones are
whereas a constant pattern of the E254 : E436 ratio within the needed (see examples in Lapierre and del Giorgio, 2014), our
hydrological continuum – depression → stream → lake → findings are at odds with the dominant paradigm that bio-
river – was consistent with a lack of autochthonous DOM and photodegradation control the DOC removal from Arc-
in all water bodies studied, which were dominated by terres- tic aquatic ecosystems (Abbot et al., 2014; Cory et al., 2014;
trial (aromatic) DOM from peat horizons. Overall, our ob- Spencer et al., 2015). Given the incontestable bio- and photo-
servations confirm the conclusion reached by a recent com- degradability of peat pore waters and frozen soil extracts re-
pilation of available data from around the world: degrada- ported across the Arctic (Vonk et al., 2015; Selvam et al.,
tion processes act preferentially on CDOM rather than on 2017), this strongly suggests that the DOM which arrives
the DOC concentration (Massicotte et al., 2017; Oleinikova to small rivers and even permafrost depressions via lateral
et al., 2017). peat soil outflux is already highly degraded. This is consis-
In contrast to DOC, the sizable removal of dissolved P and tent with the general idea that the rates of DOM photochem-
Fe along with some related trace elements (Ti, V, Zn and Nb) ical alteration and the rates of microbial responses to altered
during the photolysis of surface waters reflects the transfor- DOM are typically rapid, from minutes to days (Cory and
mation and coagulation of Fe-rich colloids, which behave in- Kling, 2018). As such, the majority of elevated CO2 mea-
dependently of organic colloids in humic waters (Vasyukova sured in the surface waters of the permafrost peat landscape
et al., 2010; Pokrovsky et al., 2016). This precipitation of Fe originates from the degradation of soil water DOM once it
hydroxides along with P and insoluble trace elements was enters open surface water. This is especially true for pho-
most pronounced in the permafrost stream, which had the tooxidation, which is not likely to occur in the soil.
highest pH. In this stream, Fe(III) hydroxide was not sta- We believe that the degradation of soil DOM in the sur-
ble due to pronounced hydrolysis. After the photolytic re- face waters of frozen peatlands occurs very fast and com-
moval of a small amount of DOM that stabilized colloidal Fe pletes within first hours or days. This is shorter than the res-
(Oleinikova et al., 2017), Fe hydroxide could coagulate and idence time of water in permafrost depressions, thaw ponds
coprecipitate P and some trace elements. and rivers (Manasypov et al., 2015). As a result, we did not
detect sizable bio- and photodegradation of residual DOM in
4.3 Lack of bio- and photodegradation in humic various types of inland waters from permafrost landscapes.
surface waters of frozen peat bogs despite sizable In order to explain persistent CO2 supersaturation of inland
CO2 emission waters from peatlands, we suggest that the benthic respi-
ration of stream, lake and river sediments produces a siz-
The main result of the present study is that, despite the well- able amount of CO2 – thus increasing the overall C emis-
known supersaturation of lentic and lotic waters of frozen sion potential of the aquatic systems (MacIntyre et al., 2018;
peatlands to atmospheric pCO2 (Serikova et al., 2018, 2019), Valle et al., 2018). For example, anaerobic C mineralization
these waters exhibit negligible bio- and photo-degradability of thermokarst lake sediments is fairly well established in
over a timescale (28 d) comparable to or exceeding the wa- the discontinuous permafrost zone of peat bogs in western
ter residence time in various reservoirs. For consistency with Siberia (Audry et al., 2011) and Canada (Deshpande et al.,
www.biogeosciences.net/16/2511/2019/ Biogeosciences, 16, 2511–2526, 20192522 L. S. Shirokova et al.: Frozen peat waters are highly resistant to bio- and photodegradation
2017). Note that the potential for dark DOM chemical oxi- We conclude a negligible impact of DOM bio- and pho-
dation in Fe-rich organic-rich waters facing redox oscillation todegradation on CO2 emission in surface waters of frozen
(i.e., Page et al., 2012) is rather low in the thermokarst waters peatlands. This calls for future work to quantify the com-
studied; therefore, they remain essentially oxic over the full bined bio- and photolability of peat pore waters, thawing soil
depth of the water column during the unfrozen period of the ice and supra-permafrost flow, which deliver the DOM to the
year. rivers, lakes and depressions.
The findings of this study and the widely reported domi-
nance of non-biodegradable DOC (0 %–1 % BDOC) in large
rivers and streams of the non-permafrost zone (Vonk et al., Data availability. Please note that all the data obtained in this work
2015) suggest that (1) the majority of BDOC is degraded be- are available in the main text and in the Supplement of this article.
fore its arrival to large aquatic reservoirs, and (2) the CO2
supersaturation and emission of surface waters from frozen
peatlands is due to soil pore water and sediment respiration Supplement. The supplement related to this article is available
rather than aerobic bio- and photodegradation of DOM in the online at: https://doi.org/10.5194/bg-16-2511-2019-supplement.
water column. Furthermore, the lack of an increase in the
BDOC fraction during the temperature rise from 4 to 37 ◦ C
Author contributions. LSS and OSP contributed to the study de-
implies that the heating of peat surface waters will be a minor
sign. LSS organized sampling campaigns and logistics. LSS, AVC,
factor of the overall CO2 balance, within the climate warm- SAZ, and NVN contributed to sampling. LSS and CC analyzed the
ing scenario. Instead, the change of the water path and res- DOC and DIC; DPR analyzed the SUVA and optical properties of
idence time in pore waters of frozen peatlands, the rate of samples. JK complemented the data with material from the litera-
supra-permafrost water delivery, and the magnitude of ben- ture. SSL analyzed data. AVC prepared the figures and tables. LSS
thic respiration in large rivers and thermokarst lakes may wrote the paper. JK and OSP helped interpret the results. All authors
control the CO2 emission from inland waters. commented on the paper.
5 Conclusions Competing interests. The authors declare that they have no conflict
of interest.
This work revealed the high resistance of surface waters col-
lected in permafrost peatland to both bio- and photodegra-
dation. Less than 5 %–10 % of the initial aquatic DOC was Financial support. This work was supported by RFFI (RFBR;
removed over a 1-month period of dark aerobic incubation grant nos. 17-05-00348_a, 17-05-00342_a, and 18-05-01041), Pro-
at 4, 22 and 37 ◦ C as well as during the sunlight exposure gram FANO (grant no. 0409-2015-0140), and UroRAN (grant
of sterile-filtered waters. In contrast to the expected differ- no. 18-9-5-29). Additional funding was provided by “JPI Climate”
ences in bio- and photolability between small permafrost de- initiative, which is financially supported by the Swedish Research
pressions, streams, a large lake and the Pechora River, there Council VR (grant no. 325-2014-6898).
was no measurable difference in the surface water BDOC
concentration along the hydrological continuum. The con-
tribution of aerobic DOM biodegradation within the water Review statement. This paper was edited by Steven Bouillon and
column to the observed CO2 supersaturations and net CO2 reviewed by Joshua Dean and one anonymous referee.
emission fluxes from bog water, lakes, streams and rivers of
peatland territories located within discontinuous permafrost
zone is less than 10 %. Despite the decrease in CDOM dur-
ing photolysis, this process does not significantly contribute
References
to the total DOC degradation and C emission from the sur-
face of inland waters of frozen peatlands. Abbott, B. W., Larouche, J. R., Jones, J. B., Bowden, W. B., and
We hypothesize that the refractory nature of DOM from Balser, A. W.: Elevated dissolved organic carbon biodegradabil-
frozen peatlands, which is already processed in soil waters ity from thawing and collapsing permafrost, J. Geophys. Res.,
before arriving to lentic and lotic surface reservoirs, creates 119, 2049–2063, 2014.
unfavorable conditions for biodegradation. The reason for the Amado, A. M., Cotner, J. B., Cory, R. M., Edhlund, B. L., and Mc-
high stability of DOM from frozen peatland to photolysis is Neill, K.: Disentangling the interactions between photochemi-
less clear but can be linked to the fast photodegradation of cal and bacterial degradation of dissolved organic matter: amino
peat bog and soil shallow (underground) waters after their acids play a central role, Microb. Ecol., 69, 554–566, 2014.
exposure to the surface, occurring within the first hours to Andersson, M. G. I., Catalán, N., Rahman, Z., Tranvik, L. J., and
days. Lindström, E. S.: Effects of sterilization on dissolved organic car-
bon (DOC) composition and bacterial utilization of DOC from
lakes, Aquat. Microb. Ecol., 82, 199–208, 2018.
Biogeosciences, 16, 2511–2526, 2019 www.biogeosciences.net/16/2511/2019/You can also read