A Review of Twentieth-Century Drought Indices Used in the United States
←
→
Page content transcription
If your browser does not render page correctly, please read the page content below

A Review
    of Twentieth-
Century Drought
  Indices Used in
the United States
                              BY   RICHARD R. HEIM JR.

D
       rought is a recurring phenomena that has
       plagued civilization throughout history. It af-            Knowing the history of drought index
       fects natural habitats, ecosystems, and many              development helps take the confusion
economic and social sectors, from the foundation of               out of the complex issues of drought
civilization—agriculture—to transportation, urban
water supply, and the modern complex industries.                     monitoring, drought impacts, and
The wide variety of sectors affected by drought, its                       drought definitions.
diverse geographical and temporal distribution, and
the demand placed on water supply by human-use
systems make it difficult to develop a single definition
of drought.
   The American Meteorological Society (1997)
groups drought definitions and types into four cat-
egories: meteorological or climatological, agricul-
tural, hydrological, and socioeconomic. A prolonged
(e.g., of several months or years duration) meteoro-
logical drought—the atmospheric conditions result-            AFFILIATION: HEIM—NOAA/National Climatic Data Center,
ing in the absence or reduction of precipitation—can          Asheville, North Carolina
develop quickly and end abruptly (in some cases, the          CORRESPONDING AUTHOR: Richard R. Heim Jr., Climate
transition can occur almost literally overnight).             Monitoring Branch, Scientific Services Division, National Climatic
Short-term (i.e., a few weeks duration) dryness in the        Data Center, 151 Patton Avenue, Asheville, NC 28801-5001
surface layers (root zone), which occurs at a critical        E-mail: Richard.Heim@noaa.gov
time during the growing season, can result in an ag-
                                                              In final form 12 February 2002
ricultural drought that severely reduces crop yields,
even though deeper soil levels may be saturated. Hot
temperatures, low relative humidity, and desiccating
winds often add to the impact of the lack of rainfall      reducing streamflow, groundwater, reservoir, and
(Condra 1944). The onset of an agricultural drought        lake levels, will result in a hydrological drought, which
may lag that of a meteorological drought, depending        will persist long after a meteorological drought has
on the prior moisture status of the surface soil lay-      ended. Socioeconomic drought associates the supply
ers. Precipitation deficits over a prolonged period        and demand of some economic good with elements
that affect surface or subsurface water supply, thus       of meteorological, agricultural, and hydrological

AMERICAN METEOROLOGICAL SOCIETY                                                                     AUGUST 2002             | 1149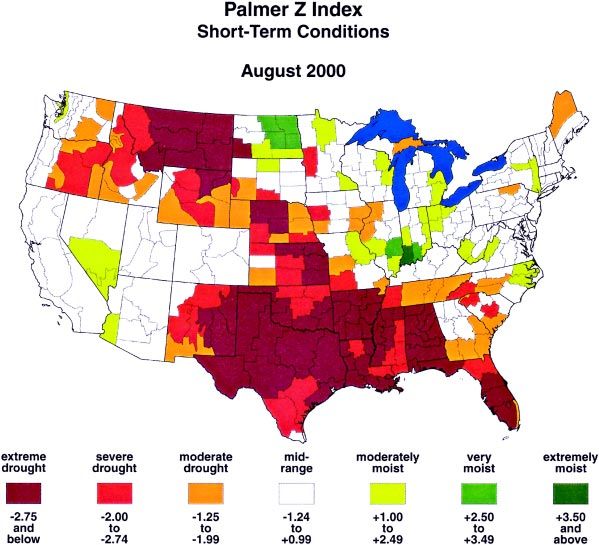
drought. The relationship between the different types    ments and annual crop yield) would not be applicable
     of drought is complex. For example, streamflow is the    for the operational monitoring of drought because of
     key variable to analyze in describing droughts for       the nature of paleoclimatic indices and the difficulty
     many water supply activities such as hydropower          involved in collecting paleoclimatic data on a real-
     generation, recreation, and irrigated agriculture        time operational basis. There are only a few cases (e.g.,
     where crop growth and yield are largely dependent        the streamflow records of Egypt’s Nile River) where
     on water availability in the stream. Consequently,       indices useful in paleoclimatic studies are available on
     drought has been defined by the international me-        an operational basis.
     teorological community in general terms as a “pro-          Many quantitative measures of drought have been
     longed absence or marked deficiency of precipita-        developed in the United States, based on the sector
     tion,” a “deficiency of precipitation that results in    and location affected, the particular application, and
     water shortage for some activity or for some group,”     the degree of understanding of the phenomena. The
     or a “period of abnormally dry weather sufficiently      complex water balance model developed by W.
     prolonged for the lack of precipitation to cause a se-   Palmer in the mid-twentieth century was a turning
     rious hydrological imbalance” (World Meteorologi-        point in the evolution of drought indices. While an
     cal Organization 1992; American Meteorological           improvement over simple early twentieth-century
     Society 1997).                                           measures, the Palmer Index suffers from some inher-
        Some numerical standard is needed for compar-         ent weaknesses (these weaknesses will be discussed
     ing measures of drought from region to region, as well   later). Post-Palmer solutions include modern indices,
     as for comparing past drought events. However, the       such as the Surface Water Supply Index and the Stan-
     considerable disagreement that exists about the defi-    dardized Precipitation Index, and the Drought Moni-
     nition of drought makes it impossible to devise a uni-   tor. Table 1 gives an overview of the major twentieth-
     versal drought index. Furthermore, drought’s char-       century U.S. drought indices herein reviewed. By
     acteristics and the wide range of economic sectors on    focusing on the evolution of U.S. drought indices, this
     which it has an impact make its effects difficult to     paper provides insight into how our understanding
     quantify. Because of the complexity of drought, no       of drought has changed during the past hundred years.
     single index has been able to adequately capture the
     intensity and severity of drought and its potential      EARLY DROUGHT INDICES. Common to all
     impacts on such a diverse group of users.                types of drought is the fact that they originate from a
        The American Meteorological Society (1997) sug-       deficiency of precipitation that results in water short-
     gests that the time and space processes of supply and    age for some activity or for some group (Wilhite and
     demand are the two basic processes that should be        Glantz 1985). Reliable rainfall observations became
     included in an objective definition of drought and,      available about two centuries ago, and as a result,
     thus, in the derivation of a drought index. The World    practically all drought indices and drought definitions
     Meteorological Organization defines a drought index      included this variable either singly or in combination
     as “an index which is related to some of the cumula-     with other meteorological elements (World Meteo-
     tive effects of a prolonged and abnormal moisture        rological Organization 1975a).
     deficiency” (World Meteorological Organization              Early meteorological drought definitions incorpo-
     1992). Friedman (1957) identified four basic criteria    rated some measure of precipitation over a given pe-
     that any drought index should meet: 1) the timescale     riod of time (Tannehill 1947; World Meteorological
     should be appropriate to the problem at hand; 2) the     Organization 1975a; Wilhite and Glantz 1985). A
     index should be a quantitative measure of large-scale,   drought would exist if the criteria defining the
     long-continuing drought conditions; 3) the index         drought were met, and the index would then be a
     should be applicable to the problem being studied;       measure of the drought’s duration and/or intensity.
     and 4) a long accurate past record of the index should      Hydrological drought indices were based largely
     be available or computable. A fifth criteria should be   on streamflow, as this variable summarizes and is the
     added for indices used in operational drought moni-      by-product of essentially every hydrometeorological
     toring: 5) the index should be able to be computed       process taking place in watersheds and river basins.
     on a near-real-time basis. For example, indices that     In hydrologic studies involving the rate of flow in
     are useful for long-term paleoclimatic studies (e.g.,    streams, it is important to distinguish between the two
     indices based on glaciological and alluvial evidence,    components of total flow: direct runoff and base flow
     oceanic and lake sediments, tree-ring and pollen         (Linsley et al. 1958). Direct or surface runoff is water
     analysis, or proxy evidence such as historical docu-     that travels over the ground surface to a channel. It

1150 |      AUGUST 2002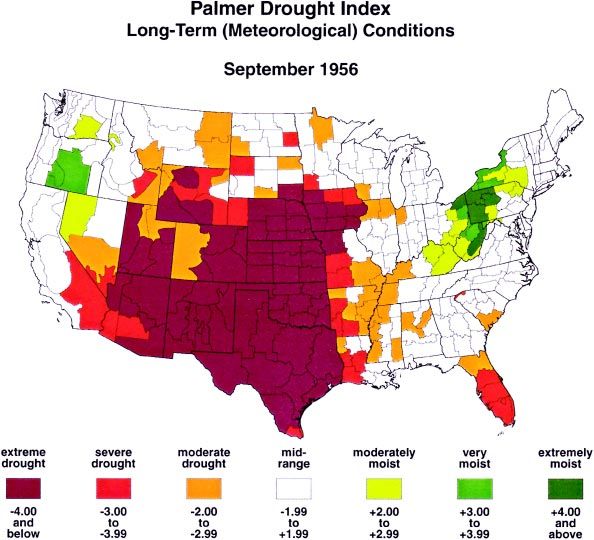
TABLE 1. Major drought indices discussed in this paper.

 Index                         Year introduced        Variables analyzed; application

 Munger’s Index                       1916            Length of period without 24-h precipitation of 1.27 mm;
                                                      daily measure of comparative forest fire risk

 Kincer’s Index                       1919            30 or more consecutive days with less than 6.35 mm
                                                      of precipitation in 24 h; seasonal distribution maps

 Marcovitch’s Index                   1930            Temperature and precipitation; climatic requirements
                                                      of the bean beetle

 Blumenstock’s Index                  1942            Length of drought in days, where drought terminated by
                                                      occurrence of 2.54 mm of precipitation in 48 h; short-term
                                                      drought

 Antecedent                           1954            Precipitation; a reverse drought index used for flood
 Precipitation Index                                  forecasting

 Moisture Adequacy Index              1957            Precipitation and soil moisture; agricultural drought

 Palmer’s Index                       1965            Precipitation and temperature analyzed in a water balance
 (PDSI and PHDI)                                      model; comparison of meteorological and hydrological
                                                      drought across space and time

 Crop Moisture Index                  1968            Precipitation and temperature analyzed in a water balance
                                                      model; agricultural drought

 Keetch–Byram                         1968            Precipitation and soil moisture analyzed in a water budget
 Drought Index                                        model; used by fire control managers

 Surface Water                        1981            Snowpack, reservoir storage, streamflow, and
 Supply Index                                         precipitation; computed primarily for western river basins;
                                                      statistical properties not well analyzed or understood

 Standardized                         1993            Precipitation; allows measurement of droughts and wet
 Precipitation Index                                  spells in terms of precipitation deficit, percent of
                                                      “normal,” probability of nonexceedance, and SPI at
                                                      multiple simultaneous timescales with potentially
                                                      different behavior at all of them

 Vegetation                           1995            Satellite AVHRR radiance (visible and near-IR); measures
 Condition Index                                      “health” of vegetation

 Drought Monitor                      1999            Integrates several drought indices and ancillary indicators
                                                      into a weekly operational drought-monitoring map
                                                      product; multipurpose

reaches the stream soon after its occurrence as rain-      data have relied on base flow measurements or the
fall and appears as the crest point in a hydrograph.       mean flow over some period (e.g., monthly or annual
Base flow results from the discharge of groundwater        flows) to average out the direct runoff crests (see, e.g.,
into the stream where the water table intersects the       Yevjevich 1967; Dracup et al. 1980; Frick et al. 1990).
stream channels of the basin. Base flow is also referred       During the first decade of the twentieth century,
to as groundwater flow and dry-weather flow (Linsley       the U.S. Weather Bureau identified drought as occur-
et al. 1958) and appears as the recession point on a       ring during any period of 21 or more days with rain-
hydrograph. Drought studies utilizing streamflow           fall 30% or more below normal for the period (Henry

AMERICAN METEOROLOGICAL SOCIETY                                                                AUGUST 2002          | 1151
1906; Steila 1987). A drought measure frequently used      sured, or could not be incorporated into a drought
     at that time was the accumulated precipitation defi-       index. For example, Abbe (1894) noted: “From an ag-
     cit, or the accumulated departure from normal. Other       ricultural point of view, a drought is not merely a
     examples of early criteria include the following:          deficiency of rainfall, but a deficiency of water avail-
                                                                able for the use of the growing crops. . . . Thus a
     1) 15 consecutive days with no rain,                       drought affecting agriculture is a complex result of
     2) 21 days or more with precipitation less than one-       many considerations. . . . Therefore, both from an
        third of normal,                                        agricultural and engineering point of view, it is im-
     3) annual precipitation that is less than 75% of           practicable [sic] to define the intensity of a drought
        normal,                                                 in general and exact terms.” In the U.S. Weather
     4) monthly precipitation that is less than 60% of          Bureau’s Bulletin Q: Climatology of the United States,
        normal, and                                             Henry (1906) concluded that, “In general, climato-
     5) any amount of rainfall less than 85% of normal.         logical statistics alone fail to give a sufficient accurate
                                                                conception either of the duration or intensity of [ag-
     As late as 1957, Friedman used annual rainfall as his      ricultural] drought. Supplementary observations
     drought index in a study of drought in Texas. Similar      upon the condition of vegetation in each locality are
     criteria have been employed in other countries:            especially needed.”
                                                                    During the first half of the twentieth century, scien-
     1) Britain: 15 consecutive days with less than             tists focused their efforts on addressing these inadequa-
        0.25 mm (0.01 in.) [or 1.0 mm (0.04 in.)];              cies, as well as continuing to develop drought indices
     2) India: rainfall half of normal or less for a week, or   relevant to the specific application being considered.
        actual seasonal rainfall deficient by more than             Munger (1916) developed an objective measure of
        twice the mean deviation;                               the comparative forest fire risk from year to year and
     3) Russia: 10 days with total rainfall not exceeding       region to region. After determining that the frequency
        5 mm (0.20 in.);                                        of soaking rains is the factor with the greatest influ-
     4) Bali: a period of 6 days without rain; and              ence on the fire hazard in the Pacific Northwest,
     5) Libya: annual rainfall that is less
        than 180 mm (7 in.).

        Most of these definitions/indices
     were valid only for their specific ap-
     plication in their specific region. In-
     dices developed for one region may
     not be applicable in other regions
     because the meteorological condi-
     tions that result in drought are highly
     variable around the world. Indices
     developed to measure the intensity of
     meteorological drought, for instance,
     were inadequate for agricultural, hy-
     drological, or other applications.
        These deficiencies were recog-
     nized early (see, e.g., Abbe 1894;
     Henry 1906). The problems with de-
     veloping an agricultural drought in-
     dex, for example, include consider-        FIG. 1. Comparison of daily precipitation amount, three daily drought
     ation of vegetation, soil type (which      indices (the Blumenstock and Munger Indices and the API), and the
     determines soil moisture capacity),        monthly Palmer Z Index for east-central Iowa for 1 Jan–31 Dec 1956.
                                                Both the Blumenstock (1942) and Munger (1916) Indices are based
     antecedent soil moisture, and evapo-
                                                on the length of the drought (in days), while the API (McQuigg 1954;
     transpiration as influenced by wind        Waggoner and O’Connell 1956) incorporated both the amount and
     speed and the temperature and hu-          timing of precipitation for flood forecasting and is, thus, a reverse
     midity of the air. Many of these cli-      drought index. These three indices are best suited for use on a short
     matic elements were not widely mea-        (daily to multimonthly) timescale.

1152 |      AUGUST 2002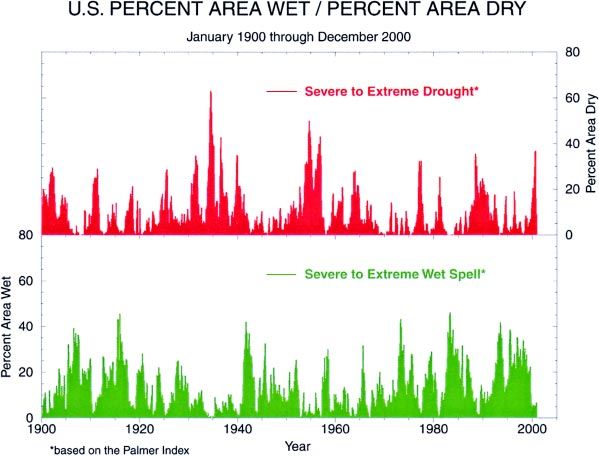
various intensities, in the contiguous
                                                                               United States. Included were maps
                                                                               showing the frequency of subnormal
                                                                               precipitation (i.e., droughts) for the
                                                                               United States east of the Rockies for
                                                                               the warm season (March–Septem-
                                                                               ber). Kincer defined a drought as 30
                                                                               or more consecutive days with less
                                                                               than 6.35 mm (0.25 in.) of precipi-
                                                                               tation in 24 h.
                                                                                   In a study of the climatic require-
                                                                               ments of the bean beetle in the east-
                                                                               ern United States, Marcovitch (1930)
                                                                               devised an equation incorporating
                                                                               both temperature and precipitation
                                                                               to compute a drought index:

                                                                                   drought index = ½(N/R)2,

FIG. 2. Comparison of two daily drought indices (the Munger Index
                                                                                where N is the total number of two
and the API), the summer Marcovitch Index, monthly percent of
                                                                                or more consecutive days above
normal precipitation, and two monthly Palmer indices (the Z Index
and the PDSI) for east-central Iowa for 1 Jan 1955–31 Dec 1959. The             32.2°C (90°F), and R is the total sum-
computational method and purpose can result in quite disparate in-              mer rainfall for the same months.
dices, as seen in this figure. The Munger (1916) Index is based on              The Marcovitch Index, illustrated
the length of the drought (in days), the API (McQuigg 1954;                     in Figs. 2 and 3, is a seasonal index
Waggoner and O’Connell 1956) incorporated both the amount and                   best used in retrospective studies.
timing of precipitation for flood forecasting, and the Marcovitch                  Blumenstock (1942) applied
(1930) Index incorporated temperature and precipitation into a sea-
                                                                                probability theory to compute
sonal index. The Palmer (1965) indices, computed on a monthly
timescale here, are based on a water budget soil model and show                 drought frequencies in a climatic
short-term (Z Index) and cumulative long-term (PDSI) drought and                study. For his index, he used the
wet spell conditions.                                                           length of the drought in days, where
                                                                                a drought was considered terminated
                                                                                by the occurrence of at least 2.54 mm
    Munger used, as his drought index, the number of          (0.10 in.) of precipitation in 48 h or less. The
    consecutive days where 24-h rainfall is less than         Blumenstock Index is compared to several other in-
    1.27 mm (0.05 in.). He noted that the parching effect     dices in Fig. 1. Both Blumenstock’s and Munger’s in-
    of droughts on forest vegetation is not directly pro-     dices are best used to measure short-term drought.
    portional to their length. He assumed that the inten-         Efforts to measure depletion of soil moisture fo-
    sity of droughts increases as the square of their dura-   cused on evaporation, and measurement of the
    tion. Munger devised a graphical technique to             amount of moisture used by plants focused on tran-
    represent the intensity of the drought (Figs. 1 and 2;    spiration. According to Thornthwaite (1931), evapo-
    cf. Munger’s Index to several other indices). The tech-   ration and transpiration [or collectively, evapotrans-
    nique used the area of a right triangle, whose height     piration (ET)] depend on solar radiation, wind speed,
    and base were both proportional to the duration of        humidity, nature of vegetation, and condition of the
    the drought. Expressed mathematically,                    soil, with solar radiation being the dominant factor.
                                                              However, since direct measurements of solar radia-
                 severity of drought = ½ L2,                  tion are not generally available, it was found that the
                                                              mean daily temperature, latitude, and the time of year
    where L is the length of the drought in days.             could be used to approximate the amount of water loss
       Kincer (1919) prepared, for the first time, a series   to the atmosphere by evaporation when it is assumed
    of much needed maps and charts showing the seasonal       that there is an adequate supply of moisture in the soil
    distribution of precipitation, and climatologies of the   for the vegetation at all times. This measure is called
    average annual number of days with precipitation of       potential evapotranspiration (PE). The difference be-

    AMERICAN METEOROLOGICAL SOCIETY                                                              AUGUST 2002         | 1153
feature in the sense that, considered in
the context of variability, it is experi-
enced only when precipitation falls
appreciably below normal. Aridity is,
by definition, restricted to regions of
low precipitation, and usually of high
temperature, whereas drought is pos-
sible in virtually any precipitation or
temperature regime. With this distinc-
tion in mind, Thornthwaite’s two in-
dices discussed above are better clas-
sified as climatological aridity indices
rather than drought indices.
Thornthwaite’s work prompted
van Bavel and Verlinden (1956) to
develop the concept of an agricultural
drought day, a period of 1 day during
which a drought condition exists (i.e.,
a day on which the available soil
FIG. 3. Comparison of the summer Marcovitch Index and its compo-
moisture is zero). They estimated soil
nents to two monthly Palmer indices (the Z Index and the PDSI) for moisture conditions using daily pre-
east-central Iowa for 1 Jan 1951–31 Dec 1970. The Marcovitch (1930) cipitation and evapotranspiration
Index was derived to determine the climatic requirements of the bean (computed using Penman’s formula,
beetle in the eastern United States and incorporated temperature which incorporated solar radiation,
and precipitation into a seasonal index. This index captures the mid- sunshine duration, air temperature,
1950s drought in this part of the Midwest well, but the temperature relative humidity, and wind speed).
component dominates and its scale and temporal frequency make it
Dickson (1958) used the drought-day
less suited for operational drought monitoring than the Palmer (1965)
indices. concept, but experimented with a dif-
ferent way of computing evapotrans-
piration (i.e., making it proportional
tween actual and potential evapotranspiration de- to the total moisture content of the soil). His meth-
pends on the availability of moisture in the soil. If odology resulted in a computed agricultural drought-
adequate soil moisture is available, actual evapotrans- day quantity that was considerably less (by up to 55%)
piration equals potential evapotranspiration; other- than the method used by van Bavel and Verlinden.
wise, it is less. McQuigg (1954) and Waggoner and O’Connell
With this foundation, Thornthwaite (1931) devel- (1956) incorporated both the amount and timing of
oped the precipitation effectiveness index, which is the precipitation in their Antecedent Precipitation Index
sum of the 12 monthly precipitation effectiveness ra- (API). Originally designed to estimate soil moisture
tios, where the monthly effectiveness ratio is the content for use in flood forecasting, the API was com-
monthly precipitation divided by the monthly evapo- puted on a daily basis by multiplying the index for the
ration. Thornthwaite (1948) also proposed using pre- previous day by a factor, usually 0.90. If rain occurred
cipitation minus evapotranspiration as a drought index. on a day, the amount of rainfall observed was added
It should be pointed out that Thornthwaite’s work to the index (see Figs. 1 and 2). Snowfall was included
furthered the development of drought indices, but he, on the day it melted. They obtained good results for
along with Köppen and others, also did much to lay the eastern and central United States. Iowa corn yields
the groundwork for the modern climate classification were poor when the API dropped below 0.10 and in
system. As noted by the World Meteorological Or- the wet years when it failed to go below 0.50 during
ganization (1975a), a distinction should be made be- mid-May to mid-August.
tween drought and aridity. Aridity is usually defined A drought index for corn—the “moisture stress
in terms of low-average precipitation, available wa- day”—was developed in the 1960s (World Meteoro-
ter, or humidity and, setting aside the possibility of logical Organization 1975a). Calculation of the mois-
climatic change, is a permanent climatic feature of a ture stress day was based on PE and available soil
region. Drought, on the other hand, is a temporary water capacity. A moisture stress day (i.e., corn plants
1154 | AUGUST 2002lost turgor) occurred if 1) PE exceeded 6.4 mm field capacity and transfer of moisture to and from the
(0.25 in.) day−1 when soil water was below 85% of layers. These assumptions include the following: the
available capacity, or 2) PE exceeded 5.1 mm (0.20 in.) top soil layer (“plough layer”) has a field capacity of
day−1 when soil water was below 50% of capacity, or 1 in. (2.54 cm), moisture is not transferred to the bot-
3) PE exceeded 1.3 mm (0.5 in.) day−1 when soil wa- tom layer (“root zone”) until the top layer is saturated,
ter was less than 10% of available capacity. runoff does not occur until both soil layers are satu-
Meanwhile, Thornthwaite and others developed rated, and all of the precipitation occurring in a
the water budget accounting method to keep track of month is utilized during that month to meet evapo-
soil moisture. Various assumptions were made about transpiration and soil moisture demand or be lost as
soil moisture field capacity, and monthly values of runoff. Palmer applied what he called Climatologi-
precipitation and potential evapotranspiration were cally Appropriate for Existing Conditions (CAFEC)
used. They emphasized the need to base the determi- quantities to normalize his computations so he could
nation of drought severity on a comparison of water compare the dimensionless index across space and
need with water supply in individual years. “We can- time. This procedure enables the index to measure
not define drought only as a shortage of rainfall,” they abnormal wetness (positive values) as well as dryness
said, “because such a definition would fail to take into (negative values), with persistently normal precipita-
account the amount of water needed. Furthermore, tion and temperature theoretically resulting in an in-
the effect of a shortage of rainfall depends on whether dex of zero in all seasons in all climates. The term
the soil is moist or dry at the beginning of the period. “Palmer Index” refers collectively to three indices that
[Agricultural] drought does not begin when rain have come to be known as the PDSI, PHDI, and the
ceases but rather only when plant roots can no longer Z Index.
obtain moisture in needed amounts” (Thornthwaite The computation of Palmer’s indices consists of the
and Mather 1955). following steps:
One attempt to address these needs was the idea
of “moisture adequacy.” This index, developed by 1) Carry out a monthly hydrologic accounting for a
McGuire and Palmer (1957) as an outgrowth from the long series of years using five parameters: precipi-
concept of potential evapotranspiration, compared a tation, evapotranspiration, soil moisture loss and
location’s moisture need to the actual moisture sup- recharge, and runoff. Potential and actual values
ply (rainfall plus available soil moisture). The mois- are computed for the last four. Palmer used
ture adequacy index is expressed as a percentage ra- monthly averages, but other timescales (such as
tio of the actual moisture supply to the moisture need, weeks or days) can be used as well. Means of the
where 100% indicates the supply is sufficient to meet potential and actual values for these parameters
the need. They plotted a map of these index values to are computed over a calibration period that is
show the general spatial pattern of drought during usually, but not necessarily, the data period of
1957 in the eastern United States. record.
As seen above, drought identification and evalua- 2) Summarize the results to obtain coefficients (of
tion procedures slowly evolved during the first half evapotranspiration, recharge, runoff, and loss)
of the twentieth century from simplistic approaches that are dependent on the climate of the location
that considered the phenomenon to be a rainfall de- being analyzed. These coefficients are computed
ficiency, to problem-specific models of limited appli- by dividing the mean actual quantity by the mean
cability. The stage was set for the development of a potential quantity.
more sophisticated technique to quantitatively ap- 3) Reanalyze the series using the derived coefficients
praise what Steila (1987) termed the total environ- to determine the amount of moisture required for
mental moisture status. “normal” weather during each month. These nor-
mal, or CAFEC, quantities are computed for each
PALMER’S DROUGHT INDEX. In 1965, of the parameters listed in step 1).
W. Palmer published his model for a drought index 4) Compute the precipitation departure (precipita-
that incorporated antecedent precipitation, moisture tion minus CAFEC precipitation) for each month,
supply, and moisture demand (based on the pioneer- then convert the departures to indices of moisture
ing evapotranspiration work by Thornthwaite) into anomaly. This moisture anomaly index has come
a hydrologic accounting system (Palmer 1965). He to be known as the Palmer Z Index and reflects
used a two-layered model for soil moisture compu- the departure of the weather of a particular month
tations and made certain assumptions concerning from the average moisture climate for that month,
AMERICAN METEOROLOGICAL SOCIETY AUGUST 2002 | 1155regardless of what has occurred in prior or sub- 100%. During the period of “uncertainty” when an
sequent months. existing drought (or wet spell) may or may not be over
5) Analyze the index series to determine the beginning, (i.e., when the probability is greater than zero but less
ending, and severity of the drought periods. In than 100%), the model computes index values for an
Palmer’s computations, the drought severity for a incipient wet spell (X1), an incipient drought (X2),
month depends on the moisture anomaly for that and the existing spell (X3). The X3 term can refer to
month and on the drought severity for the previ- either an established drought or wet spell. The model
ous and subsequent months. His methodology in- selects one of these terms (X1, X2, or X3) for the PDSI
volves computing, for each month, three interme- in a backstepping procedure, with the term selected
diate indices (X1, X2, and X3) and a probability depending on the probability that the established spell
factor, which are explained below. is over (e.g., X1 is chosen for the PSDI if the prob-
ability indicates the existing drought has ended, X2
There is a lag between the time that the drought- is chosen if the existing wet spell has ended, and X3
inducing meteorological conditions end and the en- is chosen if the probability does not reach 100%). The
vironment recovers from a drought. Palmer made this value of the “established spell” (X3) term changes
distinction by computing a meteorological drought more slowly than the values of the “incipient” (X1 and
index and a hydrological drought index. In his effort X2) terms. The X3 term is the index for the long-term
to create the meteorological drought index [which has hydrologic moisture conditions and has come to be
come to be known as the Palmer Drought Severity known as the Palmer Hydrological Drought Index
Index, (PDSI)], Palmer expressed the beginning and (PHDI).
ending of drought (or wet) periods in terms of the This backstepping procedure of ending droughts
probability that the spell has started or ended. A or wet spells cannot be satisfactorily used for real-time
drought or wet spell is definitely over when this prob- calculations of PDSIs (i.e., operational PDSIs) since
ability reaches or exceeds 100%, but the drought or one cannot know in advance whether a few months
wet spell is considered to have ended the first month of wet or dry weather are the beginning of a new spell
when the probability became greater than 0% and of wet or dry weather or merely a temporary inter-
then continued to remain above 0% until it reached ruption of the current drought or wet spell (Karl
1986). The National Weather Service
(NWS) incorporated the probability
factor in a modification of the PDSI
in the 1990s (Heddinghaus and Sabol
1991). The NWS modification (re-
ferred to here as the PMDI or sim-
ply PDI) allows computation of the
PDSI operationally by taking the
sum of the wet and dry terms after
they have been weighted by their
probabilities (P and 100% −P, where
P = the probability that the spell is
over).
At the time of its introduction,
Palmer’s procedure was hailed as
“the most satisfactory solution to the
problem of combining precipitation
and temperature as predictor vari-
ables” (Julian and Fritts 1968). The
Palmer Index became widely used in
the United States and has been ap-
plied to other areas of the world
(World Meteorological Organiza-
FIG. 4. The Palmer Z Index for Aug 2000, illustrating the extremely tion 1975a; Kogan 1995; Hu and
dry conditions that occurred during that month from the southeast Willson 2000). As part of a PHDI
and southern plains to the northwestern United States. study to aid planners during recov-
1156 | AUGUST 2002ery from severe droughts, Karl et al.
(1986, 1987) computed the precipi-
tation required to end or ameliorate
an existing drought, and the clima-
tological probability of receiving at
least this required amount of precipi-
tation, for the 344 climate divisions
of the contiguous United States.
Figures 1–7 illustrate how Palmer’s
indices can be used to compare
droughts through time and space,
and how his indices compare to
other drought indices.
The Palmer Index was a land-
mark in the development of drought
indices. However, it is not without
limitations. The index was specifi-
cally designed to treat the drought
problem in semiarid and dry
subhumid climates where local pre-
cipitation is the sole or primary
source of moisture (Doesken et al.
FIG. 5. The PMDI showing the cumulative long-term drought condi-
1991). Palmer himself cautioned that
tions for Sep 1956. During this month just under 40% of the contigu-
extrapolation beyond these condi- ous United States experienced severe to extreme drought.
tions may lead to unrealistic results
(Palmer 1965; Guttman 1991). During
the last 30 years, several scientists have evaluated the ous United States (Alley 1984; Guttman et al. 1992;
model as applied under different climate regimes and Guttman 1997) nor directly comparable between
have expressed concerns with some of the model’s as- months (Alley 1984). Concern was raised about the
sumptions. These concerns fall into two broad catego- abrupt transition between wet and dry spells that re-
ries: the use of water balance models in general, and sults from the backstepping procedure and switching
Palmer’s model in particular. among the X1, X2, and X3 in the assignment of the
Alley (1984) expressed concerns regarding how PDSI values. This methodology may result in asym-
water balance models treat potential evapotranspira-
tion, soil moisture, runoff, distribution of precipita-
tion, and evapotranspiration within a month or week, TABLE 2. Palmer drought index categories (from
Palmer 1965).
and how they fail to consider seasonal or annual
changes in vegetation cover and root development.
Moisture category PDSI
His evaluation was also critical of the Palmer model
for failing to incorporate a lag to account for the de- Extremely wet ≥ 4.00
lay between the generation of excess water and its ap-
Very wet 3.00 to 3.99
pearance as runoff, and for making no allowance for
the effect of snowmelt or frozen ground. He was also Moderately wet 2.00 to 2.99
concerned about the arbitrary designation of the Slightly wet 1.00 to 1.99
drought severity classes (see Table 2) and the transi- Incipient wet spell 0.50 to 0.99
tion index values indicating an end to an established Near normal 0.49 to – 0.49
drought or wet spell.
Incipient drought – 0.50 to – 0.99
Palmer tried to normalize his index so it could be
comparable between different locations and seasons. Mild drought –1.00 to –1.99
However, because the weighting factor Palmer used Moderate drought –2.00 to –2.99
was based on results from only nine climatic divisions Severe drought –3.00 to –3.99
and on data aggregated on the annual level, his index, Extreme drought ≤ – 4.00
in fact, is not spatially comparable across the contigu-
AMERICAN METEOROLOGICAL SOCIETY AUGUST 2002 | 1157Sensitivity studies have found that
the value of the PDSI is highly de-
pendent on 1) the weighting factor
used to make it comparable between
different months and regions, 2) the
value specified for the available wa-
ter capacity in the soil (Karl 1983), as
well as 3) the calibration period used
to compute the CAFEC quantities
(Karl 1986), with longer calibration
periods providing more consistent
estimates of the CAFEC quantities
and index values. If the calibration
period is changed, the Palmer indi-
ces for the entire period of record
should be recomputed to maintain
consistency through time. For com-
parative spatial studies, the same cali-
FIG. 6. The percent area of the contiguous United States experienc- bration period should be used for all
ing monthly (top) severe to extreme long-term drought and (bottom) locations. Guttman (1991) found
severe to extreme long-term wet conditions during the twentieth cen- that 1) the period of time required
tury, based on the PMDI. The major (national scale) drought episodes for the PHDI to reflect actual rather
stand out, with drought reaching its greatest extent during the “dust than artificial initial conditions could
bowl” years of the 1930s. At its peak, drought covered 63% of the
be more than 4 yr, and 2) the effects
nation during Jul 1934, with a secondary peak of about 43% during
Aug 1936. The 1950s was another decade of drought, peaking at about of temperature anomalies are insig-
50% in Sep 1954 and 43% in Dec 1956. While significant droughts oc- nificant compared to the effects of
curred in the 1980s and 1990s, severe to extreme wet spells were precipitation anomalies. However, in
more prevalent. Similar time series could be created for other com- a study of the PDSI over the central
binations of wet and dry Palmer categories. United States, Hu and Willson
(2000) determined that the PDSI can
metrical and bimodal statistical distributions of the be equally affected by temperature and precipitation
PDSI (and possibly the PHDI) index values (Alley when both have similar magnitudes of anomalies, and
1984; Guttman 1991). reconstructions of PDSI based solely on precipitation
FIG. 7. Comparison of two monthly
Palmer indices (the Z Index and
the PDSI) to several SPI products
for east-central Iowa for 1 Jan
1951–31 Dec 1970. Both the
1-month SPI and the Palmer
Z Index measure short-term (i.e.,
monthly) drought. The 9-month
SPI corresponds approximately to
the PDSI. The versatility of the SPI
is illustrated here by its ability to
chart longer-scale drought (24-
month SPI) and to put precipita-
tion deficits into a probabilistic per-
spective. The utility of the particu-
lar index used depends on the ap-
plication and what the user is try-
ing to show. One cannot make a
blanket statement that a particu-
lar index is better, overall, than an-
other index.
1158 | AUGUST 2002could lead to ambiguous conclusions about past cli- Drought Index (DI) is expressed in hundredths of an
matic variations. inch of soil moisture depletion, ranging from 0 (no
Since its inception, the Palmer Index has become moisture deficiency) to 800 (absolute drought).
widely used by a variety of people (hydrologists, for- Computation of the DI is based on a daily water-
esters, field meteorologists, economists, policy deci- budgeting procedure whereby the drought factor is
sion makers, news media, private consultants, and re- balanced with precipitation and soil moisture. The
searchers) as a tool to monitor and assess long-term Keetch–Byram Drought Index (KBDI) has become
meteorological drought and wet spell conditions. As widely used in wildfire monitoring and prediction.
pointed out by the National Drought Mitigation Cen- Much of the work in developing drought indices
ter (see online at http://enso.unl.edu/ndmc/) and has focused on meteorological or agricultural appli-
Willeke et al. (1994), it is most effective when applied cations. As noted by Dracup et al. (1980), hydrologic
to the measurement of impacts sensitive to soil mois- study of droughts in terms of duration, magnitude
ture conditions, such as in agriculture, and it has also (average deficit), and severity (total deficit) was
been used to start or end drought response actions. greatly neglected during the first half of the twenti-
Three years after the introduction of his drought eth century, with much of the research limited to spe-
index, Palmer (1968) introduced a new drought in- cific basins or particular historical droughts. They
dex based on weekly mean temperature and precipi- identified some notable exceptions, however, includ-
tation, as an outgrowth of his PDSI work. This Crop ing Huff and Changnon (1964), who developed a
Moisture Index (CMI) was specifically designed as an method of estimating drought streamflow frequency
agricultural drought index and depends on the by using low-precipitation frequency and a single
drought severity at the beginning of the week and the geomorphic index; Whipple (1966), who applied the
evapotranspiration deficit or soil moisture recharge station–year method of regional frequency analysis to
during the week. It measures both evapotranspiration multiyear hydrologic droughts; and Yevjevich (1967),
deficits (drought) and excessive wetness (precipita- who applied the statistical theory of runs to the analy-
tion is more than enough to meet evapotranspiration sis of drought events. Yevjevich (1967) noted that con-
demand and recharge the soil). The CMI has been tinental-scale hydrologic droughts should be de-
adopted by the U.S. Department of Agriculture and scribed by their duration, areal extent, severity
is published in its Weekly Weather and Crop Bulletin (intensity), probability of recurrence, and initiation
as an indicator of the availability of moisture to meet or termination (i.e., their location in time). Dracup
short-term crop needs (Wilhite and Glantz 1985). The et al. (1980) utilized long-term mean annual stream-
CMI is most effective measuring agricultural drought flow (which they also referred to as runoff) to develop
during the warm season (i.e., growing season). a stochastic model for generating hydrologic drought
events and performing regional drought frequency
THE POST-PALMER ERA. In the decades since analysis. They expanded upon Yevjevich’s (1967)
Palmer introduced the PDSI, PHDI, and Z Index, sev- theory of runs by defining a drought event as consist-
eral other drought indices have been developed and ing of consecutive years for which the mean annual
adopted, but none has proven superior enough to streamflow was below the long-term mean, and char-
relegate Palmer’s Index to the dusty annals of history. acterized each drought event with the following three
Some of these indices applied old concepts to new ap- attributes: duration (the number of consecutive years
plications, while others addressed inadequacies in the for which the annual streamflow is below the long-
Palmer model. term mean), severity (the cumulative deficit of
Shear and Steila (1974) and Steila (1987) proposed streamflow for that duration), and magnitude (the
an approach of using water budget analysis to iden- average deficit of streamflow for that duration). They
tify moisture anomalies. Their procedure, like used the ratio, R/P, where R is mean annual runoff and
Palmer’s, accounts for precipitation, potential evapo- P is annual precipitation, to investigate the nonsta-
transpiration, and soil moisture, but yields moisture tionarity of the streamflow records, but also noted that
status departure values that are expressed in the same this runoff coefficient can be viewed as a nonlinear
units as precipitation; that is, they are spatially appli- scaling function where R/P is higher than average for
cable water depth measures having equivalent meteo- high-flow (or high precipitation) years and lower than
rological significance in diverse climatic realms. average for drought (or low precipitation) years. Ad-
Keetch and Byram (1968) developed an index of ditional references discussing the application of runs
drought for use by fire control managers. Based on a theory to drought indices can be found in Frick et al.
203-mm (8 in.) soil moisture storage capacity, the (1990).
AMERICAN METEOROLOGICAL SOCIETY AUGUST 2002 | 1159The Surface Water Supply Index (SWSI), an em- subsequently pointed out that return period tech-
pirical hydrologic drought index developed for Colo- niques utilized for floods and other high-flow events
rado in 1981, was designed to complement the PDSI may not be applicable to drought events. They sug-
by integrating snowpack, reservoir storage, stream- gested that representing data dependence with a
flow, and precipitation at high elevation as a measure simple Markov chain be utilized in analyzing runs of
of surface water status (Wilhite and
Glantz 1985; Doesken et al. 1991;
Garen 1993). The SWSI has a simi-
lar scale, and both the SWSI and
PDSI are used together to trigger
Colorado’s Drought Assessment and
Response Plan. The SWSI has been
modified and adopted by other west-
ern states and is computed primarily
for river basins. While noting that
the index is very useful in assessing
(and predicting) the surface water
supply status, Doesken et al. (1991)
and Doesken and Garen (1991) ex-
pressed several concerns about the
SWSI, including the following: there
is a lack of consensus over the defi-
nition of surface water supply; the
factor weights vary from state to state
and, in some cases, from month to
month, resulting in SWSIs with dif-
fering statistical properties; and the
hydroclimatic differences that char-
acterize river basins in the western FIG. 8. The 3-month SPI for July–Aug–Sep 2000, illustrating the ex-
tremely dry conditions that occurred during that period from the
United States result in SWSIs that do
southeast and southern plains to the southwestern United States. The
not have the same meaning and sig- SPI values can be likened to a comparison of the standard deviation
nificance in all areas and at all times. of precipitation from location to location.
The effect of changing water de-
mand on the severity of drought was
illustrated by Frick et al. (1990) in a study of the im- independent and dependent events. They illustrated
pact of prolonged droughts on the water supplies of their technique in a companion paper (Fernandez
the city of Fort Collins, Colorado. Increased popu- and Salas 1999b) by using annual precipitation, mini-
lation and industrial development result in a greater mum streamflows, and annual streamflows as
demand for water, which implies an increasing vul- drought indices.
nerability of present water resource systems to the oc- McKee et al. (1993) developed the Standardized
currence of drought, and which suggests a broader, Precipitation Index (SPI) as an alternative to the
more severe impact of drought when it does occur. Palmer Index for Colorado. Historical data are used
Frick et al. (1990) analyzed annual streamflow data, to compute the probability distribution of the
adjusted from upstream diversions, imports, and monthly and seasonal (the past 2 months, 3 months,
changes in reservoir storage, and defined drought as etc., up to 48 months) observed precipitation totals,
a sustained period of low precipitation (rainfall and and then the probabilities are normalized using the
snow) such that the water available from the Poudre inverse normal (Gaussian) function. Guttman (1999)
River (the water source for Fort Collins) and im- determined that the Pearson Type III distribution is
ported waters will not meet the needs of water users the “best” universal model for computing the prob-
in the basin. They included a frequency analysis by ability distribution. The SPI methodology allows
determining droughts corresponding to 20-, 50-, expression of droughts (and wet spells) in terms of
100-, and 500-yr return periods using modeled an- precipitation deficit, percent of normal, and prob-
nual streamflow data. Fernandez and Salas (1999a) ability of nonexceedance as well as the SPI (see
1160 | AUGUST 2002Fig. 7). Like the PDI, the SPI is a dimensionless in- 3) site elevation (these first three variables describe
dex where negative values indicate drought; positive the geographical location),
values, wet conditions. Drought intensity, magni- 4) mean annual precipitation amount,
tude, and duration can be determined, as well as the 5) the ratio of the mean precipitation for the two
historical data-based probability of emerging from a consecutive months with the lowest mean amount
specific drought. The different timescales (seasons) in the year to that for the two consecutive months
for which the index is computed address the various with the highest mean amount,
types of drought: the shorter seasons for agricultural 6) the beginning month of two consecutive months
and meteorological drought (see Fig. 8, cf. to the map with the highest mean amount in the year, and
of Palmer’s Z Index in Fig. 4), the longer seasons for 7) the beginning month of two consecutive months
hydrological drought, etc. Although developed for with the lowest mean amount in the year (these
use in Colorado, the SPI can be applied universally latter three variables describe the average variabil-
to any location. ity of the annual cycle of precipitation).
A spectral analysis (Guttman 1997) comparing
historical time series of the PDI with time series of the The climatic water budget (Leathers and Robinson
corresponding SPI revealed that the spectral charac- 1995; Leathers 1997) was utilized for operational
teristics of the PDI are spatially variant while those drought monitoring in the northeastern United
of the SPI are spatially invariant. The PDI spectra States. It is based on the climatic water budget meth-
conform to what is expected for an autoregressive odology developed by Thornthwaite and Mather to
process, which is characteristic of an index with monitor values of soil moisture surplus, soil moisture
memory, while the SPI spectra conform to what is deficit, and runoff on a monthly temporal scale.
expected for a moving average process. Cross spec- NOAA has applied satellite-based technology to
tra between the PDI and SPI indicate that the the real-time monitoring of drought. The vegetation
12-month SPI oscillations are most nearly in phase condition index (VCI), computed from satellite Ad-
with those in the PDI. Guttman (1997) concluded that vanced Very High Resolution Radiometer (AVHRR)
the SPI is better able to show how drought in one re- radiance (visible and near infrared) data and adjusted
gion compares to drought in another region. for land climate, ecology, and weather conditions,
A new drought atlas was prepared in the 1990s in showed promise when used for drought detection and
a joint effort between the National Oceanic and At- tracking (Kogan 1995). The VCI utilizes the close
mospheric Administration’s (NOAA) National Cli- dependence of vegetation on climate, which harks
matic Data Center, the U.S. Army Corps of Engineers, back to the principles that guided German biologist
the U.S. Geologic Survey, and the IBM Thomas J. W. Köppen in his development of a vegetation-based
Watson Research Center (Guttman et al. 1991; climate classification system some 90 years earlier.
Willeke et al. 1994; Teqnical Services 1997). Drought The VCI allows detection of drought and (is a poten-
was depicted in this national atlas in terms of tially global standard for) measurement of the time
streamflow, soil moisture (the PMDI was used as a of its onset and its intensity, duration, and impact on
proxy), and precipitation probabilities (Guttman et vegetation. However, since the VCI is based on veg-
al. 1991). For durations of 1, 2, 3, 6, 12, 24, 36, and etation, it is primarily useful during the summer
60 months, beginning in each calendar month growing season. It has limited utility during the cold
January–December, regional precipitation quantile season when vegetation is largely dormant.
values for probabilities of 0.02, 0.05, 0.10, 0.20, 0.50, New drought indices have been developed by re-
0.80, 0.90, 0.95, and 0.98 were calculated using searchers in other countries for applications and lo-
L-moment methodology (Guttman 1993; Guttman cales where the Palmer Index proved inadequate.
et al. 1993). Data from 1119 stations from the National Dependable rains (DR), defined as the amount of
Climatic Data Center’s U.S. Historical Climatology rainfall that occurs statistically in four out of every five
Network (Easterling et al. 1996) were analyzed to years, have been applied by Le Houorou et al. (1993)
generate these statistics for 111 regions. The regions to the African continent. The National Rainfall Index
were identified by analyzing the “precipitation cli- (RI), used by Gommes and Petrassi (1994) in another
mate” of each station. The following seven variables study of precipitation patterns in Africa, allows com-
described this precipitation climate (Guttman 1993): parison of precipitation patterns across time and from
country to country. The RI is a national-scale index,
1) site latitude, computed by weighting the national annual precipi-
2) site longitude, tation by the long-term averages of all of the stations
AMERICAN METEOROLOGICAL SOCIETY AUGUST 2002 | 1161reported crop status, and direct in situ soil moisture
TABLE 3. The Drought Monitor categories
measurements. Some of these ancillary indicators are
(adapted from Svoboda 2000).
available in a delayed mode or only on a local/regional
Drought Monitor basis.
category Description The key parameters are objectively scaled to five
DM drought categories (these categories and their la-
D0 Abnormally dry bels are listed in Table 3). The classification scheme
D1 Moderate drought includes the categories D0 (abnormally dry area) to
D4 (exceptional drought event, likened to a drought
D2 Severe drought
of record) and labels indicating which sectors are be-
D3 Extreme drought ing impacted by drought (A for agricultural impacts,
D4 Exceptional drought W for hydrological impacts, and F to indicate the high
risk of wildfires). The DM maps are based on many
objective inputs, but the final maps are adjusted
within the nation. The Australian Drought Watch manually to reflect real-world conditions as reported
System is based on consecutive months (at least three) by numerous experts throughout the country
with precipitation below a certain decile threshold, (Svoboda 2000). Consequently, the DM is a consen-
where the deciles are determined from the cumulative sus product reflecting the collective best judgement
frequency of the distribution of ranked monthly and of many experts based on several indicators.
annual precipitation totals (Wilhite and Glantz 1985). The DM draws its strength from the collaborative
There are several extensive reference lists (Fried- input at the federal (USDA, NOAA), regional (NOAA
man 1957; Palmer and Denny 1971; World Meteo- Regional Climate Centers), state, and local levels and
rological Organization 1975a,b, 1985; Hasemeier from the objective synthesis of several drought-related
1977; Wilhite and Hoffman 1980; Wilhite and Wood indices. A limitation of the DM lies in its attempt to
1983; NOAA 1989) that the reader may consult about show drought at several temporal scales (from short-
drought and other (similar) drought indices that were term drought to long-term drought) on one map
not discussed in this review paper. Additional refer- product. The intent of the DM is not to replace any
ences for indices that were developed for regional local or state information or subsequently declared
studies can be found in Frick et al. (1990). drought emergencies or warnings, but rather to pro-
vide a general assessment of the current state of
THE DROUGHT MONITOR. As the twentieth drought around the United States, Pacific possessions,
century drew to a close, a new drought monitoring and Puerto Rico (Svoboda 2000). The DM is currently
tool was developed in a federal–state collaborative ef- distributed via the Internet (http://enso.unl.edu/moni-
fort to consolidate and centralize drought monitor- tor/monitor.html).
ing activities. Agencies within NOAA and the U.S.
Department of Agricultural (USDA) teamed with the SUMMARY AND CONCLUSIONS. The moni-
National Drought Mitigation Center to produce a toring and analysis of drought have long suffered from
weekly Drought Monitor (DM) product that incor- the lack of an adequate definition of the phenomenon
porates climatic data and professional input from all due to its complex nature and widespread impacts.
levels (Svoboda 2000). This has affected the development of drought indices,
Since no single definition of drought works in all which have slowly evolved during the last two centu-
circumstances (as seen above), the DM authors rely ries from simplistic approaches based on some mea-
on the analyses of several key indices and ancillary sure of rainfall deficiency, to more complex problem-
indicators from different agencies to create the final specific models. These models continue to evolve as
map. The key parameters include the PDI, CMI, soil new data sources become available. The incorporation
moisture model percentiles, daily streamflow percen- of evapotranspiration as a measure of water demand
tiles, percent of normal precipitation, topsoil mois- by Thornthwaite led to the landmark development by
ture (percent short and very short) generated by the Palmer of a water-budget-based drought index that
USDA, and a satellite-based Vegetation Health Index is still widely used 35 years later.
[(VHI) related to the VCI mentioned earlier]. The Any comprehensive drought index that can be
ancillary indicators include such indices as the SWSI, applied on a national scale must address the total en-
the KBDI, SPI, snowpack conditions, reservoir levels, vironmental moisture status. Palmer attempted this
groundwater levels determined from wells, USDA- with his index, but he faced a dilemma in trying to
1162 | AUGUST 2002keep a complicated index simple. Consequently, the of the observations to a meaningful form (such as a
Palmer Index has been criticized for how it treats fac- percentile ranking, which is the common practice for
tors such as potential evapotranspiration, runoff, the Drought Monitor objective “blends”) that could
snowmelt, and distribution of precipitation and be merged objectively with the other indicators; and
evapotranspiration within a month or week. Soil 4) the data need to be debiased to remove nonclimatic
moisture is represented using a two-layer model that influences (such as those arising from water manage-
addresses only moisture in the surface layers (i.e., ment practices).
down to the “root zone”), so the deeper groundwater
processes associated with hydrologic drought are not
represented in Palmer’s model. The SWSI comple- REFERENCES
ments the Palmer Index by addressing such factors as Abbe, C., 1894: Drought. Mon. Wea. Rev., 22, 323–324.
snowpack and the deeper groundwater issue through Alley, W. M., 1984: The Palmer Drought Severity Index:
proxies such as streamflow and reservoir storage. Limitations and assumptions. J. Climate Appl. Me-
However, the SWSI is a regional index computed pri- teor., 23, 1100–1109.
marily for river basins in just the western states. American Meteorological Society, 1997: Meteorological
As the twentieth century concluded, the monitor- drought—Policy statement. Bull. Amer. Meteor. Soc.,
ing of drought took a slightly different approach with 78, 847–849.
the establishment of the Drought Monitor. The Blumenstock, G., Jr., 1942: Drought in the United States
Drought Monitor attempts to assess the total environ- analyzed by means of the theory of probability. USDA
mental moisture status by looking at all of the indi- Tech. Bull. 819, 63 pp.
cators that are available, essentially incorporating the Condra, G. E., 1944: Drought: Its effect and measures
best drought monitoring tools into one product that of control in Nebraska. Nebraska Conservation Bull.
can be utilized by all users. Some of these indicators 25, Conservation and Survey Division, University of
can be converted into a common standardized form, Nebraska, Lincoln, NE, 43 pp.
such as a percentile ranking, allowing them to be incor- Dickson, R. R., 1958: A note on the computation of ag-
porated into an objective “blended” index (R. Tinker ricultural drought days. Weekly Weather and Crop
2001, personal communication), but others need sub- Bulletin, Vol. XLV, 7–8.
jective interpretation in order to be useful. Doesken, N. J., and D. Garen, 1991: Drought monitor-
With the Drought Monitor, considerable progress ing in the western United States using a Surface
has been made in developing a comprehensive, ob- Water Supply Index. Preprints, Seventh Conf. on
jective national drought index that overcomes some Applied Climatology, Salt Lake City, UT, Amer. Me-
of the deficiencies in other drought indices. Further teor. Soc., 266–269.
improvement is possible, however, by incorporating ——, T. B. McKee, and J. Kleist, 1991: Development of
additional indicators of drought impacts, including a Surface Water Supply Index for the western United
reservoir levels and groundwater (i.e., well) measure- States. Climatology Rep. 91-3, Colorado Climate
ments of aquifer status, in situ measurements of soil Center, Dept. of Atmospheric Science, Colorado
moisture to “ground truth” modeled values, poten- State University, Fort Collins, CO, 76 pp.
tial moisture stored in snowpack (the SNOTEL mea- Dracup, J. A., K. S. Lee, and E. G. Paulson Jr., 1980: On
surements of snow water equivalent in the U.S. west- the statistical characteristics of drought events. Wa-
ern mountains are a good example), and some ter Resour. Res., 16, 289–296.
measure of the temporal distribution of precipitation Easterling, D. R., T. R. Karl, E. H. Mason, P. Y. Hughes,
(e.g., the number of consecutive dry days, or the av- and D. P. Bowman, 1996: United States Historical
erage number of days between precipitation events, Climatology Network (U.S. HCN) monthly tempera-
scaled to some base reference). State or regional net- ture and precipitation data. ORNL/CDIAC-87,
works exist for some of these variables, but the data NDP-019/R3, Carbon Dioxide Information Analysis
are not in a form that lends itself to a national drought Center, Oak Ridge National Laboratory, Oak Ridge,
assessment. In order to be useful for operational TN, 280 pp.
drought monitoring, 1) these data need to be avail- Fernandez, B., and J. D. Salas, 1999a: Return period and
able on a near-real-time basis; 2) the data need to be risk of hydrologic events. I: Mathematical formula-
monitored on a national scale, which will require the tion. ASCE J. Hydrol. Eng., 4, 297–307.
establishment of national networks for some variables; ——, and ——, 1999b: Return period and risk of hydro-
3) complete and reliable historical data are needed logic events. II: Applications. ASCI J. Hydrol Eng., 4,
over a common reference period to allow conversion 308–316.
AMERICAN METEOROLOGICAL SOCIETY AUGUST 2002 | 1163You can also read