Elastic anisotropies of rocks in a subduction and exhumation setting
←
→
Page content transcription
If your browser does not render page correctly, please read the page content below
Solid Earth, 12, 1801–1828, 2021
https://doi.org/10.5194/se-12-1801-2021
© Author(s) 2021. This work is distributed under
the Creative Commons Attribution 4.0 License.

Elastic anisotropies of rocks in a subduction and exhumation setting
Michael J. Schmidtke1 , Ruth Keppler1 , Jacek Kossak-Glowczewski1 , Nikolaus Froitzheim1 , and Michael Stipp2
1 Institut   für Geowissenschaften, Rheinische Friedrich-Wilhelms-Universität, 53115 Bonn, Germany
2 Institute   of Geosciences and Geography, Martin-Luther University, 06099 Halle (Saale), Germany

Correspondence: Michael J. Schmidtke (michael.schmidtke@uni-bonn.de)

Received: 12 January 2021 – Discussion started: 1 February 2021
Revised: 8 May 2021 – Accepted: 8 June 2021 – Published: 13 August 2021

Abstract. Subduction and exhumation are key processes in            1   Introduction
the formation of orogenic systems across the world, for ex-
ample, in the European Alps. For geophysical investigations
of these orogens, it is essential to understand the petrophys-      During subduction, exhumation and continental collision,
ical properties of the rocks involved. These are the result of      rocks of different paleogeographic affiliations are juxta-
a complex interaction of mineral composition and rock fab-          posed, strongly deformed and submitted to variable meta-
ric including mineral textures (i.e., crystallographic preferred    morphic conditions. Oceanic crust and its sedimentary cover,
orientations). In this study we present texture-derived elastic     as well as continental fragments, are frequently subducted
anisotropy data for a representative set of different lithologies   before or during continental collision. This leads to a large
involved in the Alpine orogeny. Rock samples were collected         variety of lithologies within the subduction zone from ul-
in the Lago di Cignana area in Valtournenche, in the Italian        tramafic rocks originating from mantle material, to mafic
northwestern Alps. At this locality a wide range of units of        rocks originating from oceanic crust, to felsic rocks which
continental and oceanic origin with varying paleogeographic         were either part of continental fragments, continental mar-
affiliations and tectono-metamorphic histories are accessi-         gins or sedimentary cover of the oceanic rocks. Deforma-
ble. Their mineral textures were determined by time-of-flight       tion during subduction and exhumation produces crystallo-
neutron diffraction. From these data the elastic properties of      graphic preferred orientation (CPO), which in turn leads to
the samples were calculated. The data set includes repre-           elastic anisotropy of the rocks involved. The metamorphic
sentative lithologies from a subduction-exhumation setting.         overprint also influences their seismic velocities and Poisson
In subducted lithologies originating from the oceanic crust,        ratios. With increasing depth, the rocks undergo blueschist-
the P-wave anisotropies (AVPs [%]) range from 1.4 % to              to eclogite-facies metamorphic conditions. During exhuma-
3.7 % with average P-wave velocities of 7.20–8.24 km/s and          tion the rocks are frequently exposed to further metamor-
VP / VS ratios of 1.70–1.75. In the metasediments of the for-       phic overprint, depending on various factors such as exhuma-
mer accretionary prism the AVPs range from 3.7 % to 7.1 %,          tion speed and available water content (e.g., Peacock, 1993).
average P-wave velocities are 6.66–7.23 km/s and VP / VS            These rocks that can now be found in outcrops at the Earth’s
ratios are 1.61–1.76. Continental crust which is incorporated       surface yield insights into various stages of subduction, col-
in the collisional orogen shows AVP ranging from 1.4 % to           lision and exhumation, which can be compared to the geo-
2.1 % with average P-wave velocities of 6.52–6.62 km/s and          physical investigations of such rocks at depth.
VP / VS ratios of 1.56–1.60. Our results suggest that mafic            Such high-resolution geophysical imaging of 3D struc-
and felsic rocks in subduction zones at depth may be dis-           tures is currently taking place within the AlpArray initiative
criminated by a combination of seismic signatures: lower            using a high-end seismological array within the Alpine oro-
anisotropy and higher VP / VS ratio for mafic rocks, and            gen. For this project, knowledge of the seismic anisotropy of
higher anisotropy and lower VP / VS ratio for felsic rocks          the imaged rocks is of great interest because in conjunction
and metasediments.                                                  with the VP / VS ratio it is a key parameter for the interpre-
                                                                    tation of geological structures in the subsurface. Receiver-
                                                                    function analysis allows the separation of crustal from mantle

Published by Copernicus Publications on behalf of the European Geosciences Union.
1802                         M. J. Schmidtke et al.: Elastic anisotropies of rocks in a subduction and exhumation setting

anisotropy in the Alps (Link and Rümpker, 2019). Because          tinental fragment (Schmid et al., 2004), also termed Cervinia
of the larger lithological heterogeneity of the crust, as com-    (Pleuger et al., 2007).
pared to the mantle, information on the seismic properties of        At Lago Di Cignana (Fig. 1b), a cross section through con-
various crustal rocks is required for interpreting the crustal    tinental and oceanic units is exposed. Generally, the units ex-
anisotropy pattern.                                               hibit a shallowly NW-dipping foliation and SE–NW to E–W
   Elastic anisotropies of rocks can be calculated from min-      trending lineation (Fig. 1c). The oceanic Zermatt-Saas zone
eral compositions, single-crystal mineral properties and the      is found in the footwall, separated from the continental hang-
CPOs of all involved mineral phases (Christoffel, 1877;           ing wall unit of the Dent Blanche Nappe by the oceanic and
Mainprice and Humbert, 1994). They are also influenced            metasedimentary Combin zone. These three units are sepa-
by other factors, such as shape preferred orientation (SPO)       rated by shear zones and faults; clear differences in metamor-
of the minerals, their grain sizes and microcracks in the         phic grade can be found. For this study, metabasites (eclogite,
rocks (Siegesmund and Vollbrecht, 1991; Siegesmund et al.,        blueschist, amphibolite and greenschist) were collected from
1993; Ullemeyer et al., 2011). With increasing depth, the         the Zermatt-Saas zone. Furthermore, several metasedimen-
importance of porosity and microcracks is diminished, lead-       tary rocks of various compositions were collected from the
ing to CPO as the most important factor influencing elastic       Combin zone as well as two gneiss samples from the Dent
anisotropies in the deeper parts of subduction zones and col-     Blanche Nappe.
lisional orogens.                                                    The rocks in this study followed different P –T paths. The
   In this study, we collected a set of rock samples from         Dent Blanche unit has experienced peak P –T conditions of
the Lago di Cignana area in Valtournenche, western Alps           1.4–1.6 GPa and 450–520 ◦ C (Ballèvre et al., 1986; Ober-
(Fig. 1a and b). The samples are representative of various        hänsli and Bucher, 1987; Angiboust et al., 2014; Manzotti et
stages within a subduction and exhumation cycle, including        al., 2014). The age of blueschist-facies metamorphism was
rocks of oceanic and continental origin and variable degrees      dated at 48–43 Ma by Rb-Sr geochronology (Angiboust et
of metamorphism and deformation (Fig. 2). The CPOs of             al., 2014) in the Arolla mylonites at the base of the Dent
the mineral phases of the samples were acquired by time-          Blanche unit.
of-flight (TOF) neutron diffraction. Measurements were con-          The Combin zone displays P –T conditions of 1.2 GPa
ducted at the SKAT diffractometer of the Frank Laboratory         and 450 ◦ C (Bousquet, 2008). The age of blueschist- to
of Neutron Physics at the JINR in Dubna, Russia (Ulle-            greenschist-facies metamorphism in the Combin zone has
meyer et al., 1998, 2006, 2010; Ivankina et al., 2000, 2001;      been dated between 48 and 36 Ma (Reddy et al., 1999, 2003)
Nikitin et al., 2004; Kern et al., 2008; Keppler et al., 2014).   by Rb-Sr and Ar/Ar methods.
This method has the advantage of being able to measure               In the Zermatt-Saas zone the P –T path involved pro-
bulk CPOs of all mineral phases in large, polyphase, coarse-      grade blueschist-facies conditions, high-pressure (HP) to
grained samples simultaneously (Keppler et al., 2014). From       ultra-high-pressure (UHP) peak conditions, and retrograde
the CPO and single-crystal elastic anisotropy data the seismic    amphibolite- and greenschist-facies overprints. Peak con-
properties of all collected samples were calculated. These        ditions reached 2.5–3 GPa and 550–600 ◦ C (Bucher et al.,
data provide a catalogue for seismic imaging and geody-           2005), with locally UHP peak conditions of 3.2 GPa and
namic models of the Alpine orogen as well as other subduc-        over 600 ◦ C (Groppo et al., 2009; Frezzotti et al., 2011). The
tion zones and continental collision zones around the world.      peak UHP metamorphism was dated at 40.6 ± 2.6 Ma by Sm-
Among the texture-derived properties presented are the P-         Nd garnet (Amato et al., 1999), to 44–43 Ma by the Ar/Ar
and S-wave velocities, the VP / VS ratio and the P-wave           step-heating method on phengite (Gouzu et al., 2006) and
anisotropies of each sample.                                      at 48.8 ± 2.1 Ma by Lu-Hf on garnet-omphacite whole rock
                                                                  (Lapen et al., 2003). The greenschist-facies retrograde over-
                                                                  print was dated at 38 ± 2 Ma by Rb-Sr whole-rock-phengite
                                                                  chronology (Amato et al., 1999).
2   Geological overview of the study area

The samples in this study were collected in the western Alps      3   Methods
in northwestern Italy (Fig. 1a). In this area the Alpine orogen
consists of tectonic nappes of continental and oceanic ori-       CPOs were measured by the TOF neutron diffractometer
gin with various paleogeographic provenances and tectono-         SKAT at the Frank Laboratory of Neutron Physics at JINR
metamorphic histories. The nappe stack formed from the            in Dubna, Russia (Keppler et al., 2014; Ullemeyer et al.,
continent–continent collision of Europe and Adria occurring       1998). Neutron diffraction has several advantages over other
in the Palaeogene. The units in the nappe stack were ac-          texture analysis methods such as optical measurement and
creted to the Adriatic margin during SE-directed subduction.      electron and X-ray diffraction analysis (Wenk et al., 1998;
The units from which the samples were collected are derived       Ullemeyer et al., 2000; Nikitin and Ivankina, 2004). Among
from the Piemont-Liguria Ocean and the Margna-Sesia con-          these advantages is the low absorption of thermal neutrons

Solid Earth, 12, 1801–1828, 2021                                                     https://doi.org/10.5194/se-12-1801-2021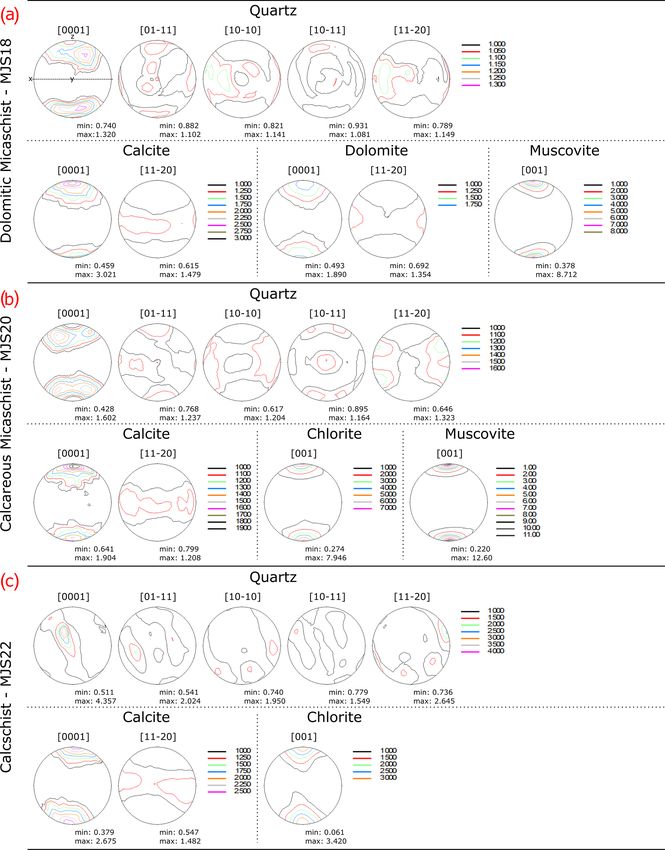
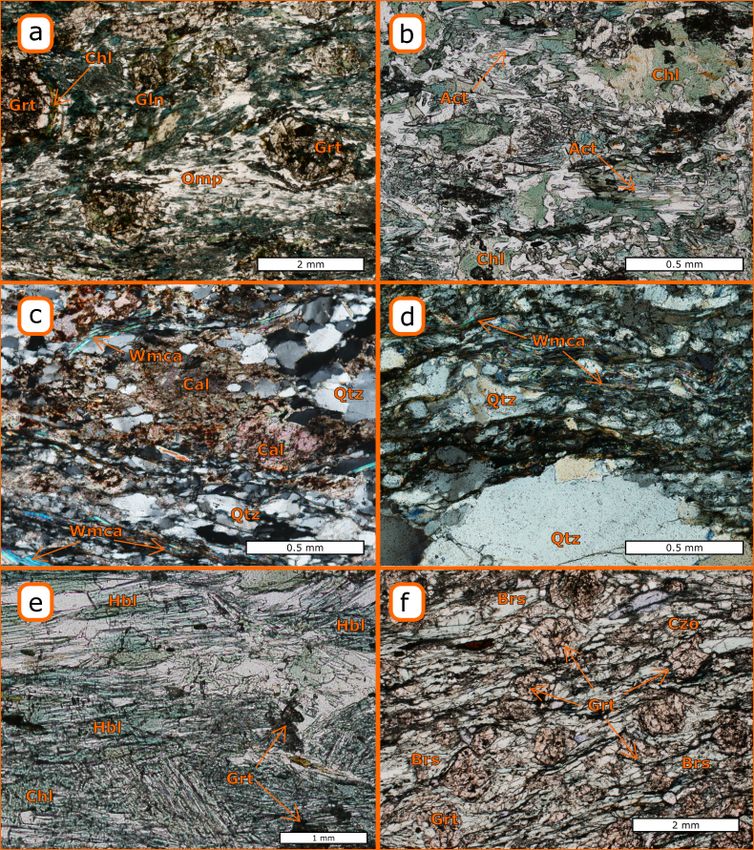
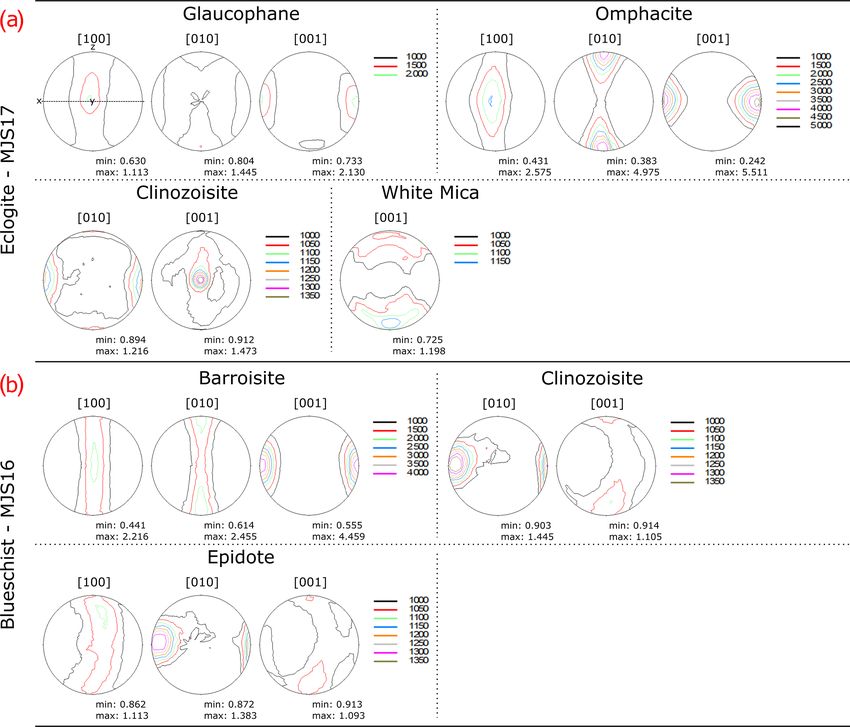
M. J. Schmidtke et al.: Elastic anisotropies of rocks in a subduction and exhumation setting                                           1803

Figure 1. (a) Miniature map displaying approximate location of the study area in the European alpine orogen. (b) Geological map of the
study area at Lago di Ciganan, in the western Italian Alps, modified after the map of Kirst and Leiss (2016). Sample locations indicated by
stars. (c) Stereoplots of foliation normal and stretching lineation as equal area projections in the lower hemisphere. Data compiled from our
own measurements (diamonds) and from Kirst and Leiss (2016) (circles); colors match those used in the map.

https://doi.org/10.5194/se-12-1801-2021                                                               Solid Earth, 12, 1801–1828, 2021
1804                          M. J. Schmidtke et al.: Elastic anisotropies of rocks in a subduction and exhumation setting

in matter. This allows the measurement of large sample vol-         and lower bounds of the elastic stiffness, respectively. Fur-
umes (up to 65 cm3 ) of complex material such as coarse-            thermore, other averaging schemes have been proposed by
grained rocks containing multiple low-symmetry mineral              Matthies and Humbert (1995) and Matthies (2012). However,
phases (Ullemeyer et al., 2006, 2010; Ivankina et al., 2005;        since the values of the parameters aij kl are still uncertain,
Kern et al., 2008; Keppler et al., 2014).                           the Voigt averaging scheme was used consistently through-
   The diffraction data are processed by Rietveld Texture           out this study. It should be kept in mind that the recalculated
Analysis (RTA) (Von Dreele, 1997; Matthies et al., 1997;            velocities are therefore maximum velocities only. In order to
Lutterotti et al., 1997). This method allows for the determina-     gain these uppermost possible VP and avoid overestimation
tion of the textures of all mineral phases in the sample by cal-    as well as uncertainties concerning the values of the aij kl pa-
culation of the orientation distribution function (ODF) using       rameters the Voigt averaging scheme was selected.
the E-WIMV algorithm (Lutterotti et al., 2004; Chateigner              The ODFs of all phases are exported from MAUD. The
et al., 2019). The RTA is performed in the software Mineral         volume percentages of the phases are estimated from thin
Analysis Using Diffraction (MAUD: Lutterotti, 2010; Wenk            sections and calculated in MAUD by RTA. The single-crystal
et al., 2010). For further discussion on the functions and lim-     elastic constants were taken from the literature (quartz:
itations of MAUD, see the publication of Wenk et al. (2012).        Heyliger et al., 2003; albite: Brown et al., 2006; muscovite:
For comparability of texture strength within the sample set         Vaughan and Guggenheim, 1986; calcite: Chen et al., 2001;
we calculated F2 indexes (Bunge et al., 1982; Matthies et al.,      dolomite: Humbert and Plique, 1972; hornblende: Aleksan-
1997) of all mineral phases in the samples of this study (see       drov and Ryzhova, 1961; epidote/zoisite/clinozoisite: Alek-
Appendix A). The F2 index is an OFD-based texture index             sandrov et al., 1974; garnet: Zhang et al., 2008; glaucophane:
in which a completely random texture as found in a powder           Bezacier et al., 2010; omphacite: Bhagat et al., 1992; chlo-
sample would result in an index of 1, while a perfect single        rite: Mookherjee and Mainprice, 2014; actinolite: Brown and
crystal would result in an index of ∞ (Matthies et al., 1997).      Abramson, 2016). In some cases, single-crystal elastic con-
   In RTA, amphiboles are generally very difficult to distin-       stants are not available for all phases (barroisite and clino-
guish, since they are crystallographically very similar. For        zoisite), so similar minerals were selected as approximations.
this reason, the crystallographic best-fit amphibole structure      For clinozoisite the single-crystal elastic constants of epidote
was picked for refinement and not the compositional best fit.       (Aleksandrov et al., 1974) were selected, for the blueschist-
This procedure has an negligible influence on the calculated        facies amphibole barroisite those of glaucophane (Bezacier
CPO due to the crystallographic similarity of the amphibole         et al., 2010). In most cases, the contents of the phases for
group (C2/m space group; Reynard et al., 1989). For the anal-       which approximations were necessary are below 10 % of the
ysis of the mineral assemblage, thin sections parallel to the       total sample volume. At this low content, the CPOs of these
stretching lineation and perpendicular to the foliation of all      minerals are of low relevance for the physical properties of
samples were made and analyzed by optical polarization mi-          the rock (Mainprice and Ildefonse, 2009).
croscopy.                                                              It is known that at low confining pressures, close to the
   To calculate the P-wave velocities and other elastic prop-       Earth’s surface, the elastic properties of rocks are greatly in-
erties of the samples, the program BEARTEX (Wenk et al.,            fluenced by microcracks and crack fabrics, as well as a shape
1998) was used. To calculate the bulk-rock elastic moduli,          preferred orientation (SPO). This has been shown in multiple
the orientation distribution function (ODF) of the mineral          studies (Kern et al., 2002, 2008; Pros et al., 2003; Ivankina et
phases, knowledge of their single-crystal elastic constants         al., 2005; Ullemeyer et al., 2006). Further studies have even
and their volume fractions are necessary. The elastic moduli        shown that the influence of microcracks is still visible up to
were then calculated using the Christoffel equation (Eq. 1)         a confining pressure of 1 GPa (Christensen, 1974; Ullemeyer
(Christoffel, 1877; Mainprice and Humbert, 1994):                   et al., 2011). In this study the elastic properties are calculated
                                                                    solely on the basis of mineral texture and single-crystal data
Det 0ij − V 2 δij = 0.                                       (1)    without taking microcracks into account. Since the microc-
                                                                    racks are closed or almost closed at great depth, the calcu-
In it the phase velocity of P, S1 or S2 waves is represented        lated elastic properties can be seen as representative of these
by V . The Kronecker delta is represented by δij , and the          conditions.
Christoffel tensor is represented by 0ij . The equation of the
Christoffel tensor (Eq. 2) is as follows:
0ij = aij kl xk x1 .                                         (2)    4   Composition and microfabrics of the samples studied

In it aij kl represents the density-corrected elastic (stiffness)   In this study we have related the subduction and exhuma-
moduli, and xk x1 represents the direction cosines of the wave      tion settings to several structural positions, each contain-
propagation direction.                                              ing characteristic lithologies (Fig. 2). These positions are
   It has been shown by Hill (1952) that the widely used aver-      (1) the oceanic crust of the subducting plate, (2) the sedi-
aging schemes of Voigt (1928) and Reuss (1929) give upper           mentary cover of the subducting plate as well as the accre-

Solid Earth, 12, 1801–1828, 2021                                                        https://doi.org/10.5194/se-12-1801-2021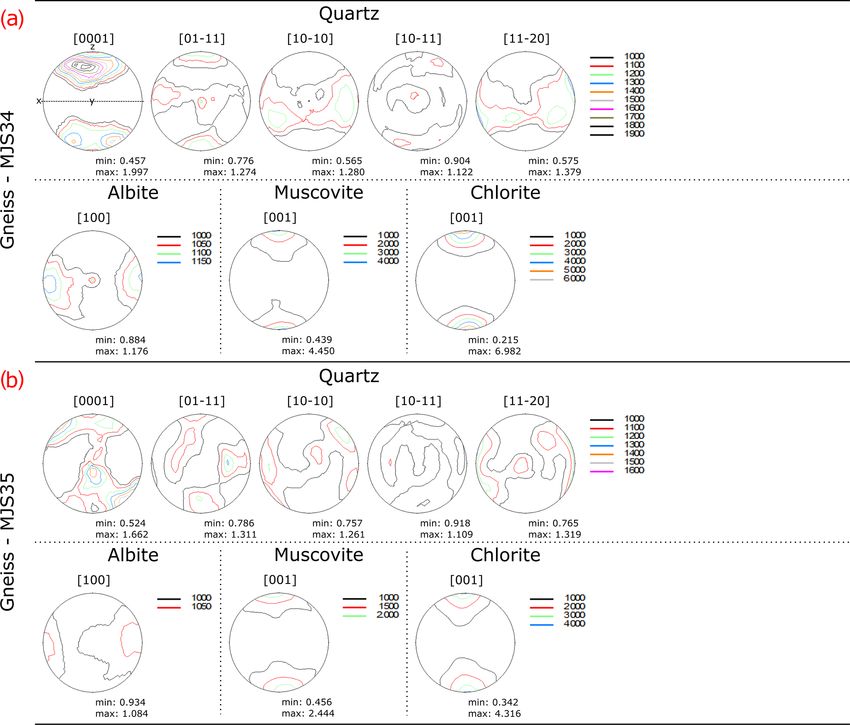
M. J. Schmidtke et al.: Elastic anisotropies of rocks in a subduction and exhumation setting                               1805

tionary prism and (3) the continental crust of a microconti-      tion in MJS26. Both hornblende and feldspar grains form a
nent. The eclogite, blueschist, amphibolite and greenschist       stretching lineation on the foliation plane.
of the Zermatt-Saas zone belong to the first of these. The
metasediments of the Combin zone represent the second po-         4.4   Greenschist
sition, and the gneisses of the Dent-Blanche represent the po-
sition of the deformed continental crust. However, the sam-       In the greenschist MJS36, the main constituent minerals
ples do not always represent the peak conditions of meta-         are chlorite (30 vol %), clinozoisite (30 vol %) and actinolite
morphism but contain minerals grown during various steps          (20 vol %). Feldspar is visible throughout the matrix (Table 1,
of the P –T path. In most samples presented here a clear          Fig. 3b). Actinolite defines the foliation of the sample, while
chlorite-forming greenschist overprint is visible, even if the    chlorite grains show a weaker preferred orientation. In the
rock originated at higher metamorphic conditions. This is es-     foliation, amphibole grains can be seen forming a stretching
pecially true for the metabasic rocks in this study, which of-    lineation. The greenschist is fine-grained and shows a very
ten contain hornblende, actinolite and chlorite, indicating the   homogeneous mineral distribution.
amphibolite- and greenschist-facies overprint.
                                                                  4.5   Metasediments
4.1   Eclogite                                                    The composition of the metasediments (MJS18, MJS20,
                                                                  MJS22) is variable (Table 1), but they all display a clear fo-
The eclogite (MJS17) is composed of omphacite (30 vol %),         liation and stretching lineation (Fig. 3c). In sample MJS18
garnet (30 vol %), clinozoisite (15 vol %), glaucophane           the matrix consists of dolomite (60 vol %), quartz (20 vol %),
(10 vol %), albite (10 vol %), rare white mica (< 5 vol %) and    calcite (10 vol %) and white mica (10 vol %). The foliation is
retrograde chlorite (< 5 vol %) (Table 1; Fig. 3a). Meso-         pronounced and defined by dolomite and calcite grains. Lay-
scopically the fabric is strongly dominated by a clear foli-      ers of finer- and coarser-grained calcite, dolomite and quartz
ation defined by omphacite and glaucophane, surrounding           alternate. Mica fishes are found interlayered in the matrix.
larger grains of garnet. Elongated omphacite and glauco-          In the layers of coarser-grained calcite, dolomite and quartz,
phane grains form the stretching lineation and are visible        a weak oblique foliation in addition to the main foliation
in the foliation plane. On the microscopic level the eclog-       can be seen. The stretching lineation is visible on the foli-
ite is strongly foliated with idiomorphic garnet grains sur-      ation plane, in elongated calcite and dolomite grains. In the
rounded by layers of omphacite, glaucophane, clinozoisite         calc-micaschist (MJS20) a clear foliation is defined by white
and feldspar. The grain size distribution is bimodal with a       mica. Alternating layers of coarser- and finer-grained calcite
mostly fine-grained matrix of omphacite, glaucophane and          (15 vol %) and quartz (40 vol %) are separated by bands of
some feldspar surrounding larger garnet grains. The presence      white mica (30 vol %) and chlorite (10 vol %). Larger grains
of albite shows a greenschist-facies overprint.                   of strongly fractured garnet (5 vol %) are present. These gar-
                                                                  net grains give the fabric a knotty appearance, with the
4.2   Blueschist                                                  other minerals flowing around them. The calcschist MJS22 is
                                                                  made up of quartz (55 vol %), calcite (30 vol %) and chlorite
The blueschist (MJS16) comprises barroisite (40 vol %), al-       (15 vol %). Compositional layering is clearly visible, with
bite (30 vol %), clinoziosite (15 vol %), garnet (10 vol %) and   thick bands of very coarse-grained quartz, alternating with
epidote (5 vol %). The foliation in the blueschist is clearly     bands of fine-grained quartz and calcite with chlorite fishes.
pronounced on the mesoscopic scale (Table 1; Fig. 3f). The        The coarser grains of both quartz and calcite form a weak
stretching lineation is formed by elongated barroisite and        oblique foliation.
feldspar grains in the foliation plane. On the microscopic
scale a foliation formed by barroisite can clearly be seen. The   4.6   Gneiss
grain-size distribution is bimodal, with a finer grained matrix
of amphibole and feldspar, and layers of larger, strongly ret-    The composition of the two gneisses (MJS34, MJS35)
rogressed, inclusion-rich and fractured garnets therein.          is quite similar to the main mineral components – in
                                                                  both are quartz (40 vol %–57 vol %), feldspar (27 vol %–
4.3   Amphibolite                                                 35 vol %), white mica (7 vol %–15 vol %) and chlorite
                                                                  (9 vol %–10 vol %) (Table 1, Fig. 3d). The fabric of both sam-
The composition of the amphibolite (MJS26; Table 1;               ples is also very similar. They are strongly foliated with a
Fig. 3e) is dominated by hornblende (40 vol %). Feldspar          lineation formed by quartz and feldspar. Sample MJS35 con-
(25 vol %), clinozoisite (15 vol %) and chlorite (10 vol %)       tains a 5 mm thick quartz band, which is a feature quite com-
are also present in the matrix. Some large, fractured garnet      mon in this unit in general. The other sample has a more
(5 vol %) grains are found as accessory minerals, which dis-      homogeneous distribution of minerals. Microscopically the
play strong greenschist-facies retrogression, with abundant       foliation is formed by mica, quartz and feldspar. Mica shows
chlorite surrounding them. Hornblende defines a weak folia-       a pronounced SPO of grains aligned in the foliation plane.

https://doi.org/10.5194/se-12-1801-2021                                                     Solid Earth, 12, 1801–1828, 2021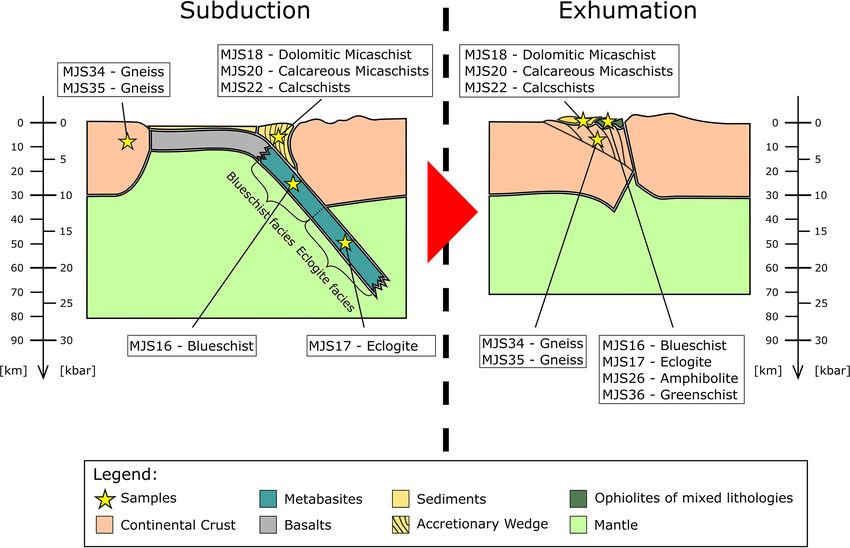
1806                           M. J. Schmidtke et al.: Elastic anisotropies of rocks in a subduction and exhumation setting

Figure 2. Schematic cross section of subduction and exhumation in a collisional orogeny. The stars show locations which the samples
represent within this setting. Colors correlate to map in Fig. 1.

Table 1. Description and modal composition of investigated samples.

       Sample   Lithology and description                              Composition
       MJS16    Strongly foliated blueschist                           40 % barroisite, 30 % albite, 10 % almandine,
                                                                       15 % clinozoisite, 5 % epidote
       MJS17    (U)HP eclogite with a clear foliation and lineation    30 % omphacite, 30 % garnet, 15 % clinozoisite,
                and large garnets                                      10 % glaucophane, 10 % albite, 5 % white mica
       MJS18    Dolomitic micaschist with calcite and a strong         60 % dolomite, 20 % quartz, 10 % calcite, 10 % muscovite
                mica-related foliation
       MJS20    Garnet-bearing calcareous micaschist                   40 % quartz, 30 % muscovite, 15 % calcite, 10 % chlorite,
                                                                       5 % garnet
       MJS22    Well foliated calcschist                               55 % quartz, 30 % calcite, 15 % chlorite
       MJS26    Weakly retrogressed amphibolite                        40 % hornblende, 25 % albite, 20 % clinozoisite,
                                                                       10 % chlorite, 5 % garnet
       MJS34    Weakly retrogressed gneiss                             40 % quartz, 35 % albite, 15 % muscovite, 10 % chlorite
       MJS35    Quartz-rich weakly retrogressed gneiss                 57 % quartz, 27 % albite, 9 % chlorite, 7 % muscovite
       MJS36    Actinolite-bearing greenschist                         30 % chlorite, 30 % clinozoisite, 20 % albite,
                                                                       20 % actinolite

Solid Earth, 12, 1801–1828, 2021                                                         https://doi.org/10.5194/se-12-1801-2021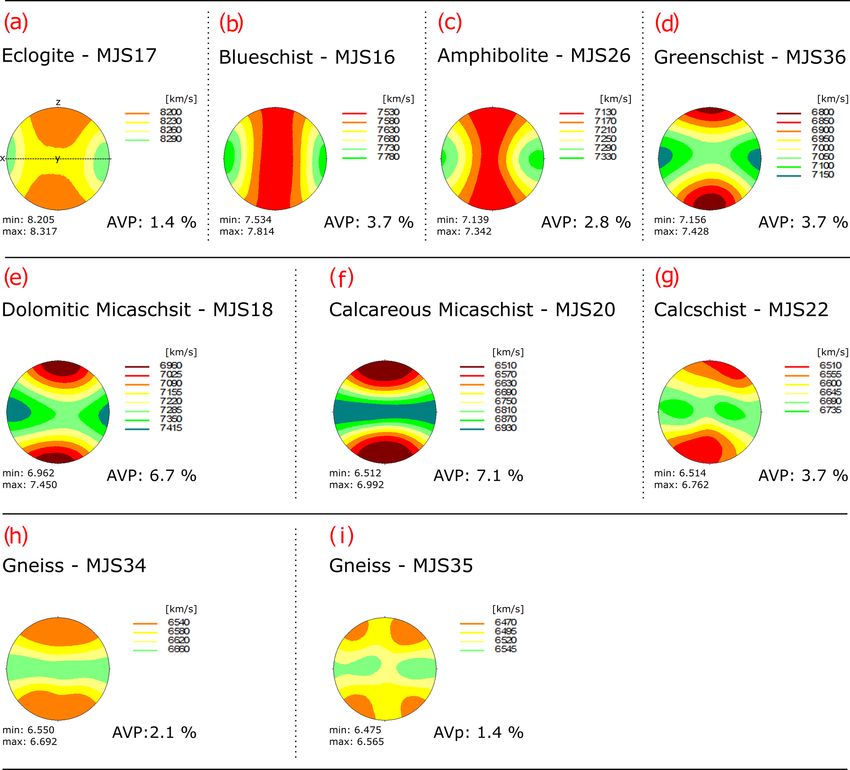
M. J. Schmidtke et al.: Elastic anisotropies of rocks in a subduction and exhumation setting                                             1807

Figure 3. Thin-section photographs of typical microstructures in four representative samples. (a) Eclogite (MJS17) with foliation of glau-
cophane (Gln) and omphacite (Omp) flowing around larger grains of garnet (Grt) with some retrograde chlorite (Chl) visible at its rim.
(b) Greenschist (MJS36) with actinolite (Act) and chlorite (Chl) visible in the foliation and larger chlorite grains found unoriented grown
over the foliation. (c) Calcareous micaschist (MJS20) with quartz (Qz), calcite (Calc) and white mica (Wmca) oriented in the foliation.
(d) Gneiss (MJS35) displaying strongly foliated fine grained quartz (Qz) and white mica (Wmca) larger coarse grained quartz. (e) Amphi-
bolite (MJS26) displaying abundant hornblende (Hbl) with some chlorite (Chl) and smaller fragmented garnet (Grt) grains. (f) Garnet (Grt)
rich band in the blueschist (MJS36) surrounded by barroisite (Brs) and clinozoisite (Czo). Sections are oriented perpendicular to the foliation
and parallel to the stretching lineation. Panels (a), (b), (e) and (f) are shown under plane-polarized light, while (c) and (d) are shown under
x-polarized light. For sample descriptions see Table 1.

Where chlorite is present it is interwoven with white mica                eation. The a axes display maxima in a girdle perpendicu-
between the quartz- and feldspar-rich layers.                             lar to the stretching lineation. The omphacite b axes form
                                                                          a weak girdle perpendicular to the stretching lineation with
                                                                          a clear maximum normal to the foliation plane (Fig. 4a).
5     Results                                                             The glaucophane in eclogite has a weak CPO with an F2 in-
                                                                          dex of 1.19. The c axes display a maximum parallel to the
5.1     Crystallographic preferred orientations                           stretching lineation. The a axes develop a girdle perpendicu-
                                                                          lar to the stretching lineation with a maximum paralleling the
5.1.1    Eclogite
                                                                          kinematic y axis. The glaucophane b axes display two max-
                                                                          ima, the stronger of which is normal to the foliation plane
In the eclogite (MJS17) omphacite shows a distinct CPO and
                                                                          and a secondary maximum parallel to the stretching lineation
has the highest texture strength of all phases in the sample
                                                                          (Fig. 4a). Clinozoisite has weak textures with an F2 index of
with an F2 index (Bunge, 1982; see complete list in Ap-
                                                                          1.01. The c axes display a maximum parallel to the kinematic
pendix A) of 3.49. The c axes display the highest inten-
                                                                          y axis. The main b axis maximum is parallel to the stretching
sity clusters with a maximum parallel to the stretching lin-

https://doi.org/10.5194/se-12-1801-2021                                                                Solid Earth, 12, 1801–1828, 2021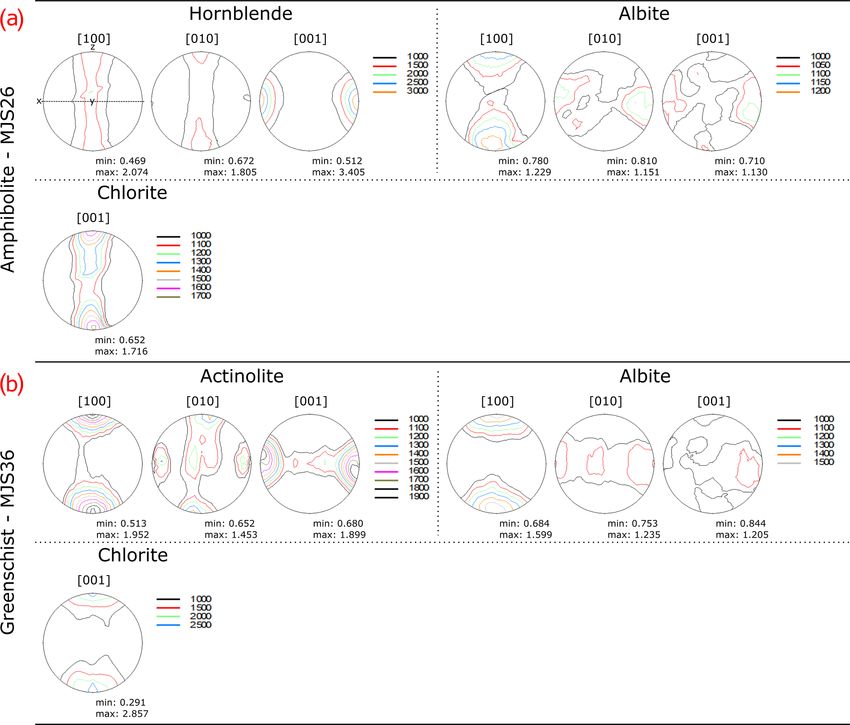
1808 M. J. Schmidtke et al.: Elastic anisotropies of rocks in a subduction and exhumation setting
Table 2. P-wave (VP) and S-wave (VS) velocities, seismic anisotropies (VP-, VS1- and VS2-anisotropies %), and VP / VS ratios of all
samples, modeled from CPOs.
VS1-anisotropy [%]
VS2-anisotropy [%]
Sample Lithology
VP-anisotropy [%]
average VP [km/s]
average VS [km/s]
max VS1 [km/s]
max VS2 [km/s]
min VS1 [km/s]
min VS2 [km/s]
max VP [km/s]
min VP [km/s]
VP / VS
MJS16 Blueschist 7.63 7.53 7.81 3.7 4.47 4.49 4.52 0.7 4.42 4.49 1.6 1.70
MJS17 Eclogite 8.24 8.21 8.32 1.4 4.78 4.78 4.81 0.8 4.77 4.78 0.2 1.72
MJS18 Dolomitic micaschist 7.23 6.96 7.45 6.7 4.12 4.06 4.24 4.4 4.02 4.10 1.9 1.76
MJS20 Calcareous micaschist 6.77 6.51 6.99 7.1 4.16 4.05 4.31 6.1 4.02 4.18 3.9 1.63
MJS22 Calcschist 6.66 6.51 6.76 3.7 4.15 4.12 4.23 2.7 4.08 4.16 1.8 1.61
MJS26 Amphibolite 7.20 7.14 7.34 2.8 4.11 4.11 4.15 0.9 4.08 4.12 1.1 1.75
MJS34 Gneiss 6.62 6.55 6.69 2.1 4.14 4.10 4.18 2.0 4.07 4.16 2.0 1.60
MJS35 Gneiss 6.52 6.48 6.57 1.4 4.18 4.17 4.21 0.9 4.14 4.20 1.5 1.56
MJS36 Greenschist 7.30 7.16 7.43 3.7 4.28 4.25 4.35 2.4 4.22 4.29 1.6 1.70
lineation (Fig. 4a). The texture of white mica in the eclogite pendicular to the stretching lineation and a weak maximum
is quite weak (F2 index of 1.02). However, the basal planes normal to the foliation plane while b axes display a broad,
show an alignment to the foliation plane (Fig. 4a). Garnet and weak maximum parallel to the stretching lineation (Fig. 5a).
albite show random textures. The textures in garnet and clinozoisite are nearly random.
5.1.2 Blueschist 5.1.4 Greenschist
In the blueschist (MJS16), barroisite displays the strongest In the greenschist MJS36, the strongest textures are found in
textures with an F2 index of 2.36. The strongest textures are chlorite with an F2 index of 1.34. Chlorite basal planes are
seen in the c axes, which exhibit a maximum parallel to the oriented parallel to the foliation plane (Fig. 5b). The textures
stretching lineation. The a axes in barroisite display a gir- of actinolite are of intermediate strength with an F2 index
dle distribution perpendicular to the lineation direction with of 1.21. The c axes display a strong maximum parallel to
a maximum parallel to the kinematic y axis. The b axes dis- the stretching lineation and a weak girdle distribution in the
play maxima in a similar girdle perpendicular to the stretch- foliation plane. The a axes show highest intensities with a
ing lineation with highest densities normal to the foliation maximum normal to the foliation plane. The b axes display
plane (Fig. 4b). Clinozoisite and epidote CPOs are very sim- a slightly weaker texture with a maximum parallel to the fo-
ilar and relatively weak. Both show an F2 index of 1.02 and liation normal, connected by a weak, irregular girdle normal
b axes with a maximum almost parallel to the stretching lin- to the stretching lineation. Furthermore, secondary maxima
eation. The a axes and c axes show girdles perpendicular to are slightly oblique to the stretching lineation (Fig. 5b). Al-
the lineation (Fig. 4b). Garnet and albite exhibit random tex- bite has an F2 index of 1.18, and a axes display the strongest
tures. CPO with a maximum parallel to the foliation normal. The
b axes are concentrated in a girdle in the foliation plane with
5.1.3 Amphibolite weak maxima therein. The c axes display a weak CPO with
diffuse maxima (Fig. 5b). Clinozoisite shows a random CPO.
In the amphibolite MJS26, the strongest textures are found
in the hornblende, with an F2 index of 1.62. The hornblende 5.1.5 Metasediments
c axes show the strongest CPO with a distinct maximum par-
allel to the stretching lineation. The b axes are distributed in In the metasediment samples (MJS18, MJS20, MJS22) the
a girdle normal to the stretching lineation, with a maximum CPOs are quite distinct and often stronger than in the sam-
normal to the foliation plane. The a axes also display a girdle ples described above. In the dolomitic micaschist MJS18, the
normal to the stretching lineation (Fig. 5a). For chlorite, the textures of muscovite are strongest with an F2 index of 2.18.
F2 index is 1.10. Chlorite c axes show a girdle perpendicu- Its basal planes display a strong alignment with the foliation
lar to the lineation with a maximum parallel to the foliation plane (Fig. 6a). The textures of dolomite are of intermediate
normal (Fig. 5a). In albite the texture strength is low, with strength with an F2 index of 1.14. The c axes display a max-
an F2 index of 1.07. However, a axes display a girdle per- imum normal to the foliation plane. The a axes show a girdle
Solid Earth, 12, 1801–1828, 2021 https://doi.org/10.5194/se-12-1801-2021M. J. Schmidtke et al.: Elastic anisotropies of rocks in a subduction and exhumation setting 1809 Figure 4. Calculated pole figures of important mineral phases in the eclogite (a; MJS17) and the blueschist (b; MJS16). The stretching lineation (kinematic x direction) is oriented EW in the pole figures, the foliation normal (kinematic z direction) is oriented NS and the kinematic y direction (perpendicular to x and z directions) is normal to the pole figure plane. The pole figures are lower hemisphere equal area projections. The contour levels display multiples of random distribution and minimum and maximum values are listed below the pole figure. distribution in the foliation plane with a maximum parallel to liation normal, while the a axes display two maxima at the the stretching lineation (Fig. 6a). In calcite the textures are periphery, each at low angle to the stretching lineation. [01– slightly stronger than in dolomite and have an F2 index of 11] shows one maximum normal to the foliation and a sec- 1.28. The c axes display a strong maximum perpendicular to ond set of maxima in the foliation plane. [10–10] displays a the foliation plane, and the a axes display a girdle distribution diffuse maximum nearly parallel to the stretching lineation, in the foliation plane (Fig. 6a). The CPO of quartz is weak while [10–11] displays maxima clustered around the folia- with an F2 index of 1.04. The c axes display small girdles tion normal and in the foliation plane parallel to the y direc- around the foliation normal. The a axes show a weak dif- tion. Garnet shows a random CPO. fuse maximum oblique to the stretching lineation. Prism and In the calcschist MJS22 all mineral phases display medium rhomb planes display almost random distributions (Fig. 6a). texture strength (Appendix A). In calcite the F2 index is 1.34. In the calcareous micaschist (MJS20), muscovite and chlo- The c axes display a strong maximum parallel to the foliation rite show strong textures with F2 indices of 2.83 and 2.17, normal. The a axes are concentrated in the foliation plane respectively. Both minerals yield a strong alignment of their with a maximum parallel to the stretching lineation (Fig. 6c). basal planes in the foliation (Fig. 6b). Calcite textures are In quartz the textures are stronger than in calcite, with an F2 weak, with an F2 index of 1.08. The c axes display a maxi- index of 1.54. The quartz c axes display a weak sinistrally mum normal to the foliation, and the a axes are concentrated rotated girdle with a strong maximum offset from the kine- in a girdle in the foliation plane (Fig. 6b). The texture of matic y axis by ca. 30◦ . A weaker density cluster is found quartz is of intermediate strength with an F2 index of 1.14. perpendicular to this girdle. The a axis maximum is located The c axes display small circle distributions around the fo- close to the periphery of the pole figure slightly sinistrally https://doi.org/10.5194/se-12-1801-2021 Solid Earth, 12, 1801–1828, 2021
1810                           M. J. Schmidtke et al.: Elastic anisotropies of rocks in a subduction and exhumation setting

Figure 5. Calculated pole figures of important mineral phases in the amphibolite (a; MJS26) and the greenschist (b; MJS36). The stretching
lineation (kinematic x direction) is oriented EW in the pole figures, the foliation normal (kinematic z direction) is oriented NS and the
kinematic y direction (perpendicular to x and z directions) is normal to the pole figure plane. The pole figures are lower hemisphere equal
area projections. The contour levels display multiples of random distribution and minimum and maximum values are listed below the pole
figure.

rotated away from the x direction. The poles of the prism                  In MJS35 both muscovite and chlorite display clear align-
and rhomb planes display weaker maxima in girdles paral-                ment of the basal planes in the foliation plane. The F2 in-
leling the c axis girdle (Fig. 6c). Chlorite has an F2 index of         dices of these two minerals are 1.13 and 1.53, respectively.
1.52 and displays a strong alignment of its basal plane in the          The CPOs in quartz are weaker (F2 index of 1.06) than those
foliation (Fig. 6c).                                                    in MJS34. c axes display an asymmetric crossed girdle dis-
                                                                        tribution. The a axes display diffuse intensity clusters at the
5.1.6   Gneiss                                                          periphery around the stretching lineation. In albite the CPO
                                                                        is nearly random (F2 index = 1.01), with a faint maximum of
In the gneisses (MJS34, MJS35) CPOs are similar to those                the a axes in the lineation direction (Fig. 7b).
of the metasediments (Figs. 6 and 7).
   In MJS34 the muscovite and chlorite display basal planes
parallel to the foliation plane. The textures are strongest for         5.2   Elastic properties
chlorite with an F2 index of 2.15. Muscovite has an F2 index
of 1.27. Quartz shows an F2 index of 1.18 and its c axes are
                                                                        P-wave anisotropies for the various lithologies were calcu-
distributed in small circles around the foliation normal. The
                                                                        lated from the ODFs of constituent mineral phases, single-
a axes display a weak and diffuse girdle distribution in the
                                                                        crystal data of the respective phase and their volume fraction
foliation plane. In albite a very weak (F2 index of 1.03) but
                                                                        within the sample using the software BEARTEX (Wenk et
distinct CPO can be seen. The a axes display a maximum
                                                                        al., 1998). Graphical representations of S-wave velocity dis-
parallel to the stretching lineation (Fig. 7a).
                                                                        tributions are not shown in this study, since the differences

Solid Earth, 12, 1801–1828, 2021                                                            https://doi.org/10.5194/se-12-1801-2021
M. J. Schmidtke et al.: Elastic anisotropies of rocks in a subduction and exhumation setting 1811 Figure 6. Calculated pole figures of important mineral phases in the dolomitic micaschist (a; MJS18), the calcareous micaschist (b; MJS20) and the calcschist (c; MJS22). The stretching lineation (kinematic x direction) is oriented EW in the pole figures, the foliation normal (kinematic z direction) is oriented NS and the kinematic y direction (perpendicular to x and z directions) is normal to the pole figure plane. The pole figures are lower hemisphere equal area projections. The contour levels display multiples of random distribution, and minimum and maximum values are listed below the pole figure. https://doi.org/10.5194/se-12-1801-2021 Solid Earth, 12, 1801–1828, 2021
1812                           M. J. Schmidtke et al.: Elastic anisotropies of rocks in a subduction and exhumation setting

Figure 7. Calculated pole figures of important mineral phases in the gneisses (a; MJS34) and (b; MJS35). The stretching lineation (kinematic
x direction) is oriented EW in the pole figures, the foliation normal (kinematic z direction) is oriented NS and the kinematic y direction
(perpendicular to x and z directions) is normal to the pole figure plane. The pole figures are lower hemisphere equal area projections. The
contour levels display multiples of random distribution and minimum and maximum values are listed below the pole figure.

between maximum and minimum velocities in a sample are                  is 4.5 km/s, resulting in a VP / VS ratio of 1.71 (Table 2).
relatively small and deemed insignificant (Table 2).                    The P-wave anisotropy is of medium strength with 3.7 %
                                                                        and defined by barroisite (40 vol %, Table 1) and clinozoisite
5.2.1   Eclogite                                                        (15 vol %, Table 1). The distribution of the fast velocities
                                                                        matches the orientation of the barroisite c axes and the cli-
In the eclogite (MJS17) the average P-wave velocity (VP) is             nozoisite b axes. Lowest P-wave velocities can be found in
8.2 km/s and the average S-wave velocity (VS) is 4.8 km/s               a girdle distribution perpendicular to the stretching lineation
resulting in a VP / VS ratio of 1.72 (Table 2). The AVP is              (Figs. 4b and 8b).
1.4 %, which is defined by omphacite (30 vol %; Table 1) and
glaucophane (10 vol %; Table 1). The fast velocities correlate          5.2.3    Amphibolite
with the c axis maximum of omphacite as well as of glauco-
phane parallel to the stretching lineation. The lowest P-wave           The amphibolite has an AVP of 2.8 %. The VP range from
velocities are found parallel to the foliation normal and in-           7.14 to 7.34 km/s, with an average of 7.20 km/s. The average
termediate velocities can be found parallel to the kinematic            VS is 4.11 km/s, resulting in a VP / VS ratio of 1.75 (Ta-
y axis (Figs. 4a and 8a).                                               ble 2). Maximum VP is aligned parallel to the stretching lin-
                                                                        eation, with a girdle of low velocities in the kinematic y–
5.2.2   Blueschist                                                      z plane, perpendicular to the stretching lineation (Fig. 8c).
                                                                        The maximum velocity correlates well with the c axes of
In the blueschist the average VP is 7.6 km/s, with a maxi-              hornblende (40 vol %, Table 1) in the amphibolite (Figs. 5a
mum of 7.8 km/s and minimum of 7.5 km/s. The average VS                 and 8c).

Solid Earth, 12, 1801–1828, 2021                                                             https://doi.org/10.5194/se-12-1801-2021
M. J. Schmidtke et al.: Elastic anisotropies of rocks in a subduction and exhumation setting 1813
Figure 8. Texture-derived calculated P-wave velocity distributions of all samples in the study. All velocities in km/s with maximum and
minimum values as well as P-wave anisotropy (in %) given below the pole figure.
5.2.4 Greenschist In the dolomitic micaschist (MJS18) the average VP of
7.2 km/s is high for a metasedimentary sample. The AVP is
In the greenschist MJS36, the average VP is 7.30 km/s, with 6.7 %. The average VS is 4.1 km/s, resulting in a VP / VS
a maximum of 7.43 km/s and a minimum of 7.16 km/s. The ratio of 1.76. Maximum VP is parallel to the stretching lin-
average VS is 4.28 km/s, resulting in a VP / VS ratio of 1.70. eation, and the lowest VP is found parallel to the foliation
The P-wave anisotropy is high with a value of 3.7 % (Ta- normal (Fig. 8e).
ble 2). The highest VP is found in the foliation plane, with a In the calcareous micaschist (MJS20) the average veloci-
maximum parallel to the stretching lineation. The lowest VP ties are lower than in the previously described sample. The
is found parallel to the foliation normal (Fig. 8d). The high- average VP is 6.77 km/s and the average VS is 4.16 km/s,
est velocities are parallel to the actinolite (20 vol %, Table 1) resulting in a VP / VS ratio of 1.63. The P-wave anisotropy
c axes and distributed similarly to the chlorite (30 vol %, Ta- in the calcareous micaschist is the highest determined in the
ble 1) basal planes (Figs. 5b and 8d). metasediments at 7.1 %. The highest VP is concentrated in
the foliation plane, and the lowest VP is found parallel to the
5.2.5 Metasediments foliation normal (Fig. 8f).
In the calcschist (MJS22) the average VP is 6.66 km/s with
The metasedimentary schist samples (MJS18, MJS20 and an AVP of 3.7 %. The average VS is 4.15 km/s, resulting in
MJS22) show average VP of 6.66–7.23 km/s and aver- a VP / VS ratio of 1.61. The highest P-wave velocities are
age VS of 4.12–4.16 km/s. The P-wave anisotropies range concentrated in a broad girdle parallel to the foliation plane
from 3.7 %–7.1 % and VP / VS ratios range from 1.61–1.76 with lowest P-wave velocities perpendicular to it (Figs. 6c
(Fig. 8e–g, Table 2). and 8g).
https://doi.org/10.5194/se-12-1801-2021 Solid Earth, 12, 1801–1828, 20211814 M. J. Schmidtke et al.: Elastic anisotropies of rocks in a subduction and exhumation setting
5.2.6 Gneiss parallel to the kinematic y and z axes, respectively (Fig. 4).
Keppler (2018) suggests that this correlation of strain geom-
In the gneiss samples (MJS34, MJS35) the P-wave etry to CPO geometry found in omphacite is applicable for
anisotropies are relatively low and the velocity distributions amphiboles as well. The amphibole CPO in three of the four
show the highest VP in the foliation plane (Fig. 8h–i). metabasites (eclogite, blueschist and amphibolite; Figs. 4 and
In MJS34 the average VP is 6.62 km/s and the average VS 5) can therefore also be interpreted as L-type or LS-type fab-
is 4.14 km/s resulting in a VP / VS ratio of 1.6 (Table 2). The rics, since the c axes are aligned in the lineation direction,
P-wave anisotropy of 2.1 % is low, and the velocity distribu- while a axes and b axes are closer to a girdle distribution
tion displays fast velocities in the foliation plane and a mini- perpendicular to the lineation. In the greenschist the actino-
mum velocity perpendicular to it (Fig. 8h). lite c axes display a maximum parallel to the stretching lin-
In MJS35 the average VP is slightly lower than in MJS34 eation with a weak girdle extending into the foliation plane,
at 6.52 km/s. The average VS is 4.18 km/s, resulting in a while the a axes display a maximum perpendicular to the fo-
VP / VS ratio of 1.56. The AVP is 1.4 % (Table 2). Similar liation plane (Fig. 5), which points to a transitional SL-type
to MJS34, the highest velocities are found in the foliation fabric.
plane. However, instead of the continuous girdle of higher Since the omphacite, glaucophane and barroisite c axes are
VP in the foliation plane, several distinct maxima occur in parallel to both the stretching lineation and one another, the
the foliation plane, connected by a weak girdle (Fig. 8i). assumption can be made that they formed in the same pro-
grade deformation event. A further possibility would be ret-
rograde mimetic overgrowth of omphacite by glaucophane
6 Discussion (McNamara et al., 2012). There are considerable debates on
timing of CPO formation in eclogites, with proponents of
The elastic anisotropy of rocks is influenced by several fac-
formation during subduction, during exhumation, or both,
tors, including mineral composition, grain fabric, possible
including concurrent switches in strain geometry (Zulauf,
microcracks and the CPO of its constituent minerals. The
1997; Kurz et al., 2004; Kurz, 2005; Neufeld et al., 2008;
CPO contributes a large part of the anisotropy and mostly
Müller et al., 2011; Keppler et al., 2016; Keppler, 2018).
results from ductile rock deformation. According to Main-
The CPOs of clinozoisite and epidote frequently have sim-
price and Ildefonse (2009) only mineral phases which make
ilarities to those of omphacite and the amphiboles. The cli-
up more than 10 % of the sample have an important influence
nozoisite b axes display a maximum paralleling the stretch-
on the elastic properties of the rock in question. In our calcu-
ing lineation, matching the omphacite and amphibole c axes.
lations we have, however, included all mineral phases down
Keppler et al. (2017) suggest concordant CPOs due to op-
to a volume fraction of 5 %.
posing crystallographic axis definitions and further conclude
6.1 Metabasic rocks that clinozoisite CPOs can likewise be classified in S-type, L-
type and intermediate fabrics (Keppler, 2018; Puelles et al.,
6.1.1 CPO development 2017). In this case the CPOs of clinozoisite would suggest
L-type fabrics hinting at constrictional strain and matching
In the metabasic rocks of eclogite, blueschist, amphibolite those already described for omphacite and the amphiboles.
and greenschist-facies metamorphic conditions the compo- Albite preferentially displays weak CPOs in the metabasites.
sitions are dominated by pyroxenes (omphacite), amphi- However, in the amphibolite and greenschist the weak albite
boles (glaucophane, barroisite, hornblende and actinolite) texture of the b and c axes corresponds to the stretching lin-
and chlorite (Table 1). eation, while the a axis maximum is aligned nearly normal
The CPOs of omphacite, glaucophane, barroisite, actino- to the foliation plane (Fig. 5). The slip systems in plagioclase
lite, chlorite and hornblende have a strong effect on the seis- are highly complex, and a correlation with the strain geome-
mic anisotropy of the metabasic rocks. In previous studies, try is difficult to infer (Hacker and Christie, 1990; Prior and
the CPO geometry of omphacite has been interpreted as be- Wheeler, 1999). When chlorite or white mica are present,
ing the result of corresponding strain geometry (Helmstaedt they mostly display a strong alignment of the basal planes in
et al., 1972; Kurz et al., 2004; Neufeld et al., 2008; Müller et the foliation plane. The similarities in the CPOs of chlorite,
al., 2011; Keppler et al., 2016; Zhang and Green, 2007). L- amphibole and albite in the greenschist suggest a formation
type (lineation dominated) fabrics are interpreted as the result during the same deformation, which likely took place during
of constrictional strain, S-type (foliation dominated) fabrics exhumation.
as the result of flattening strain and the transitional fabrics
as indicators of plain strain deformation (e.g., Helmstaedt et 6.1.2 Elastic properties
al., 1972; Zhang and Green, 2007). SL- and LS-type fabrics
have been described by Godard and Van Roermund (1995). The seismic anisotropies and the VP distribution in the
Omphacite in MJS17 displays an L- to LS-type fabric, with metabasites are primarily controlled by the influences of om-
c axes parallel to the stretching lineation and a and b axes phacite, amphibole and chlorite. These minerals result pri-
Solid Earth, 12, 1801–1828, 2021 https://doi.org/10.5194/se-12-1801-2021M. J. Schmidtke et al.: Elastic anisotropies of rocks in a subduction and exhumation setting 1815 marily in low to intermediate AVP (1.4 %–3.7 %, Table 2) lel to the basal planes. The strong alignment of these basal and VP distributions with the highest VP parallel to the planes in the foliation plane results in higher VP in the folia- stretching lineation. In the greenschist, the influence of chlo- tion plane similar but far weaker than the pattern observed in rite is significant, resulting in a girdle-type distribution of the metasediments (Figs. 5, 6 and 8d–g). Albite in the green- higher VP in the foliation plane and a weaker maximum par- schist also contributes to this pattern due to the maxima of allel to the stretching lineation. b axes and c axes within the foliation plane. The composition, AVP and VP distribution are primarily When comparing the AVP results to anisotropy data controlled by omphacite and amphibole and secondarily by from the literature (Table 3) we find a very wide range chlorite, clinozoisite, epidote and garnet. In the amphiboles, of anisotropy values for these lithologies. For the eclog- the highest P-wave velocities in the single crystals corre- ite our data (1.4 %) fit well inside the bounds of the late almost perfectly with the c axes, only deviating by a texture-derived AVP data of 0.6 % to 5.0 % by Llana-Fúnez few degrees. Since the c axes of the amphiboles in these and Brown (2012), 0.4 %–3.7 % by Keppler et al. (2015), metabasites are parallel to the stretching lineation, this re- 2.9 % by Bezacier et al. (2010), 1.2 %–2.9 % by Bascou et sults in a velocity maximum in the lineation direction. The al. (2001), 1.1 %–2.8 % by Worthington et al. (2013), 1.4 %– influence of omphacite is slightly more complicated, since 10.2 % by Cao et al. (2013) and 0.99 %–2.46 % by Cao et in the omphacite single crystals the highest velocity is not al. (2020). In the case of experimentally derived results, our parallel to the c axis and instead can be found between the data fit well into the range of 0.6 %–1.7 % reported by Wang c and a axes. This discrepancy has little influence in this et al. (2009), while it is significantly lower than the results case since it also results in a velocity maximum parallel to of 7 %–11 % reported in Zertani et al. (2019) or the value of the stretching lineation, but it should be kept in mind when 8.3 % from Keppler et al. (2015). Similarly, our data from the considering anisotropy strength and distribution. Epidote and amphibolite (A: 2.8 %) are in good agreement with texture- clinozoisite CPOs in the blueschist likely contribute to the derived data from previous studies on amphibolites. Ivank- same pattern of high velocities in the lineation direction. ina et al. (2005) report AVP of 0.59 %–5.51 %, Ullemeyer et Even though garnet has a near random CPO and does not al. (2006) of 4.4 %, Keppler et al. (2015) of 2.6 % and Kep- contribute directly to the anisotropy, the high garnet con- pler et al. (2021) AVP of 2.1 %–4.5 %. As with the eclog- tent in the eclogite sample (30 vol %, Table 1) and the very ite our texture-derived data are lower than the experimen- high P-wave velocities in garnet single crystals increase the tal AVP reported by Siegesmund et al. (1989) with 6.4 %, average seismic velocities in MJS17. In the blueschist and Barruol and Kern (1996) with 5.69 %–12.74 % and Kästner the amphibolite in which the garnet is only present to 5 %– et al. (2020) with 7.75 %–10.90 %. However, the studies by 10 % this effect is negligible. Albite can also influence the Ivankina et al. (2005) and Keppler et al. (2015) also report bulk anisotropy of the metabasites due to its strong single- lower experimental AVP of 0.86 %–8.27 % and 4.4 %, re- crystal velocity anisotropy (Brown et al., 2006, 2016). The spectively. These are quite similar to the data of our study. highest velocities in albite are parallel to the b and c axes In the case of the blueschist, our data (AVP: 3.7 %) fit very (Brown et al., 2006), both of which display weak maxima well into the range of texture-derived data by Fujimoto et parallel to the stretching lineation in the metabasites, fur- al. (2010) with AVP of 1.7 %–6.2 %. However, our value ther contributing to the high velocities parallel to the stretch- is significantly lower than that presented in other studies. ing lineation (Figs. 4 and 5). In the amphibolite, the chlo- Bezacier et al. (2010) report texture-derived AVP of 16.1 %, rite basal planes display a girdle distribution perpendicular Cao et al. (2013) of 13.4 %–24.6 % and Kim et al. (2013) to the stretching lineation with a maximum perpendicular of 7.1 %–29.5 %. There are several possible explanations for to the foliation (Fig. 5). This CPO reflects a rotation of the the discrepancy to the three later studies. The first of these is chlorite basal planes around an axis parallel to the stretch- that in many studies, blueschist samples are collected from ing lineation. Due to the lowest velocities in sheet silicates highly deformed bands resulting in stronger anisotropies. In normal to the basal plane, the CPO of chlorite in this sam- our study, however, a sample with a fabric that is representa- ple contributes to the low velocity girdle perpendicular to tive for the lithology within the Alps was selected, resulting the stretching lineation. The eclogite contains white mica. in weaker overall mineral CPOs and a lower anisotropy. Fur- However, due to its very low volume fraction of 5 % it is thermore, in the two studies mentioned the amphibole in the considered insignificant for the bulk anisotropy (Mainprice blueschist was glaucophane, while in the case of the sample and Ildefonse, 2009). In the greenschist, chlorite dominates in this study it is mostly barroisite. This was addressed in the composition. However, the anisotropy as well as the VP part when calculating the seismic properties of the blueschist distribution is primarily controlled by actinolite in the sam- since no single-crystal data for barroisite were available so ple. Actinolite CPOs in the greenschist display a transitional the single-crystal data of glaucophane (Bezacier et al., 2010) SL-type fabric, resulting in the highest VP parallel to the were selected as a suitable substitute. However, glaucophane stretching lineation and contributing to the weak girdle of may still react differently to deformation than barroisite, pos- slightly higher VP in the foliation plane. In sheet silicates the sibly resulting in stronger CPOs leading to higher seismic highest velocities in the single crystals are distributed paral- anisotropies. Finally, few studies are available on the seis- https://doi.org/10.5194/se-12-1801-2021 Solid Earth, 12, 1801–1828, 2021
1816                          M. J. Schmidtke et al.: Elastic anisotropies of rocks in a subduction and exhumation setting

mic anisotropy of greenschists. Due to the high chlorite con-      MJS18 displays very similar CPOs to calcite, with the same
tent (30 vol %; Table 1), which contains a lot of water, mea-      axial symmetry in the c and a axes (Fig. 6).
surements by neutron diffraction are very difficult. Measure-
ments by synchrotron diffraction are possible, but limited to      6.2.2   Elastic properties
very fine grain sizes. However with an AVP of 3.7 % and
an actinolite content of 20 % in the greenschist of this study     The AVP of the metasediments (MJS18, MJS20 and MJS22)
(Fig. 8d), it can be compared well to the amphibolite MJS26.       range from 3.7 %–7.1 % and are among the highest presented
   The VP / VS ratios in the metabasites range from 1.70 in        in this study (Fig. 8e–g, Table 2). These anisotropies di-
the greenschist, 1.71 in the blueschist, over 1.72 in the eclog-   rectly correlate to the pronounced foliation and high mica
ite and up to 1.75 in the amphibolite. These VP / VS ratios        and chlorite contents found in the metasediments, as well
are the direct result of the VP / VS ratios of their constituent   as the strong influence of calcite and dolomite CPOs on the
minerals and their respective volume fractions (Table 1). The      samples. This corresponds well to texture-derived AVP data
lower ratios of 1.69 in the glaucophane are balanced out by        from similar metasediments reported in other studies (see
the slightly higher ratios of pyroxene, garnet, clinozoisite,      overview in Table 3) such as Weiss et al. (1999) with 4.56 %–
epidote, chlorite, actinolite and albite whose ratios range be-    6.53 %, Erdman et al. (2013) with 2.3 %–11.4 %, Keppler et
tween 1.73–1.75. The ratio in the amphibolite is particularly      al. (2015) with 5.1 %–7.4 % and Keppler et al. (2021) with
high due to the high hornblende content of 40 vol % (Table 1)      7.9 %. Our data fall into the range of experimental AVP re-
with its very high VP / VS ratio of 1.84.                          ported by Kästner et al. (2020) with an AVP of 2.95 %–
                                                                   26.41 %.
6.2     Metasediments                                                 In our study, the orientation of white mica and chlorite
                                                                   (10 vol %–40 vol %) basal planes and the very high single-
6.2.1    CPO development                                           crystal anisotropy of white mica, which is used for both
                                                                   sheet silicates, mainly contribute to the seismic anisotropy
The small circles of quartz c axes around the foliation nor-       in the metasediments. The VP distribution in muscovite sin-
mals of samples MJS18 and MJS20 might indicate flatten-            gle crystals is dominated by the highest velocity parallel to
ing strain (Lister and Hobbs, 1980; Schmid and Casey, 1986)        and the lowest velocity normal to the basal plane (Figs. 6 and
(Fig. 6). This is also supported by the distribution of quartz     8e–g). As micas preferentially align with increasing strain in
a axes, but the textures are quite weak. The c axis pole fig-      the foliation, the result is a strong tendency for high P-wave
ures of MJS18 and MJS20 are indicative of basal hai slip           velocities in the foliation plane in deformed mica-rich rocks.
and rhomb hai slip in quartz (cf. Schmid and Casey, 1986)             The composition of the metasediments varies substan-
(Fig. 6). In MJS22 the quartz c axes display an inclined sin-      tially. Calcite and dolomite combined range from 15 up to
gle girdle pointing to simple shear. This distribution is also     70 vol % (Table 1). The CPOs of both minerals strongly in-
reflected by the quartz a axes, prism and rhomb planes and         fluence the P-wave anisotropy of the metasediments. They
indicative of multi-slip activity, possibly a combination of       result in high velocities in the foliation plane with a max-
rhomb hai slip, prism hai slip and perhaps some basal hai slip     imum parallel to the stretching lineation. Further they con-
(e.g., Schmid and Casey, 1986; Stipp et al., 2002) (Fig. 6). In    tribute to the velocity minima normal to the foliation plane.
all metasediments the basal planes of white mica and chlo-         This is the result of the calcite single-crystal data in which
rite display a strong alignment in the foliation plane. In all     the c and a axes are the slow and fast directions, respec-
three metasedimentary samples the CPOs of calcite c and            tively (Puntero et al., 2005). The single-crystal anisotropy
a axes exhibit axial symmetry with respect to the foliation        of dolomite is quite similar to that of calcite. Hence, both
normal as a symmetry axis (Fig. 6). This symmetry in cal-          similarly contribute to the bulk anisotropy of sample MJS18.
cite was first interpreted as indicative of pure shear defor-      The contribution of quartz to the P-wave anisotropy is weak
mation (Wenk et al., 1987; Kern and Wenk, 1983). How-              due to the nearly random CPO observed for the poles of the
ever, more recently, there was considerable debate on this         rhombs, which represent the fastest direction in the quartz
topic (De Bresser, 1989; Ratschbacher et al., 1991; Erskine        crystal. Furthermore, the three-fold symmetry of the quartz
et al., 1993; Burlini et al., 1998; Leiss et al., 1999; Best-      single crystal makes any influence on the velocity distribu-
mann et al., 2000). The maximum of the calcite a axes can          tion complicated to assess. The garnet present in MJS20 dis-
either be parallel to the stretching lineation or to the kine-     plays a random texture and therewith has no significant influ-
matic y axis or even display multiple maxima between the           ence on the seismic anisotropy.
two (Ratschbacher et al., 1991; Puntero et al., 2005; Best-           The VP / VS ratios in the metasediments range from 1.61
mann et al., 2000, 2006; Trullenque et al., 2006). Few stud-       to 1.76. The highest ratio is found in sample MJS18 at 1.76,
ies have focused on dolomite CPOs. Delle Piane et al. (2009)       while the ratios of the other two samples range from 1.61–
show that dolomite CPOs very closely reflect those of cal-         1.63. The high ratio of MJS18 is the result of the very high
cite, but deformation itself strongly influences the texture de-   dolomite content of 60 vol % and the 10 vol % of calcite in
velopment when both phases deform together. Dolomite in            this sample. Dolomite and calcite have very high single-

Solid Earth, 12, 1801–1828, 2021                                                      https://doi.org/10.5194/se-12-1801-2021
You can also read