Extreme water levels, waves and coastal impacts during a severe tropical cyclone in northeastern Australia: a case study for cross-sector data ...
←
→
Page content transcription
If your browser does not render page correctly, please read the page content below
Nat. Hazards Earth Syst. Sci., 18, 2603–2623, 2018
https://doi.org/10.5194/nhess-18-2603-2018
© Author(s) 2018. This work is distributed under
the Creative Commons Attribution 4.0 License.

Extreme water levels, waves and coastal impacts during
a severe tropical cyclone in northeastern Australia:
a case study for cross-sector data sharing
Thomas R. Mortlock1,2 , Daryl Metters3 , Joshua Soderholm4 , John Maher3 , Serena B. Lee5 , Geoffrey Boughton6 ,
Nigel Stewart4 , Elisa Zavadil7 , and Ian D. Goodwin2
1 Risk  Frontiers, St Leonards, 2065, Australia
2 Department   of Environmental Sciences, Macquarie University, North Ryde, 2109, Australia
3 Coastal Impacts Unit, Department of Environment and Science Queensland Government, Deagon, 4017, Australia
4 Fugro Roames, Runcorn, 4113, Australia
5 Griffith Centre for Coastal Management, Griffith University, Gold Coast 4215, Australia
6 Cyclone Testing Station, James Cook University, Douglas, 4811, Australia
7 Alluvium, Cremorne, 3121, Australia

Correspondence: Thomas R. Mortlock (thomas.mortlock@riskfrontiers.com)

Received: 17 April 2018 – Discussion started: 24 April 2018
Revised: 5 September 2018 – Accepted: 5 September 2018 – Published: 21 September 2018

Abstract. Severe tropical cyclone (TC) Debbie made land-          1   Introduction
fall on the northern Queensland coast of Australia on
27 March 2017 after crossing the Great Barrier Reef as a          Storm tide and wave impacts associated with tropical cy-
slow-moving Category 4 system. Groups from industry, gov-         clones (TCs) can result in significant loss of life and dam-
ernment and academia collected coastal hazard and impact          age to coastal infrastructure and property. The combination
data before, during and after the event and shared these data     of wind setup with a barometric surge, resulting from low at-
to produce a holistic picture of TC Debbie at the coast. Re-      mospheric pressure, can elevate water levels above the astro-
sults showed the still water level exceeded the highest as-       nomical tide and breach coastal barriers and defences. The
tronomical tide by almost a metre. Waves added a further          presence of breaking waves can further increase the poten-
16 % to water levels along the open coast, and were proba-        tial for inundation through wave setup and runup, and cause
bly unprecedented for this area since monitoring began. In        coastal erosion and structural damage. In many cases, storm
most places, coastal barriers were not breached and as a re-      tide and wave impacts coincide with pluvial and fluvial flood-
sult there was net offshore sand transport. If landfall had oc-   ing during TCs, which can further elevate water levels locally
curred 2 h earlier with the high tide, widespread inundation      and produce complex and damaging hydrodynamic condi-
and overwash would have ensued. This paper provides a case        tions where river systems meet the ocean.
study of effective cross-sector data sharing in a natural haz-       The Australian region has high exposure to TCs, with an
ard context. It advocates for a shared information platform       average of 12 events occurring per year with approximately 5
for coastal extremes in Australia to help improve the under-      making landfall (between 1961 and 2017, BoM, 2017). They
standing and prediction of TC-related coastal hazards in the      mainly affect the northern coastline from central Queens-
future.                                                           land on the eastern coast (South Pacific Ocean) to the north-
                                                                  western coast of Western Australia (Indian Ocean), although
                                                                  the extra-tropical transition of some TCs to tropical lows
                                                                  means impacts can be felt further south (Haigh et al., 2014).
                                                                  The highest storm tides (100-year return period levels >4 m)
                                                                  occur on the northwestern (Western Australia) coast, while

Published by Copernicus Publications on behalf of the European Geosciences Union.
2604                                                   T. R. Mortlock et al.: Extreme water levels, waves and coastal impacts

along the northeastern (Queensland) coastline storm tides are       near Airlie Beach, as a high-end Category 3 tropical cyclone
typically between 2 and 4 m (McInnes et al., 2016). Some pa-        (BoM, 2018). This area has experienced several TCs in re-
leoclimate indicators, however, suggest storm tides have ex-        cent years – although not as intense as Debbie – including
ceeded this range on the Queensland coast during the most           Ului in 2010 (Category 3), Anthony in 2011 (Category 2),
extreme events over the Holocene (Nott, 2015).                      and Dylan (Category 2) in 2014. Debbie intensified from a
   The magnitude of TC-induced storm surge is not linearly          tropical low southeast of Papua New Guinea in the Coral Sea
related to cyclone intensity. Shoreface slope, shoreline geom-      and proceeded to drift south as a Category 2 system. Three
etry, wind obliquity to the coast, radius of maximum winds          days before crossing the coast, Debbie turned southwest (per-
(RMW), cyclone track and forward-moving speed all con-              pendicular to the coast) and rapidly intensified to Category 4
tribute to the surge-producing potential. The existence of off-     with a RMW of approximately 30 km, reducing to 15 km at
shore islands and reefs can further modulate hydrodynamic           landfall (BoM, 2017).
conditions to the lee of these barriers, either amplifying or          Because of the intense winds (peak gusts over
dampening water levels (Lipari et al., 2008). In general, surge     260 km h−1 ), shore-normal approach, slow forward-
potential is maximised on open, straight coastlines with shal-      moving speed and coincidence with rising spring tides,
low shoreface slopes and slow-moving, landfalling cyclones          significant storm tide inundation was expected. Debbie’s
travelling perpendicularly to the coast. In the Southern Hemi-      track on approach to the coast and landfall location was in
sphere and on east-facing coasts, the clockwise flow of low-        fact very similar to severe TC Ada in 1970, an infamous
pressure systems means coastal areas on the southern limb           Category 4 system which was responsible for the loss of
of TCs experience the most wind, surge and wave impacts.            14 lives. It eventuated that the slowing of Debbie on ap-
Conversely, areas to the north often experience a suppres-          proach to the coast (to only 7 km h−1 shortly after landfall)
sion (set-down) of water levels and low wave impacts due to         meant that landfall occurred approximately 2 h after high
offshore-directed winds.                                            tide, avoiding more substantial and widespread flooding.
   TC-induced coastal flooding is maximised when storm              However, significant coastal impacts were still experienced
surge coincides with a high astronomical tide and energetic         at certain locations south of the landfall site, resulting from
wind waves. Non-linear harmonics between tide and surge             a combination of localised hydrodynamic processes and
can further elevate total water levels, especially in areas with    regional coastal geometry – as discussed further in this
large tidal ranges, with some research suggesting surge max-        paper.
ima are more likely to occur on the rising or falling tide rather      Approximately 15 h after crossing the coast, Debbie weak-
than at slack water because of this dynamical coupling (Hors-       ened to a tropical low but continued to cause significant wind
burgh and Wilson, 2007). Wave breaking further increases            and flood damage and dangerous coastal conditions through-
water levels at the coast (wave setup) and adds more forward        out southeastern Queensland and northern New South Wales,
momentum to the water mass (wave runup), meaning coastal            and subsequently travelled across the Tasman Sea to im-
foredunes can be breached even when the storm tide eleva-           pact New Zealand. In total, Debbie resulted in almost
tion is lower than the dune crest.                                  AUD 1.7 billion insured losses (PERILS, 2017), making it
   The TC season in Australia typically runs from November          the most expensive global natural disaster in the first half of
through to April (austral late summer to early autumn), when        2017.
sea surface temperatures are warm enough for cyclogenesis.             Despite the significant and lasting impacts of tropical cy-
In Australia, as elsewhere, TC-affected coasts (
T. R. Mortlock et al.: Extreme water levels, waves and coastal impacts                                                                  2605

Figure 1. (a) Map of the study area, with regional inset, showing the Debbie best track between 00:00 27 March 2017 Australian Eastern
Standard Time (AEST, UTC + 10 h) and landfall (12:40 28 March) with radius of maximum winds (RWM, red), radius of hurricane-force
winds (RHFW (≥ 33 m s−1 ), black) and radius of storm-force winds (RSFW (≥ 25 m s−1 ), white) (BoM, 2017). Locations of storm tide
gauges (yellow dots) and wave buoys (green dots) used in this study are also shown. The 100 m isobath, which approximates to the edge of
the Great Barrier Reef shelf, is also shown (dotted yellow line, from Beaman, 2010). (b) also shows locations of study sites (black triangles)
referred to in this study.

elling, both in northern Queensland and for other tropical               (Fig. 1). The Whitsunday and Mackay regions, from Airlie
cyclone-affected eastern coasts in the Southern Hemisphere,              Beach in the north to Mackay in the south (∼ 110 km shore-
such as Mozambique, Tanzania and Brazil, where the gen-                  line length), were the focus for the groups’ surveys as these
esis of these events is similar but coastal observations are             were the areas within the influence of Debbie’s southern limb
lacking. This paper also provides a case study in data shar-             and onshore-directed flow.
ing and open collaboration across industry, government and
academia, something which is currently lacking in a natural              2.1    Wave and hydrodynamic regime
hazard risk context in Australia.
                                                                         Most beaches on the central northern coast of Queensland
                                                                         receive few or no ocean swell waves and are only exposed
2   Study area                                                           to low and short-period wind waves generated primarily by
                                                                         southeasterly trade winds. The median long-term significant
Debbie made landfall near Airlie Beach (20.3◦ S, 148.7◦ E),              wave height, Hs , at the Mackay wave buoy (1975–2017)
on the Whitsunday (central northern) Queensland coast,                   is 0.7 m, peak spectral wave period, Tp , is 5.8 s, and mean
around 12:40 on 28 March 2017. Prior to landfall, Debbie                 wave direction, MWD (2002–2017), is 115 degrees True
travelled southwest from the Coral Sea over the southern                 North (◦ TN). During cyclone events, conditions greatly ex-
end of the Great Barrier Reef (GBR), the Whitsunday Island               ceed this, with wave heights greater than 5 m not uncommon.
group, and then inland as a tropical low before turning south-           The predominately low wave energy regime is a result of ef-
east towards Brisbane, the capital of the state of Queensland            fective attenuation of ocean swells by the GBR matrix, which

www.nat-hazards-earth-syst-sci.net/18/2603/2018/                                 Nat. Hazards Earth Syst. Sci., 18, 2603–2623, 2018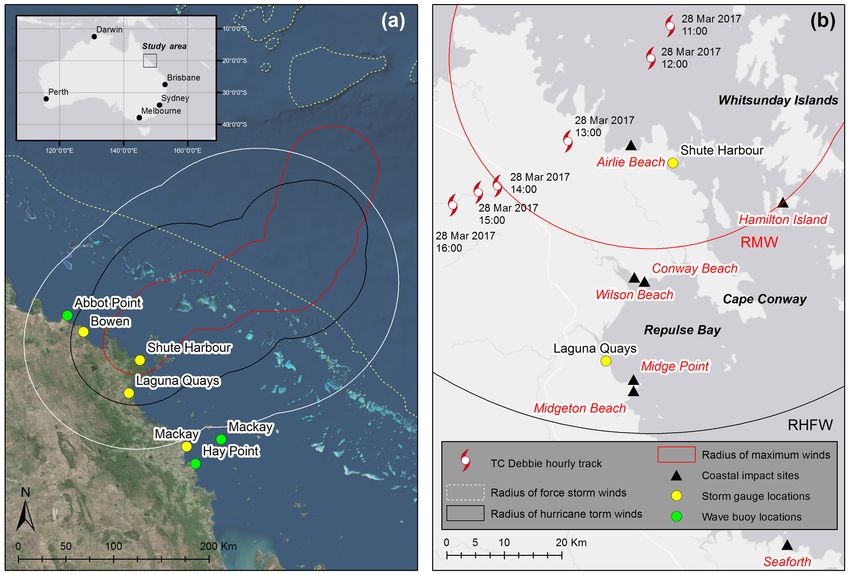
2606                                                T. R. Mortlock et al.: Extreme water levels, waves and coastal impacts

means nearshore wave conditions are largely dependent on         facing southeast across the Proserpine River mouth. The
local wind speeds rather than far-field wave generation (Gal-    seafront has a low-gradient high-tide beach flattening to 400
lop et al., 2014).                                               to 500 m wide, low sand flats (Short, 2000). The western por-
   The Whitsunday and Mackay coastline is situated to the        tion of the beach (in front of the settlement) is backed by
lee of the widest section of the GBR shelf, with over 180 km     a rock revetment with a crest of between 5 and 6 m AHD.
separating the outer reefs and the mainland coast between        The houses located closest to the shoreline sit approximately
Bowen and Mackay. In this area, water depths do not exceed       50 m behind the revetment. The eastern section of the beach
80 m, but the bathymetry is highly variable. The mean spring     is backed by a vegetated coastal dune and creek system.
range at Hay Point (∼ 20 km south of Mackay) is 4.9 m,              Midgeton Beach is a 1.8 km long, southeast-facing, low-
whereas on narrower sections of the GBR, typical spring          gradient, sandy beach. The high-tide beach is fronted by a
ranges are around 2 to 3 m.                                      wide, low-gradient intertidal beach, with sand flats extend-
                                                                 ing up to 1 km off the southern end in front of the Yard
2.2    Geomorphic setting                                        Creek mouth, which forms the southern boundary. A smaller,
                                                                 mangrove-fringed creek (Sandfly Creek) forms the northern
The tidal range at Mackay is 7 times greater than the mean       boundary (Short, 2000). The community is situated along the
annual wave height (at the Mackay buoy, 35 m water depth).       northern half of the beach. Foreshore houses initially sit ap-
For this reason, beaches in this area are tide-dominated to      proximately 70 m behind the sparsely vegetated low-lying
tide-modified (Short, 2000), with a relatively steep high-tide   foredune. Moving southward, the land between the houses
beach and wide, very low-gradient sand and/or tidal mud          and foredune becomes increasingly vegetated and to the
flats. At low tide, the water line may be several hundred        south of the community the beach is backed by a foreshore
metres seaward of the high-tide beach. Tidal state therefore     reserve fringed with dense vegetation and coconut palms.
plays an important role in modulating storm surge impact in         Observations of inundation limits are presented for Airlie
this region.                                                     Beach, Midge Point, Laguna Quays and Seaforth Beach. Ob-
   Coastal embayments in northern Queensland are typically       servations of interior and structural damage to buildings re-
east-orientated, grading from a protected southern end dom-      sulting from storm tide and waves are presented for Wilsons
inated by tidal flats and wind-blown beach ridges towards        Beach, Conway Beach and Hamilton Island. The locations of
a more exposed northern end oriented perpendicular to the        all sites are shown in Fig. 1.
southeasterly trade winds and backed by transgressive sand
dunes (Short, 2000). Longshore transport is generally north-
ward, but can change direction in the lee of headlands.          3     Datasets and methods

                                                                 3.1    Storm tide gauges
2.3    Study sites
                                                                 Storm tide monitoring in Queensland was initiated in the
Results from seven coastal sites are presented. These in-        mid-1970s and comprises a network of 36 gauges, which
clude (from north to south) Airlie Beach (20.3◦ S, 148.7◦ E),    all now measure water levels every minute, relative to local
Hamilton Island (20.4◦ S, 149.0◦ E), Wilson Beach (20.5◦ S,      Lowest Astronomical Tide (LAT). In this study, elevations
148.7◦ E), Conway Beach (20.5◦ S, 148.8◦ E), Laguna Quays        were converted to AHD, which approximates to mean sea
(20.6◦ S, 148.7◦ E), Midgeton Beach/Midge Point (20.6◦ S,        level. All storm tide gauges are fitted with a barometer which
148.7◦ E) and Seaforth Beach (20.9◦ S, 148.9◦ E).                records the atmospheric pressure at the gauge in parallel with
   Observations of beach morphological change and storm          water level.
demand are presented at the main study sites of Wilson              We define “storm tide” in this paper as the astronomical
Beach, Conway Beach and Midgeton Beach, which were               tide plus meteorological surge components (wind setup plus
some of the most severely impacted coastal locations during      barometric surge), but not wave breaking effects, which are
Debbie.                                                          treated separately. The storm tide gauges used in this study
   Wilson Beach is a small coastal settlement with a 300 m       are installed sufficiently far outside the wave breaking zone
long beach that faces south across the sand flats and chan-      to not include wave setup, under normal circumstances. They
nel of the Proserpine River. The shore consists of a steep       are also all installed on pier or wharf locations which are
high tide beach, fronted by 200 m wide sand and mud flats,       typically sheltered from wave breaking by design. However,
adjacent to the river channel (Short, 2000). The houses lo-      under extreme conditions we cannot exclude the possibility
cated closest to the shoreline are built on the sand foredune    that a small component of wave setup may be captured in a
ridge, with as little as 30 m separating the front doors from    time-averaged sense at the gauges. Our knowledge of these
the beach crest, which has an elevation of around 5 m Aus-       locations suggests this would be minimal, and for the remain-
tralian Height Datum (AHD).                                      der of this paper we make the assumption that wave breaking
   Conway Beach is a small residential settlement located        effects are additional to water levels recorded at the gauges.
2 km southeast of Wilson Beach, with a 1.5 km long beach

Nat. Hazards Earth Syst. Sci., 18, 2603–2623, 2018                        www.nat-hazards-earth-syst-sci.net/18/2603/2018/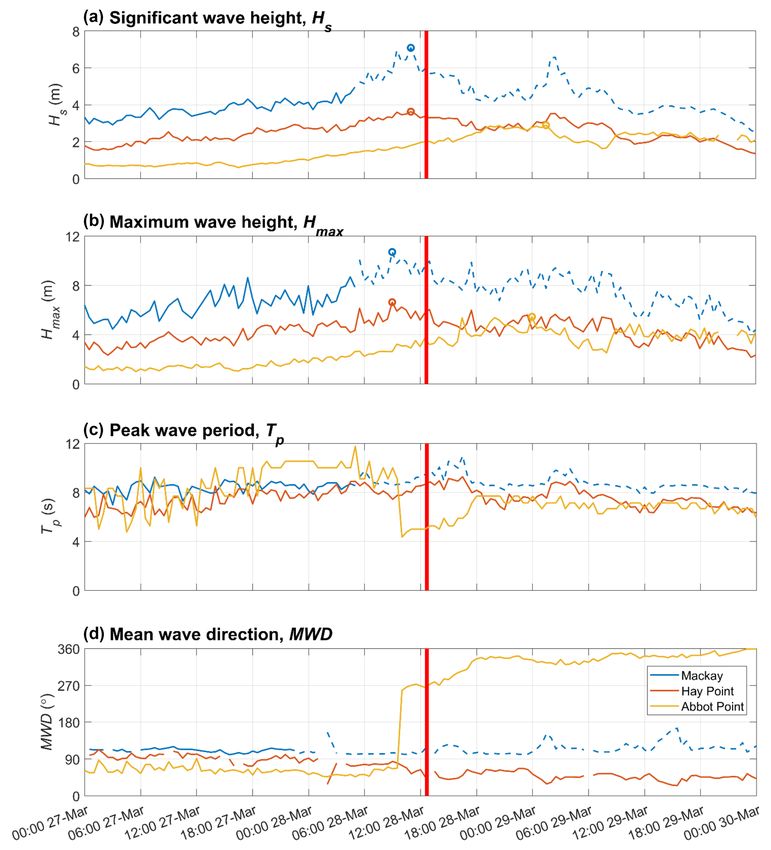
T. R. Mortlock et al.: Extreme water levels, waves and coastal impacts                                                              2607

Table 1. Storm tide gauges and wave buoys used in this study (north to south). AHD conversion from local LAT is given if a site is a storm
tide gauge, else mooring depth of water is given for wave buoys.

                       Site name        Location (Lat, long)    Type                Start of record    AHD from
                                                                                                       LAT (m) or
                                                                                                        depth (m)
                       Abbot Point      −19.87◦ , 148.10◦       Wave buoy           January 2012               14
                       Bowen            −20.02◦ , 148.25◦       Storm tide gauge    March 1975              −1.78
                       Shute Harbour    −20.29◦ , 148.78◦       Storm tide gauge    July 1976               −1.91
                       Laguna Quays     −20.60◦ , 148.68◦       Storm tide gauge    November 1994           −2.81
                       Mackay           −21.04◦ , 149.55◦       Wave buoy           September 1975             34
                       Mackay           −21.11◦ , 149.23◦       Storm tide gauge    June 1975               −2.94
                       Hay Point        −21.27◦ , 149.31◦       Wave buoy           February 1993              10

   Observations from four storm tide gauges located within a           3.3   Wave buoys
150 km radius of Debbie’s landfall site were analysed. These
include (north to south) Bowen (located on the main cargo              Ocean wave monitoring in Queensland began in the mid-
wharf at Bowen), Shute Harbour (at Shute Harbour Wharf),               1970s and now comprises a network of 16 waverider buoys.
Laguna Quays (at Laguna Quays Marina), and Mackay (on                  Observations from one buoy located to the north of the land-
Mackay Outer Harbour, Pier 1) (Table 1, locations Fig. 1).             fall site, Abbot Point (14 m water depth), and two to the
                                                                       south, Mackay (34 m) and Hay Point (10 m), were used in
3.2   Barometric surge                                                 this paper (Table 1, locations Fig. 1). Even during the ex-
                                                                       treme conditions measured during Debbie, linear wave the-
The meteorological storm surge during TC events includes               ory suggests the buoy data constitute a mid-shelf, shoaled but
wind setup and an accompanying barometric component.                   unbroken wave climate as demonstrated further in this paper.
Under strong, onshore-directed wind forcing, the water sur-               The buoys measure directional wave spectra, from which
face is tilted upward with distance downwind, causing an               parametric data are derived at 30 min intervals. In this study,
increase in the water level towards the coast (wind setup)             we refer to the 0.5-hourly significant wave height, Hs (m), the
(Kamphuis, 2010). A barometric surge occurs when there is              maximum wave height, Hmax (m), the peak spectral period,
a surface air pressure difference between the sea and shore.           Tp (s), and the mean wave direction, MWD (◦ TN, degrees
The inverse barometer (IB) effect can be approximated as               True North). Hs approximates to the average of the high-

               1
                                                                      est third of all waves measured in 30 min and is a common
          2
1h = 10          P − Pref ,                              (1)           descriptor of the bulk wave climate; Hmax is the maximum
              ρg
                                                                       wave height recorded during a half-hour; Tp is the wave pe-
where 1h is the change in the sea surface height at the shore          riod pertaining to the primary energy peak of the wave spec-
(m), ρ is the density of seawater (1025 kg m3 ), g is the ac-          trum (the most energetic waves in 30 min); and MWD is the
celeration due to gravity (9.81 m s−1 ), P is the central atmo-        mean wave direction at the primary energy peak.
spheric pressure of the cyclone and Pref is the global mean
atmospheric pressure (1013.3 hPa). P was taken as the mini-            3.4   Wave data extrapolation
mum barometric recordings at each storm tide gauge. The ef-
fect of 1 ρg is small (approximately 0.01 m), such that Eq. (1)        Due to extreme conditions leading up to Debbie, the Mackay
is often reduced to Pref –P .                                          buoy failed at around 05:30 on 28 March (∼ 7 h before land-
   To estimate wind setup, the IB effect (Eq. 1) was sub-              fall). Prior to failure, a strong correlation was observed be-
tracted from the residual between the predicted astronomi-             tween wave conditions at Mackay and Hay Point (R 0.82,
cal tide and the observed water level. In reality, the residual        p ≤ 0.05 for Hs ), located only ∼ 35 km to the south. This
may also include errors in the harmonic derivation of the as-          suggests missing data at Mackay can be estimated by extrap-
tronomical tide and non-linear tide–surge interactions (Hors-          olating observations from Hay Point.
burgh and Wilson, 2007). However, the contribution of these               To do this, a cumulative distribution function (CDF) map-
components is outside the scope of this study, so the “resid-          ping approach was used (Brocca et al., 2011). This method
ual” is taken as synonymous with the meteorological storm              compares the Mackay and Hay Point CDFs and adjusts the
surge.                                                                 Hay Point CDF to best match the Mackay CDF. The Mackay-
                                                                       adjusted Hay Point data were then used as a surrogate for the
                                                                       missing data at Mackay. Figure 2 illustrates this process for
                                                                       extrapolating Hmax ; this was repeated for Hs , Tp and MWD.

www.nat-hazards-earth-syst-sci.net/18/2603/2018/                               Nat. Hazards Earth Syst. Sci., 18, 2603–2623, 2018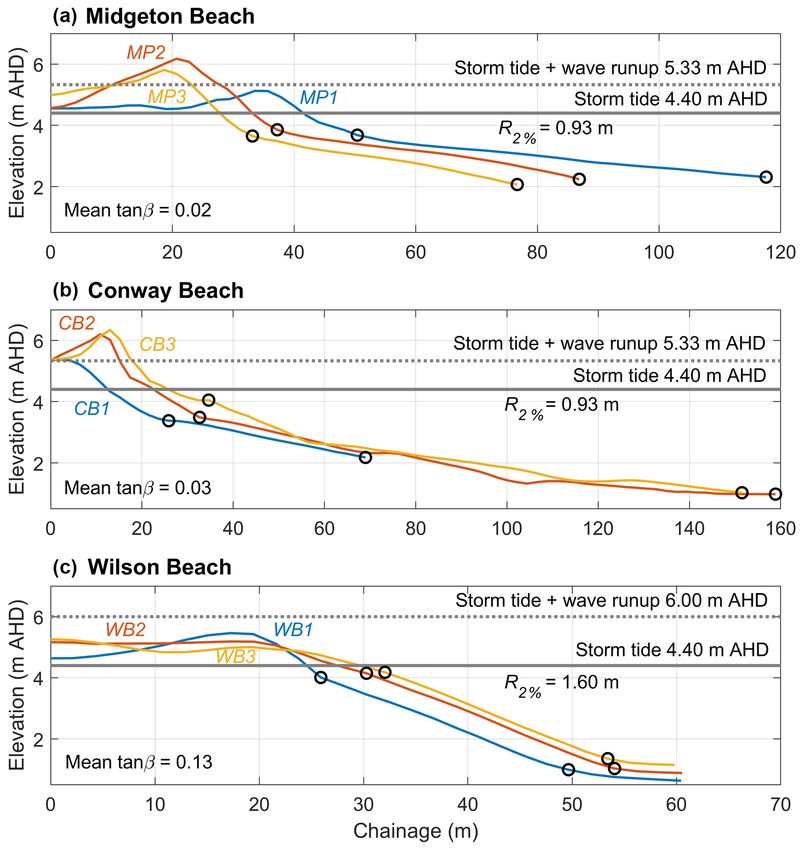
2608                                                     T. R. Mortlock et al.: Extreme water levels, waves and coastal impacts

Figure 2. Example of the CDF mapping approach used to extrapolate an estimate of Hmax at the Mackay wave buoy, using data from the
Hay Point buoy. (a) shows the raw observations (green) and quantiles (blue) of Hmax at both sites during the overlapping period; (b) shows
the cumulative distribution of Hmax at Hay Point (observed, blue line), at Mackay (observed, grey line), and at Hay Point (CDF mapped to
Mackay, red dotted line); (c) shows the same for the probability density of Hmax , and (d) shows the CDF-adjusted Hay Point data against the
original Mackay data, demonstrating their improvement as a predictor for Hmax at Mackay, compared to (a).

3.5    Wave runup estimation                                            where R2 % is the elevation above the storm tide level that is
                                                                        exceeded by 2 % of the wave runups, tan β is the beach slope,
Water levels at open-coast sites include the effects of swash,          and Hs0 and L0 are the offshore (i.e. deepwater, where wa-
wave-induced setup and runup, in addition to the storm tide.            ter depth d ≥ 0.5 L) significant wave height and wave length,
Swash is generally defined as the time-varying location of the          respectively. This equation has been applied here because it
intersection between the ocean and the beach. Wave-induced              is valid for a broad range of sandy beach types and has been
setup is the super-elevation of the still water level due to the        applied for Hurricane-type wave conditions (Stockdon et al.,
presence of waves. Wave runup is the maximum vertical ex-               2007).
tent of wave uprush on a beach or structure. Most calcula-                 We used Hs at the time of maximum storm tide (not the
tions of runup include the effects of swash and wave-induced            peak-storm Hs ) to calculate R2 % , since the storm tide com-
setup, and are therefore a measure of the maximum eleva-                ponent accounts for most of the total water level and thus
tion of wave influence above the still water level (or in this          represents the assumed time of maximum inundation. Hs was
case, storm tide). It follows, therefore, that the maximum in-          taken from the Mackay buoy, to the south of Debbie (wave
undation extent – as evidenced by the most landward detritus            conditions to the north were offshore-directed, thus not con-
lines observed in the field – represents the elevation reached          tributing to wave runup). The wavelength at the time of the
by wave runup above the storm tide.                                     maximum storm tide was first estimated:
   Wave runup was estimated empirically from wave buoy
and beach profile observations, using the equation of Stock-                  gTp2


                                                                                    2π d
don et al. (2006):                                                      L=    tan h        .                                            (3)
                                                                           2π        L

R2 % = 1.1 0.35 (tan β) (Hs0 L0 )0.5                                       From this, wave conditions at the time of the peak storm
                                          0.5 !                        tide were shown to be in intermediate water depths (0.05 L ≤
           Hs0 L0 0.563(tan β)2 + 0.004                                 d ≤ 0.5 L) at the buoy (35 m depth), thus not satisfying the
       +                                           ,           (2)
                          2                                             deepwater condition for Eq. (2). Hs was thus de-shoaled to a

Nat. Hazards Earth Syst. Sci., 18, 2603–2623, 2018                               www.nat-hazards-earth-syst-sci.net/18/2603/2018/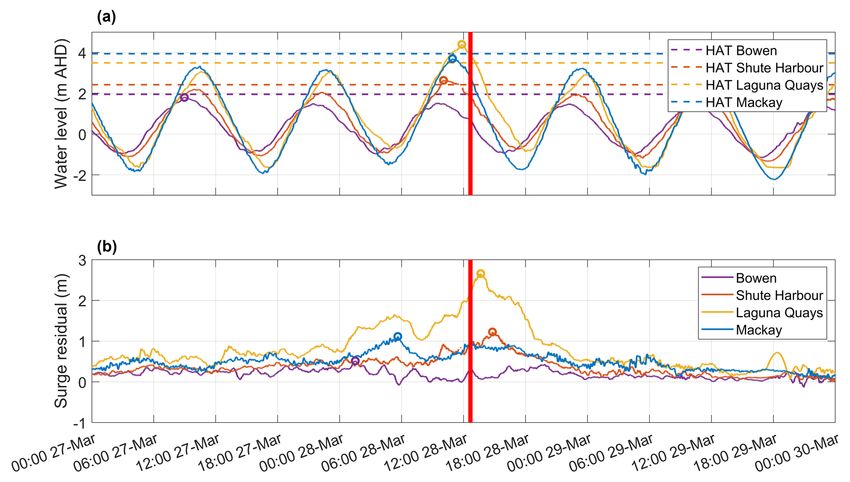
T. R. Mortlock et al.: Extreme water levels, waves and coastal impacts                                                    2609

deepwater value using linear wave theory:                         3.7    Airborne terrestrial lidar surveys
      s
        cg                                                        Fugro Roames undertook aerial lidar (light detection and
Hs0 =       Hs ,                                           (4)    ranging) surveys 8 months prior to Debbie (23 July–3 Au-
        cg0
                                                                  gust 2016) and 4 to 5 days after Debbie (1–2 April 2017),
where cg and cg0 are the wave group speeds at the buoy and        at locations across Mackay and the Whitsundays. The pri-
in deepwater, respectively, given as                              mary purpose was to provide a rapid assessment of energy
                                                                  distribution networks, but flight paths also covered coastal
                                                                  sections of interest to this study. Data were collected from

                   4π d/L        gTp         2π d
cg = 0.5 1 +                         tan h           ,  (5)       an altitude of approximately 1850 ft (564 m), with a track
               sin h (4π d/L)     2π          L
      gTp                                                         spacing of 350 m. Reported vertical accuracy was ±0.15 m
cg0 =     .                                             (6)       (to 1 RMSE, or 68 % confidence). Because the lidar surveys
       4π                                                         were flown for terrestrial applications, data were only avail-
   This resulted in an Hs0 of 5.0 m and an L0 of 131 m at the     able landward of the waterline. The digital elevation models
time of peak storm tide, which was used to estimate R2 % at       (DEMs) interpolated from the lidar points were processed to
study sites on the southern side of Debbie (L0 is equal to L      remove vegetation and buildings.
in Eq. (3) as Tp is assumed not to change during shoaling).
   The beach slope used in Eq. (2) is defined over the area of    3.8    Beach profile and surge limit surveys
significant swash activity (Stockdon et al., 2006). However,
for applications to cyclone-induced runup where large waves       Cross-shore beach profiles were taken through the li-
likely move the swash zone higher up the beach profile, the       dar DEMs pre- and post-Debbie. In addition, differen-
upper (high-tide) beach slope (tan β) is a more relevant mea-     tial GPS (DGPS) surveys were undertaken by Risk Fron-
sure (Stockdon et al., 2007); tan β was estimated for each        tiers/Macquarie University (RF/MQU) along the same pro-
study site, from cross-shore beach profiles, or from the break    file lines approximately 5 months after Debbie. DGPS mea-
of slope at the toe of the high-tide beach up to the berm crest   surements of estimated maximum inundation extent were
or toe of the coastal defence (where present).                    also made directly after Debbie by RF/MQU and DSITI.
                                                                  These measurements were largely based on observed debris
3.6    Wave power estimation                                      lines (usually pumice, vegetation or coral).
                                                                     An on-the-fly GNSS system with post-processing was
Wave power is a measure of the energy flux potential in a         used for the RF/MQU DGPS surveys. The mean vertical ac-
wave of a given height travelling at a given speed. The max-      curacy was ±0.33 m (to 1 RMSE, or 68 % confidence), be-
imum power of waves generated during tropical cyclones is         cause of not being able to calibrate against a permanent sur-
an important statistic for the design of coastal and offshore     vey marker (PSM). For this reason, more data points were
structures. Likewise, the cumulative power of waves during a      recorded over the same locations to increase the precision
TC event is an important indicator of beach and dune erosion      of the mean value. DSITI used real-time kinematic (RTK)
potential (Splinter et al., 2014). The deepwater wave power,      GNSS with post-processing. At each location, calibration
P0 , can be estimated from                                        points were taken on PSMs adjacent to the work area, giv-
                                                                  ing a better (mean) vertical accuracy of ±0.04 m.
       1     2
P0 =      ρgHs0 cg .                                       (7)
       16                                                         3.9    Structural damage surveys
  From this, the cumulative storm wave power, Pc , inte-          A team from the Cyclone Testing Station at James Cook Uni-
grated over the duration of the storm, D, is                      versity collected land-based and geo-tagged photographic
                                                                  evidence of damage caused to buildings in the areas affected
       ZD
                                                                  by storm tide inundation and waves. These surveys were fo-
Pc =        P0 dt,                                         (8)    cussed on Wilson Beach and Hamilton Island as the two lo-
       0                                                          cations receiving the most water damage to buildings.
where P0 and Pc are expressed in megawatt hours per metre
crest length (mWh m). They essentially provide a measure          4     Results
for wave energy released per unit coast length. Storm wave
conditions were defined as those exceeding a threshold Hs         4.1    Storm tide and surge conditions
of 2 m, which approximates to the 95 % percentile long-term
wave height at Mackay, a threshold that conforms with other       Figure 3 shows the water level variations and surge resid-
studies of storm waves in eastern Australia (e.g. Splinter et     uals at the four gauges before and after landfall (12:40 on
al., 2014, Goodwin et al., 2016).                                 28 March).

www.nat-hazards-earth-syst-sci.net/18/2603/2018/                          Nat. Hazards Earth Syst. Sci., 18, 2603–2623, 2018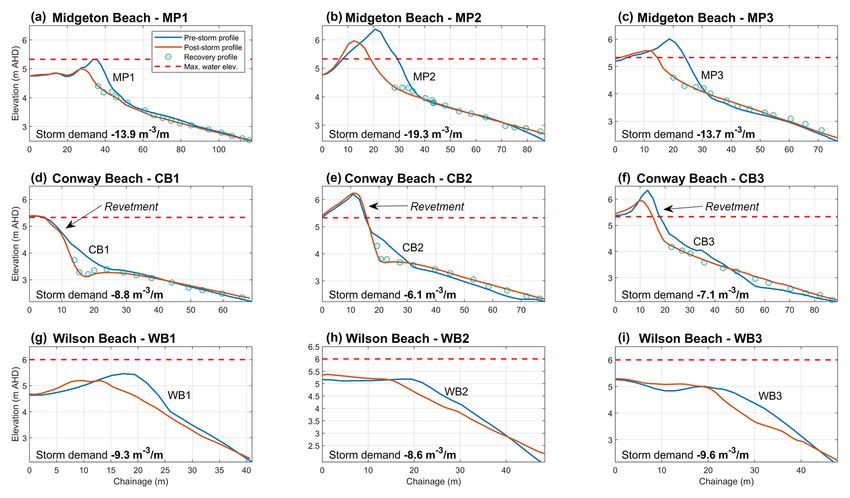
2610                                                     T. R. Mortlock et al.: Extreme water levels, waves and coastal impacts

Table 2. Maximum surge, storm tide and minimum atmospheric pressure recorded at gauges (north to south) during Debbie. Calculations
of barometric surge and wind setup components of the maximum surge are given. The time of maximum storm tide coincided with the
astronomical high tide (approx. 2 h before landfall), not the time of maximum surge (which occurred 1–2 h after landfall for the southern
sites). The predicted astronomical tide height at the time of maximum storm tide is shown below.

                 Site name         Max.     Barometric    Wind     Predicted    Max. storm     Contribution    Min. atmos.
                                   surge      surge       setup     tide (m      tide (m       of predicted     pressure
                                    (m)        (m)         (m)       AHD)         AHD)           tide (%)        (hPa)
                 Bowen             0.52        0.44        0.08       1.46          1.80           81 %            969
                 Shute Harbour     1.23        0.56        0.67       1.71          2.63           65 %            957
                 Laguna Quays      2.66        0.39        2.27       2.45          4.40           56 %            974
                 Mackay            1.12        0.21        0.91       2.99          3.70           81 %            992

Figure 3. Water levels (a) and storm surge residuals (b) observed at (north to south) Bowen, Shute Harbour, Laguna Quays and Mackay
storm tide gauges during TC Debbie. Highest Astronomical Tide (HAT, dotted horizontal lines), times of maximum water level (circles in a)
and times of maximum surge residuals (circles in b) are also shown. Red vertical line indicates approximate time of landfall at Airlie Beach.
Time is in Australian Eastern Standard Time (AEST, UTC + 10 h). Track of Debbie during this period (up to landfall) can be seen in Fig. 1.

4.2    Wind setup and barometric surge                                   4.4   Wave runup and maximum water levels

Using Eq. (1), the IB and wind setup contributions to the total          Wave runup, R2 % , and maximum water levels were esti-
surge were estimated at each gauge (Table 2). Figure 4 shows             mated empirically using Eq. (2) for the three main impact
these estimates plotted as a function of distance around Deb-            sites to the south of Debbie; Midgeton Beach, Conway Beach
bie at landfall.                                                         and Wilson Beach (Fig. 6, locations Fig. 1). Given that storm
                                                                         tide was the major component of total water levels, R2 %
4.3    Wave conditions                                                   was calculated for wave conditions at the time of the high-
                                                                         est storm tide (rather than maximum wave conditions). The
Wave observations during Debbie are shown in Fig. 5. Max-                maximum water level was defined as R2 % plus the maximum
imum wave heights and wave conditions at the time of peak                storm tide level, which was taken from the nearest gauge
storm tide conditions are given in Table 3. The locations of             (4.4 m AHD, Laguna Quays).
the three wave buoys are shown in Fig. 1.

Nat. Hazards Earth Syst. Sci., 18, 2603–2623, 2018                               www.nat-hazards-earth-syst-sci.net/18/2603/2018/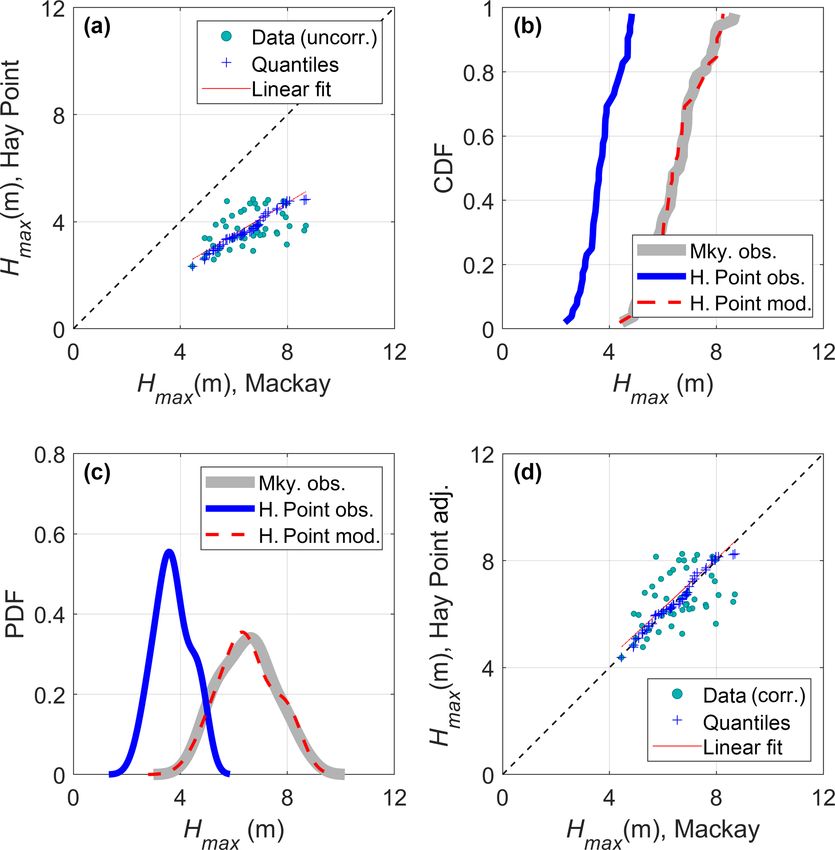
T. R. Mortlock et al.: Extreme water levels, waves and coastal impacts 2611
Table 3. Wave conditions observed (north to south) during Debbie. Both maximum wave heights and wave conditions at the time of maximum
storm tide are shown.
Site name Maximum during Debbie Time of maximum storm tide
Hs (m) Hmax (m) Hs (m) Tp (s) MWD (◦ )
Abbot Point 2.9 5.5 1.7 5.8 215 (SW)
Mackay∗ 7.1 10.7 4.7 9.5 103 (ESE)
Hay Point 3.6 6.6 3.5 8.1 64 (ENE)
∗ Wave conditions at Mackay are extrapolated and not observed values.
of inundation markers at Seaforth, Laguna Quays and Midge
Point, 4 days after Debbie (1 April 2017). DSITI undertook
measurements at the same sites, in addition to Midgeton,
Conway Beach, Wilson Beach and Hamilton Island, 8 days
after Debbie (5 April 2017). Results are summarised in Ta-
ble 4. At sites where both groups captured data over the same
area, the means compared well (a difference of 0.02 m).
4.6 Volumetric beach erosion
DEM surfaces were created from pre- and post-Debbie lidar,
at the three main study sites (Midgeton, Wilson and Con-
way beaches). The pre-Debbie DEM was subtracted from the
post-Debbie DEM to derive a difference model at each loca-
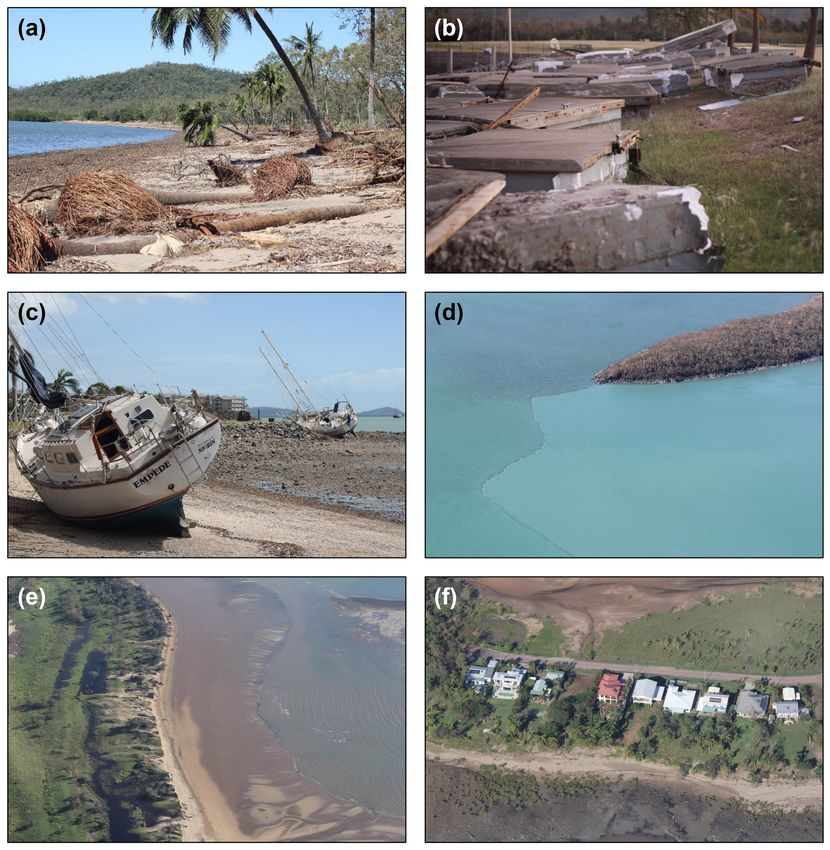
tion showing areas of erosion and accretion (Fig. 7). The sea-
ward extents of the difference models extended to 2 m AHD
after analysis of the lidar data indicated this was the approx-
Figure 4. Maximum storm surge and components (barometric
imate position of the waterline during the pre-Debbie data
surge, blue, and wind setup, orange) plotted as a function of dis- capture.
tance from Debbie landfall at 12:00 on 28 March 2017 (solid red Although we cannot be sure all morphological change in
line), where A is Mackay, B is Laguna Quays, C is Shute Harbour Fig. 7 is attributable to Debbie (because the pre-storm data
and D is Bowen storm tide gauge station (black lines show centroids were collected 8 months prior), it most probably is, espe-
of each). Radius of maximum winds (RMW, red dotted lines) and cially in the upper beach area of interest, because a low wave
radius of hurricane-force winds (RHFW, black dotted lines) are also energy regime with no storm conditions occurred during the
shown. The maximum surge north and south of Debbie’s eye (black 8-month period prior to Debbie.
curve and circles) demonstrates the asymmetry in the surge, skewed Erosion volumes (m3 ) were calculated from these differ-
to the south of the cyclone centre. ence models for zones of interest at each site (Table 5, loca-
tions of erosion zones in Fig. 7). Indicative transport path-
ways were derived from a qualitative assessment of results.
At each site, three cross-shore profiles were taken through
the pre-Debbie (July/August 2016) lidar DEM, extending
from the landward edge of the foredune to as far seaward 4.7 Cross-shore beach profile change
as possible. Because the lidar was not water-penetrating, the
seaward extent of profiles depended on the location of the Pre- and post-storm cross-shore transects were taken through
waterline at the time of data capture. A single R2 % value the lidar DEMs at Midgeton, Wilson and Conway beaches
was calculated for each site based on the mean slope (tan β) to investigate the beach profile response to Debbie (Fig. 8,
of the three profiles. locations Fig. 7).
DGPS elevations were also surveyed along the same pro-
4.5 Field observations of maximum water levels file lines approximately 5 months after Debbie to investigate
beach recovery, if any. Only the lower profile of the beach
Estimates of maximum water levels were made by locating is shown for the recovery surveys at Midgeton and Conway
the most landward line of debris visible in the field. This can beaches. At Midgeton Beach, this was because heavy vege-
be difficult post-cyclone when the clean-up operation occurs tation meant DGPS points could not be recorded for the fore-
very early after impact. RF/MQU took DGPS measurements dune/reserve area. At Conway Beach, the upper portion is a
www.nat-hazards-earth-syst-sci.net/18/2603/2018/ Nat. Hazards Earth Syst. Sci., 18, 2603–2623, 20182612 T. R. Mortlock et al.: Extreme water levels, waves and coastal impacts
Figure 5. Wave observations during Debbie at (north to south) Abbot Point, Mackay and Hay Point wave buoys. Parameters shown are (a)
significant wave height, Hs , (b) maximum wave height, Hmax , (c) peak wave period, Tp , and (d) mean wave direction, MWD. Red vertical
line indicates approximate time of landfall at Airlie Beach. Dotted blue line indicates the extrapolated estimate of wave conditions at Mackay,
after the failure of the wave buoy at 05:30 on 28 March. Maximum Hs and Hmax at each buoy are also shown in (a) and (b), respectively
(circles).
rock revetment. No recovery profiles are shown for Wilson shows there has been very little (to no) beach recovery 5
Beach because beach recharge had occurred in the interim. months on from Debbie.
The lidar-derived transects were used to calculate ero-
sion and accretion volumes above 2 m AHD for each pro-
file (Table 6). The DGPS data were not used to derive cross- 5 Discussion
sectional area change, because of the high error (±0.33 m)
and because the surveyed lines were not exactly aligned to 5.1 Storm tide conditions
the lidar-derived transects. However, their inclusion clearly
The storm surge to the south of Debbie’s landfall location
(Airlie Beach) was considerably larger than to the north, be-
Nat. Hazards Earth Syst. Sci., 18, 2603–2623, 2018 www.nat-hazards-earth-syst-sci.net/18/2603/2018/T. R. Mortlock et al.: Extreme water levels, waves and coastal impacts 2613 Figure 6. Pre-Debbie beach profiles (July–August 2016) at (a) Midgeton Beach, (b) Conway Beach and (c) Wilson Beach (profile locations in Fig. 7). Maximum storm tide elevation was taken from the nearest gauge (Laguna Quays) (grey solid line), and maximum water elevation (grey dashed line) was defined as R2 % + storm tide elevation. R2 % corresponds to the expected level of exceedance of 2 % of the wave runups during wave conditions at the time of maximum storm tide elevation (Hs0 5 m L0 131 m, at 12:00 28 March). R2 % was calculated for each location based on the mean slope (tan β) of the profiles. The locations at which tan β was calculated for each profile are shown (base of dune to toe of upper beach, black circles). cause of the clockwise rotation of low-pressure systems in the most powerful cyclones to have affected the Queensland the Southern Hemisphere, east-facing coast and consequen- coast, which made landfall further north near Cairns in 2011 tial onshore air flow to the south of the eye (Fig. 3). The with a storm tide level of 4.5 m AHD at Cardwell. The Cairns largest surge residual of 2.7 m and a maximum storm tide area has a smaller tidal range than Mackay and Yasi made level of 4.4 m AHD were measured at Laguna Quays, in Re- landfall on a falling tide, so the storm tide level comprised pulse Bay, approximately 40 km south of Airlie Beach (lo- mostly surge (3.5 m), and thus was a much rarer event (Hardy cations Fig. 1). This was the highest water level recorded at et al., 2004, and Haigh et al., 2014, both estimate the Yasi this site, since the gauge was installed in November 1994. By storm tide to have a >10 000-year recurrence). comparison, the maximum surge reached at Bowen, 80 km to It is important to note that these estimates are based on the north, was about 2 m less because of the offshore-directed synthetic extensions of ∼ 45 years of satellite-derived TC air flow (Table 2). track and intensity data (BoM, 2017) – which may not cap- According to Hardy et al. (2004) and Haigh et al. (2014), ture the longer-term variance of cyclone behaviour in the the storm tide level at Laguna Quays equates to a recurrence Coral Sea (southwestern Pacific). For example, alternative of approximately 1000 years. The storm tide during Deb- methods that are not constrained by a short observational bie was similar to the level reached during TC Yasi, one of record (such as statistical- or paleo-based approaches) esti- www.nat-hazards-earth-syst-sci.net/18/2603/2018/ Nat. Hazards Earth Syst. Sci., 18, 2603–2623, 2018
2614                                                                       T. R. Mortlock et al.: Extreme water levels, waves and coastal impacts

Table 4. Maximum limits of inundation during Debbie, from field surveys (north to south) by RF/MQU and DSITI. Storm tide height is the
maximum recorded at Shute Harbour gauge for Hamilton Island, Mackay gauge for Seaforth and Laguna Quays gauge for all others. Shute
Harbour is probably not a good representation of the storm tide level at Hamilton Island, but was the closest gauge during Debbie. Additional
sites were surveyed by DSITI and are detailed in DSITI (2017).

     Site name                Area (group)                                  Mean value (and            No. obs.         Storm tide,        Waves effects           Wave effects
                                                                             range), m AHD              points             m AHD                   (m)∗           to Hs0 (%)∗∗
     Hamilton Is.             NE-facing beach (DSITI)                       5.73 (5.52–5.90)                   40      2.63 (46 %)            3.13 (54 %)                    63 %
     Conway Beach             Western end of beach (DSITI)                  5.15 (4.86–5.89)                    5      4.40 (85 %)            0.75 (15 %)                    15 %
                              Central beach (DSITI)                         5.07 (4.76–5.55)                   11      4.40 (87 %)            0.67 (13 %)                    13 %
     Wilson Beach             Central beach (DSITI)                                          5.15                 1    4.40 (85 %)            0.75 (15 %)                    15 %
     Midge Point              Central beach (DSITI)                         5.23 (5.07–5.50)                  33       4.40 (84 %)            0.83 (16 %)                    17 %
                              Central beach (RF/MQU)                        5.21 (4.99–5.47)                 190       4.40 (85 %)            0.81 (15 %)                    16 %
     Midgeton                 Northern end of town (DSITI)                  4.30 (4.10–4.54)                   26                4.40
                              Central beach (DSITI)                         4.25 (4.13–4.37)                   15                4.40
     Laguna Quays             Side of marina (DSITI)                        4.62 (4.40–4.77)                  27       4.40 (95 %)              0.22 (5 %)                     4%
                              Side of marina (RF/MQU)                       4.60 (4.19–5.01)                 165       4.40 (96 %)              0.20 (4 %)                     4%
     Seaforth                 Northern end of beach (DSITI)                 3.76 (3.55–3.87)                  17       3.69 (98 %)             0.07 (2 %)                     1%
                              Central beach (DSITI)                         5.30 (5.02–5.66)                  10       3.69 (70 %)            1.61 (30 %)                    32 %
                              Central beach (RF/MQU)                        5.20 (4.90–5.52)                 146       3.69 (71 %)            1.51 (29 %)                    30 %
                              S/centr. beach (RF/MQU)                       4.76 (4.10–5.06)                 172       3.69 (78 %)            1.07 (22 %)                    21 %
                              Southern end of beach (DSITI)                 4.12 (3.89–4.25)                  17       3.69 (90 %)            0.43 (10 %)                     9%
   ∗ At each site, the residual between the mean of the maximum water level observations and the storm tide height from the nearest gauge was used to estimate the
   contribution of wave effects. At Midgeton, the storm tide is greater than the total water level estimate, for reasons described in the text. ∗∗ The contribution of wave effects
   to total water levels at the coast is expressed in percentage terms relative to the deepwater significant wave height, Hs0 , calculated in Sect. 3.5, as 5.0 m at the time of
   maximum storm tide.

Table 5. Beach erosion volumes for erosion zones referred to in                                 Table 6. Cross-shore beach profile changes above 2 m AHD. Brack-
Fig. 7. Bracketed values show volume range within reported accu-                                eted values show percentage of eroded volume.
racy of lidar (±0.15 m to 1 RMSE, or 68 % confidence).
                                                                                                        Beach         Erosion               Accretion        Missing volume
    Erosion zone                           Eroded beach volume (m3 )                                    profile       (m3 m)                  (m3 m)                 (m3 m)
    CB 1 – defended beach                  −2512 (−1597 to −3484)                                       MP1            −13.9          +0.6 (4.3 %)               13.3 (95.7 %)
    CB 2 – undefended beach                −960 (−378 to −1579)                                         MP2            −19.3         +3.6 (18.7 %)               15.7 (81.3 %)
    CB 3 – creek entrance                  −3677 (−2726 to −4723)                                       MP3            −13.7         +5.1 (37.2 %)                8.6 (62.8 %)
    WB 1 – main beach                      −4457 (−3075 to −5939)                                       CB1             −8.8         +1.6 (18.2 %)                7.2 (81.8 %)
    MB 1 – beach S of creek                −1502 (−564 to −2613)                                        CB2∗            −6.1        +9.9 (162.3 %)
    MB 2 – S creek entrance                −3681 (−2213 to −5363)                                       CB3∗            −7.1        +9.5 (133.8 %)
    MB 3 – main beach                      −12 457 (−9610 to −15 812)                                   WB1             −9.3         +1.9 (20.4 %)                 7.4 (79.6 %)
    MB 4 – N creek entrance                −2647 (−1709 to −3686)                                       WB2             −8.6         +2.5 (29.1 %)                 6.1 (70.9 %)
                                                                                                        WB3             −9.6         +2.6 (27.1 %)                 7.0 (72.9 %)
                                                                                                     ∗ All profiles saw a net loss of sand above 2 m AHD, except CB2 and CB3,

mate the Yasi water level to have a lower 1000-year recur-                                           which experienced a net gain (an additional 62 % and 34 % of sand,
                                                                                                     respectively).
rence (Nott and Jagger, 2013; Lin and Emannuel, 2015). Ex-
treme water levels as produced by Debbie, therefore, may be
unprecedented with regards to recent observations, but not                                      have been responsible for this, including a shallow shoreface
necessarily over the longer term.                                                               slope, concave shoreline planform and exposure to easterly
   Either side of Repulse Bay, water levels during Debbie                                       and southeasterly winds with little sheltering by offshore is-
were more than a metre lower, suggesting a more regionally                                      lands (see Fig. 1). Indeed, it may have been these features
representative surge residual was 1.1 to 1.2 m. The higher                                      that contributed to the strong ebb current that first “repulsed”
water level recorded at Laguna Quays, and inundation ob-                                        Captain Cook in 1770, giving the bay its name.
served at sites within Repulse Bay, suggest the surge was am-
plified in this area. Several geomorphological features may

Nat. Hazards Earth Syst. Sci., 18, 2603–2623, 2018                                                          www.nat-hazards-earth-syst-sci.net/18/2603/2018/
T. R. Mortlock et al.: Extreme water levels, waves and coastal impacts 2615 Figure 7. Coastal erosion, deposition and inferred transport pathways during Debbie at (a) Wilson Beach, (b) Conway Beach and (c) Midgeton Beach. Elevation difference plots show changes in metres (pre-Debbie minus post-Debbie), with ±0.15 m (reported vertical error of lidar) not shown. Contours at 1.5, 1.0, 0.5, −0.5, −1, −1.5 and −2.0 are overlaid (grey lines). The approximate position of the rock revetment at Conway Beach is shown in (b) (red line). Also shown are locations of cross-shore beach profiles at each site, extents of Fugro Roames lidar data used (black box), and erosion zones referred to in the text (dashed lines). South of landfall, wind setup was the biggest contributor approximately 2 h after the spring high water, averting more to surge (accounting for 54 % to 85 % of the total surge resid- widespread inundation. Maximum water levels occurred (in ual) because wind flow was onshore-directed. Conversely at most locations) prior to landfall, coincident with the high Bowen, north of landfall, the inverse barometric (IB) effect tide, whereas the maximum surge residual occurred 1–2 h af- was the largest contributor to surge (85 %). This was proba- ter landfall, on the falling tide (Fig. 2). This may be because bly because the wind was offshore-directed at this location, of Debbie’s southwesterly trajectory (Fig. 1) and slow for- causing a set-down in residual water levels (Fig. 4). By com- ward speed, meaning the southern limb (and strongest winds parison, McInnes and Hubbert (2003) found wind setup con- on the southern side) reached the coast sometime after the tributed ∼ 90 % of the total surge during extra-tropical cy- eye made landfall at Airlie Beach. clone events (more than here), because the atmospheric pres- Another reason for the delay of the surge peak may be the sure drop is not as significant. role of tide–surge interactions. Analyses of tide gauges in the Prior to Debbie crossing the coast, landfall was forecast to North Sea suggest that, in shallow water environments, tide– occur close to high spring tides – triggering evacuation ad- surge interactions can cause a phase shift in the total water vice for over 4000 properties within the Whitsunday storm level that means the maximum surge residual (which is the tide zone (IGEM, 2017). It eventuated that the slowing of sum of the meteorological surge plus phase-shift effects) is Debbie on approach to the coast meant that landfall occurred more likely to occur on the rising, and sometimes falling, www.nat-hazards-earth-syst-sci.net/18/2603/2018/ Nat. Hazards Earth Syst. Sci., 18, 2603–2623, 2018
2616                                                    T. R. Mortlock et al.: Extreme water levels, waves and coastal impacts

Figure 8. Cross-shore beach profile change at Midgeton Beach (a–c), Conway Beach (d–f) and Wilson Beach (g–i). Blue (orange) lines
denote pre- (post-) storm profiles taken through the lidar DEMs (locations Fig. 9). Green circles show alongshore-averaged DGPS elevations
along the same profile lines ∼ 5 months after Debbie. Only the lower “recovery” profile is shown at Midgeton Beach because heavy vegetation
hindered DGPS data collection. Only the lower “recovery” profile is shown at Conway Beach because the upper portion is a revetment. No
“recovery” profiles are shown for Wilson Beach because beach recharge occurred in the interim. Also shown is the estimate of maximum
water elevation from Fig. 6 and storm demand. (f) indicates the revetment has moved during Debbie along profile CB3, consistent with
observations (DSITI, 2017). The storm demand calculation for CB3 does not include the revetment change.

tide, but almost never coincident with high tide (Horsburgh             with the expected wind direction and fetch at this time. Wave
and Wilson, 2007). Tide–surge interactions are important de-            heights have not exceeded 10 m at Mackay since the buoy
terminants of surge maxima elsewhere in Australia (e.g. Bass            record began in 1975 – meaning Debbie may have produced
Strait, Victoria – McInnes and Hubbert, 2003, and Broome,               the most extreme wave conditions for this area over the past
Western Australia – Haigh et al., 2014), but their role in mod-         40 years. Prior to this, TC Dylan produced Hmax 10.0 m in
ulating extreme water levels along the Mackay–Whitsunday                January 2014 and TC Ului Hmax 9.4 m in March 2010.
coast requires further investigation.                                      On Debbie’s northern side, waves were much smaller and
                                                                        still coming from the ENE (onshore) as Debbie approached
5.2    Wave conditions                                                  the coast (Abbot Point buoy, Fig. 5), whereas the wind direc-
                                                                        tion was blowing in a broadly offshore direction. This sug-
Wave conditions to the south of Debbie peaked 2 to 4 h before           gests the most energetic waves to the north of Debbie, un-
landfall, broadly coinciding with high tide and peak water              til approximately 3 h prior to landfall, were still being pro-
levels (Fig. 5). The largest wave height recorded at Mackay             duced by ambient weather, rather than the approaching cy-
(before buoy failure) was Hmax 8.7 m, but extrapolation sug-            clone. At 10:00 on 28 March, MWD abruptly swung from
gests Hmax 10.7 m and Hs 7.1 m may have occurred at the                 68◦ (ENE, onshore) to 257◦ (WSW, offshore) as the offshore
buoy location (d = 35 m) (Table 3). De-shoaling these waves             winds strengthened as Debbie moved closer to the coast, be-
suggests that offshore (deepwater) conditions – representa-             coming the main generation source for local waves. At the
tive of the edge of the GBR shelf area around 100 m depth –             same time, Tp dropped from 9.1 to 4.4 s, again indicating the
may have reached Hmax0 11.5 m and Hs0 7.6 m. During this                dominance of a local, offshore wind forcing.
time, waves were coming from the east to northeast (onshore-               Inferred and measured wave heights suggest that wave
directed) and travelling at around Tp 8–9 s, which conforms             conditions at all buoys represent a mid-shelf, shoaled but

Nat. Hazards Earth Syst. Sci., 18, 2603–2623, 2018                              www.nat-hazards-earth-syst-sci.net/18/2603/2018/
T. R. Mortlock et al.: Extreme water levels, waves and coastal impacts 2617 unbroken wave climate. Wave breaking usually occurs at a height-to-depth ratio of approximately 0.7, meaning that even the highest Hmax value inferred in this study would be- gin to break in around 14 m of water depth. This is safely shoreward of the Mackay buoy in 35 m water depth. For wave breaking to occur at the shallower buoy locations (e.g. Hay Point at 10 m water depth) waves would need to be 7 m or greater. However, only wave heights
2618                                                 T. R. Mortlock et al.: Extreme water levels, waves and coastal impacts

   At Laguna Quays, the storm tide displaced pontoons from        runup contribution based on Hs in 15–20 m water depth dur-
their moorings and deposited them on adjacent grassland,          ing tropical cyclone events along the Queensland coast range
providing a useful inundation marker, at around 4.6 m AHD         between 12 % (Nott et al., 2009) and 30 % (Nott et al., 2003).
(Fig. 9). Laguna Quays Marina is sheltered from most wave         De-shoaling the Hs values used in these studies to Hs0 using
effects; therefore, the total water level only includes the       Eq. (4) reduces these values to 11 % and 28 %, comparable
storm tide with perhaps some small additional wave motion.        to findings in this study.
For this reason, the field estimates are close to the maximum
storm tide level recorded at the gauge (4.4 m AHD).               5.4   Patterns of coastal erosion
   At Seaforth, maximum water levels were around 5.2 to
5.3 m AHD along the central frontage, and 3.8 to 4.1 m            At Wilson Beach, the lidar surveys suggest Debbie caused
AHD at the more sheltered northern and southern ends of           erosion to the whole of the upper high tide beach (displac-
the beach. The highest inundation occurred at Hamilton            ing a volume of approximately 4500 m3 , Table 5), with some
Island, where the northeast-facing beach experienced wa-          material deposited immediately shoreward of the beach crest
ter levels up to 5.9 m AHD. Incidentally, Hamilton Island         (Fig. 7a). This suggests maximum water levels breached the
was the location of the highest recorded wind gust dur-           barrier dune across the whole frontage at Wilson Beach.
ing Debbie, of 260 km h−1 (uncorrected for topography and            At Conway Beach, a rock revetment protects the township
around 240 km h−1 after correction to standard conditions,        at the western end of the bay (denoted in red, Fig. 7b), while
Boughton et al., 2017).                                           the eastern end is a natural system with vegetated dunes
   The storm tide contributed between 70 % and 98 % of to-        and a small creek behind the beach. The undefended section
tal water levels at the mainland, open-coast sites (Conway        showed similar behaviour to Wilson Beach during Debbie;
Beach, Wilson Beach, Midge Point, Seaforth), with a mean          erosion to the upper beach (approximately 960 m3 ) and over-
of 84 % (Table 4). By comparison, previous work suggests          wash (deposition) of some of this material landward of the
the storm tide contributes between 65 % and 75 % of the to-       dune crest. In front of the revetment, however, the beach re-
tal inundation of extreme paleo-cyclones along the northern       sponse differed. Figure 7b indicates the upper beach erosion
Queensland coast (Nott et al., 2009; Forsyth et al., 2010). The   (approximately 2500 m3 ) was deposited seaward at the toe of
higher contribution of storm tide during Debbie reflects the      the upper beach, rather than transported landwards.
macro-tidal range of the Mackay area, which significantly re-        Overall, the revetment at Conway Beach appears to have
duces further north along the coast. The large tide makes it      prevented significant overtopping. Figure 7b does, however,
difficult to make accurate TC storm tide forecasts, because a     suggest there was some overwash of material at the western
few hours’ error can translate to hundreds of metres of dif-      end between profiles CB1 and CB2, which concurs with the
ference in the cross-shore position of the waterline.             empirical estimates in Sect. 5.3 that maximum water levels
   Wave effects were responsible for 2 % to 30 % of total         around CB1 breached the revetment crest (Fig. 6b). In addi-
water levels, depending on coastal exposure, with a mean          tion, there is an area of large erosion (beach lowering by up
of 16 %. The empirical estimate of Stockdon et al. (2006)         to 1.5 m) directly to the east of the termination of the revet-
did reasonably well in replicating the relative contribution of   ment – perhaps an “end-effect” of the rock wall. End-effects
waves to total water levels. If a regional upper beach slope      occur when erosion is focussed on areas directly down-drift
of 0.02–0.03 is used (as per Short, 2006, and measured at         of a coastal defence, when the structure protrudes seaward of
Midgeton and Conway beaches), and the mid-shelf wave              the natural beach crest (as it does at Conway Beach).
record is de-shoaled to deepwater values, then wave effects          At Midgeton Beach, erosion was focussed on the cen-
are estimated at approximately 17 % of the total inundation.      tral/northern section of the beach, in front of the township of
This appears to capture the mean, regional contribution of        Midgeton (approximately 12 500 m3 , Table 4). The lidar data
waves to total water levels, assuming sites receive incident      suggest most of the eroded material accumulated at the toe
wave energy and do not deviate far from the regional mean         of the high-tide beach in a depositional lobe about 300 m in
slope.                                                            length. This feature probably extended further seaward than
   The contribution of wave effects at the coast to total wa-     was captured in the DEMs, and may have resulted from a
ter levels was also expressed in percentage terms relative        rip-cell circulation that was set up here, transporting eroded
to the deepwater significant wave height, Hs0 , calculated in     material alongshore and then offshore in front of the central
Sect. 3.5 as 5.0 m, at the time of maximum storm tide (Ta-        beach.
ble 4). This is important because, in large-scale studies where      There is little evidence of much landward transport (over-
an accurate estimate of beach slope is not available, the wave    wash) of sand at Midgeton. Likewise, the dunes did not
contribution to coastal water levels is sometimes estimated       experience any notable roll-over as seen at Wilson Beach
as a fixed fraction of Hs0 . Results show that this fraction      (Fig. 8a–c). Instead, the beach responded similarly to the
varied considerably from 1 % at the most sheltered location       revetted section at Conway Beach, where eroded sand was
(Laguna Quays) to 63 % at the most exposed site (Hamil-           transported seaward. This may be related to the reinforced
ton Island), with a mean of 18 %. Previous estimates of wave      stability of the coastal foredunes at Midgeton; a community-

Nat. Hazards Earth Syst. Sci., 18, 2603–2623, 2018                       www.nat-hazards-earth-syst-sci.net/18/2603/2018/
T. R. Mortlock et al.: Extreme water levels, waves and coastal impacts                                                      2619

led initiative had ensured they were well vegetated and in       At Midgeton and Conway beaches, this may have been in
most parts underlain by a geotextile mat prior to Debbie         part due to the stabilisation of the coastal frontage. Even
(Zavadil et al., 2017).                                          at Wilson Beach, however, where the coastal foredune was
   Another commonality between Conway and Midgeton               not stabilised, results indicate that most sediment was trans-
beaches was the major erosion that occurred near tidal           ported seaward of the high-tide beach (beyond the limits of
creeks. At Conway Beach, storm water transported seaward         our data capture), with only a small portion of the eroded
down the creek caused large, localised erosion at the mouth      volume overwashed landward.
(∼ 3700 m3 – more than the rest of the entire frontage), and        Our results suggest that while overwash and landward
was deposited at the toe of the upper beach. The difference      transport clearly occurred during Debbie, this only accounted
plot is cut off at + 2 m AHD, but suggests a 200 m wide ebb      for a small portion of the total eroded volume of the up-
tidal delta formed in this area.                                 per beach, and the majority was transported offshore and
   Similarly, at Midgeton Beach, significant erosion occurred    placed around the toe of the high-tide beach. This may have
at the two creek entrances, with the southern creek erod-        been because at most sites, coastal water levels did not fully
ing an almost identical volume to the Conway Beach creek         breach the foredune, inducing offshore transport. Similarly,
(∼ 3700 m3 ). Sand from both the northern and southern           Sallenger et al. (2006) found that the net direction of sed-
creeks looks to have washed out in a southwesterly direction     iment transport during Hurricane conditions along the US
and been deposited offshore.                                     East Coast is a function of the water level relative to the fore-
                                                                 dune height (i.e. overwash occurs when this ratio is positive,
5.5   Storm erosion demand and offshore transport                else there is offshore transport). While this may be true at
                                                                 the peak water level, as the tide recedes and storm wave con-
The storm erosion demand during Debbie was estimated             ditions continue, erosion is focussed lower down the profile
from the beach profiles extracted from the pre-/post-storm       and sediment may be transported offshore. The result can be
lidar DEMs. Storm demand refers to the erosion that oc-          a mix of on- and off-shore transport even at sites inundated
curs to the upper beach during a storm event (typically above    at the peak water level (as was the case at Wilson Beach).
0 m AHD in Australia). It is an important parameter used for
the design of coastal setback. Here, the storm demand can        5.6   Beach recovery and implications for coastal
only be calculated above 2 m AHD because this was the limit            management
of the lidar data. However, beach profiles show that all ero-
sion occurred well above 2 m AHD (Fig. 8); therefore, vol-       Beach profile measurements taken 5 months after Debbie
umes should be comparable to those calculated to 0 m AHD         show very little, if any, beach recovery occurred over this pe-
in other studies.                                                riod. While the quality of the DGPS measurements was not
   The average storm demand at Midgeton Beach was                sufficient to derive volumes, their inclusion in Fig. 8 shows
15.6 m3 m, and at Conway and Wilson beaches it was               the profiles are very similar to those captured directly after
roughly half this (7.3 and 9.2 m3 m, respectively) (Table 6).    Debbie.
The lower volumes at Conway and Wilson beaches may be               This can be attributed to the wave climate of the region.
because these locations are afforded some protection from        Tropical cyclones often impact coastal areas that are equi-
easterly waves by Cape Conway, whereas Midgeton Beach is         librated with a low-energy, tide-dominated regime because
open to both easterly and southeasterly wave attack (Fig. 1).    of their latitude and small regional wind-wave climate. This
   These volumes are an order of magnitude smaller than          is particularly the case along the northern Queensland coast,
those of wave-dominated coasts (e.g. 150–250 m3 m is a typ-      where a significant amount of wave energy is dissipated over
ical range for New South Wales and southeastern Queens-          the Great Barrier Reef (Gallop et al., 2014). This is exempli-
land) but comparable with modelling studies of the Mackay        fied in the wave buoy record pre- and post-Debbie; prior to
coast, which suggest the 100-year ARI erosion volume is be-      Debbie, storm wave conditions (Hs ≥ 2 m) had not been ex-
tween 1 and 16 m3 m, depending on aspect (Mariani et al.,        ceeded since the start of January (3 months prior). Likewise,
2012). To our knowledge, this study represents the only set      after Debbie, it took over 3 months – to mid-June – to accu-
of observations of TC storm erosion demand for northern          mulate the same amount of wave power as was exerted over
Queensland.                                                      9 days during Debbie. It was at this point (June 2017) that
   Most profiles saw a net loss of sand above 2 m AHD (av-       the beach recovery surveys were undertaken.
erage 78 % loss, Table 6), suggesting that the eroded volume        The large energy difference that exists between modal and
was accumulated below (seaward of) this level. The excep-        cyclonic wave conditions in this region means TC erosion
tions were CB2 and CB3 at Conway Beach, which experi-            impacts have a permanent impact on the landscape and re-
enced a net gain above 2 m AHD, because the depositional         quire a management response to restore beach amenity and
lobe that accumulated at the toe of the upper beach extended     access. In some geomorphic settings natural rebuilding of the
into the surveyed portion of the profiles. This suggests that    frontal dune will occur over time; however, this may take a
at all study sites, sand transport was predominately offshore.   much longer period than between successive cyclones. For

www.nat-hazards-earth-syst-sci.net/18/2603/2018/                        Nat. Hazards Earth Syst. Sci., 18, 2603–2623, 2018
You can also read