NEVADA CHILDHOOD LEAD POISONING
PREVENTION PROGRAM BLOOD LEAD
TESTING AND RESPONSE PLAN 2020
←
→
Page content transcription
If your browser does not render page correctly, please read the page content below

NEVADA CHILDHOOD LEAD POISONING PREVENTION PROGRAM BLOOD LEAD TESTING AND RESPONSE PLAN 2020

i

Table of Contents
Writing Team ............................................................................................................................................... iv
Mission and Vision Statement ...................................................................................................................... 1
 Vision......................................................................................................................................................... 1
 Mission ...................................................................................................................................................... 1
Nevada at a Glance ....................................................................................................................................... 2
Preface .......................................................................................................................................................... 3
Pathways of Lead Exposure .......................................................................................................................... 6
 Age of Housing .......................................................................................................................................... 6
 Other Sources of Lead Exposure ............................................................................................................... 6
 Parent’s Occupation .............................................................................................................................. 7
 Imported Goods Contaminated with Lead ............................................................................................... 8
Risk Factors ................................................................................................................................................. 13
 Age .......................................................................................................................................................... 13
 Race and Ethnicity................................................................................................................................... 13
 Poverty .................................................................................................................................................... 14
 Refugee and Immigrant Populations ...................................................................................................... 14
Impacts of Lead Exposure ........................................................................................................................... 16
Blood Lead Testing in Nevada ..................................................................................................................... 18
 Screening Rates ....................................................................................................................................... 18
NvCLPPP Recommendations for Screening in Nevada ............................................................................... 18
 Point of Care Lead Testing ...................................................................................................................... 18
Nevada Makeup .......................................................................................................................................... 21
 Demographic Characteristics .................................................................................................................. 21
 Age of Housing ........................................................................................................................................ 22
 Geographic Areas of Priority ................................................................................................................... 22
 Nevada’s Lead Index ........................................................................................................................... 23
Childhood Lead Poisoning Public Awareness and Outreach....................................................................... 26
Responding to Lead-Exposed Children ....................................................................................................... 28
 Blood Lead Testing Surveillance and Response ...................................................................................... 28
 Response to Lead-Exposed Children ....................................................................................................... 28
References .................................................................................................................................................. 30

ii

Appendices.................................................................................................................................................. 37
 State Lead Index – Nevada...................................................................................................................... 37
 Carson City Map ...................................................................................................................................... 38
 Churchill County Map ............................................................................................................................. 39
 Clark County Maps .................................................................................................................................. 40
 Douglas County Map ............................................................................................................................... 43
 Elko County Map ..................................................................................................................................... 44
 Esmeralda County Map ........................................................................................................................... 45
 Eureka County Map................................................................................................................................. 46
 Humboldt County Map ........................................................................................................................... 47
 Lander County Map................................................................................................................................. 48
 Lincoln County Map ................................................................................................................................ 49
 Lyon County Map .................................................................................................................................... 50
 Mineral County Map ............................................................................................................................... 51
 Nye County Map ..................................................................................................................................... 52
 Pershing County Map.............................................................................................................................. 54
 Storey County Map ................................................................................................................................. 55
 Washoe County Maps ............................................................................................................................. 56
 White Pine County Map .......................................................................................................................... 58

List of Tables
Table 1. Percentage of households with children under six by jurisdiction ............................................... 18
Table 2. Blood lead levels of children by age from October 2018 to September 2019 .............................. 18
Table 3. Race/Ethnicity by jurisdiction........................................................................................................ 21
Table 4. Foreign-born populations by jurisdiction. ..................................................................................... 21
Table 5. Refugee populations by jurisdiction.............................................................................................. 21
Table 6. Percent of those in poverty by jurisdiction. .................................................................................. 22
Table 7. Age of housing by county. ............................................................................................................ 22
Table 8. Percent of homes with lead hazards by construction year. ......................................................... 23
Table 9. Lead index range by decile for Nevada’s zip codes, from least concern to highest concern....... 24
Table 10. Recommendations for follow-up and case management of children based on confirmed blood
lead levels. .................................................................................................................................................. 29

iii

List of Figures
Figure 1. Counties in Nevada ....................................................................................................................... 2
Figure 2. Peeling Lead Paint .......................................................................................................................... 6
Figure 3. Sources of Child’s Lead Exposure. .................................................................................................. 7
Figure 4. The Label on this Bottle of Ground Turmeric Warns about Lead Exposure .................................. 9
Figure 5. California Proposition 65 Warning Label ....................................................................................... 9
Figure 6. FDA Lead Action Levels for Ceramicware and hollowware ......................................................... 10
Figure 7. Traditional Bean Pot with over 9,00 PPM of lead outside and over 520,000 PPM of lead insid . 11
Figure 8. Dishware labeled as "Lead Free" despite containing lead ........................................................... 11
Figure 9. Children’s Bead Maze Toy with 528 PPM Lead in the Green....................................................... 12
Figure 10. Estimated IQ loss in US children ages 5-10 years of age at different blood lead levels. ........... 16
Figure 11. Target Zip Codes with Highest Lead Risk ................................................................................... 25

iv

 Writing Team
Editors:

 Erika Marquez, PhD, MPH

 Amanda Haboush-Deloye, PhD

 Erick López, MA

Writers:

 Erika Marquez, PhD, MPH

 Erick López, MA

 Amber Osterholt, PhD

 Natascha Kotte, BS

 Josh Huebner, BSPH

 Eddy Virgen, BSPH
v

Program Staff and Partners
University of Nevada Las Vegas
ERIKA MARQUEZ, PH.D. MPH ADVISORY BOARD
UNLV SCHOOL OF PUBLIC HEALTH
SHAWN GERSTENBERGER, PH.D.
UNLV SCHOOL OF PUBLIC HEALTH DUSTIN BOOTH, MPH, REHS
AMANDA HABOUSH-DELOYE, PH.D.
 CARSON CITY HEALTH AND HUMAN SERVICES
NEVADA INSTITUTE FOR RESEARCH AND POLICY
ERICK LÓPEZ, M.A. MICHAEL JOHNSON, PH.D.
NEVADA INSTITUTE FOR RESEARCH AND POLICY
BELEN CAMPOS-GARCÍA, B.S.P.H.
 SOUTHERN NEVADA HEALTH DISTRICT
NEVADA INSTITUTE FOR RESEARCH AND POLICY LISA LOTTRITZ, RN, MPH
NATASHA KOTTE, B.S.
NEVADA INSTITUTE FOR RESEARCH AND POLICY NEVADA DIVISION OF PUBLIC AND BEHAVIORAL
 HEALTH
Southern Nevada Health District
MATTHEW KAPPEL, MPH BETSY HUANG, MD, FAAP
OFFICE OF DISEASE SURVEILLANCE
 AMERICAN ACADEMY OF PEDIATRICS
KIMBERLY HERTIN
OFFICE OF DISEASE SURVEILLANCE RUTU EZHUTHACHAN, MD, MMM, FAAP
GREG LANG,
 HEALTH PLAN OF NEVADA
OFFICE OF INFORMATICS
MARGARITA DESANTOS, RN, BSN BEVERLY DALY-DIX, EDD
COMMUNITY HEALTH NURSING
SUSAN CRUTCHFIELD, CLARK COUNTY MEDICAL SOCIETY ALLIANCE
COMMUNITY HEALTH NURSING HEALTH INITIATIVE CHAIR
IGNACIO LEYCEGUI
 KATHY LAUCKNER, PH.D.
DEPARTMENT OF ENVIRONMENTAL HEALTH
 UNIVERSITY OF NEVADA LAS VEGAS
KIMBERLY HERTIN, MPH
OFFICE OF DISEASE SURVEILLANCE ERIN LYNCH, MPH
SARIE BARNNETT,
 NEVADA DEPARTMENT OF HEALTH AND HUMAN
OFFICE OF DISEASE SURVEILLANCE
MARLO TONGE, B.S.
 SERVICES, DIVISION OF HEALTHCARE FINANCING
OFFICE OF DISEASE SURVEILLANCE AND POLICY

Nevada Public Health Foundation
ROTA ROSASCHI, B.A.,M.S.
LAUREN RAACK, B.S.
1

 Mission and Vision Statement

Vision
Our mission is to promote a lead-safe home environment so that all Nevada children can achieve their
full potential.

Mission
The mission of the Nevada Childhood Lead Poisoning and Prevention Program (NvCLPPP) aims to reduce
the long-term health risk of childhood lead poisoning through prevention, education, and surveillance.
2

Nevada at a Glance

Nevada has over 2.8 million residents distributed across 17 counties. Three counties house most of the
population with over 2.2 million living in Clark County, over 445,000 in the Washoe area, and over
54,000 in Carson City. The rest of the population lives in rural/frontier areas. Nevada is home to over
217,000 children under six years of age. Three health districts serve the most populated areas of the
state, which include the Southern Nevada Health District located in Clark County, the Washoe County
Health District located in Washoe County, and the Carson City Health and Human Services located in
Carson City. The Nevada Division of Public and Behavioral Health oversees all the rural/frontier areas of
the state.
Figure 1. Counties in Nevada
3

Preface
Childhood lead poisoning is one of the most
 QUICK FACTS
preventable environmental health hazards in
history. While childhood lead poisoning rates
have decreased substantially since the 1970s,
mounting evidence suggests that chronic, low
level exposure can have long-lasting impacts on
children. It is imperative that we ensure that
children in our state have healthy environments
 217,331
in which they can live, learn, and play. Over
217,000 children under the age of 6 call Nevada
 Children under the age of
home but less than four percent are screened 6 live in Nevada
for lead making Nevada one of the lowest
screening states across the U.S. The Nevada
Childhood Lead Poisoning Prevention Program
(NvCLPPP) staff and the Advisory Committee
hope that stakeholders use this blood lead Less than
testing plan as guidance to prevent and address
local issues.
 4 percent
A Call to Action
In 2012, the Advisory Committee on Childhood
 are screened for lead
Lead Poisoning Prevention (ACCLPP) made
critical recommendations on how local
communities should address children with
elevated blood lead levels (EBLLs). Prior to the
updated recommendations, children were Nevada has one
considered to have EBLLs at 10 ug/dL which was
considered a “level of concern” at which county of the
or state health districts should mount an
environmental investigation to identify the
sources of lead exposure, reduce exposure, and lowest
develop a case management plan with medical
staff to monitor the reduction of lead in the screening rates across the
blood. However, based on recent literature, the
 United States
2012 ACCLPP lowered the blood lead reference
value to 5 ug/dL because there is sufficient
evidence that at this level children can suffer
from lower IQ scores, attention-related
behavior problems, and lower levels of
academic achievement (CDC, 2012a).

The Nevada Committee on Commerce and
Labor passed Senate Bill 90 in July 2019,
thereby amending the Nevada Revised Statute
4

442.700 to lower the reference value for an elevated blood lead level from 10 ug/dL to ≥ 5 ug/dL. It is
critical that young children are screened for lead exposure as effects may not be notable until children
reach school age and may disproportionately impact low-income children who are already at higher risk
for school-based challenges.

A recent study revealed that the negative effects of lead exposure (e.g., lower IQ scores and smaller
brain volume) where amplified in children from low-income homes relative to high-income homes due
to the interaction effect between lead exposure and household income (Marshall, Betts, Kan, McConnel,
Lanphear, and Sowell, 2020). According to the National Health and Nutrition Examination Surveys
(NHANES), 2.9 percent of preschoolers have EBLLs at 5 ug/dL representing nearly 535,000 children in the
US between the ages of 1 and 5 (AAP, 2016). The response to the new recommendations has varied by
jurisdictions – some have updated policies and procedure to respond to the new reference value while
others have made no changes.

Challenges in Blood Lead Screening in Nevada

Federal, state and local regulations have played a significant role in reducing childhood lead poisoning by
regulating the use of lead in specific products, such as paint and gasoline (Kemper, Cohn, Fant,
Dombkowski, & Hudson, 2005). Nevertheless, the potential for childhood exposure to lead remains high,
particularly due to the stability of lead in the environment, usage of lead in numerous industrial
applications and widespread use of lead-based paint in older housing. In attempts to mitigate effects of
childhood lead poisoning, many efforts have been initiated among schools of public health, public health
departments, and healthcare professionals comprising of primary and secondary prevention methods.

Screening of children for blood lead levels in the primary care setting has been a critical tool in identifying
lead-poisoned children. One problem arises, particularly in states in which screening rates are low.
According to Roberts et al. (2017), it is estimated that in Western states, including Nevada, 3x as many
children are underreported than are diagnosed (Roberts et al., 2017). Nevada has the second lowest ratio
of childhood lead poisoning ascertainment.

Two recent studies support these results. In one study evaluating BLL screening in Clark County, Nevada,
researchers found only five percent of children had been previously tested (Haboush-Deloye, Marquez, &
Gerstenberger, 2017a). In another study conducted in Clark County, Nevada, barriers to childhood blood
lead testing were identified.

Physicians who work with children six and under were surveyed about BLL testing practices, including
whether they adhered to Centers for Disease Control and Prevention (CDC) screening guidelines. The
study identified two major barriers to lead screening. First, a lack of adherence to CDC recommendations
for lead screening by local physicians, and the second major barrier identified was parental
noncompliance with doctor recommended BLL testing (Haboush-Deloye, Marquez, & Gerstenberger,
2017b).

A New Opportunity for Nevada

At present, surveillance data is sparse and makes it impossible to identify at risk-communities within
both urban and rural settings. Nearly 25 percent of homes in Nevada were built before the 1978 ban of
lead-based paint. Nevada is also home to one of the largest growing Hispanic minority populations –
which is often concentrated in segregated communities of low-income and older housing. Nevada also
5

has unique geography with two urban centers within 400 miles of each other while the rest of the state
is rural or frontier, including prominent mining towns. Recent research indicates that rural communities
may be at equal risk for lead exposure (Carrel et al., 2017).

The CDC grant offers the opportunity to strengthen the epidemiologic data to identify at risk-
communities, mitigate any health disparities in blood lead poisoning that have been identified in the
literature, and increase low-screening states. By using this data to better understand the population in
Nevada, at-risk children who may otherwise go untested can be identified and linked to vital resources.
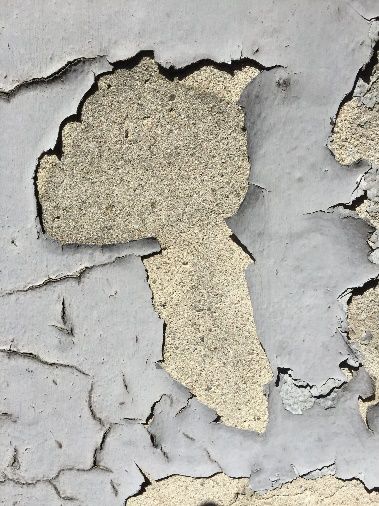
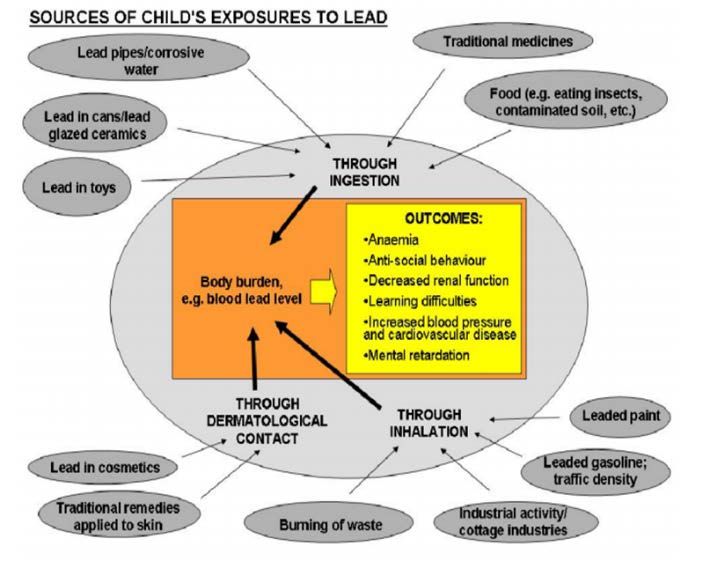
6

Pathways of Lead Exposure
The removal of lead-based paint and leaded gasoline from regular use during the 1970s led to a
significant decrease in average childhood blood lead levels by the early 1990s (Gilbert and Weiss, 2006).
Lead paint and dust that remain in older homes remain a primary source of lead exposure in the United
States (Lanphear et al., 1998). However, other sources of lead like dust along roadways from decades of
leaded gasoline use, cosmetics, and imported goods contribute to a substantial portion of elevated
blood levels in the U.S. (Mielke, 1999).

Age of Housing
Age of housing is the largest and most established risk factor for lead poisoning among children (HUD,
2011). Older homes have a higher likelihood of having lead in the building, and older homes with of
lower property value are more likely to have damaged paint than homes of a higher property value.
Lead hazards in older homes result from peeling, disintegrating, and chipping of lead paint, dust from
renovations and abatement that settles into the interior of older homes and contaminates surrounding
soil.
Figure 2. Peeling Lead Paint The Department of Housing and Urban Development
 (HUD) estimates that as of 2019, 24 million homes in
 the United States still have lead somewhere in the
 building (HUD, 2019). More than 34 percent of those
 households have a child under age six living in them
 (HUD, 2011). Children who live in older homes have
 higher mean blood lead levels than children who live in
 homes built after lead paint was banned (Kim et al.,
 2002). Children who live in houses with any lead can
 attain levels of lead in their blood as high as 20 µg/dL
 even without consuming lead-based paint chips (WHO,
 2010). Undue exposure to lead can cause adverse
health effects like decreased IQ and other neurodevelopmental challenges (Lanphear et al., 1998).

Dust from deteriorating paint and lead abatement during home renovations can become a source of
exposure in household dust and soil, increasing the risk of childhood lead exposure (Spanier et al.,
2013). Home renovation of houses where lead has been identified is significantly associated with
increased blood lead levels of children in the home (Spanier et al., 2013).

Other Sources of Lead Exposure
While the main source of lead exposure in the U.S. today is from deteriorating lead-based paint in older
housing, there are still many other pathways by which children can be exposed to lead (Figure 2). A
systemic review of the literature supports that atypical sources of exposure can lead to childhood lead
poisoning cases and require the expansion of screening techniques by pediatricians and medical providers
to identify children who may have an EBLLs (Grospe & Gerstenberger, 2008).

The variety of sources and pathways by which children can be poisoned makes no child immune to lead
poisoning. However, the burden isn’t equal with children of lower economic status, living in deteriorated
housing, often of ethnic minority (non-Hispanic Black and Mexican American children) status carry the
greatest burden (Sampson, 2016). Disparities by race/ethnicity and socioeconomic status persist despite
7

the overall decline in blood lead levels (BLLs) (Sampson, 2016). Figure 2. Sources of Child’s Lead Exposure.
Source: World Health Organization 2010

 Figure 3. Sources of Child’s Lead Exposure.

 Source: World Health Organization, 2010

Parent’s Occupation
Workers are exposed to lead through the production, use, maintenance, recycling, and disposal of lead
materials and products (OSHA, 2019). Workers in specific occupations such as demolition, smelting,
mining, radiator repair, and gun range work have been found to have elevated blood lead levels (OSHA,
n.d.). Children of lead-exposed workers have disproportionately higher BLLs when compared to other
children of non-lead exposed workers (Porter et al., 2015). This is largely attributed to “take home lead
dust” which can be brought from the job site to the home on the clothes, the body and hair, and in the
vehicles of workers, subsequently leading to increased lead levels in the home (CDC, 2009).

In a study of six families conducted by Maine’s Childhood Lead Poisoning Prevention Program (MCLPP), it
was found that “5 of the 6 family vehicles tested positive for lead dust with a median of 550 µg/ft2 for
driver/passenger seats (range: 49--2,100 µg/ft2) and a median of 1,570 µg/ft2 for driver/passenger floors
(range: 240--2,900 µg/ft2)” (CDC, 2009). In the same study of the five families, 2 of the 5 families’ homes
had lead dust in areas where family members removed and kept work clothes, including an entryway/deck
(110 µg/ft2), another entryway (1,200 µg/ft2), and a laundry room (40 µg/ft2). One nationwide study
estimated that 48,000 families have children under age 6 living with household members occupationally
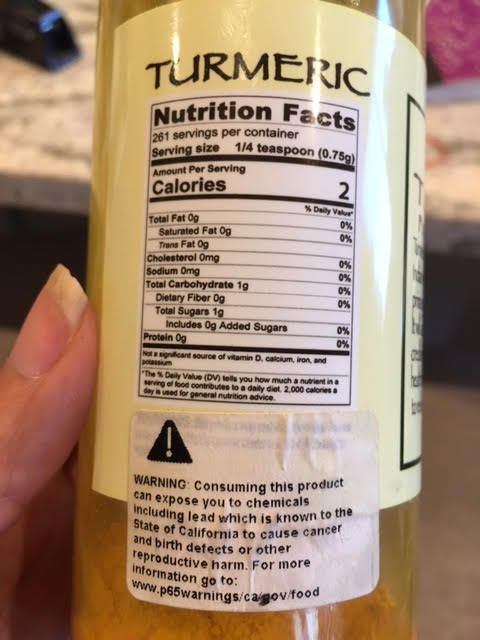
8

exposed to lead (Roscoe et al., 1999). In addition, it is estimated that more than 1.64 million workers in
the U.S. are exposed to up to 50 µg/m3 lead daily in the workplace (OSHA, 2012).

Imported Goods Contaminated with Lead
Traditional Medicines
Other sources of lead exposure in the U.S. come from imported goods contaminated with lead such as
certain cosmetics, ceramics, foods, and traditional folk remedies. Traditional cosmetics/medicines like
kajal, kohl, surma, and tiro have been used for millennia in North Africa, the Middle East, and the Indian
subcontinent to promote visual acuity and to soothe irritated eyes; however, these cosmetics/medicines
may contain more than 50 percent lead (CDC, 2012, 2013a; Parry and Eaton, 1991). For example, a
laboratory analysis of kohl found samples with a lead content greater than 85% (Jallad & Hedderich, 2005),
while tiro showed a lead content of 82.6 percent (CDC, 2012b). In one study, surma users had higher
average blood lead levels (29.6 ± 10.2 μg/dL) compared to non-surma users (4.9 ± 0.8 μg/dL; p < .001;
Goswami, 2013).

Some ayurvedic medicines from India and other South Asian countries have caused blood lead levels as
high as 112 µg/dL (CDC, 2004a). The rasa shastra branch of ayurvedic medicine, in particular, combines
herbs, metals, & minerals into medicines to treat gastrointestinal, cardiovascular, and respiratory
symptoms as well as infertility, diabetes, and teething (Prpic Majic, Pizent, Jurasovic, Pongracic, Restek-
Samarzija, 1996; Raviraja, Vishal Babu, Sehgal, Saper, Jayawardene, Amarasiriwardena, Venkatesh, 2010).
However, some rasa shastra medicines may contain up 200,000 μg/g of lead (CDPH, 2019).

Saper and colleagues (2008) found that rasa shastra ayurvedic medicines were more than two times as
likely to contain lead than non-rasa shastra ayurvedic medicines, 41% versus 17%, respectively, p = .007.
Additionally, Saper and colleagues (2004) found that 20% of ayuervedic medicines sold in Boston, MA
contained lead in excess of daily permissible limits. Furthermore, 21% of both US and Indian manufactured
ayurvedic medicines sold on the internet contained detectable levels of lead.

Another traditional remedy, litargirio, used among Latinos/Dominicans as a deodorant and folk remedy
can contain up to 36 percent lead content (CDC, 2005). Similarly, the fine yellow powder greta and the
bright orange colored azarcon are used throughout Latin America, but especially in Mexico, to treat upset
stomach, constipation, diarrhea, vomiting, and teething. These powders may also go by the name alarcon,
coral, luiga, maria luisa or rueda depending on country in Latin America (CDC, 2019). Greta may contain
up to 97 percent lead, while azarcon may contain up to 95 percent lead (CDC Work Group on Lead and
Pregnancy; National Center for Environmental Health, Division of Emergency and Environmental Health
Services, 2010). In some cases, greta is mixed with milk, sugar, and cooking oil to be incorporated into a
child’s milk or in tortilla mix (Gorospe & Gerstenberger, 2008).

Foods and Spices
Imported foods and spices may also contain excessive lead content. In March 2019 a blood lead test
revealed that a Las Vegas child had an elevated blood lead level due to lead tainted turmeric. The turmeric
was brought from Afghanistan by the child’s parents and was being given to the child for its medicinal
properties. The Environmental Investigator from the Southern Nevada Health District tested the turmeric
by XRF and found that it contained 15,000 PPM of lead.
9

In 2018-2019, numerous imported turmeric spices were found to be contaminated with lead. In many
cases, these products are not properly labeled. Figure 4 shows a label on the bottle of ground turmeric
that warns of potential lead exposure.

Figure 4. The Label on this Bottle of Ground The New York City Department of Mental Hygiene and Health
Turmeric Warns about Lead Exposure examined approximately 1,500 spices/foods and found that
 over 30 percent had lead concentrations that exceeded the
 allowable limit of 2PPM (Hore et al. 2019). The average lead
 content was higher in spices purchased abroad than in the US
 (66% versus 40%, p < .001; Hore et al. 2019). Seventy percent
 of the spices from the country of Georgia exceed the allowable
 lead limit (2 PPM) including Georgian saffron, svaneti salt,
 caraway, and adjika (Hore et al. 2019). The other countries
 with the greatest percentage of food products that exceeded
 the allowable lead limit included Bangladesh (54%), Morocco
 (48%), Nepal (30%), Pakistan (25%), and Mexico (18%).

 Lead has also been found in some tamarind candies imported
 from Mexico (CDC, 2002). Historically, some Mexican candy
 manufactures have had two versions of their product lines: one
 made for export to the US that meets FDA standards and one
 for sale in Mexico that contains excessive amounts of lead
 (Medlin, 2004).

California’s Proposition 65 requires consumer products, foods, and beverages that contain excessive lead
content to be properly labeled with the P65 warning label (Figure 5; Cox and Hirsch, 2019). Additionally,
in 2007 the Center for Environmental Health in California initiated legislation and monitoring that limited
the amount of lead in candies to 0.1 PPM. This legislation and subsequent litigation against several candy
manufactures resulted in a reduction of lead contaminated chili and tamarind candies in California from
45 percent2004 to 0 percent by 2013-2016 (Cox and Hirsch, 2019).

Figure 5. California Proposition 65 Warning Label Similarly, recent legislation in Mexico has
 established a program to monitor the level of
 lead in food, water, and consumer products
 (Tamayo-Ortiz, Sanders, Rosa, Wright,
 Amarasiriwardena, Mercado-Garcia,…Tellez-
 Rojo 2020). In 2018, retesting of 50 Mexican
 candies that initially tested positive for high
levels of lead 10 years prior, revealed that only 0.04% of those candies still tested positive for lead
(Tamayo-Ortiz et al., 2020). Among the two that tested positive, both were found to contain 0.1 PPM of
lead, the maximum allowable limit in Mexico and California (Tamayo-Ortiz et al., 2020). Although the
reduction of lead in candies in California and Mexico is promising news, Nevada has no such labeling
mandate for products that contain lead. As such, this is fertile ground for future policy change.
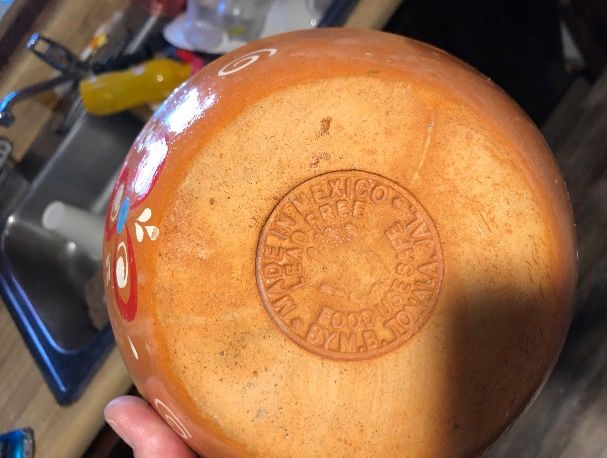
10

Ceramic Dishware
The U.S. Food and Drug Administration (FDA) regulates the sale of dishware and cookware that contains
hazardous substances such as lead. Ceramic dishware and cookware may contain lead in the glaze, paint
or clay. Lead from dishware can leach into foods and beverages (Centers for Disease Control, 2004). This
is most likely to occur when foods are highly acidic and when foods or beverages are stored in dishware
for long periods of time (Centers for Disease Control, 2004). Cracked or chipped dishware is a high risk
for lead leaching (Centers for Disease Control, 2004). Additionally, putting dishware in the microwave or
dishwasher speeds up deterioration, which can lead to greater lead leaching (Centers for Disease
Control, 2004). Dishware that exceeds the FDA action levels cannot be sold legally in the U.S. Figure 6
lists the various action levels for lead in dishware (Food and Drug Administration 2000).
Figure 6. FDA Lead Action Levels for Ceramicware and hollowware

Lead tainted ceramics have been found in the US, Latin America, Africa, Southern Europe, and the Middle
East (CDC, 2004b; Diaz-Ruiz et al., 2017; Romieu, Lacasana, & McConnell, 1997;). The FDA requires
decorative or ornamental ceramicware with extractable lead to be properly labeled so that the item is not
used for food or beverage handling purposes (Food and Drug Administration 2010). However, these
products often bear a stick-on label or bear a message on the packaging— and not the item itself (Food
and Drug Administration 2010). As a result, once the sticker or packaging are removed, the items often
gets used for food and beverage handling purposes.

For example, one Latin American ceramic bean pot in the possession of NvCLPPP was tested with X-ray
fluorescence (XRF) and found to have over 520,000 parts per million (52%) lead content in the inner glazed
cooking surface (Figure 8). This item has substantial deterioration on the inner glazed surface from
extensive use. Since the 1990s, studies in Mexico have linked lead-glazed ceramics to elevated blood levels
(Lynch, Elledge, and Peters, 2008). Many of these same ceramics continue to be used in the US. Valles-
11

Medina and colleagues (2014) found that 81% of glazed pots sold in a Mexico-US border tested positive
for the presence of lead.
Figure 7. Traditional Bean Pot with over 9,00 PPM of lead outside and over 520,000 PPM of lead inside

 Given greater consumer
 awareness and concern
 about lead in ceramics,
 some manufacturers
 market ceramics as “lead
 free” despite that they
 contain leachable lead. The
 FDA has confirmed these
 reports and established the
 action level guidelines for
 lead leaching (Food and
 Drug Administration 2010).

If lead leaching exceeds the action levels, the FDA may Figure 8. Dishware labeled as "Lead Free" despite
consider the use of the term “Lead Free” to be false and containing lead
misleading (Food and Drug Administration 2010). FDA’s
guidance documents do not establish legally enforceable
responsibilities, instead this guidance should be viewed as
recommendations unless statutory requirements are cited
(Food and Drug Administration 2010). In essence, dishware
labeled as “lead free” may not truly be lead free. XRF testing
revealed that one ceramic bowl labeled as “lead free” in the
possession of NvCLPPP contained 695 PPM of lead. Per the
FDA, as long as the dishware does not leach excessive lead,
the use of “lead free” labeling is permissible.

Toys
Lead can also be found in the paint, metal, and plastic parts of some toys and toy jewelry, particularly
those made in other countries, as well as antique toys and collectibles (CDC, 2019). According to the
Consumer Product Safety Commission Act of 2008, the surface of children’s products must not contain
more than 0.009 percent (90 parts per million) of lead in paint or any similar surface coatings (CPSC, 2008).
One interlocking plastic brick child’s toy that was XRF tested by NvCLPPP was found to contain 2,893 part
per million of lead, well exceeding the 90 PPM limit. Young children are at risk for ingestion and absorption
of lead from toys and toy jewelry due to their tendency to engage in hand-to-mouth activity (Schnur &
John, 2018).

Prior to the CPSC Act of 2008, children’s toys could not exceed 600 PPM of lead (Federal Register 2009).
An analysis of toys from day care centers in Las Vegas revealed that about 5% of the sampled plastic toys
contained lead in excess of 600 PPM (Greenway & Gerstenberger, 2010). The number of toys with
excessive lead content would have been higher had the analysis compared toys against the current 2008
CPSC standard. Notably, toys made with PVC plastic and/or yellow colorant were more likely to contain
12

Figure 9. Children’s Bead Maze Toy with 528 PPM Lead in the Green excessive concentrations of lead (Greenway
Wire, exceeds the 2008 CPSC Lead Limit of 90 PPM
 & Gerstenberger, 2010). Another study from
 China found that toys sold by unorganized
 sellers (akin to Ebay), cheaper and poorer
 quality toys, toys intended for infants, and
 toys with small sales volume tended to have
 greater lead concentrations (Shen, Hou,
 Zhang, Wang, Zhang, Shi & O’Connor, 2018).

 Why is lead in traditional medicines, spices,
 cultural items, and toys?
 Some food products may inadvertently be
 contaminated during the manufacturing or
 packaging process (Food and Drug
 Administration [FDA], n.d.). For instance, the
 grinding wheel used to ground spices may
contain lead parts, which subsequently may contaminate spices with lead. Additionally, some herbs and
spices may unintentionally be planted in lead contaminated soil (Angelon-Gaetz, Klaus, Chaudhry & Bean,
2011). Tamarindo pulp may be stored in leaded glazed ceramics, which thereby leaches lead into the pulp
(Lynch et al. 2000; Meyer et al. 2008; Diaz-Ruiz et al. 2016). In other cases, lead may be leached from the
individual colorful plastic packaging of tamarind candies (Lynch, Boatright & Moss, 2000).

In other instances, lead is deliberately added to products. In the case of Ayurvedic medicine and
kohl/surma, lead is added as users believe that it has unique medicinal properties (Tiffany-Castiglion,
Barhoumi & Mouneimne, 2012). Yet in other instances, lead is intentionally added to turmeric and other
colorful spices to increase weight for sale and to make colors more vibrant (Cowell, Ireland, Vorhees &
Heiger-Bernays, 2017). Lead is regularly used in plastic toys as it softens plastic, making it more flexible so
that it can go back to its original shape (Centers for Disease Control 2019). Additionally, lead stabilizes
molecules in plastic from heat (Centers for Disease Control 2019). Furthermore, lead is used to plastics
and paint of children’s toys to help create vibrant colors (Centers for Disease Control 2019).
13

Risk Factors
Beyond the environmental risk factors, individual host factors are also associated with elevated blood
lead levels. Blood lead data from the National Health and Nutritional Examination Surveys (NHANES)
have been used since 1976 to describe children with increased blood lead levels. The most recent
analysis indicated that differences in mean blood lead levels persist between income groups and
racial/ethnic groups. Children at highest risk for elevated mean blood lead levels are non-Hispanic
Blacks, children from poor families, and children who live in housing built before 1950 (CDC, 2013b).

Age
Children aged six months to three years of age are more susceptible to increased blood lead levels because
of their lack of control over their environment, their behaviors that may expose them to lead dust and
lead coated items, and their physiology (Lanphear et al., 2002; ATSDR, Tarragó & Brown 2017). Notably,
children eat more food and breath in more air per kilogram; ATSDR, 2017). Compared to adults, children
are able to absorb 4 to 5 times more lead due to the efficiency of their stomachs (WHO, 2019). Conversely,
once this lead is absorbed, children’s livers are less efficient at removing lead from the body. Children
under age three are at higher risk of exposure due to their proximity to the ground, and their inclination
for placing things in their mouth, exposing them to dust and soil that may be contaminated with lead.
Young children are especially susceptible to the negative effects of lead exposure because of their ongoing
neurological development (Lanphear et al., 2002). Once lead enters the body, it enters the blood stream
and has the opportunity to cross the blood-brain barrier and reach the brain (Buchner et al., 2009). Within
the brain, lead-induced damage in the prefrontal cerebral cortex, hippocampus, and cerebellum can lead
to a variety of neurological disorders and behavioral problems. Among children with lead exposure, lead
levels are known to peak around age two.

Race and Ethnicity
Among children ages, one through five, elevated blood lead levels are associated with race and ethnicity.
Non-Latino Black children have higher average blood lead levels compared to non-Latino White children
(1.8 vs. 1.3 µm/dL, respectively; CDC, 2013). Although overall blood lead levels have decreased since the
1970s, the racial disparity in elevated blood lead levels persist over time, especially between Black and
White children (White, Bonilha & Ellis, 2015). For non-Latino Blacks elevated BLLs are inexorably linked to
the legacy of racial residential segregation and discriminatory lending practices (i.e. redlining) that
contributed to the devaluation of Black-owned properties and the subsequent financial strain to maintain
said properties resulting from lost wealth (Sampson and Winter, 2016).

Children living in households receiving housing assistance through federal housing assistance programs
are at high risk of lead poisoning, with black children disproportionately represented among those
affected. There are about 4.3 million housing units in the assistance program. In 2016, the US Department
of Housing and Urban Development (HUD) identified 57,000 federally assisted housing units with
documented lead hazards and 450,000 housing units occupied by children containing potential lead
hazards (i.e., pre-1978 lead-based paint; Benfer, 2017). According to the most recent data from the
American Healthy Homes Survey, African American households have significantly more lead-based paints
(45.6%) compared to White households (32%) and African American households were also more likely
(28%) to have lead-based paint hazards than White households (20%) (Cox, Dewalt, O'Haver, & Salatino,
2011).
14

Compared to the general population, a higher percentage of Latino children have elevated blood lead
levels (Brown and Longoria, 2010). Unlike other populations, exposure to lead among Latinos is multi-
dimensional and incorporates environmental, cultural, and social dimensions (Brown and Longoria, 2010).
Among some of the social dimensions, ethnic subpopulation, generation status (i.e., first-, second-, third-
generation), nativity (i.e., US-born versus foreign-born), and length of time in the US are associated with
blood lead levels. With regard to ethnic subpopulation, 2.7% of Puerto Ricans, 1.6% Mexican-Americans,
and 0.9% of Cubans have been found to elevated BLLs (>25 µg/dL; Carter-Pokras, Prikle, Chavez, and
Gunter, 1990). With regard to generational status, first-generation Mexican-American children had higher
BLLs compared to third-generation Mexican-American children (Morales, Gutierrez, and Escarce, 2005).
Similarly, Mexican-born children had higher BLLs compared to US-born Latino children (20% vs. 7%,
respectively; Snyder, Mohle-Boetani, Palla, and Fenstersheib, 1995). Lastly, greater time spent in the US
is associated with lower BLLs (Rothenberg, Manalo, Jiang, Khan, Cuellar, Reyes, et al., 1999).

Poverty
Like racial disparities, socioeconomic disparities in elevated blood lead levels also persist over time.
Approximately 1.1 million homes that still have lead somewhere in the building are considered low-
income (HUD, 2011). Children living in low-income housing were more likely to have elevated blood lead
levels compared to children living in homes with higher property values (Kim et al., 2002). This suggests
that homes with a lower value may have more deteriorated paint, increasing risk factors for lead exposure
(Kim et al., 2002). Children enrolled in WIC and Medicaid have been found to be most at risk for having
elevated blood lead levels compared to those not enrolled in these programs (Aoki & Brody, 2018).

Refugee and Immigrant Populations
Refugee children arriving in the United States have increased rates of elevated blood lead levels at their
time of arrival. Overall, foreign-born children tested for lead poisoning are five times more likely to have
an elevated blood lead level than children born in the U.S. (Tehranifar et al., 2008). Additionally, newly
arrived refugee children ages 1-5 years are 10 times more likely to have elevated blood lead levels than
same-aged children in the general U.S. population (AAP, 2019). Some subgroups of refugees have seen
elevated rates up to fourteen times that of the general U.S. population (CDC, 2019). Potential lead
exposure risks for refugee children include products like leaded gasoline, use and manufacture of
ammunition, industrial emissions, and use of lead-containing products like food, ceramics, and traditional
medicines.

In particular, African refugees from Kenya, the Democratic Republic of Congo, and Somalia tend to have
high BLLs stemming from pre-settlement exposure such as lead-based paint in dwellings and
environmental inequalities such as the improper disposal of lead-acid batteries (Shakya and Bhatta, 2019).
Asian refugees from Nepal, Thailand, Burma, and India have high BLLs from pre-settlement exposures,
which have been linked to surma/kajal/kohl use, consumer products, and lead-based paint in dwellings
(Shakya and Bhatta, 2019). Lastly, Middle Eastern refugees from Iraq and Afghanistan tend to have
elevated BLLs from pre-settlement exposures linked to leaded gasoline and kohl/kejal (Shakya and Bhatta,
2019).

In addition to pre-settlement exposure, refugee children are at a risk of lead poisoning post-resettlement
due to living older, urban housing and environmental inequalities stemming from lack of funding,
legislation, and advocacy (Borsuk, 2019). Many children who come to the United States already exposed
to lead in their native countries may continue to be exposed to lead due to contamination in their new
15

surroundings and use of imported goods. Importantly, pre- and post-settlement lead exposure in refugee
populations is further compounded by malnourishment, as deficiencies of nutrients like calcium and iron
allow greater uptake of lead into the body (Mahaffey, 1995).
16

Impacts of Lead Exposure
Health effects resulting from lead exposure range on a continuum depending on the time and
intensity of exposure. Children are more susceptible to the effects of lead because they absorb lead
at a higher rate than adults and are most susceptible during the critical years of development from
birth to five years of age. Blood lead levels over 40 µg/dL can lead to renal failure and nephropathy,
while blood lead levels above 100 µg/dL can result in vomiting, encephalopathy, and death (AAP,
2016; WHO, 2010).

Evidence continues to build that there is no Figure 10. Estimated IQ loss in US children ages 5-10 years of age at
safe level of lead in the blood. Recent studies different blood lead levels.
have demonstrated that chronic, low-level lead
exposure (
17

greater occurrences of violent and non-violent crimes (Boutwell, 2016). Furthermore, even low
exposure to lead can lead to elevated blood pressure and increased rates of hypertensive events like
heart disease, strokes, and cardiovascular episodes (WHO, 2010). Lastly, low-level lead exposure has
been linked to greater mortality from cardiovascular disease and ischemic heart disease (Lanphear,
2018).
18

Blood Lead Testing in Nevada
Screening Rates
Nevada has 217,331 children under six according to the 2013-2017 Census – five-year estimates. The
percentage of children across various counties and rural areas range from 31-33 percent (Table 1).
Screening rates from October 1, 2018, to September 30, 2019, for the entire state equal 7,971 children
screened for lead indicating less than 4 percent of all Nevada children are tested. The majority of blood
test fall below 5 ug/dL. However, one severe limitation with reported data has been identified: due to
laboratory reporting limits, many results do not indicate an absolute blood lead value and are often
reported as
18

NvCLPPP Recommendations for Screening in Nevada
Current, screening rates for blood lead levels in children is low making it difficult to ascertain the extent
lead poisoning in Nevada. Therefore, the NvCLPPP recommend universal screening as a method to
adequately assess the epidemiological data. However, at a minimum the NvCLPPP recommends that:

Providers should screen Medicaid eligible children when the child:

 ● Reaches 12 and 24 months of age, respectively; or
 ● At least once before the child reaches 6 years of age

Providers should screen children who are symptomatic or if a potential lead exposure is identified,
regardless of a child’s age.

Providers should screen refugee children ages 6 months to 16 years within 90 days of arrival. Given the
evidence of lead exposure post-resettlement in the US, lead screening should occur again after 3-6
months of placement in a permanent residence, regardless of the results of the initial lead test (CDC,
2019).

Providers of non-Medicaid eligible children should conduct a lead risk evaluation using the Childhood
Lead Risk Questionnaire (CLRQ) to determine the risk of potential exposure during a health care visit.
The following CLRQ was adapted from the Illinois Department of Public Health (State of Illinois, n.d.)
Providers should test:

 ● Children through six years of age, beginning at 6 months
 o If all responses are “No” re-evaluate at every well-child visit or more often if deemed
 necessary
 o If any response is “YES” or “Don’t Know”, obtain a blood lead test.

Blood lead testing can be conducted via capillary or venous methods and should be reported as per NRS
442.700 https://www.leg.state.nv.us/NRS/NRS-442.html#NRS442Sec700. As with other health issues
for which screening is appropriate, blood lead screening is more acceptable when it is less invasive
(Boreland et al., 2015). As such, parents be more amendable to screening their children via the capillary
method over the venous blood draw, when the option is available.

Point of Care Lead Testing
Past evaluations conducted by NvCLPPP have identified barriers to patient compliance with lead test
requisitions (Haboush-Deloye, Marquez, and Gerstenberger 2017). Offsite lead testing in particular
poses a barrier to at-risk populations as it requires access to transportation and additional time for a
separate appointment. In contrast, point of care (POC) lead testing reduces barriers, increases patient
compliance, and has been found to be an effective and efficient method to increase blood lead level
testing rates (Gettens and Drouin, 2019; Haboush-Deloye, Marquez, and Gerstenberger 2017; Maryland
Department of Health and Mental Hygiene, 2014).

Another barrier to lead testing is that parents tend to be concerned about the pain from the traditional
venipuncture blood draw. In contrast to this method, POC capillary lead testing instruments use the less
painful finger prick method to collect as little as two drops of blood (Advisory Committee for the
Childhood Lead Poisoning Prevention Program CDC, 2013). Another benefit of the POC capillary testing
instruments is that they can provide rapid results— in as little as 3 minutes (Advisory Committee for the
19

Childhood Lead Poisoning Prevention Program CDC, 2013). Overall, POC lead testing instruments may
reduce some of the largest barriers to lead testing in populations that are at-risk for lead exposure.

In 2004, Megellan Diagnostics developed a POC lead testing instrument with the CDC known as the Lead
Care II (Gettens and Drouin, 2019). The Lead Care II is the only Food and Drug Administration (FDA)
approved POC lead testing instrument in use in the US today (Maryland Department of Health and
Mental Hygiene, 2014). The FDA and the CDC have determined that this instrument is simple to operate
with little risk of error (Gettens and Drouin, 2019). As such, the Lead Care II is the only POC blood lead
testing instrument with a Comprehensive Laboratory Improvement Amendments (CLIA) waiver
certificate (Gettens and Drouin, 2019).
20

 Childhood Lead Poisoning Risk Questionnaire
 The CLPRQ should be completed during a health care visit for children under 6 years of age.

 A blood lead test should be performed on children:

 ● with any “Yes” or “Don’t Know” response
 ● living in a high-risk ZIP code area
 ● all Medicaid-eligible children should have a blood lead test prior to 12 months of age and 24
 months of age. If a Medicaid-eligible child between 36 months and 72 months of age has not
 been previously tested, a blood lead test should be performed.

 If responses to all the questions are “No”:

 ● re-evaluate at every well child visit or more often if deemed necessary

 Child’s name: ___________________________________________________ Today’s date:
 ______________

 Age: ______________ Birthdate: __________________________ Zip Code: ______________________________

Respond to the following questions by circling the appropriate answer. RESPONSE
1. Is this child eligible for or enrolled in Medicaid, Head Start, or WIC? Yes No Don’t Know
2. Does this child have a sibling with a blood lead level of 5 ug/DL or higher? Yes No Don’t Know
3. Does this child live in or regularly visit a home built before 1978? Yes No Don’t Know
4. In the past year, has this child been exposed to repairs, repainting or renovation of a home
 built before 1978? Yes No Don’t Know
5. Is this child a refugee or an adoptee from any foreign country? Yes No Don’t Know
6. Has this child ever been to Mexico, Central or South America, Asian countries (i.e., China or
 India), or any country where exposure to lead from certain items could have occurred
 (for example, cosmetics, home remedies, folk medicines or glazed pottery)?
 Yes No Don’t Know

7. Does this child live with someone who has a job or a hobby that may involve lead (for
 example, jewelry making, building renovation or repair, bridge construction, plumbing,
 furniture refinishing, or work with automobile batteries or radiators, lead solder, leaded
 Yes No Don’t Know
 glass, lead shots, bullets or lead fishing sinkers)?
8. At any time, has this child lived near a factory where lead is used (for example, a lead
 smelter or a paint factory)? Yes No Don’t Know

9. Does this child reside in a high-risk ZIP code area? (see reverse side of page for list) Yes No Don’t Know

 If there is any “Yes” or “Don’t Know” response a blood lead test is not needed if both of the following apply

 ● the child has proof of two consecutive blood lead test results (documented below) that are each less than
 5 mcg/dL (with one test at age 2 or older), and
 ● there has been no change in the child’s living conditions

 Test 1: Blood Lead Result:____ug/dL Date:________ Test 2: Blood Lead Result: ____ug/dL Date:
21

Nevada Makeup
Demographic Characteristics
Nevada is as diverse in its landscape as it is in its people. Tables 3-6 highlights the demographic
characterizes in each county by race/ethnicity, foreign-born populations, refugees and those living in
poverty. Nevada’s Hispanic population ranks 14th largest in the nation with over 789,000 people
comprising 28% of the State’s population (Pew Research Center, 2014). Hispanic children represent
10.5% of children under five living in Nevada (Tuman, Damore, Agrada, 2013). Nevada has a large
foreign-born population, particularly those with who are not U.S. citizens.
Table 3. Race/Ethnicity by jurisdiction.

 Race/Ethnicity
 Clark Washoe Carson City Rural
 African American/Black 12.5% 2.1% 1.0% 1.6%
 American Indian/Alaska Native 0.6% 1.7% 2.5% 4.0%
 Asian 6.8% 4.3% 1.7% 0.7%
 Hispanic/Latino 43.1% 37.5% 39.3% 27.3%
 Caucasian/White 54.9% 73.0% 70.8% 82.4%
 Native Hawaiian/Pacific Islander 0.8% 0.8% 0.2% -0.2%
 Other 14.5% 9.2% 17.0% 6.0%
 Multiple 9.9% 9.0% 6.8% 6.4%
 Source: U.S. Census Bureau. (2018) 2013-2017 American Community Survey 5-Year Estimates
 Retrieved from http://factfinder.census.gov

Table 4. Foreign-born populations by jurisdiction.

 Foreign-Born Population
 Clark Washoe Carson City Rural
 Percent Foreign Born Population 22.3% 14.4% 11.2% 7.6%
 Percent of Foreign-Born Population 51.9% 52.1% 59.7% 58.3%
 that are not U.S. Citizens
 Source: U.S. Census Bureau. (2018) 2013-2017 American Community Survey 5-Year Estimates
 Retrieved from http://factfinder.census.gov

Table 5. Refugee populations by jurisdiction.

 Refugees
 Clark Washoe Carson City Rural
 Number of Refugees Resettled 2011 - 2015 8380 0 0 0
 Number of Refugees Resettled 2016 3128 40 0 0
 Number of Refugees Resettled 2017 1295 32 0 0
 Source: Southern Nevada Catholic Charities
You can also read