Machiavellian Strategist or Cultural Learner? Mentalizing and learning over development in a resource sharing game - Harvard ...
←
→
Page content transcription
If your browser does not render page correctly, please read the page content below
Machiavellian Strategist or Cultural Learner?
Mentalizing and learning over development in a resource sharing
                             game
                                   Baimel, Adam*
            Department of Psychology, Health and Professional Development
                             Oxford Brookes University
                              *abaimel@brookes.ac.uk
                 Juda, Myriam                                       Birch, Susan
            Department of Psychology                        Department of Psychology
             Simon Fraser University                       University of British Columbia
                                     Henrich, Joseph*
                         Department of Human Evolutionary Biology
                                    Harvard University
                                 *henrich@fas.harvard.edu
                                            January 29, 2021

                                                  Abstract
     Theorists have sought to identify the key selection pressures that drove the evolution of our species’
 cognitive abilities, life histories and cooperative inclinations. Focusing on two leading theories, each capa-
 ble of accounting for many of the rapid changes in our lineage, we present a simple experiment designed to
 assess the explanatory power of both the Machiavellian Intelligence and the Cultural Brain/Intelligence
 Hypotheses. Children (aged 3-7 years) observed a novel social interaction that provided them with be-
 havioral information that could either be used to outmaneuver a partner in subsequent interactions or
 for cultural learning. The results show that, even after four rounds of repeated interaction and some-
 times lower payoffs, children continued to rely on copying the observed behavior instead of harnessing
 the available social information to strategically extract payoffs (stickers) from their partners. Analyses
 further reveal that superior mentalizing abilities are associated with more targeted cultural learning—the
 selective copying of fewer irrelevant actions—while superior generalized cognitive abilities are associated
 with greater imitation of irrelevant actions. Neither mentalizing capacities nor more general measures
 of cognition explain children’s ability to strategically use social information to maximize payoffs. These
 results provide developmental evidence favoring the Cultural Brain/Intelligence Hypothesis over the
 Machiavellian Intelligence Hypothesis.

                                                       1
1 1 Introduction
2 What are the origins and nature of human sociality and social psychology, and how can we explain this
3 from an evolutionary perspective? Unraveling this puzzle is challenging because evidence from paleontology,
4 archaeology and genetics suggest that our lineage has transformed substantially over the last few million
5 years, including a roughly 3-fold increase in brain size (Bailey and Geary, 2009; Schoenemann, 2006), greater
6 reliance on tools, and a substantial shift in our life history with the emergence of middle childhood and a
7 long post-reproductive period prior to senescence (Boyd and Silk, 2012). Accompanying these rapid changes
8 were energetically costly modifications to the female pelvis, permitting the birthing of large-headed infants,
9 and a reduction in the length of gestation that made human births relatively premature from the perspective
10 of other primates (Boyd and Silk, 2012). Because of the speed, magnitude and fitness costs of these genetic
11 changes, current theorizing focuses on identifying the ‘autocatalytic’ or ‘runaway’ evolutionary processes
12 responsible. Focusing on the two primary hypotheses capable of producing the requisite auto-catalytic
13 evolutionary dynamics, the Machiavellian Intelligence Hypothesis (Byrne and Whiten, 1988; Whiten and
14 Byrne, 1997) and the Cumulative Cultural Brain Hypothesis or Cultural Intelligence Hypothesis (hereafter
15 collectively labeled the “Cultural Hypothesis”), we tested the psychological implications of these two theories
16 among 3- to 7-year-old children. Our results support the Cultural Hypothesis (Whiten and van Schaik, 2007;
17 Muthukrishna and Henrich, 2016; Henrich, 2015b; Laland, 2017; Boyd, 2018; Gavrilets and Vose, 2006; van
18 Schaik and Burkart, 2011), which proposes that cultural evolution generated an ever-increasing body of
19 adaptive learned information that created selection pressures for bigger brains that were better equipped for
20 cultural transmission. Meanwhile, we find little support for the formally modeled version of the Machiavellian
21 Intelligence Hypothesis (McNally and Jackson, 2013), which when applied to humans proposes that our
22 cognitive abilities, along with other anatomical changes, were driven by an arms race in strategic social
23 reasoning.
24 2 Theoretical Framework
25 How can we account for our species’ social psychology, sophisticated cognitive abilities, including our hy-
26 pertrophied capacity for mentalizing, and our unique patterns of life history (Henrich, 2015b)? Although
27 many ideas have been proposed, few can account for the rapid and concordant changes in our species’ brains,
28 cognition and life history. Here, we focus on two versions of the Social Brain Hypothesis (Humphrey, 1976)
29 that are capable of producing the requisite auto-catalytic evolutionary dynamics and have been clearly laid
30 out in formal evolutionary models. Both approaches aim to explain the variation in the cognitive abilities
31 and computational processing power (captured by neuron number or more crudely by brain size) among
32 primates in general (Herculano-Houzel, 2019). Crucially, both approaches can be extended to supply the
33 evolutionary feedback dynamics necessary to explain the rapid expansion of brains and cognitive abilities in
34 the human lineage. The leading version of the Social Brain Hypothesis, which we label the Machiavellian
35 Intelligence Hypothesis (for clarity), proposes that big brains and sophisticated cognitive abilities result from
36 the selection pressures for strategic thinking applied to managing relationships in larger, or more intensely
37 social, groups (Byrne and Whiten, 1988; Whiten and Byrne, 1997; Dunbar, 1998). Favored individuals,
38 in this view, are better able to track and strategically deploy information, including about third-parties,
39 regarding the strategies or choices of others. These psychological abilities allow them to better trick, ma-
40 nipulate, and deceive others, as well as to sustain longer-term alliances or partnerships. In this view, the
41 complexity of primate social life is driven by some external pressure, like predation (Dunbar and Shultz,
42 2007). For the human case, the required runaway dynamics arise from an ever-escalating social competition
43 in strategic thinking in which selection favors competitors who can reason one step farther than others–as
44 in the backward or forward induction required of agents in standard game theory (Trivers, 1971; Binmore,
45 1991). One potential reason why this runaway social competition occurred in the human lineages, but not
46 in other species, may be due to intergroup competition, where members of the same species became poten-
47 tially dangerous predators (Bailey and Geary, 2009). To facilitate the application of strategic reasoning in
48 social interactions — game theoretic thinking — this view holds that humans have evolved greater abilities
249 to represent others’ mental states (i.e., their beliefs and preferences) — mentalizing — and employ these
50 abilities to exploit or manipulate conspecifics (e.g., Byrne and Whiten, 1991).1
51 By contrast, the Cultural Hypothesis proposes that combinations of individual and social learning gen-
52 erate a pool of adaptive non-genetic information, which may take many forms including foraging skills,
53 food preferences, tool-using techniques, communicative signals, ally preferences, or socially-strategic tactics
54 (Muthukrishna and Henrich, 2016; Whiten and van Schaik, 2007; Gavrilets and Vose, 2006; Reader et al.,
55 2011; Henrich, 2015b; Street et al., 2017; Laland, 2017; van Schaik and Burkart, 2011).2 The emergence of
56 this pool of adaptive information creates selection pressures favoring brains that are better able to acquire,
57 store, organize and re-transmit this body of fitness-enhancing information. Applied to the human lineage,
58 our ancestors crossed a theoretical threshold in which adaptive know-how and preferences could substan-
59 tially accumulate and accelerate over generations. This further increased the selection pressure for brains
60 that were better able to acquire, store, organize and re-transmit this information. The better at cultural
61 learning human ancestors became, the more rapidly cultural evolution could accumulate large pools of adap-
62 tive know-how, and the greater the selection pressures became on genes for building brains that were better
63 able to tap into this distributed information. Here, mentalizing evolved in order to improve cultural learning,
64 to better extract knowledge, motivations, beliefs, intentions and strategies, from other’ minds. Moreover,
65 mentalizing capacities for making inferences about others knowledge-states also likely supported teaching,
66 communicative cuing and pedagogy (Hoehl et al., 2014; Kline, 2015; Skerry et al., 2013; Ho et al., 2017;
67 Csibra and Gergely, 2011). By this account, better mentalizers should be more selective in their learning,
68 and more attuned to accurate copying; for example, good mentalizers should be better able to copy inten-
69 tional over incidental or accidental behaviors. Indeed, while non-selective imitation (‘overimitation’) can be
70 a good cultural learning strategy that ensures that all key behaviours are copied (e.g., Chudek et al., 2016;
71 Hoehl et al., 2019)—learning may be made more efficient by selectively distinguishing the necessary from
72 the irrelevant. Superior mentalizing may equip learners with the capacity to be more selective, in part as it
73 helps learners figure out what is necessary and what is not (e.g., Brosseau-Liard et al., 2015).
74 The distinct psychological implications of these two theories are important because they otherwise make
75 similar predictions about other relationships, such as those between sociality, computational power (neuron
76 number; Herculano-Houzel, 2019), and breeding patterns (Muthukrishna et al., 2018; Dunbar and Shultz,
77 2007; McNally et al., 2012; McNally and Jackson, 2013; Fox et al., 2017; Street et al., 2017). And, although
78 both approaches do emphasize the importance of our species’ mentalizing or ‘mind-reading’ abilities, they
79 propose that these mentalizing abilities will be put into primary service in quite different ways. Specifically,
80 the Machiavellian Intelligence Hypothesis holds that humans readily develop the ability and motivation to
81 out-smart others, by out-mentalizing them, especially in competition for desirable resources. By contrast, the
82 Cultural Hypothesis proposes that mentalizing abilities will first develop for, and be deployed most commonly,
83 in the service of cultural learning, not primarily for strategically out-witting others. The empirical question is:
84 do children initially put their mental abilities to work in learning from others or to exploiting their opponents
85 for personal gain? If either or both of these selection pressures were key drivers in human evolution, we should
86 be able to detect them in contemporary human cognition and decision-making (Bjorklund and Pellegrini,
87 2000; Barrett et al., 2014).
88 Taking advantage of the gradual development of prosociality (House et al., 2013), mentalizing (Birch
89 et al., 2016) and norm adherence in children (House et al., 2019; Amir and McAuliffe, 2020), we allowed
90 the psychological hypotheses to compete in a simple experimental design administered to 280 children (51%
91 female) ranging in age from 3 to 7 years old in Vancouver, Canada. Our approach was two pronged. First,
92 we observed children’s decisions in a resource distribution game in which they could win stickers — a valued
93 resource. Importantly, the particulars of the game and its conditions were designed such that children’s
1 Byrne and Whiten’s (1988) original conceptualization of the Machiavellian Intelligence Hypothesis was broader than what
we have presented here including, for example, primates’ skills in managing coalitions; we focus more narrowly on the part of
the hypothesis capable of generating the necessary runaway dynamics.
2 In this context, the Cultural Hypothesis converges with the Embodied Capital Hypothesis (Kaplan et al., 2000). We focus
on the former because those working under this rubric have explicitly analyzed the role of cumulative cultural evolution. Note
that while Gavrilets and Vose (2006) is presented under the rubric of the Machiavellian Intelligence Hypothesis, we feel the
dynamic processes embedded in the model actually capture a version of the Cumulative Cultural Brain Hypothesis.
394 decisions could reflect either the outcomes of imitative cultural learning or strategic social reasoning. Second,
95 we assessed children’s capacities for mentalizing in three ways: using (1) a classic false-belief task (N =
96 276; Wimmer and Perner, 1983), (2) a storybook instrument (N = 100; Blijd-Hoogewys et al., 2008), and
97 (3) parental reports (N = 150; Tahiroglu et al., 2014). Critically, the latter two measures operationalize
98 mentalizing as a suite of related multidimensional capacities implicated in reasoning about others’ mental
99 states, allowing us to triangulate children’s developing capacities more broadly then what is captured by
100 common “Theory of Mind” measures like the binary outcome of the false-belief task (Schaafsma et al., 2015).
101 In a subset of the sample (N = 118), we also measured children’s general cognitive abilities (McGrew and
102 Woodcock, 2001). In this experimental design, the Cultural Hypothesis predicts that mentalizing should be
103 associated with the cultural acquisition of relevant and intentional actions, preferences or strategies while
104 the Machiavellian Intelligence Hypothesis predicts that mentalizing will be associated with behavior that
105 maximizes payoffs by taking advantage of social information in a zero-sum interaction. Our measure of
106 general cognitive abilities provides a valuable control.
107 Of course, people in real life engage in both cultural learning and Machiavellian strategizing, and rely on
108 mentalizing in both forms of social interaction. At its core, the Cultural Hypothesis proposes that human
109 social life is constructed by an array of culturally-transmitted social norms that generate both reputational
110 consequences and signaling opportunities. As a result, the first thing an individual must do to survive and
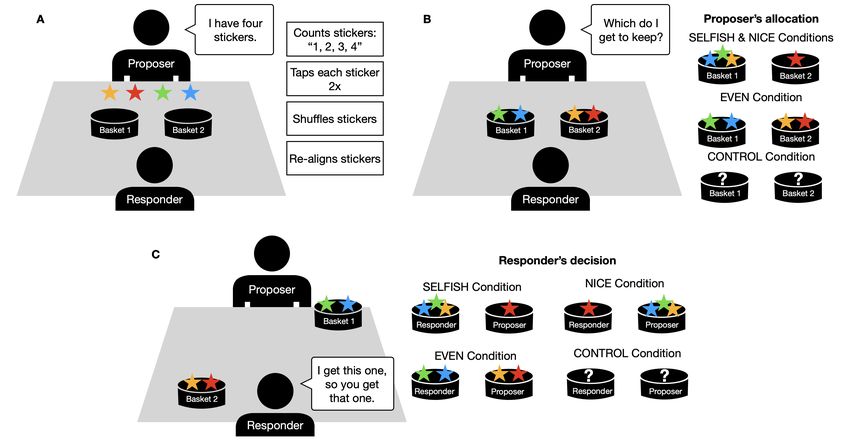
111 thrive in this world is deploy their cultural learning to figure out the local norms. Only then, having acquired
112 the local norms, can they begin to exploit and manipulate at the edges. By contrast, under the Machiavellian
113 Intelligence Hypothesis, the need to first learn social norms before engaging in strategic behavior plays no
114 role. This suggests that cultural learning will play little role in strategic decision-making. Thus, the design
115 of our experiment allows for an examination of the ways in which children employ their developing capacities
116 for mentalizing: Do they, when faced with a zero-sum social decision, deploy these cognitive abilities in the
117 service of cultural learning or strategic reasoning (or both)?
118 Understanding the ontogeny of any phenotype has stood at the core of evolutionary approaches at least
119 since Darwin (1959), and was canonized by Tinbergen (1963) in his “Four Questions”. Here, we study
120 children during a developmental period when they are known to internalize social norms (House et al., 2013,
121 2019), increase their general cognitive skills (McGrew and Woodcock, 2001), and sharpen their mentalizing
122 abilities (Wellman and Liu, 2004).3 This provides us with important empirical opportunities unavailable with
123 adult participants. Our data provide evidence for the early development of these behaviors and abilities.
124 We might have observed, for example, that imitation develops only slowly over this period but that even
125 young children were quite inclined to make equal allocations. We don’t find this. Or, we might have found
126 that while young children rely on imitation, older children became fierce Machiavellians. We don’t find this
127 either. Instead, we find that young children are powerful imitators but possess only weak inclinations toward
128 equitable offers, which increase slowly over this period. For an overview of the importance of studying child
129 development for evolutionary approaches to humans see Barrett (2014), Bjorklund (2000) and Henrich and
130 Muthukrishna (2021).
131 3 Methods
132 3.1 Participants
133 In the greater Vancouver area (Canada), 280 children (136 Males; 144 Females; 2 with sex unreported) aged
134 from 2.91 to 6.93 years (M = 4.48, SD = 0.94) were recruited to participate in this study from 22 daycare
135 centres (N = 201), a local science museum (N = 55), and the child subject pool at the University of British
136 Columbia (N = 24). The family income of participating children ranged from 20,000 CAD to 220,000 CAD
137 at our different sampling sites around the city (Median = 100,000 CAD). The median family income in the
3 There remains, however, active debate as to when precisely children (or even infants) become able to make inferences about
the mental states of others (Baillargeon et al., 2010; Tomasello, 2018; Poulin-Dubois et al., 2018). That said, much of the
literature on the development of mentalizing has long focused on children in this age range and some comparative evidence
suggests that by this age children’s social cognition is more sophisticated than some of our closest primate relatives (?).
4138 greater Vancouver area in 2015 was around 72,000 CAD (Statistics Canada, 2017). Most of the children had
139 one (N = 234) or two siblings (N = 27).4
140 3.2 Materials and Procedures
141 Participants completed a battery of assessments: (1) the sticker bargaining game, (2) a false-belief test
142 (Wimmer and Perner, 1983), (3) the Theory of Mind Storybooks (Blijd-Hoogewys et al., 2008), and (4)
143 a test of general cognitive abilities (McGrew and Woodcock, 2001). Participating children recruited from
144 daycares completed the assessments in a round-robin style with different research assistants making one
145 to three visits per daycare centre. Parents or guardians of participating children provided demographic
146 information and filled out an observation instrument on their child’s mentalizing capacities (Tahiroglu et al.,
147 2014). The parent/guardian questionnaire was completed either as the child participated in the other tasks
148 (at the Science Museum and in-lab) or was sent home with participating children at daycare centers and
149 collected at a later time. As some of the assessments (e.g., the ToM Storybooks and the cognitive ability
150 tests) required lengthy and/or returning sessions with the children, we do not have complete data for all
151 participating children. This is primarily due to children’s absence on returning visits to the daycare centres
152 and take-home questionnaires not being returned.
153 3.2.1 The Sticker Bargaining Game
154 The sticker game involved two active players, a proposer and a responder (see Figure 1). The proposer had
155 to decide how to allocate four stickers between two baskets; the responder then had to pick which basket they
156 wanted, which left the proposer with the remaining basket. When responders are assumed to prefer more
157 stickers to fewer stickers, game theory predicts that sticker-maximizing proposers will make a 2-2 division
158 between the baskets. Procedurally, children first watched a live demonstration of the game in which two
159 adult models interacted for three rounds, ostensibly as an instructional aid. A third adult experimenter
160 laid out the the stickers in front of the proposer at the beginning of each round. In all demonstrations,
161 the proposer initiated each round by performing five actions: announcing that they had four stickers (“I
162 have four stickers”), counting them out-loud (“One, two, three, four”), tapping on each sticker twice with a
163 finger, shuffling them around into a different order, and realigning them into a straight line. The proposer
164 then allocated the stickers to the baskets, and asked the responder, “Which do I get to keep?”—prompting
165 the responder’s decision. Importantly, the demonstration varied (1) the proposer’s allocations, (2) the
166 responder’s preferences and (3) whether or not the participants could actually observe any of the allocations
167 or sticker payoffs.
Table 1: Sticker game decision matrix and by condition predictions
Conditions Proposer’s Responder’s Cultural learners’ Machiavellian
actions actions divisions divisions
CONTROL Unseen Unseen Baseline Baseline
EVEN Allocates 2-2 Picks 2 sticker cup Even (2-2) Baseline
NICE Allocates 3-1 Picks 1 sticker cup Uneven (3-1) Uneven split (4-0, 3-1)
SELFISH Allocates 3-1 Picks 3 sticker cup Uneven (3-1) Even split (2-2)
168 Children were randomly assigned to one of four conditions, labeled CONTROL, EVEN, SELFISH, NICE
169 (Table 1), and played for four rounds in the role of proposer against the same person they had just observed
170 in the responder role in the demonstration. Table 1 summarizes these treatments and predictions:
171 1. CONTROL condition: The proposer in the live demonstration was given the four stickers, they then
172 performed the five actions described above. After stating that they were to put the stickers in the
4 This study was approved by the University of British Columbia Behavioural Research Ethics Board. Written informed
consent was obtained by the parents of participating children in addition to children’s verbal assent to participate, and children
were given the option to withdraw at any point during the study.
5Figure 1: Phases of the sticker game: (A) Initial set up and irrelevant behaviours, (B) Proposer’s
allocations and how they differed between conditions, (C) Responder’s decision and how they differed between
conditions. The participating child was seated at the table and observed two adult models play three rounds
of the game before taking the place of the proposer and playing against the same responder they had just
observed. In the CONTROL condition, a box was placed over the baskets before the Proposer allocated the
stickers and taken away after the Responder had decided which basket to take and which to give back to the
Responder - leaving participants unaware of the decisions made in the game.
173 baskets, and before asking which they got to keep, the experimenter in the demonstration placed an
174 occluding box over the baskets that had one side cut out such that the adult proposer and the responder
175 could see the baskets and the placement of the stickers but the participant could not. The responder
176 selected one of the baskets from within the box, so participants also could not see how many stickers
177 either player retrieved. The box was removed and then replaced prior to the proposer’s allocations in
178 the following rounds. This treatment provides a comparative baseline for how children will allocate
179 stickers at test in the absence of information about the proposer’s or the responder’s preferences. In
180 the other conditions, children had full view of all decisions and outcomes.
181 2. EVEN condition: The proposer split the stickers evenly, leaving the responder with no choice but to
182 return two stickers and keep two for themselves (basket choice was counterbalanced across the sample).
183 Since this 2-2 split provides no additional information as to the responder’s preferences, Machiavellians
184 who should adjust their strategies in light of the responders’ behaviours are predicted to act as they
185 would if they had been in the CONTROL (where they have similarly no additional information as to
186 the responder’s preferences). Cultural learners, however, should tend to copy the model and split the
187 stickers evenly.
188 3. NICE condition: The proposer distributed the stickers unevenly with three stickers in one basket and
189 one in the other (the order of which was counterbalanced across participants). The responder was
190 then ‘nice’ and always picked the basket with only one sticker. Here, both good cultural learners and
191 Machiavellians should allocate unevenly, with cultural learners copying the model and Machiavellians
192 adjusting to best exploit their opponent.
193 4. SELFISH condition: The proposer allocated the stickers unevenly but now the responder was ‘selfish’
6194 and always took the basket with three stickers. Here, cultural learners should copy the uneven allocation
195 tendencies of the model, while good Machiavellians should recognize the sticker-maximizing tendencies
196 of their opponent and pick an even 2-2 allocation.
197 After the demonstrations, children were asked if they wanted to play and were placed into the role of
198 the proposer, playing against the same responder that they had just seen in the demonstration. When the
199 child first took the place of the proposer, they were asked whether they liked stickers (in general). Four
200 participants said they did not. At the outset of each round of the testing phase, children were asked whether
201 or not they liked the specific stickers that had been laid out in front of them by the experimenter. To
202 these queries, 17 children indicated that they did not like the specific stickers on that round5 . Participants
203 played the game for four rounds with the responder playing the same strategy that the child saw in the
204 demonstration. In the CONTROL condition, however, the responder’s behaviors at test were dependent
205 on the child’s allocations but were pre-determined and counterbalanced across the sample. If the child
206 distributed evenly, the responder always chose either the left or right basket. If allocations were uneven, the
207 responder was randomly assigned apriori to be either nice (N = 12) or selfish (N = 14). This was also the
208 case in response to uneven allocations in the EVEN condition (Nice, N = 10; Selfish, N = 4). After each
209 round, the stickers that the children obtained in the game were placed in a small plastic bag for them to
210 take home.
211 3.2.2 Measures of Mentalizing
212 We measured children’s mentalizing abilities in three ways:
213 1. The Sally Anne Task (Wimmer and Perner, 1983): in this task children were presented with a live
214 demonstration of a false belief test using hand puppets in a ‘change of location paradigm’. The test
215 involved two characters, “Sally” who had a basket and “Anne” who had a box. The test began with
216 Sally placing a toy in her basket. Sally then left the scene to “go play outside”. While Sally was away
217 and could not see what took place, Anne took the toy out of Sally’s basket to put it into her own box.
218 Sally then returned and the child participant is asked three questions: “Where is the toy now?”, one
219 memory question “Where was the toy at the beginning?” and the focal belief question: “Where will
220 Sally look for her toy when she comes back in from playing outside?”. Children are said to pass the
221 test when they reply that Sally will look for the toy inside her own basket (1 = Pass; 0 = Fail)—that
222 is where she had left it (and not where the child knows it to currently be). As is standard practice
223 to insure that participants understood where Sally had actually placed the toy, and where it was in
224 reality after it was moved by Anne, the experimenter corrected the participant if they had responded
225 incorrectly to either of these two questions before asking the focal test question. Incorrect responses
226 on the false belief item were not corrected.
227 2. The Theory of Mind Storybooks (Blijd-Hoogewys et al., 2008): This instrument consists of six story-
228 books portraying a protagonist, Sam, who experiences various emotions, desires and thoughts in a series
229 of brief stories about this character, his friends and his family. The storybooks, which were read aloud
230 by an adult experimenter, consist of 34 tasks, with assessments of five components of mentalizing: (1)
231 emotion recognition, (2) distinguishing between physical and mental entities, (3) understanding that
232 seeing leads to knowing, (4) prediction of behaviors and emotions from desires, and (5) prediction of
233 behaviors and emotions from beliefs. An overall ”Theory of Mind” score is indexed by the sum-total
234 of coded responses, ranging from 0-110 on the basis of a continuous scoring system. The task takes
235 40-50 minutes to complete. As an instrument of various aspects of mentalizing, these storybooks have
236 been shown to have robust internal consistency, test-retest reliability, inter-rater reliability, construct
237 validity and convergent validity.
5 Analyses reveal no robust relationship between children’s report of liking of the stickers and their choices, so we did not
exclude children based on their reported sticker preferences
7238 3. The Children’s Social Understanding Scale (CSUS-short form; Tahiroglu et al., 2014): parents of a
239 subset of our sample also completed an 18-item parent-report questionnaire of their child’s mentalizing
240 capacities. The CSUS asks parents to reflect on their child’s capacities for reasoning about mental states
241 such as beliefs (e.g., “My child understands that telling lies can mislead other people”), knowledge (e.g.,
242 “My child uses words that express uncertainty”), perception (e.g., “My child thinks that you can still
243 see an object even if you’re looking in the opposite direction” (reverse-coded ), desires (e.g., “My child
244 talks about what people like or want”), intentions (e.g., “My child talks about the difference between
245 intentions and outcomes”), and emotions (e.g., “My child talks about conflicting emotions”). The
246 18-item scale is reported to have good psychometric properties, and has been validated in samples of
247 children aged 3 to 8 years of age.
248 3.2.3 General Cognitive Abilities
249 To assess children’s general cognitive abilities, a subset of our sample completed the Brief Intellectual Ability
250 test [BIA] (McGrew and Woodcock, 2001). The BIA was designed to assess cognitive abilities in children
251 older than 2 years. An overall score is derived from the outcomes of three cognitive tests involving verbal
252 comprehension, concept formation, and visual matching that assessed verbal skills, fluid reasoning, and
253 processing speed. For our analyses, scores on the test were age-normalized using the scoring program
254 provided by the test creators.
255 3.3 Sticker game response coding
256 Children’s behaviors provided us with a rich set of data. We first coded children’s sticker allocations and
257 tracked their relative frequency across rounds and conditions to assess the extent of imitative cultural learn-
258 ing. Then, we also coded allocations as to whether they reflected payoff-maximizing-choices (game theory).
259 This permits us to estimate the contributions of mentalizing and general cognitive abilities to both imitation
260 of the model proposer and strategic exploitation of the responder. Lastly, we counted if and how many
261 of the proposer’s seemingly-irrelevant behaviours—as seen in the demonstration (e.g., counting, tapping,
262 shuffling)—the child reproduced on each test round to provide a measure of overimitation.
263 4 Results
264 We analyzed our data in two steps. First, we considered how well the data fit the predictions arising from the
265 Cultural Hypothesis by asking if, and how much, children tended to imitate the allocations and behaviours
266 of their model/demonstrator. Second, we contrasted this analysis with how well children’s behavior fit the
267 predictions derived from the Machiavellian Intelligence Hypothesis. Crucially, this approach to analyzing
268 our data allows for the possibility that we could find mixed evidence, with the data supporting both sets of
269 predictions and theories.
270 4.1 Are children cultural learners in this zero-sum situation?
271 To assess the impact of our four treatments (t), we began by coding children’s allocations into a binary
272 variable, as either even splits (2/2, so di,j,s = 1) or uneven (i.e., 3 and 1 or 4 and 0, so di,j,s = 0). The
273 variable i indexes the round, j indexes the individual, and s marks the sampling site. We modelled these
274 decisions in a series of logistic regressions. To account for the non-independence of repeated responses across
275 rounds and data collection in different sites, we adjusted all standard errors by clustering both within subjects
276 and within sampling sites (22 Daycares, Science Museum or in-lab). We estimate the regression equation (1)
277 below. The coefficient on condition, Ct , captures the effects of our four treatments, using our CONTROL
278 condition as the reference. The coefficient on round, Ri , reveals the average effect of personal experience per
279 round of repeated play. βt captures the effect of the interaction of treatment and round, which is crucial since
280 we expect individual learning to have different effects in different treatments. The coefficient on children’s
8281 ages, Aj , allows us to examine how children’s inclination to offer even splits develops from ages 3 to 8 years
282 in this population. Mj controls for the reported sex of our participants (sex = 1 is male; which was centered
283 to ease interpretation of our focal predictors for the whole sample).
logit[Pr(di,j,s = 1)] = Ct condition + Ri round + Aj age + Mj sex + βt ∗ condition ∗ round + constant (1)
A B
CONTROL NICE CONTROL NICE
EVEN SELFISH EVEN SELFISH
1.00 1.00
Prob. of Even Distribution
Prob. of Even Distribution
0.75 0.75
0.50 0.50
0.25 0.25
0.00 0.00
1 2 3 4 3 4 5 6 7
Round Age (Years)
Figure 2: Predicted probability of even distributions in each condition across the four rounds
(left panel) and age (right panel). Predictions for panels A and B were generated from Models 4 and 5,
respectively, in Table 2. The shaded regions show the 95% confidence intervals based on two-way clustering.
284 Figure 2 illustrates our key results and Table 2 provides greater detail. For each of our conditions, the
285 left panel reveals the predicted probabilities of even allocations across the four rounds of play (as estimated
286 by Model 4 in Table 2). The right panel shows the age trajectories in allocation strategies for each condition
287 (as estimated by Model 5 in Table 2). The most striking result is the tendency of children to imitate the
288 proposer they observed in the demonstration. Relative to the CONTROL condition, children who saw an
289 even distribution were much more likely to distribute their stickers evenly (the blue line at the top of both
290 plots). In Round 1, for example, the percentage of equal allocations increased from 62% in the CONTROL
291 condition to 91% in the EVEN condition. By the last round, those who observed the model distribute the
292 stickers evenly still remained 18% greater than the CONTROL condition. Similarly, when children saw a
293 proposer divide the stickers unevenly in either the SELFISH or NICE conditions, they allocated their stickers
294 much less evenly at test. In Round 1, the percentage of even allocations dropped to 28% in both the NICE
295 and the SELFISH conditions. This is 34% below the frequency of equal splits observed in the CONTROL
296 condition. Table 2 shows that, even holding participants’ age, sex and round of play constant, those who
297 observed an even split were substantially more likely to offer an even split while those who observed uneven
298 splits were substantially less likely to propose an equal division.
299 Unlike the impact of cultural learning illustrated above, individual learning played little role over the
300 four rounds of repeated play (Figure 2, left panel). In three of our conditions (not EVEN), children altered
301 their allocations in ways that increased their payoffs—see the coefficients in Model 4 (Table 2) for Round (in
9Table 2: Logistic regression models to predict uneven vs. even sticker allocations
Sticker Allocations (0 = Uneven; 1 = Even)
Model 1 Model 2 Model 3 Model 4 Model 5
(1) (2) (3) (4) (5)
∗∗∗ ∗∗ ∗∗∗ ∗∗
Intercept 2.22 1.97 1.95 1.74 2.05∗∗∗
(1.35, 3.63) (1.12, 3.45) (1.18, 3.20) (1.09, 2.76) (1.29, 3.26)
Even Condition 3.69∗∗∗ 3.69∗∗∗ 3.88∗∗∗ 5.41∗∗∗ 4.02∗∗∗
(1.69, 8.08) (2.01, 6.80) (2.13, 7.08) (2.58, 11.34) (2.14, 7.53)
Nice Condition 0.17∗∗∗ 0.17∗∗∗ 0.17∗∗∗ 0.24∗∗∗ 0.16∗∗∗
(0.09, 0.34) (0.09, 0.32) (0.09, 0.32) (0.13, 0.43) (0.09, 0.30)
Selfish Condition 0.26∗∗∗ 0.26∗∗∗ 0.27∗∗∗ 0.24∗∗∗ 0.25∗∗∗
(0.14, 0.50) (0.12, 0.56) (0.13, 0.55) (0.11, 0.52) (0.13, 0.49)
Round (0 = Round 1) 1.09∗∗ 1.09∗∗ 1.18∗∗ 1.09∗∗
(1.01, 1.17) (1.00, 1.17) (1.04, 1.33) (1.00, 1.18)
Age (Yrs. Centered) 1.27 1.27 1.96∗∗∗
(0.94, 1.72) (0.94, 1.73) (1.28, 2.98)
Sex (0 = Prop. of Males) 1.52∗ 1.52∗ 1.49∗
(0.98, 2.35) (0.98, 2.37) (0.96, 2.31)
Even Condition X Round 0.80∗
(0.61, 1.04)
Nice Condition X Round 0.79∗∗∗
(0.66, 0.94)
Selfish Condition X Round 1.06
(0.83, 1.35)
Even Condition X Age 0.92
(0.30, 2.77)
Nice Condition X Age 0.51∗∗
(0.30, 0.89)
Selfish Condition X Age 0.49∗∗∗
(0.32, 0.74)
Observations 1080
Participants 273
Sites 24
Notes: Coefficients are presented as odds ratios, so “1” indicates no effect. Standard errors and confidence
intervals are robust and use two-way clustering on both individuals and sites. 95% confidence intervals are
reported below each coefficient in parentheses. The CONTROL condition (Intercept; controlling for other
variables) is the reference category for condition effects. Round of the game was treated as a continuous
variable, and thus condition by round interactions represent changes across the rounds in each condition
(see Figure 2A). Sex was centered on the percentage of males to ease interpretation of the other coefficients
for the entire sample. Age (years) was mean-centered, and developmental trajectories in each condition
estimated by Model 5 are plotted in Figure 2B. For those interested in significance testing, ***, **, and *
indicate p-values below 0.01, 0.05 and 0.1.
10302 CONTROL) and the interactions of each Condition and Round. However, these effects are small and not
303 always estimated with precision. The EVEN condition (interacted with Round) appears slightly anomalous
304 but this results from the fact that nearly all children in this condition made even allocations in the first
305 round. Overall, the impact of cultural learning from the demonstrator dominates individual experience,
306 even in the last round.
307 As children got older, Figure 2 (right panel) reveals how their responses varied across our conditions
308 (Model 5 in Table 2). In the CONTROL condition, older children were about twice as likely to offer an equal
309 split for each additional year, a pattern consistent with much existing developmental research (?Blake et al.,
310 2015; Henrich and Muthukrishna, 2021). By contrast, when they first observed a model offer an uneven
311 split, they became much less likely to make an even split (compared to baseline) as they got older. That
312 is, the imitative cues vastly dominated any impact of enculturation on making equal offers observed in the
313 CONTROL condition, indicating that older children were more affected by the actions of the demonstrator.
314 Finally, observing an equal allocation prior to playing had little impact as children age (as baseline responses
315 in the CONTROL converged with behaviours in the EVEN condition).
316 To verify these results, we conducted a supplemental study with 39 additional participants that sought to
317 (1) replicate our main finding for the EVEN and SELFISH conditions and (2) probe children’s understanding
318 of the task. The results, detailed in Section S 3, replicate the relevant findings just discussed and reveal how
319 children understood the rules of the game.
320 4.1.1 Do mentalizing abilities improve cultural learning?
321 To further test predictions from the Cultural Hypothesis, we analysed the relationship between selective
322 imitation in the sticker game and our three measures of mentalizing, controlling for general cognitive ability
323 (BIA). If mentalizing is for sharpening the accuracy and targeting of cultural learning, then we’d expect that
324 better mentalizers would copy fewer of the demonstrators’ irrelevant actions (e.g. tapping, counting, shuffling,
325 etc.). Recall that before distributing the stickers in each round, the experimenter consistently performed
326 five actions that were not connected to the actual sticker allocations. At test, we tallied how many of these
327 behaviors children imitated, and modelled the total counts in each round in a series of Poisson regressions
328 (Table 3), again using robust standard errors adjusted by clustering on both subjects and sampling site.
11Table 3: Poisson regression models to predict counts of overimitation from mentalizing and cognitive ability
Overimitation (Counts of irrelevant actions by round)
False Belief ToM Storybooks CSUS
OR (95% CI) OR (95% CI) OR (95% CI)
Intercept 0.41∗∗∗ 0.30∗∗∗ 0.34∗∗∗
(0.30, 0.56) (0.21, 0.42) (0.22, 0.53)
Mentalizing 0.67∗∗ 0.98∗ 0.49
(0.46, 0.97) (0.95, 1.00) (0.14, 1.74)
Cog. Ability (Centered) 1.05∗∗ 1.04∗∗∗ 1.04∗∗∗
(1.01, 1.09) (1.02, 1.07) (1.02, 1.07)
Mentalizing X Cog. Ability 0.98 1.00 0.96
(0.94, 1.02) (0.99, 1.01) (0.87, 1.07)
Observations 463 300 272
Participants 116 75 68
Sites 18 17 17
Notes: Coefficients are presented as odds ratios, so “1” indicates no effect. Standard errors and confidence
intervals are robust and use two-way clustering on both individuals and sites. 95% confidence intervals are
reported below each coefficient in parentheses. False Belief was coded as pass/fail (1/0). ToM Storybook
and CSUS scores were centered. Models with additional controls are presented in the supplemental: False
Belief (Table S1), ToM Storybooks (Table S2) and CSUS (Table S3). For those interested in significance
testing, ***, **, and * indicate p-values below 0.01, 0.05 and 0.1.
12A 5
Predicted counts of
4
overimitation
Intelligence
3
−1 SD
Mean
2
+1 SD
1
0
Fail Pass
False Belief
B 5
Predicted counts of
4
overimitation
Intelligence
3 −1 SD
Mean
2
+1 SD
1
0
20 40 60 80
ToM Storybooks
C 5
Predicted counts of
4
overimitation
Intelligence
3 −1 SD
Mean
2
+1 SD
1
0
1.5 2.0 2.5 3.0 3.5
CSUS
Figure 3: Predicted overimitation counts by mentalizing and general cognitive scores. Shaded regions are
95% confidence intervals. Predictions were generated from models presented in Table 3.
329 Across models, we observed clear associations between children’s cognitive abilities, mentalizing capacities
330 and the extent of their overimitation. Figure 3 illustrates that greater mentalizing capacities, as indexed
331 by (A) passing the false-belief test (Table S1), (B) higher scores on the ToM Storybooks (Table S2), or (C)
332 greater parent-reported capacities for reasoning about mental states (CSUS; Table S3), was associated with
333 decreased overimitation (summarized in Table 3). As shown in the figure, the effects of mentalizing are
334 large, though the point estimate for the coefficient on the CSUS—the largest effect—is estimated with great
335 uncertainty. In some of our supplemental analyses (Tables S3 and S4), the coefficients on CSUS are estimated
13336 with much greater precision, though this depends on the specification. In contrast to mentalizing, greater
337 cognitive abilities as measured by the BIA are associated with more overimitation. Indeed, the data hint
338 that the stronger the cognitive performance of children on the BIA, the greater the impact of mentalizing
339 on overimitation.
340 One interpretation of these results is that many or most children are motivated to overimitate, but
341 remain limited by their cognitive abilities in accomplishing this. Children with stronger cognitive abilities,
342 as captured by the BIA, are able to overmitate more. Notably, detailed analyses indicate that no one of the
343 three subscales on the BIA is driving the observed relationship with overimitation (Table S4). This work
344 suggests that it’s mentalizing abilities, not these more general-purpose cognitive abilities, that make children
345 more effective and accurate cultural learners.
346 4.2 Are children good Machiavellians in this bargaining context?
347 To test the focal predictions of the Machiavellian Intelligence Hypothesis, we estimated the contributions
348 of mentalizing and cognitive abilities on children’s capacities to exploit the responder in order to maximize
349 their own sticker payoffs. The Pay-off Maximizing Choice—the PMC—varied by condition such that ‘even’
350 allocations were pay-off maximizing in the EVEN, and SELFISH conditions while ‘uneven’ distributions
351 were pay-off maximizing in the NICE condition. In the CONTROL condition, participants were blind to
352 the responder’s strategy in the demonstration, and thus ‘even’ allocations were coded as pay-off maximizing
353 until the participant distributed stickers unevenly, which would reveal the responder’s selfish or nice strategy
354 (apriori counterbalanced). If selfish, then ‘even’ distributions on the following round were coded as pay-off
355 maximizing. If the responder was nice, then ‘uneven’ distributions on the following rounds was coded as
356 pay-off maximizing. Children’s allocations, indexed as being either payoff-maximizing (PMC = 1) or not
357 (PMC = 0) were modelled in a series of logistic regressions with standard errors adjusted by clustering on
358 subjects and sampling sites6 .
359 In contrast to our analyses of overimitation, these analyses reveal only weak and poorly estimated re-
360 lationships between making payoff-maximizing strategic choices and any of our measures of mentalizing or
361 general cognitive abilities (Table 4; see Tables S5-S7 for models with additional controls). Two of our mea-
362 sures of mentalizing suggest that greater mentalizing is associated with less payoff-maximizing (the opposite
363 of the prediction from the Machiavellian Intelligence Hypothesis) and one measure suggests a tiny positive
364 effect of mentalizing on payoff-maximizing choices; but, all estimates are paired with large confidence inter-
365 vals that stretch across 1. Focusing on more general cognitive abilities, a child’s BIA scores reveals a small
366 positive association with payoff-maximization, though this too is poorly estimated. These results provide no
367 support for the idea that either a child’s mentalizing skills or cognitive abilities are deployed to anticipate
368 the predictable actions of one’s partners in order to select the payoff maximizing behavior. That is, children
369 seem to ignore information about their interaction partner and instead rely on their cultural model for how
370 to behave in this context.
6 The results that follow were robust to alternative codings of allocations in the CONTROL condition. In additional models,
we treated all uneven allocations in the CONTROL condition as not pay-off maximizing, and in others treated the first uneven
allocation (if the responder was ‘nice‘ as pay-off maximizing despite the child likely ’lucking’ into the higher payoff) - neither
of which made any substantial changes to the estimates presented in Table 4
14Table 4: Logistic regression models to predict payoff maximizing choices from mentalizing and cognitive
ability
Sticker allocations (1 = Payoff maximizing choice)
False Belief ToM Storybooks Parental Report [CSUS]
OR (95% CI) OR (95% CI) OR (95% CI)
Intercept 2.49∗∗∗ 2.47∗∗∗ 1.89∗∗∗
(1.37, 4.52) (1.58, 3.86) (1.23, 2.91)
Mentalizing 0.85 1.02 0.65
(0.42, 1.69) (0.99, 1.04) (0.16, 2.62)
Cog. Ability (Centered) 1.01 1.01 1.01
(0.98, 1.03) (0.97, 1.05) (0.97, 1.05)
Observations 463 299 271
Participants 116 75 68
Sites 18 17 17
Notes: Coefficients are presented as odds ratios, so “1” indicates no effect. Standard errors and confidence
intervals are robust and use two-way clustering on both individuals and sites. 95% confidence intervals are
reported below each coefficient in parentheses. False Belief was coded as pass/fail (1/0). ToM Storybook
and CSUS scores were centered. Models with additional controls are presented in the supplemental: False
Belief (Table S5), ToM Storybooks (Table S6) and CSUS (Table S7). For those interested in significance
testing, ***, **, and * indicate p-values below 0.01, 0.05 and 0.1.
371 5 Discussion
372 In this paper, we present a simple experiment designed to examine how children trade-off information relevant
373 for cultural learning vs. information about their partner in a novel, zero-sum interaction involving real
374 payoffs. The experiment was designed to test a simple set of contrasting predictions stemming from what
375 many perceive as the two leading evolutionary approaches to understanding the primary selective processes
376 that drove our species’ genetic evolution and may explain the unique position we hold in the natural world.
377 Of course, these are broad ranging theories that make myriad predictions about human evolution, life history,
378 neural computational power and several features of psychology, so our efforts here, however stark, remain but
379 one contribution to a rich and growing body of evidence from several disciplines. Nevertheless, keeping the
380 broader theoretical frames in mind is crucial to cumulative scientific progress (Muthukrishna and Henrich,
381 2019).
382 Naturally, readers may question how we dispensed with the myriad of other proposals regarding the
383 key drivers of human evolution and our species’ immense ecological success. To begin, we emphasize that
384 many important lines of work that might seem to be excluded actually fall under one of the two approaches
385 we delineate. For example, approaches that emphasize teaching and pedagogy are part of the Cultural
386 Hypothesis (Laland, 2017; Henrich, 2015a). Similarly, approaches that emphasize partner choice and alliance
387 building, can generally be incorporated under the Machiavellian rubric (Barclay, 2011). Beyond this, as noted
388 above, we applied two criteria. First, the approach had to provde a ’process-based’ theory that offered the
389 requisite evolutionary dynamics capable of generating the kind of rapid transformations that appear in the
390 fossil record and our lineage’s genome. This dispenses with most alternatives. Second, we focus only on
391 theories that had been formally modeled in some way. In our experience, many proposals fall apart when
392 modeling is attempted because they lack sufficient clarity to be translated into mathematical terms; or, they
393 are trivial and reduce simply to a “magic mutation.”
15394 The two evolutionary hypotheses we tested are both variants of the Social Brain Hypothesis (Humphrey,
395 1976): the Machiavellian Intelligence Hypothesis (Byrne and Whiten, 1988; Whiten and Byrne, 1997; Mc-
396 Nally et al., 2012; McNally and Jackson, 2013) and the Cultural Hypothesis (Muthukrishna et al., 2018;
397 Laland, 2017). The auto-catalytic version of the former suggests that the driving selection pressures in
398 human evolution arose from an arms race in strategic thinking, with a focus on deception, manipulation,
399 exploitation, and alliance-making created by living in larger and/or more social groups. By contrast, the
400 latter hypothesis argues for a synergy between genes and culture in which cultural evolution generates an
401 ever expanding body of adaptive cultural information that, in turn, favors brains that are better at acquir-
402 ing, storing and organizing that information (Sherwood and Gómez-Robles, 2017). Such markedly distinct
403 evolutionary pressures, if one of them did indeed drive much of human brain evolution, should be readily
404 detectable in modern human psychology.
405 To test a focused set of hypotheses about human psychology derived from these broad theories, we
406 designed a simple bargaining experiment in which children had the opportunity to use social information
407 in one of two ways, either strategically to exploit an opponent for payoff advantage or for cultural learning
408 to adapt to a novel circumstance. To incorporate individual experience, we also permitted participants to
409 engage in individual learning by playing the game over four rounds with the same opponent. Our main results
410 show that children’s allocations are strongly shaped by cultural learning while showing little strategic use of
411 readily available social information about their partner. As good cultural learners, children in our study may
412 have inferred normative information from the model’s distribution strategies. Thus, their behaviour at test
413 may have been more than “just” imitation, reflecting also a developing sensitivity to social norms (House
414 et al., 2019). Both the relationship we observed between a participant’s age and making equal allocations
415 and the impact of the demonstrators actions are consistent with prior developmental work on social norm
416 acquisition (House et al., 2013, 2019; Salali et al., 2015).
417 Complementing this main analysis, we also collected individual-level measures of children’s mentalizing
418 skills and their general cognitive abilities. We focused on mentalizing because both the Machiavellian In-
419 telligence Hypothesis and the Cultural Hypothesis point to mentalizing as a key capacity in humans that
420 was likely under auto-catalytic selection. Crucially, while the Machiavellian Intelligence Hypothesis predicts
421 that mentalizing skills will be deployed in the service of Machiavellian efforts to strategically out-whit op-
422 ponents or select partners by anticipating their actions, the Cultural Hypothesis predicts that our greater
423 mentalizing abilities evolved primarily in the service of improving cultural learning. Of course, these two
424 accounts are not, broadly speaking, mutually exclusive in making predictions about how and when humans
425 can or are willing to exhibit their capacities for cultural learning or strategic thinking in everyday life across
426 the lifespan. However, in the specific context of our experimental design, the predictions are competing.
427 Straightforwardly, all of our measures of mentalizing predicted superior cultural learning (more selective
428 imitation, less overimitation) but were not reliably associated with using the available social information
429 to predict their partner’s behavior to select payoff maximizing options. While this supports the Cultural
430 Hypothesis, it provides no support for the Machiavellian Intelligence Hypothesis with regards to children’s
431 behaviour in this bargaining context. Of course, future work may very well reveal the explanatory power of
432 the Machiavellian Intelligence Hypothesis.
433 In designing this experiment, we strove to ‘tilt’ the situation in favor of Machiavellian thinking in several
434 ways. First, we used a zero-sum social interaction with real payoffs that we described explicitly to participat-
435 ing children as a “game”. Children in this society see “games” as competitive interactions where its socially
436 approved of to obtain the most points, rewards or, in this case, stickers. We used a zero-sum bargaining
437 game instead of a cooperative game because imitation in the latter can lead to higher payoffs over repeated
438 interactions. Second, we permitted children to play the same game with the same partner over four rounds.
439 Children might have revealed an initial inclination to copy the demonstrator, but then quickly recognize how
440 their opponent could be exploited. However, they showed little of this type of strategic decision making.
441 Finally, we paired participants with a stranger to avoid any concerns the child might have about interaction
442 after the game. We could have used other children from the daycares, or their teachers, but that would have
443 worked against Machiavellian motivations.
444 On the other hand, given the evidence suggesting that children tend to copy older and more experienced
16You can also read