Country Report of the Land Degradation Neutrality Target Setting Programme - KINGDOM OF SWAZILAND
←
→
Page content transcription
If your browser does not render page correctly, please read the page content below

KINGDOM OF SWAZILAND

Country Report of the Land Degradation Neutrality Target
                   Setting Programme

                                 BY:
                  T. DLAMINI, LDN TSP CONSULTANT
                   UNCCD NATIONAL FOCAL POINT
                     NATIONAL WORKING GROUP
                      MINISTRY OF AGRICULTURE

                        FEBRUARY 2018
2

The objective of the final report is to provide a brief and concise synthesis of the national LDN target setting process by
summarizing LDN outputs and outcomes achieved and documented during the process.

Contents
ACKNOWLEDGEMENTS ........................................................................................................................................................... 5
SUMMARY ............................................................................................................................................................................... 6
1.      INTRODUCTION ............................................................................................................................................................... 7
     1.1 Biophysical Characteristics ............................................................................................................................................ 7
     1.2 Socio-Economic Factors ................................................................................................................................................ 7
2.      LEVERAGING LDN IN SWAZILAND ................................................................................................................................... 8
     2.1 Interest of Country in LDN ............................................................................................................................................ 8
     2.2 Link between LDN, achieving SDGs and other commitments ...................................................................................... 9
     2.3 Leverage opportunities identified............................................................................................................................... 10
     2.4 LDN National Working Group – issues discussed and agreed upon ........................................................................... 12
        2.4.1 Inception Meeting ................................................................................................................................................ 12
        2.4.2 First Meeting of the National Working Group ..................................................................................................... 13
        2.4.3 Second Meeting of the National Working Group ................................................................................................ 13
3.      ASSESSING LDN ............................................................................................................................................................. 14
     3.1 Land degradation trends and drivers .......................................................................................................................... 14
        3.1.1 Land Cover Change .............................................................................................................................................. 15
        3.1.2 Land Productivity Dynamics ................................................................................................................................. 16
        3.1.3 Soil Organic Carbon .............................................................................................................................................. 18
     3.2 LDN Institutional and Legal Environment ................................................................................................................... 19
     3.3 SWOT Analysis of LDN Related Policies, Legislation and Regulations in Swaziland.................................................... 20
     3.4 LDN Baseline ............................................................................................................................................................... 21
     3.5 Land Degradation Hotspots ........................................................................................................................................ 22
4.      SETTING LDN TARGETS.................................................................................................................................................. 25
     4.1 LDN Targets ................................................................................................................................................................. 25
5.      ACHIEVING LDN TARGETS ............................................................................................................................................. 25
     5.1 Associated measures to achieve LDN ......................................................................................................................... 25
6.      ACHIEVING LDN ............................................................................................................................................................. 27
     6.1 Leverage achieved....................................................................................................................................................... 27
     6.2 LDN Relevant Initiatives and Projects - Quick-wins .................................................................................................... 27

                                                                                                                                                                                       3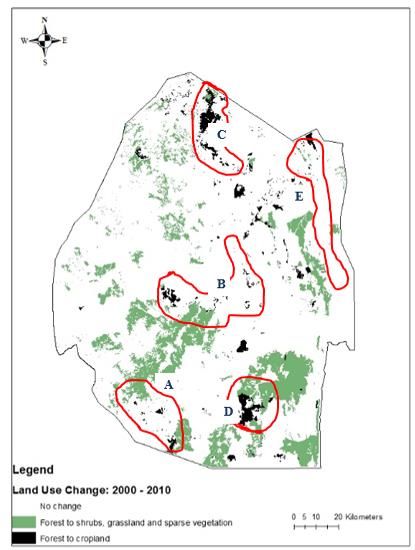
6.3 LDN transformative projects and programmes opportunities identified ................................................................... 28
       6.3.1 Donor supported projects and national initiatives which are relevant to the LDN TSP in Swaziland ................. 28
       6.3.2 Proposed Strategy towards the Design of a LDN Transformative Project ........................................................... 29
7.     CONCLUSIONS ............................................................................................................................................................... 30
ANNEXES ............................................................................................................................................................................... 32
Annex 1: Membership, roles and responsibilities of the Swaziland LDN NWG .................................................................... 32
Annex 2: Dates of working group meetings and workshops ................................................................................................ 36
Annex 3: High Level Note ...................................................................................................................................................... 37
Annex 4: List of reports submitted ....................................................................................................................................... 39
Annex 5: LDN related policies and legislation in Swaziland .................................................................................................. 40

                                                                                                                                                                                        4
ACKNOWLEDGEMENTS
The Ministry of Agriculture (MoA) acknowledges the participation and active guidance of the Land Degradation
Neutrality Targets Setting Programme (LDN TSP). The preparation of the report was coordinated by the National
Consultant, Titus Dlamini. Gratitude is extended to the UNCCD National Focal Point, Bongani Masuku and Bongani
Magongo who were responsible for managing the LDN TSP and chairing meetings of the National working Group. The
National Stakeholders are appreciated for participating in various stages of the process and providing comments on
drafts.
MoA and the author wish to acknowledge the invaluable contributions made by members of the National Working
Group who provided valuable inputs to this document through discussing and approving analytical reports, draft
national targets and measures for achieving LDN in Swaziland. These include: Bongani Masuku, Bongani Magongo,
Jameson Vilakati, Sipho Matsebula, Solomon Gamedze, Dudu Masina, Mduduzi Gamedze, Sanelisiwe Mamba, Wisdom
Dlamini, Sandile Gumedze, Nomsa Mabila, Gcina Dlamini, Absalom Manyatsi, Zodwa Ndlela, Boniface Makhubu, Mandla
Mlipha, Sipho Shiba, Mandla Mkhonta, Bhekisisa Mkhonta, Jabulani Tsabedze, Vusi Simelane, Njabulo Dlamini, Nhlanhla
Nxumalo, Ndumiso Maasimula, Harry van den Burg and Rex Brown.
Further tribute is due to the UNCCD GM, Sven Walter, Aurelie Lhumeau, and Simeon Hengari who guided the setting of
LDN Targets, and provided constructive guidance and peer review of various analytical reports.
5SUMMARY
As a small landlocked developing country, Swaziland faces many challenges caused by land degradation, drought and
climate variability. Left unaddressed, the challenges could easily undermine the country’s economic potential, as
demonstrated by the recent devastating El Nino drought which caused huge financial and environmental losses to the
southern Africa Region, including Swaziland.
Realizing such challenges, Swaziland voluntarily joined the Land Degradation Neutrality Target Setting Programme (LDN
TSP), with the aim to reach a state whereby the amount and quality of land resources, necessary to support ecosystem
functions and services and enhance food security remains stable or increases within its territory by 2030. A concerted
effort has been made by various LDN stakeholders and partners to reflect on the causes and impacts of land degradation
in the country, with a view to address them. A close collaboration was formed between the Ministry of Agriculture, the
LDN National Working Group and various stakeholders which were made up of individual’s experts, government
representatives, civil society, academia community, United Nations (UN) Agencies and the private sector.
LDN can serve as an effective vehicle for delivering on the Sustainable Development Goals (SDGs) in Swaziland,
particularly Goal 15; “to protect, restore and promote sustainable use of terrestrial ecosystems, sustainably manage
forests, combat desertification, and halt and reverse land degradation and halt biodiversity loss”. Specifically relevant is
Target 15.3 which states that by 2030, combat desertification, restore degraded land and soil, including land affected by
desertification, drought and floods, and strive to achieve a land degradation-neutral world. Other international targets
set under the United Nations Convention on Biological Diversity (UNCBD) such as the Aichi Targets and the climate
change agenda can be addressed under LDN.
During the period, 2000-2015, land cover patterns in Swaziland have been driven by expansion of land under agriculture,
particularly sugar cane cultivation, more at the expense of the other land cover categories. The Global Environment
Facility (GEF) supported Strengthening the National Protected Areas Network in Swaziland (SNPAS) Project and Alien
Invasive Plants Species (AIPS) land cover studies also confirm that the area under agriculture increased by 1.4%. This is
the same magnitude the area under forest declined during the same period. For the period 2000 to 2010 cropland
increased by 0.3% while forest declined by a comparable 0.2%.
This process culminated in the development of national level LDN targets for Swaziland which articulate the country’s
aspirations to avoid, minimize and reverse land degradation; reduce current annual loss of forest to cropland; increase
forest cover through afforestation and agroforestry programmes; increase land productivity in all our regions through
sustainable land management (SLM) practices; improve soil organic carbon stocks; increase the amount of land set aside
for nature and wildlife conservation; rehabilitate degraded and abandoned land for crop production; and reduce the
rate of conversion to artificial land cover by halting the spread of invasive alien plant species.
LDN at the national scale
By subscribing to the LDN Concept, Swaziland boldly commits to be a land degradation neutral country by 2030. The LDN
targets, together with the associated measures identified, are summarized below:
6Swaziland: specific targets to avoid, minimize and reverse land degradation
Increase forest cover through Afforestation/Agroforestry in existing forests; areas of shrubs/grassland;
wetlands; croplands by 465,290 Ha
Increase by 10% net land productivity in all land cover categories through SLM practices
Improve by 50% productivity and SOC stocks in cropland and grasslands by 2030 as compared to 2015
Increase Protected Area land coverage from 70,000 Ha to 113,000 Ha by 2022
Rehabilitate 115,000 Ha of degraded and abandoned land for crop production by 2030
Reduce current annual loss of forest to cropland of 9,1 km2 to 4 km2 by 2022 and achieve zero forest loss by
2030.
Reduce the rate of soil sealing (conversion to artificial land cover) by 30% by 2030 as compared to 2010.
1. INTRODUCTION
1.1 Biophysical Characteristics
The Kingdom of Swaziland can be described as a small landlocked developing country, covering 17,400 square
kilometres, with a population of about 1.1 million people who are dependent largely on Agriculture for their livelihood.
It has a sub-tropical climate with summer rains (75% falling in the period between October and March) and 4 distinct
ecological zones with different climatic conditions that range from temperate and sub-humid in the Highveld to semi-
arid in the Lowveld. The country has six ecological zones namely Highveld, Upper Middleveld, Lower Middleveld,
Western Lowveld, Eastern Lowveld and Lubombo. The Highveld has the highest altitude ranges (900 - 1400mm) and the
Lowveld has the lowest range (200 - 300mm). The climate of Swaziland is sub-tropical with wet hot summers and cold
dry winters. Different climatic conditions exist in the different physiological regions of the country.
Soils in the country are subdivided into two categories (old soils and young soils) and the former are soils that form from
deeply weathered rock (sapholite) and the young soils are from eroded rock deposits. The deeply weathered soils are
found mostly in the Highveld and the Upper Middleveld and are classified as Ferrasols and Acrisols whereas soils of the
Lower Middleveld and Lowveld are moderately weathered. There are eight main groups of forest types in Swaziland.
These include Montane and Highland (Dense and Open); Riverine Forest; Mixed Woodland (Dense and Open); Acacia
Woodland (Dense and Open); Dry Acacia Woodland (Dense and Open); Indigenous Bushveld (Dense and Open); Wattle
Forest; and Plantations. There is a variety of rivers traversing Swaziland and the major ones include Mlumati, Komati,
Lusutfu, Ngwavuma, and Mbuluzi Rivers. Surface water resources are estimated at 4.5km3/year, half of which originate
in South Africa.
1.2 Socio-Economic Factors
The Kingdom has four administrative regions and has a GDP of $1.5 Billion with the major contributors being Industry
(44.3%), Services (38.9%) and Agriculture (16.8%). Land tenure is categorized into three types i.e. Swazi Nation Land (at
least 70%), Title Deed Land and Crown Land and extensive communal grazing is practiced in the majority of the country.
7The rest of the country is covered by other land uses such as industrial forestry, commercial agriculture and small-scale
subsistence agriculture, hunting, and protection areas. As a developing country, a significant portion of the population is
reliant on subsistence farming for their daily sustenance and livelihoods.
According to recent studies undertaken by the Central Statistics Office, 63% of the population lives below the poverty
incidence line. The Kingdom has four administrative and has a GDP of $1.5 Billion with the major contributors being
Industry (44.3%), Services (38.9%) and Agriculture (16.8%). The Agriculture sector remains the largest employer and 70%
of the rural population relies on subsistence agriculture for an income. As a small land locked country, Swaziland is
heavily reliant on South Africa for imports and exports. In 2007 the total population of Swaziland was estimated at 1.0
million and projected to grow up to 1.2 million by 2017. The population is increasing by 1.5% per year and this is
expected have a significant impact on energy consumption, land-use patterns, housing density and transportation., due
to corresponding growth in demands on resources and infrastructure (e.g. schools, roads, health-facilities, etc.). These
demands inevitably lead to stresses on the environment and land degradation. In the above context, socio-economic
development is a key priority in Swaziland.
The country is also faced with many challenges caused by climate variability, as experienced in the recent devastating El
Nino drought which caused huge financial and environmental losses to the southern Africa Region, including
Swaziland. Land degradation, along with biodiversity loss and climate change presents serious challenges to the
environment, economy and the country’s development agenda.
All these factors converge to make the Kingdom particularly vulnerable to land degradation which is exacerbated by
climate change and frequent droughts. Thus in August 2016, Swaziland became one of the countries that are currently
undertaking the UNCCD Land Degradation Neutrality Target Setting Process. Under this process the country is expected
to set Voluntary National Targets for achieving land degradation neutrality, which is a state whereby the amount and
quality of land resources, necessary to support ecosystem functions and services and enhance food security remains
stable or increases within specified temporal and spatial scales and ecosystems”.
2. LEVERAGING LDN IN SWAZILAND
2.1 Interest of Country in LDN
The LDN Target Setting is a process that calls for counterbalancing the newly degraded areas by restoring land that is
already degraded and providing measures that increase the likelihood for protecting the non-degraded areas. LDN is
distinguished from previous strategies for fighting land degradation by the fact that, while highlighting the need to
prevent land degradation, it entails the possibility of counterbalancing unavoidable land degradation (“losses”) through
restoration or rehabilitation efforts elsewhere (“gains”), thereby enabling a state of no net loss which amounts to
“neutrality”. Neutrality in the case of Swaziland (which is already much degraded) should not be misunderstood to entail
the maintenance of the status quo but to always strive to improve.
Swaziland submitted a request to join the LDN TSP in June 2016 and participating in programme in August 2016. Since
then, various LDN stakeholders and partners have collaborated in the LDN TSP so as to assess the causes and impacts of
land degradation in the country, set LDN baselines and define LDN targets. This has resulted in a close cooperation
8between the leading Ministry i.e. the Ministry of Agriculture, the LDN National Working Group and various stakeholders
made up of individual experts, government representatives, civil society, academia community, UN Agencies and the
private sector in the LDN TSP.
2.2 Link between LDN, achieving SDGs and other commitments
Swaziland’s umbrella development framework, the National Development Strategy (NDS), is a national roadmap for
implementing the Sustainable Development Goals (SDGs) (and the Millennium Development Goals (MDGs) in the past).
LDN can serve as an effective vehicle for delivering on the SDGs, particularly Goal 15; “to protect, restore and promote
sustainable use of terrestrial ecosystems, sustainably manage forests, combat desertification, and halt and reverse land
degradation and halt biodiversity loss”. Specifically relevant is Target 15.3 which states: “by 2030, combat
desertification, restore degraded land and soil, including land affected by desertification, drought and floods, and strive
to achieve a land degradation-neutral world”.
In addition, the country has set targets for environmental conservation and other international targets such as the Aichi
Targets under the auspices of the United Nations Convention on Biological Diversity (UNCBD). Similarly, under the
Climate Change agenda the country recognizes the need for sustainable management of key natural resources, i.e. land,
soils, forests, water, fisheries, wildlife and air, as efforts aimed at achieving economic growth and poverty reduction.
LDN could also serve as a platform to implement various national strategies, such and the National Biodiversity Strategy
and Action Plan (2015), the Draft National Climate Change Policy (2014) and the Nationally Determined Intended targets
of the United Nations Framework Convention on Climate Change (UNFCCC), aim to address sustainable development
(within the context of national development). This is further supported in Swaziland’s Third National Communication to
the UNFCCC (2016), where the country commits to reducing GHGs emissions through various programmes containing
climate change mitigation and adaptation measures, and various other interventions relevant to the achievement of the
objective of the Convention.
While Swaziland has embraced the aspirations of these international targets, the process of integrating these in the
central and sectoral policies remains a challenge. The LDN Target Setting Programme is therefore seen as one of the
initiatives that will go a long way towards integrating SDG’s, particularly Target 15.3, into the central and sectoral
policies, action plans and strategies for the implementation of multilateral environmental agreements (MEAs),
continental and regional protocols on environment and sustainable development and other related agreements.
Preliminary discussions with national coordinators of SGS’s as well as NFP’s for the Rio Conventions appear to be heavily
leaning towards a consensus for inclusion of LDN in national implementation and reporting processes. For example the
national statistics office is already familiar with reporting on national biodiversity indicators set under the UNCBD and is
confident that the national LDN target can be similarly integrated.
Overall, the LDN Target Setting Programme comes at an opportune time when Swaziland is in the process of
domesticating the SDGs into its umbrella development frameworks and sectorial policies, under the leadership of the
Ministry of Economic Planning and Development. The centrality of SDG 15 creates direct linkages between LDN and
other SDGs in the areas of poverty, food security, water and sanitation, environmental protection and sustainable use of
natural resources. Implementing LDN therefore offers Swaziland a chance to realize her potential of creating multiple
benefits that will make a direct contribution to achieving these and other SDGs. In this regard, the National
9Development Strategy, with its monitoring and evaluation strategy, offers the right policy framework for LDN integration
into the national development agenda in Swaziland. The Swaziland LDN target setting process also takes into
consideration various global efforts to restore degrades areas such as the Bonn Challenge which aims to restore 150
million hectares of the world's degraded and deforested lands by 2020 and 350 million hectares by 2030. Other relevant
initiatives considered in this regard include TerrAfrica and AFR 100 which are both overseen by the NEPAD. Swaziland in
not yet part of these processes but aims to join TerrAfrica and AFR 100 in the near future, hence is boldly committing to
restoring eroded areas, among the LDN targets.
The Swaziland LDN target setting process also takes into consideration various global efforts to restore degrades areas
such as the Bonn Challenge which aims to restore 150 million hectares of the world's degraded and deforested lands by
2020 and 350 million hectares by 2030. Other relevant initiatives considered in this regard include TerrAfrica and AFR
100 which are both overseen by the NEPAD. Swaziland in not yet part of these processes but aims to join TerrAfrica and
AFR 100 in the near future, hence is boldly committing to restoring eroded areas, among the LDN targets.
2.3 Leverage opportunities identified
The following leveraging opportunities in Swaziland were identified:
Swaziland needs to find ways of ensuring that sustainability and ecosystem integrity (which are central to LDN) are
integrated into planning and policy frameworks at different levels. The LDN Target Setting Programme comes at an
opportune time when the country is domesticating the SDGs into its umbrella development frameworks and sectorial
policies. The centrality of SDG 15 creates direct linkages between LDN and other SDGs in the areas of poverty, food
security, environmental protection and sustainable use of natural resources. Implementing LDN therefore has the
potential of creating multiple benefits that will make direct contribution to achieving these and other SDGs.
There are currently numerous initiatives that look at avoiding and minimizing land degradation in Swaziland. It has been
noted that degradation cannot always be prevented due to other reasons such as population growth and increase in
demand for housing, energy, food and transport that lead to expansion of agricultural and settlement areas as well as
road infrastructure.
Fostering Policy Coherence
The Constitution of the Kingdom of Swaziland (2005) provides a solid foundation for integrating environmental
sustainability and natural resources management issues in the policy and planning processes at national and sectoral
levels. It call upon all citizens to “protect and make rational use of the state’s land, mineral and water resources as well
as its fauna and flora, and to ensure that appropriate measures are taken to conserve and improve the environment for
the present and future generations”. The extent to which these aspirations have been translated in previous and existing
policies and programmes has varied. Annex 5 lists some of the LDN related policies and legislations and their main
objectives.
The national and sector policy environment in support of SLM is characterized by a number policies with objectives and
strategies on ecosystems protection, landscape restoration and rehabilitation consistent with LDN. The environmental
objectives and strategies of different policies at national and sector level give an indication of the level and magnitude of
support they render to SLM interventions. It must however be borne in mind that most of these policies were
10formulated before the concept of SLM gained momentum, their implementation is fragmented and levels of successful
implementation often vary.
Land is the most important single productive asset available to the majority of Swazis for use to support their livelihoods.
It is the country’s greatest asset that needs to be conserved for the development of Swaziland whose economy is
agricultural based. Being a limited resource attracts competition between different land uses with dire consequences at
times.
Swaziland has a number of environmental policies, pieces of legislation, strategies and action plans which can be used to
support the LDN TSP, which are summarized in Annex 5. Some of these are drafts and have remained in draft formats
and are yet to be approved.
Coherence of Development Partners’ Cooperation Frameworks
A number of LDN related programmes and projects such as those in agriculture and natural resources management
sectors implemented by Government or NGOs are supported by international cooperating partners. The support by
cooperating partners is usually in line with their policies as elaborated in their various cooperation frameworks.
Some of these operational frameworks have objectives and strategies that are relevant to sustainable land management
(SLM) or LDN. Within the United Nations umbrella, a forum called the United Nations Development Assistance
Framework (UNDAF) has been convened in Swaziland. UNDAF is used as a platform to prioritize and harmonize UN aid
activities in the country and it can be used to identify areas of direct relevance to LDN among UN supported projects in
Swaziland. For example leveraging opportunities exist in the UNDAF one of the expected outputs is “to provide strategic
focus on climate change, natural resources management and disaster risk management”
National donor supported projects and programmes which are relevant to LDN in Swaziland are listed in annex 5. The
various national and sectoral policies and the various donor cooperation frameworks some of which have been analysed
above provide common grounds for enhancing leveraging of resources for maximum impact and value for money. Most
of the donors are strongly inclined towards supporting environmentally sustainable projects, hence have strong
sustainable land management component. The LDN TSP provides an opportunity to reflect and map out effective
leveraging plan to support coordinated and focused implementation of SLM activities among these projects.
Advancing Climate Action
Swaziland ratified the UNFCCC on the 7th October 1996 and subsequently ratified the Kyoto Protocol on the 13th
January 2006. In 2018, the country signed the Paris Agreement. In line with the UNFCCC, the initial and second National
Communications (NC) have been prepared and submitted in 2002 and 2012, respectively. The country is currently
engaged in the development of the Third National Communication (TNC). In addition, coherent to the post 2020 climate
regime, the country submitted its Intended National Determined Contributions (INDCs) to the UNFCCC Secretariat on
Sep 29th 2015.
With support from the Common Market for Eastern and Southern Africa (COMESA) and UNDP, the National Climate
Change Committee (NCCC) facilitated an inclusive development of the draft National Climate Change Policy (NCCP) and
the National Climate Change Strategy and Action for 2014 to 2019 (NCCS). These strategies identified the Green Climate
Fund (GCF) as a support for climate change adaptation and mitigation undertaking in the country. The draft climate
change strategy and action plan identified climate finance readiness as a priority to enhance the country’s capacity to
11plan, access, deliver, monitor and report on climate finance in a catalytic and integrated manner. The NCCC facilitated
the development of the first readiness proposal to the Africa Climate Change Fund (ACCF) which is aimed at enhancing
the country’s readiness for investment in low carbon and climate resilient development. The main activities of the ACCF
are focused on assessment of the country’s needs and barriers to climate investment and capacity building of
stakeholders involved in climate response action in planning, management, monitoring and reporting of climate projects.
The ACCF proposal also aims at developing an investment ready project proposal to be submitted to the GCF.
Access to Climate Finance
In September 2016 the Kingdom of Swaziland received financing from the African Development Bank towards the cost of
the Enhancing Readiness for Investment in Low Carbon and Climate Resilient Development in Swaziland Project. Part of
the grant will be used for Enhancing Readiness for Investment in Low Carbon and Climate Resilient Development
through services to support the Government of Swaziland to assess and prioritize adaptation and mitigation activities
identified in the National Development and Climate Change Strategy and Action Plan. Another portion will be used for
capacity building for project planners and managers/coordinators from executing entities to enable them to develop,
access funding for, manage and monitor climate change projects. The rest will be used or development of an investment
ready proposal for submission to the Green Climate Fund (administered under the Ministry of Tourism and
Environmental Affairs) a set of four pipeline project concepts that can be further developed by the relevant institutions
in Swaziland and a financing plan identifying possible sources of funding for the programmes/projects.
2.4 LDN National Working Group – issues discussed and agreed upon
In the context mentioned above, the UNCCD National Focal Point appointed a National Working Group (NWG) in an
effort to create an implementation environment for the LDN target setting process. The NWG is a structure designed to
guide the process by offering technical guidance on analytical reports, validation of national voluntary targets and
associated measures. The NWG brought together the various interests and technical skills required for the LDN TSP, to
represent the interest of the various stakeholders including Government, Private Sector, NGO’s, communities and
individuals. The members of the working group, their roles and responsibility and overall operating structure are
presented in Annex 1. The LDN TSP was launched in an inception meeting that was held on 14 September 2016, at the
Sibane Hotel. Two meetings of the NWG were subsequently held at the Royal Swazi Sun Hotel and Mountain Inn in
February and April 2017, respectively.
Below is a summary of the issues discussed and agreed upon by the National Working Group:
2.4.1 Inception Meeting
Swaziland held an inception workshop for the LDN TSP in September 2012 where leveraging opportunities for LDN in the
country were preliminarily identified. Participants indicated that the concept of LDN was not necessarily new in
Swaziland and most practitioners often referred to “synergies” and “relevant on-going initiatives” for sustainable land
management and related fields, in crafting the listing.
Preliminary leveraging ideas were shared and discussed in the workshop and this chapter presents a detailed plan for
the maximizing the application of national resources to achieve national obligations under sustainable development goal
(SDG 15) by leveraging the strengths of different players, policies and programmes and supporting their weaknesses.
122.4.2 First Meeting of the National Working Group
Validation of the provided default data in view of their coherence with possibly comparable national data sets was done
at the First Meeting of the National Working Group attended by about eighteen stakeholders from various relevant
sectors. Validation based on additional local data sets for the three indicators proposed by the working group was
further done by five experts who are members of the working group. The land cover data set provided by the UNCCD is
proposed for approval to form the basis of baseline setting. The discussion around the global land cover data set was in
comparison with the available nationally derived data which was considered to be better in terms of detail and scale.
Notwithstanding the relevance of the provided global land cover data as the base for the other two sub-indicators, the
validation concluded that the data compiled in 2015 by the Swaziland national Trust Commission through the UNDP/GEF
supported project on Strengthening the Protected Area Network in Swaziland should complement the global data to
provide baseline. The other data for LPD and SOC with the local LUC data was also used.
The land cover patterns and their changes over time to a larger extent in Swaziland has been driven by expansion of land
under agriculture, particularly sugar cane cultivation, more at the expense of the other land cover categories. The
SNPAS and AIPS land cover studies attest to that as they show that area under agriculture increased by 1.4% in the
period 1990s to 2000s the same magnitude the area under forest declined during the same period. For the period 2000
to 2010 cropland increased by 0.3% while forest declined by a comparable 0.2%.
From the above, the meeting agreed as follows:
The national data should be aggregated to the six classification used by the UNCCD Global Data Unit so that it was
easy to compare the data sets with their associated maps.
For the land productivity map, the country should use landset data, rather than spot data.
For SOC data, we should try to obtain available data from the Middleveld (Malkerns Area), Lowveld Areas (Mhlume,
Simunye, Big Bend and LUSIP I sampled sites) in order to compare to the trends shown in the global data sets.
Members of the working group to make their input into the leveraging plan and revert to the National Consultant by
email.
The National Consultant to address above input, share outcome with Global Data Unit and circulate data to the
NWG group members prior to the next meeting.
Date of Next Meeting was set at: 18 April 2017, however, the meeting was later postponed to June 2017
2.4.3 Second Meeting of the National Working Group
During thus meeting, the draft national LDN targets were presented and discussed. Issues and questions raised during
the discussion were as follows:
It was considered whether a new target on wetlands should be added and the consensus reached was that wetlands
were already covered in the targets, hence no separate addition was made on wetlands.
Does conversion F/C equate to degradation?
What is the minimum area (km2 or %) of country should be maintained under natural forests
Afforestation of degraded areas.
Swaziland is experiencing high rates of overgrazing hence targets and corrective measures should address it.
Scientific information required to justify the targets.
13 Should the targets be gradual /staggered in annual targets for example, rather that achievement by 2030?
Different sectors and departments need to review targets and suggest their evidence based targets as well as
associated measures for achieving targets.
Measures should be comprehensive e.g. integration of biological and physical approaches.
Increase protected area coverage i.e. land falling under nature conservation from 70 000 Ha to 113 000 Ha by 2022
(case by case analysis of change of state of additional farms converted from rangeland to game farming).
A land degradation surveillance framework (with soil health indicator) should be adopted.
Map up corrective measures, calculate, and identify other measures such as the restoration of 200 ha of Agricultural
land under the smallholder market-led project (SMLP).
Land restoration target should be increased from 5 000 to 465 000 Ha in order to halt/reverse all known losses due
to land degradation occurring as a result of soil erosion.
These targets should be measured against other existing national targets set under programmes such as: NBSAP,
UNFCCC TNC, etc. among the measures for achieving LDN targets in Swaziland the following were identified: Existing
initiatives global and national initiatives: GEF/GCF funded projects; National Projects:LUSLIM; SMLP; SLAM; SNPAS
3. ASSESSING LDN
3.1 Land degradation trends and drivers
The land cover patterns and their changes over time to a larger extent in Swaziland has been driven by expansion of land
under agriculture, particularly sugar cane cultivation, more at the expense of the other land cover categories. The
SNPAS and AIPS land cover studies attest to that as they show that area under agriculture increased by 1.4% in the
period 1990s to 2000s the same magnitude the area under forest declined during the same period. For the period 2000
to 2010 cropland increased by 0.3% while forest declined by a comparable 0.2%.
Estimates for each indicator, using the average value across the five-year baseline period (t0), (however a retrospective
trend analysis) was done using an observation of the changes in the value of the indicators over a 10 year assessment
period prior to the current condition (i.e. 2000-2010). These indicators for Swaziland have been computed primarily,
and to the largest extent possible, using the default data sets and standardized national data sources. With the
exception of land cover, national data sets for the other two indicators for Swaziland are at best scanty and to that
effect global data sources have been used in the absence of field surveys, assessments and ground measurements.
The drivers for land degradation in Swaziland can be divided into proximate (direct) and approximate (indirect). Previous
studies have revealed that potential drivers for land degradation in Swaziland, as supported by the above data, mainly
occurs in land that is prone to desertification processes such as climate, relief, soil and vegetation types. According to
Dlamini (2016), land degradation in the form of deforestation is determined by an interaction of proximate and
underlying factors primarily fuelwood use, human population density, human settlements, associated level of
protection and land ownership status. Indeed human activities can cause land degradation and these include:
cultivation of fragile soils which are exposed to erosion, overgrazing, over exploitation of woody resources, uncontrolled
fires, poor agricultural practices, irrigation schemes and irrigation of soils prone to salinization. The extent to which each
of these factors can cause degradation in Swaziland has further been ranked and studies have shown that overgrazing
leads, followed by deforestation, agricultural mismanagement, fuelwood consumption and lastly industry and
14urbanization. The socio-economic factors harbouring these drivers are population growth, poverty, limited awareness
and disease related (Table 1).
Table 1. Main direct and indirect drivers of land degradation in Swaziland
Direct drivers of land degradation Indirect drivers of land degradation
Overgrazing Population pressure
Crop farming practices (heavy machinery compacts the Land tenure
soil structure increasing infield runoff causing soil Land use-improper/inappropriate land use, land use
erosion which leads to rills, gullies and dongas) planning laws?
Improper management of annual, perennial, scrub and Inputs (including access to credit/financing) and
tree crops infrastructure
Deforestation and removal of natural vegetation Education, access to knowledge and support
Over-exploitation of vegetation for domestic use services
Industrial activities, waste deposition and mining Governance - Weak human settlement policies
Urbanisation and infrastructure development leading to clearing of vegetation for housing, crop
Release of water and airborne pollutants fields in a sustainable manner.
Disturbance of the water cycle Effects HIV and AIDS and other diseases
Over-abstraction of water Effects and impacts of poverty
Natural causes such climate change-negative impacts
on agriculture, land, biodiversity, forests, water, air,
Uncontrolled fires
Invasive alien plants
Development infrastructure including Roads, buildings
etc.
3.1.1 Land Cover Change
As indicated in Table 2 the default data from the Global data set (UNCCD) estimate the forest cover at 7 911 km2 and 7
798 km2 in 2000 and 2010 respectively representing a net decline of 112 km2 within that ten year period. As for the
cropland area was estimated at 6 555 km2 in 2000 and at 6 647 km2 in 2010 representing a net increase of area under
agriculture of 92 km2 during that period. There was an increase 21 km2 of area under shrubs, grasslands and sparsely
vegetated area during the same period and no changes were detected in areas under wetlands and water bodies,
artificial or built up areas and bare lands and other areas.
15Table 2: Land covers change in Swaziland (2000 to 2010)
Net
2000 2010
Change
Area Area
% % Area km2 %
km2 km2
Forest 7 911 45.77% 7 798 45.11% -122 -0.71%
Shrubs, grasslands and sparsely vegetated
2 679 15.50% 2 700 15.62% 21 0.12%
areas
Croplands 6 555 37.92% 6 647 38.46% 92 0.53%
Wetlands and water bodies 49 0.28% 4 0.02% 0 0.00%
Artificial Areas 86 0.50% 86 0.50% 0 0.00%
Bare Land and other areas 5 0.03% 5 0.03% 0 0.00%
Other 101 0.58% 101 0.58% 0 0.00%
Total 17 285 100% 17 285 100% 17 285 0%
3.1.2 Land Productivity Dynamics
Land Productivity Dynamics (LPD) were assessed from a 15-year time series (1999 to 2013) of global NDVI observations
composited in 10-day intervals at a spatial resolution of 1 km, based on the global dataset provided by the UNCCD GM.
The LPD dataset used 5 qualitative classes of land productivity trends over the abovementioned time period as shown in
Table3. These qualitative classes do not directly correspond to a quantitative measure (e.g. t/ha of NPP or GPP) of lost
or gained biomass productivity, nevertheless there is an indirect relationship.
16Table 3: Net Land Productivity Dynamics in Swaziland between 2000 and 2010.
Net land productivity dynamics (NetLPD)** (sq km)
Early signs Stable but Stable not No
Land Use/Cover Category Declining of decline stressed stressed Increasing Data***
Forest 1.00 91.30 583.60 694.20 6 419.80 8.40
Shrubs, grasslands and sparsely vegetated - 32.20 293.00 246.90 2 125.40 2.50
Croplands 3.50 80.60 374.10 763.80 5 423.20 1.40
Wetlands and water bodies 1.80 1.40 6.30 11.00 17.90 10.90
Artifical areas - 1.60 1.40 17.10 65.50 -
Bare land and other areas 1.70 0.60 1.50 0.50 0.50 0.30
SOC average (ton/ha)
Percent of total land area 0.05% 1.20% 7.30% 10.00% 81.30% 0.10%
Total (sq km) 8 208 1260 1733 14052 23
Since there is no comparable nationally derived data on this sub indicator as defined in the LDN methodological note. To
this end the stakeholders agreed to use the default data.
According to the default data 1 km2, 0 km2, 3.5 km2, 1.8 km, 0 km2, 1.7 km2 of land that remained forest, shrubs,
croplands, wetlands, artificial/built up areas and bare land respectively in the ten year period registered early signs of
declining net land productivity while 6 420 km2, 2 125 km2, 5 423 km2, 18 km2 and 66 km2 for forest, shrubs, croplands,
wetlands and artificial/built up areas and bare land depicted signs of increasing productivity. About 91 km 2, 32 km2, 81
km2, 1.4 km2, 1.6 km2 and 0.6 km2 of the areas that remained forests during the period had early signs of decline, stable
but stressed, and stable not stressed net land productivity. On average 7.3 % of the total land area of Swaziland was
stable and not stressed level of net land productivity while up to 81% had increasing land productivity and only 0.05 %
showed signs of net land productivity decline.
Of the 91.3 km2 forest land that converted to cropland between 2000 and 2010 about 0 km 2, 1.2 km2, 7.5 km2, 17.2 km2
and 65.4 km2 had declining, early signs of decline, stable but stressed and increasing net land productivity respectively.
Table 4: Changes in Land Productivity Dynamics between Land Classes
Net land productivity dynamics (NetLPD) trend 2000-2010 (sq km)
Early signs Stable but Stable not
Changing Land Use/Cover Category Declining of decline stressed stressed Increasing Total^
Forest to Cropland 1.2 7.5 17.2 65.4 91.3
Forest to Shrubs, grasslands and sparsely 0.3 2.3 3.6 15 21.2
173.1.3 Soil Organic Carbon
Above and below ground carbon stock assessment in forest areas for Swaziland is reported in UNCCD 2015 1as part of
global assessment benchmark mapping against which future changes can be assessed under UNFCCC implementation.
Forest extent in this study was defined using three fractional cover thresholds (10%, 25%, and 30% tree cover) based on
the range of thresholds used by individual Parties to the United Nations Framework Convention on Climate Change.
Table 5: Land Carbon Stocks Trends in Swaziland in 2000
Soil organic carbon (2000)**
Land Use/Cover Category ton/ha
Forest 60.90
Shrubs, grasslands and sparsely vegetated areas 65.80
Croplands 60.20
Wetlands and water bodies 59.50
Artificial areas 64.40
Bare land and other areas 61.20
SOC average (ton/ha) 61.40
The default data gives figures on organic carbon for the upper the 30 cm of soil for areas where land use/cover
remained unchanged from 2000 to 2010 in Table 5. The average for forest areas is 60.9 ton / ha while for shrubs 65.8
tons/ ha, 60.2 ton/ha croplands, 59.5 ton/ha for wetlands, 64.4 ton/ ha for artificial areas and 61.2 ton/ha for bare
land. For the area that changed from forest to crop land the soil organic carbon declined from a total 507 141 tons in
2000 to 603720 tons in 2010 giving a net decline of 103 482 tons. There was no change in organic carbon for areas that
changed from forest to shrubs. The default data gives a value 61.2 tons/ha of carbon for bare land and other areas,
which raises the need for further verification as bare lands by definition have no vegetation which is the source of
organic carbon.
Another anomaly in the default data trends is the low value of 59.5 tons/ha of carbon for wetlands and water bodies,
compared to other classes since wetlands are known to be effective carbon and rivers and dams are commonly the
destination for most eroded soil, some of which has high carbon content.
The explanation for this value is that the 13 samples / sites used for estimation of carbon are not representative of the
entire soil population in Swaziland. A pixel of very high content of organic in any of the few sites carbon could easily give
a misleading value of very high rating in carbon in unexpected circumstances.
1
United Nations Convention to Combat Desertification (UNCCD). (2015). Provision of metadata for indicator 15.3.
http://www.unccd.int/Lists/SiteDocumentLibrary/Rio+20/Land%20degradation%20neutrality%202015/UNCCD%20Metadata%20Tar
get%2015.3.pdf (last accessed 11/09/17).
18Table 6: Soil Organic Carbon Trends (using global data)
Net area
change
(2000- Soil organic carbon 0 - 30 cm (2000-2010)
2000 2000 total 2010 total 2000-2010
Changing Land Use/Cover Category sq km ton/ha 2010 ton/ha (ton) (ton)**** loss (ton)
Forest to Cropland 91 55.7 44.4 507141 403659 -103482
Forest to Shrubs, grasslands and sparsely 21 64.4 64.4 135234 135234 0
Total 112 642375 538893 -103482
Percent loss total SOC stock (country) -0.10%
3.2 LDN Institutional and Legal Environment
Swaziland has enacted a number of policies, legislations and regulations related to land use, land tenure and economic
development which regulate the agriculture, environment, climate change infrastructure development, land tenure and
mining sectors. The national and sector policy environment in support of SLM is characterized by a number policies with
objectives and strategies on ecosystems protection, landscape restoration and rehabilitation consistent with LDN. The
environmental objectives and strategies of different policies at national and sector level give an indication of the level
and magnitude of support they render to SLM interventions. It must however be borne in mind that most of these
policies were formulated before the concept of SLM gained momentum, their implementation is fragmented and levels
of successful implementation often vary.
The Constitution of the Kingdom of Swaziland (2005) provides a solid foundation for integrating environmental
sustainability and natural resources management issues in the policy and planning processes at national and sectorial
levels. It call upon all citizens to “protect and make rational use of the state’s land, mineral and water resources as well
as its fauna and flora, and to ensure that appropriate measures are taken to conserve and improve the environment for
the present and future generations. The extent to which these aspirations have been translated in previous and existing
policies and programmes has varied.
Swaziland’s top development priorities are spelt out in the National Development Strategy ((NDS), formulated in 1997
and reviewed in 2014. The NDS is the over-arching framework that provides a platform for the achievement of
sustainable development in the country. It seeks to balance the needs of the Swazi people with the environment’s
carrying capacity. The strategy has a medium to long term perspective (25 years).
The Draft Land Policy of 2009 which is yet to be approved (hence its implementation is pending), is very key since it is
the political choices on how to allocate land and its benefits. It specific objective is to encourage rational and suitable
use of land, and to encourage land ownership by Swazi Citizens.
193.3 SWOT Analysis of LDN Related Policies, Legislation and Regulations in Swaziland
The key LDN related policies and legislations were reviewed to identify the strengths, weaknesses, opportunities and
threats in achieving LDN in Swaziland, as summarized in table 7 below:
Table 7: SWOT analysis on the linkage between the legal and institutional environment in Swaziland and the country’s
commitment to achieve LDN
STRENGTHS WEAKNESSES
Legal Legal
There is currently no functional land policy and thus all
The Swaziland National Trust Commission (SNTC) other legislation and policies have been stifled.
Act of 1972 provides for proclamation of
institutions, national parks, nature reserves, Institutional
monuments, relics and antiques. This Act is
currently being amended to facilitate increasing While the national constitution gives the right to every
the protected area network from 4% to 6.6 % by citizen to be allocated land irrespective of gender and
2020. marital status, most of the land related legislations
The Natural Resources (Public Stream Banks) pre-date the national constitution and are yet to be
Regulations of 1951 provide for the extent to aligned to the constitution.
which one can undertake agricultural activities The NAP notes that most of the available relevant
near such places. One is only allowed to cultivate legislation and policies are fragmented, obsolete, non-
only one hundred feet from the bank of a river or inclusive and outdated. This renders them ineffective
a verge of a public stream. in addressing land management and administration
issues.
Overall, there is a need to improve and harmonize the
Institutional national policies and legislation in order to adequately
address land management and administration issues in
A multi-stakeholder National Committee for the Swaziland, including desertification and LDN
implementation of the National Biodiversity integration.
Strategy and Action Plan is operational and
effectively working so far. It includes the Ministry
of Agriculture. Where the UNCCD national focal
point seats.
OPPORTUNITIES THREATS
Legal Legal
The national climate change strategy has been Increasing prospects of mining within protected to
officially adopted and includes land use sector as a key stimulate economic growth identified land degradation
component to achieve NDC hotspots.
A number of important environmental legislations have
20been proposed but have not yet been enacted into law,
hence have remained bill for years. These include the
biodiversity Bill (2007), the Access and Benefit Sharing Bill
of 2006 and the
Institutional
Institutional Overlapping mandates between institutions that manage
The National Focal Points for the three UN natural resources e.g. deforestation is managed by the
Conventions seat in the National GEF Committee Department of Forestry as well as the Environment
where allocations of GEF is discussed to address Authority.
objectives of all three Conventions.
The Swazi Administration Order 6/1998 provides for the
administration of Swazi Affairs, including allocation of land,
sometimes land is not allocated in harmony with other
land related Acts.
3.4 LDN Baseline
As part of the LDN TSP, Swaziland received default data derived from global data sources for its use and validation
where national data is absent. The global data sets were presented and formed the basis for contextualization in the
absence of site specific data at the First Meeting of the LDN National Working Group Meeting held at the Royal Swazi
Sun Hotel, Ezulwini on Tuesday 28thMarch 2017. It was revealed at that Validation Meeting that the another data set on
SOC exists on Geoportal.rcmrd.org, but after careful perusal it was found out it was not different from that from global
source provided by the programme. A decision was then reached to still use the global SOC data in comparison to
whatever available national data on SOC.
These indicators for Swaziland have therefore been computed primarily, and to the largest extent possible, using the
default data sets and standardized national data sources. With the exception of land cover, national data sets for the
other two indicators for Swaziland are at best scanty and to that effect global data sources have been used in the
absence of field surveys, assessments and ground measurements.
The Ministry of Agriculture is responsible for land degradation monitoring while the Surveyor General’s Office under the
Ministry of Natural Resources is the custodian of all spatial data from various sectors and houses the National Spatial
Data. Forest Cover data is held by the Forestry Department under the Ministry of Tourism and environment affairs.
There is other recent land cover data that has been compiled under the Swaziland National Trust Commission. These
institutions were engaged in the LDN baseline setting process and are members of the LDN Working Group.
As a baseline, land degradation was considered to have taken place in Swaziland across the three LDN
indicators between 2000 and 2010 as follows:
21You can also read