Interannual variability and trends of combustion aerosol and dust in major continental outflows revealed by MODIS retrievals and CAM5 simulations ...
←
→
Page content transcription
If your browser does not render page correctly, please read the page content below
Atmos. Chem. Phys., 20, 139–161, 2020
https://doi.org/10.5194/acp-20-139-2020
© Author(s) 2020. This work is distributed under
the Creative Commons Attribution 4.0 License.

Interannual variability and trends of combustion aerosol and dust in
major continental outflows revealed by MODIS retrievals and
CAM5 simulations during 2003–2017
Hongbin Yu1 , Yang Yang2 , Hailong Wang2 , Qian Tan3,4 , Mian Chin1 , Robert C. Levy1 , Lorraine A. Remer5 ,
Steven J. Smith2 , Tianle Yuan1,5 , and Yingxi Shi1,5
1 Earth Sciences Division, NASA Goddard Space Flight Center, Greenbelt, MD, USA
2 PacificNorthwest National Laboratory, Richland, WA, USA
3 Bay Area Environmental Research Institute, Petaluma, CA, USA
4 NASA Ames Research Center, Moffett Field, CA, USA
5 Joint Center for Earth Science & Technology, University of Maryland at Baltimore County, Baltimore, MD, USA

Correspondence: Hongbin Yu (hongbin.yu@nasa.gov)

Received: 1 July 2019 – Discussion started: 3 September 2019
Revised: 12 November 2019 – Accepted: 16 November 2019 – Published: 3 January 2020

Abstract. Emissions and long-range transport of mineral            emissions from South Asia and the Middle East in the last
dust and combustion-related aerosol from burning fossil fu-        2 decades. Over the northwestern Pacific Ocean, which is of-
els and biomass vary from year to year, driven by the              ten affected by East Asian emissions of pollution and dust,
evolution of the economy and changes in meteorological             the MODIS retrievals show a decreasing trend of −0.021
conditions and environmental regulations. This study of-           per decade for τc and −0.012 per decade for τd , which is,
fers both satellite and model perspectives on the interannual      however, not reproduced by the CAM5 model. In other out-
variability and possible trends of combustion aerosol and          flow regions strongly influenced by biomass burning smoke
dust in major continental outflow regions over the past 15         or dust, both MODIS retrievals and CAM5 simulations show
years (2003–2017). The decade-long record of aerosol op-           no statistically significant trends; the MODIS-observed in-
tical depth (AOD, denoted as τ ), separately for combustion        terannual variability is usually larger than that of the CAM5
aerosol (τc ) and dust (τd ), over global oceans is derived from   simulation.
the Collection 6 aerosol products of the Moderate Resolution
Imaging Spectroradiometer (MODIS) onboard both Terra
and Aqua. These MODIS Aqua datasets, complemented by
aerosol source-tagged simulations using the Community At-          1   Introduction
mospheric Model version 5 (CAM5), are then analyzed to
understand the interannual variability and potential trends of     Mineral dust resulting from wind erosion in arid and semi-
τc and τd in the major continental outflows. Both MODIS            arid regions and combustion-related aerosol from burning
and CAM5 consistently yield a similar decreasing trend of          fossil fuels and biomass are transported at intercontinental
−0.017 to −0.020 per decade for τc over the North Atlantic         and hemispherical scales and deposited into adjacent oceans
Ocean and the Mediterranean Sea that is attributable to re-        in large amounts (Yu et al., 2013a; Uno et al., 2009). These
duced emissions from North America and Europe, respec-             aerosols exert important and far-reaching impacts on a va-
tively. On the contrary, both MODIS and CAM5 display an            riety of aspects of the environment, including air quality
increasing trend of +0.017 to +0.036 per decade for τc over        and human health (Prospero, 1999; Chin et al., 2007; Anen-
the tropical Indian Ocean, the Bay of Bengal, and the Arabian      berg et al., 2014; Tao et al., 2016), the radiation budget (Yu
Sea, which reflects the influence of increased anthropogenic       et al., 2006, 2012, 2013b; Song et al., 2018; Yang et al.,
                                                                   2017a, 2018a), cloud lifecycles and precipitation (Kaufman

Published by Copernicus Publications on behalf of the European Geosciences Union.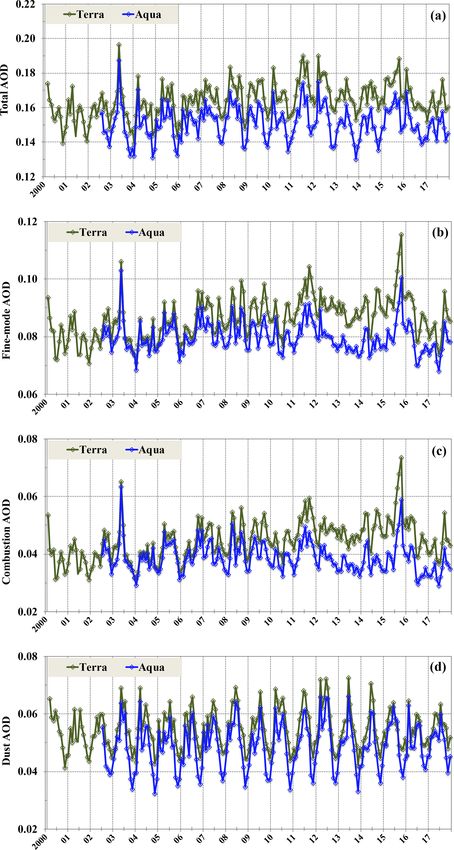
140                                                  H. Yu et al.: Trends of combustion aerosol and dust during 2003–2017

et al., 2005a; Creamean et al., 2013; Wang et al., 2013; Lu et    decadal timescale, although various uncertainties in aerosol
al., 2018), terrestrial and marine ecosystems (Jickells et al.,   retrievals and sensor degradation could complicate trend de-
2005; Yu et al., 2015a), and weather and climate (Yuan et al.,    tection (Li et al., 2009).
2016; Tao et al., 2018).                                             In the last decade, a number of studies have analyzed satel-
   Emissions of combustion aerosol and its precursors asso-       lite data to detect aerosol interannual variability and trends
ciated with industrial activities have been changing in re-       on regional or global scales, mostly focusing on the total
sponse to changes in population, energy structure, and en-        aerosol without distinguishing aerosol types from the data
vironmental policies. Emissions of particles from biomass         (Mishchenko et al., 2007; Zhao et al., 2008; Zhang and Reid,
burning change with both atmospheric state and human prac-        2010; Zhang et al., 2017; Hsu et al., 2012; Chin et al., 2014;
tices. Dust emissions depend strongly on winds and synop-         Yu et al., 2015b; Jongeward et al., 2016; Alfaro-Contreras et
tic system meteorology, as well as surface conditions. Mete-      al., 2017; de Leeuw et al., 2018; Chedin et al., 2018). De-
orological conditions also determine where the particles go       termining the types of aerosol responsible for the detected
and how much is transported across oceans or deposited into       AOD variability or trends remains elusive. A distinction be-
oceans. Given large interannual variations in atmospheric cir-    tween largely natural dust and largely man-made combustion
culations and changes in environmental regulations and other      aerosol should provide greater insight into changes in aerosol
drivers on national to regional bases, it is expected that com-   sources and long-range transport than does total aerosol.
bustion aerosol and dust in the atmosphere may have experi-       Dust and combustion aerosol are also different in their many
enced pronounced year-to-year variation, and significant re-      properties and a variety of environmental impacts.
gional trends may have occurred. Such aerosol changes could          The overall objective of this study is to characterize the
have important implications for a variety of environmental        interannual variability and possible trends of combustion
issues as mentioned above. Currently it remains a great chal-     aerosol and dust, separately, in major continental outflow
lenge to quantify the changes in aerosol sources, long-range      regions over the last 2 decades. Specific science questions
transport, and environmental impacts.                             we address include the following: how has industrial pol-
   Satellites are a suitable platform to observe aerosol inter-   lution changed on a regional basis in recent decades? How
annual variability and trends because of their routine sam-       do episodic dust and biomass burning smoke vary from year
pling over decadal and even multi-decadal timescales with         to year? Are there regional trends over the past 15 years?
extensive spatial coverage. For example, the Moderate Reso-       Why does the aerosol change? Is the AOD trend consistent
lution Imaging Spectroradiometer (MODIS) sensor has been          with that of aerosol emissions? We proceed to achieve the
observing the global aerosol system from both the Terra           objective through a combined analysis of satellite retrievals
(since February 2000) and Aqua (since July 2002) satellites       from the MODIS instrument and model simulations from
for more than 15 years (Levy et al., 2018). The MODIS             the Community Atmosphere Model version 5 (CAM5). In
aerosol data record could potentially be extended beyond          contrast to previous work, this study examines combustion
its lifetime by bridging with retrievals applied to the Vis-      aerosol and dust separately from the MODIS retrievals. We
ible Infrared Imaging Radiometer Suite (VIIRS) onboard            also use the CAM5 simulations with aerosol source-tagging
SNPP (launched in late 2011). VIIRS is sufficiently simi-         capability to do source attribution and chemical characteri-
lar in design to MODIS that the MODIS aerosol retrieval           zation for the MODIS-detected combustion AOD variability
algorithms have been adapted for VIIRS inputs, and con-           and trends in major outflow regions of continental aerosol.
tinuity of the aerosol record is being evaluated (Levy et         We focus on the outflow regions over water bodies because
al., 2015a). Several other sensors have also been detect-         the MODIS retrievals of AOD and particle properties are
ing aerosols over the globe for at least a decade, including      more accurate over ocean than over land, and thus we can
the Advanced Very High Resolution Radiometer (AVHRR)              better separate combustion aerosol from dust.
(Zhao et al., 2008), the Total Ozone Mapping Spectrom-               The rest of paper is organized as follows. Section 2 gives
eter (TOMS) (Torres et al., 2002), the Sea-Viewing Wide           a brief description of the MODIS aerosol products and the
Field-of-view Sensor (SeaWiFS) (Hsu et al., 2012), the            CAM5 model setups. In Sect. 3, we first describe the deriva-
Multi-angle Imaging SpectroRadiometer (MISR) (Kahn et             tion of dust and combustion aerosol components specific to
al., 2007), the Ozone Monitoring Instrument (OMI) (Tor-           the MODIS Collection 6 (C6) data (3.1), which is an impor-
res et al., 2007), the Cloud–Aerosol Lidar with Orthogonal        tant update to previous studies based on the earlier MODIS
Polarization (CALIOP) (Winker et al., 2013), and the In-          data collections (Kaufman et al., 2005b; Yu et al., 2009).
frared Atmospheric Sounding Interferometer (IASI) (Capelle        This is followed by the seasonal and spatial characteristics
et al., 2018). These instruments have been acquiring long-        of dust and combustion AOD climatology based on both
term datasets of aerosol optical depth (AOD) and several par-     MODIS retrievals and CAM5 simulations (3.2). Then we an-
ticle properties (e.g., size, shape, and absorption). CALIOP      alyze the interannual variability and possible trends of τc and
also provides critical information for the aerosol vertical       τd in major combustion aerosol and dust outflows from the
distribution. These data records provide an opportunity to        MODIS Aqua retrievals complemented by the CAM5 simu-
characterize aerosol interannual variability and trends over a    lations (3.3). Section 4 summarizes major conclusions from

Atmos. Chem. Phys., 20, 139–161, 2020                                               www.atmos-chem-phys.net/20/139/2020/
H. Yu et al.: Trends of combustion aerosol and dust during 2003–2017                                                           141

the combined MODIS and CAM5 analysis and discusses ma-             (DMS). The combustion aerosol, also referred to as “pollu-
jor issues of relevance.                                           tion” or “anthropogenic” aerosol in previous studies (Kauf-
                                                                   man et al., 2005b; Yu et al., 2008, 2009), results mainly from
                                                                   the burning of fossil fuels and biomass. It also includes con-
2     Description of MODIS retrievals and CAM5                     tributions from volcanic activities. Based on Eqs. (1) and (2),
      simulations of aerosols                                      τd and τc can be calculated from the MODIS-retrieved τ and
                                                                   f , with appropriate parameterizations for fd , fc , fm , and τm
2.1    MODIS aerosol retrievals
                                                                   (see details in Kaufman et al., 2005b; Yu et al., 2009). In
The twin MODIS sensors have been flying on Terra (with             earlier versions (e.g., C4 and C5), while τm was parameter-
equatorial overpassing time at about 10:30 local time) since       ized as a function of wind speed, fd , fc , and fm were de-
February 2000 and on Aqua (with equatorial overpassing             termined from retrieved f in selected regions and seasons
time at about 13:30 local time) since June 2002. The MODIS         for which a specific aerosol type dominates (Kaufman et al.,
instrument is a 36-channel radiometer covering wavelengths         2005b; Yu et al., 2009). Given that the MODIS retrievals,
from deep blue (0.41 µm) to the thermal infrared. The instru-      in particular f , are sensitive to many details of the retrieval
ment samples a broad swath of about 2330 km at a spatial           algorithm and instrument calibration, the characteristic fd ,
resolution of 500 m or 1 km (depending on channel) at nadir.       fc , and fm should be considered “dynamical”. As discussed
As such the MODIS sensors have been acquiring essen-               in Levy et al. (2013, 2018), several aspects of the MODIS
tial data for atmospheric and surface properties with nearly       DT retrieval algorithm and the instrument calibration have
daily global coverage for a period of more than 15 years.          evolved from C5 to C6, which warrants a reassessment of
Three complementary aerosol retrieval algorithms: namely,          the dust–combustion separation approach to ensure the con-
the Dark Target (DT), the Deep Blue (DB), and the Multi-           sistent use of the MODIS C6 product without possibly intro-
Angle Implementation of Atmospheric Correction (MAIAC)             ducing additional errors (Yu et al., 2009). This is addressed
algorithms have been developed, operated, maintained, and          in Sect. 3.1.
updated at NASA Goddard Space Flight Center. The consis-
tent retrieval algorithms have been applied to both MODIS          2.2   CAM5 simulations
sensors during their lifetime. In this study, we use aerosol re-
trievals from the DT algorithm that was developed to retrieve      To investigate interannual variability and trends of global
aerosol loading and properties over dark surfaces, including       aerosols, a 37-year simulation covering 1979–2015 has been
ocean–water (Remer et al., 2005) and vegetated land (Levy          carried out with time-varying emissions of aerosol and pre-
et al., 2007). Because of its wide spectral range and the sim-     cursors using the Community Atmosphere Model version 5.3
plicity of the dark ocean surface, the DT algorithm has the        (CAM5–MAM3). In the three-mode modal aerosol module
capability of retrieving AOD with high accuracy and infor-         (MAM3; Liu et al., 2012), aerosol species, including sulfate
mation on particle size (in the form of the Ångström expo-         (SO4 ), black carbon (BC), primary organic matter (POM),
nent, effective radius, or fine-mode fraction – FMF) (Remer        second organic aerosol (SOA), mineral dust, and sea salt, are
et al., 2005; Levy et al., 2013).                                  predicted with improved convective transport and wet scav-
   In this study, we use the MODIS DT C6 over-ocean                enging schemes (Wang et al., 2013). At 1.9◦ latitude by 2.5◦
aerosol data records from both Terra and Aqua, i.e., the           longitude horizontal grids and 30 vertical layers, model wind
Level 3 daily product gridded to 1◦ ×1◦ (i.e., MOD08D3 and         fields are nudged to the NASA Modern Era Retrospective
MYD08D3, respectively) (Levy and Hsu, 2015b, c). In pre-           Analysis for Research and Applications (MERRA) reanaly-
vious studies, we developed an approach of distinguishing          sis (Rienecker et al., 2011) every 6 h. This long-term histori-
dust from combustion aerosol by using MODIS retrievals of          cal simulation ended in 2015 because of the lack of availabil-
total AOD (τ ) and FMF (f ) (Kaufman et al., 2005b; Yu et          ity of the MERRA reanalysis. Monthly anthropogenic (ver-
al., 2009). Both τ and f refer to properties at 550 nm here-       sion 20160726, 1979–2014) and open biomass burning (ver-
after, except if specified otherwise. In this approach, τ and      sion 20161213, 1979–2015) emissions are taken from the
fine-mode AOD (f τ ) are assumed to be composed of marine          Coupled Model Intercomparison Project Phase 6 (CMIP6)
aerosol, dust, and combustion aerosol, i.e.,                       emission database (Hoesly et al., 2018; van Marle et al.,
                                                                   2017). For anthropogenic emissions in the year 2015, emis-
τ = τm + τd + τc ,                                          (1)    sion data are interpolated from the SSP2–4.5 (Shared So-
f τ = fm τm + fd τd + fc τc ,                               (2)    cioeconomic Pathways 2–4.5) forcing scenarios (Riahi et al.,
                                                                   2017). Note that the term biomass burning in this work refers
where the subscripts m, d, and c refer to marine aerosol, dust,    to open burning, such as forest fires and agricultural waste
and combustion aerosol, respectively. The marine aerosol           burning on fields. Biofuel combustion is categorized as an-
refers collectively to the primary and secondary particles as-     thropogenic emissions.
sociated with wave-breaking sea spray, including sea salt,            To understand the source attribution and chemical compo-
marine organics, and sulfate produced from dimethyl sulfide        nents of combustion aerosol in each of 13 continental out-

www.atmos-chem-phys.net/20/139/2020/                                                   Atmos. Chem. Phys., 20, 139–161, 2020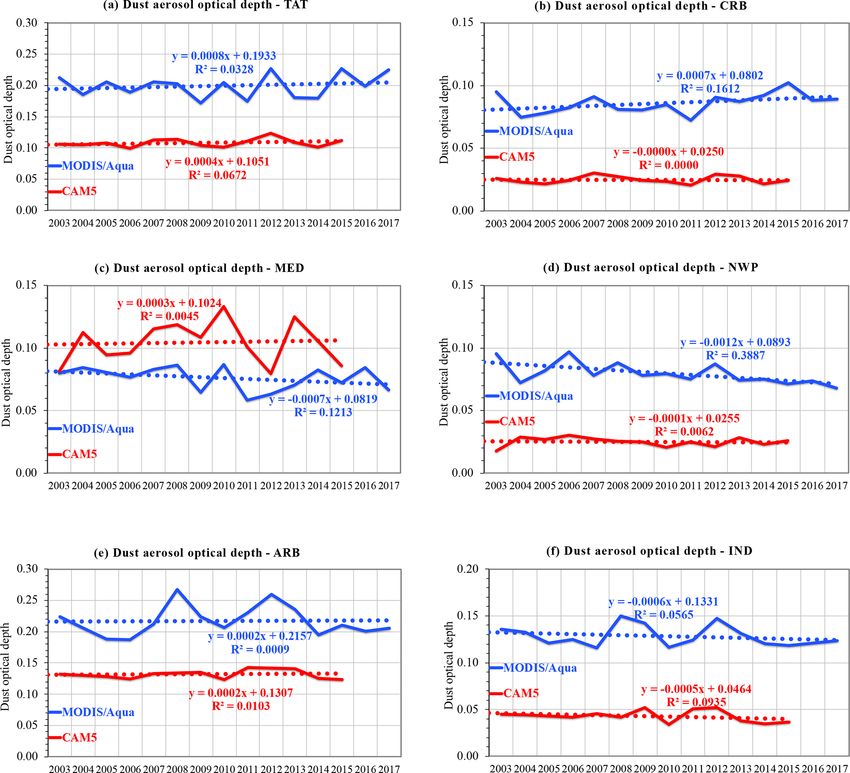
142                                                   H. Yu et al.: Trends of combustion aerosol and dust during 2003–2017

flow regions (Fig. 1a) in this study, we utilize the CAM5          3     Results
aerosol source-tagging capability (Wang et al., 2014; Yang
et al., 2017b, c, 2018a, b). With this capability, BC, POM,        3.1    Characteristic FMFs for distinct aerosol types from
and sulfate (and precursor gases SO2 and DMS) from a vari-                MODIS C6 products
ety of sources are explicitly tagged and tracked in the model.
This tagging technique can offer insights into contributions       As discussed in Sect. 2.1, a caveat for the MODIS-based
by different regions and sources, which satellite retrievals       dust–combustion separation algorithm is that fd , fc , and fm
cannot provide. For this study, aerosols and their precursor       derived from the MODIS Terra C4 (Kaufman et al., 2005b)
emissions, including SO2 , sulfate, BC, and POM, are tagged        and C5 (Yu et al., 2009) products should not be used di-
with respect to 14 source regions (Fig. 1b) as defined in the      rectly for the MODIS C6 on Terra and Aqua. To maintain a
Hemispheric Transport of Air Pollution Phase 2 (HTAP2),            self-consistent use of the MODIS C6 products, here we first
namely North America (NAM), Central America (CAM),                 reassess the characteristic FMF for individual aerosol types
South America (SAM), Europe (EUR), North Africa (NAF),             (i.e., fd , fc , fm ) and then re-derive combustion and dust
southern Africa (SAF), the Middle East (MDE), South-               AOD by following the method in previous studies (Kauf-
east Asia (SEA), Central Asia (CAS), South Asia (SAS),             man et al., 2005b; Yu et al., 2009). Figure 3 shows how the
East Asia (EAS), Russia–Belarus–Ukraine (RBU, hereafter            MODIS-retrieved FMF changes with AOD, separately for
Russia), Pacific–Australia–New Zealand (PAN, hereafter the         Terra (a) and Aqua (b), in three regions respectively dom-
southern Pacific), and rest of the world (ROW). The tag-           inated by outflows of combustion aerosol (North Atlantic
ging also applies to two specific sources for sulfate: volcanic    Ocean, in summer), dust (eastern North Atlantic Ocean just
emissions (VOL) and DMS chemistry (DMS). Note that sec-            off the coast of North Africa, in summer), and marine aerosol
ondary organic aerosol (SOA) is not included in the tagging        (southern Indian Ocean, full year). (These regions are defined
in this study, although this is calculated by the model. Fig-      the same as in previous studies to facilitate comparison.)
ure 1c shows the linkage between the continental outflow re-       The data in the southern Indian Ocean are stratified into two
gions and source regions as reflected by the 2003–2015 cli-        time periods when the region can be somewhat influenced
matology of CAM5 source attributions of combustion AOD             by transported smoke in one time period (May–October, de-
in each of the outflow regions.                                    noted as “Marine1”) and by transported dust in the other
   Figure 2 displays the global annual anthropogenic and           (November–April, denoted as “Marine2”). For comparison,
biomass burning emissions of SO2 , BC, and POM from 2003           similar FMF–AOD relationships (Fig. 3c) are derived from
to 2015 that are stacked from the 14 source regions. There         the Goddard Chemistry Aerosol Radiation Transport (GO-
are several prominent changes in regional emissions. The           CART) model. In the GOCART model, sulfate, POM, and
SO2 emissions from North America and Europe have been              BC are counted as fine-mode aerosol, whereas dust and sea-
consistently decreasing from 2003 to 2015, with an accumu-         salt include both fine-mode and coarse-mode with a division
lated reduction of 67 % and 45 % of their 2003 levels, re-         at a radius of 1 µm. Generally, MODIS retrievals and GO-
spectively. In contrast, the SO2 emissions from South Asia         CART simulations consistently show similar FMF changes
have continuously increased by 80 % over this time period.         with respect to AOD. In the combustion-dominated outflow
The SO2 emissions from East Asia have taken a more com-            region, FMF increases with increasing AOD, which is con-
plicated trajectory, increasing from 2003 until 2007 and then      sistent with the addition of fine-mode combustion particles
fluctuating from year to year until a sharp decline occurred in    into the relatively coarser (smaller FMF) background ma-
2015. Overall, the East Asian SO2 emissions have decreased         rine aerosol. In the dust outflow regions, on the contrary,
by 16 % from 2003 to 2015. The different trajectories be-          FMF decreases with increasing AOD, which is consistent
tween East Asian and South Asian SO2 emissions are gen-            with the addition of coarser dust particles (hence smaller f )
erally consistent with satellite observations (Li et al., 2017).   on the background marine aerosol. For the marine-aerosol-
East Asia and southern Africa are the two largest emitters of      dominated southern Indian Ocean, FMF remains relatively
BC and POM, with the former dominated by anthropogenic             constant, with increasing AOD for AOD up to about 0.06, for
activities and the latter by biomass burning. In contrast to       both the Marine1 and Marine2 clusters. Then FMF increases
the region’s SO2 emissions discussed earlier, BC and POM           (decreases) with increasing AOD for the Marine1 (Marine2)
emissions in East Asia increased continuously by 40 % and          cluster. This bifurcating pattern reflects the influence of long-
27 %, respectively, in this dataset. For both BC and POM           range-transported smoke and dust in the Marine1 and Ma-
emissions, large interannual variability is shown in major         rine2 cluster, respectively.
biomass burning regions, such as South America, southern              We derive from Fig. 3 the characteristic fc , fd , and fm
Africa, Southeast Asia, and Russia.                                for individual aerosol types as follows. On one hand, fc for
                                                                   combustion aerosol and fd for dust are taken as the average
                                                                   f for the largest AOD bin in the combustion-aerosol- and
                                                                   dust-dominated region, respectively. In the largest AOD bin,
                                                                   a contribution from the marine background is at a minimum

Atmos. Chem. Phys., 20, 139–161, 2020                                                 www.atmos-chem-phys.net/20/139/2020/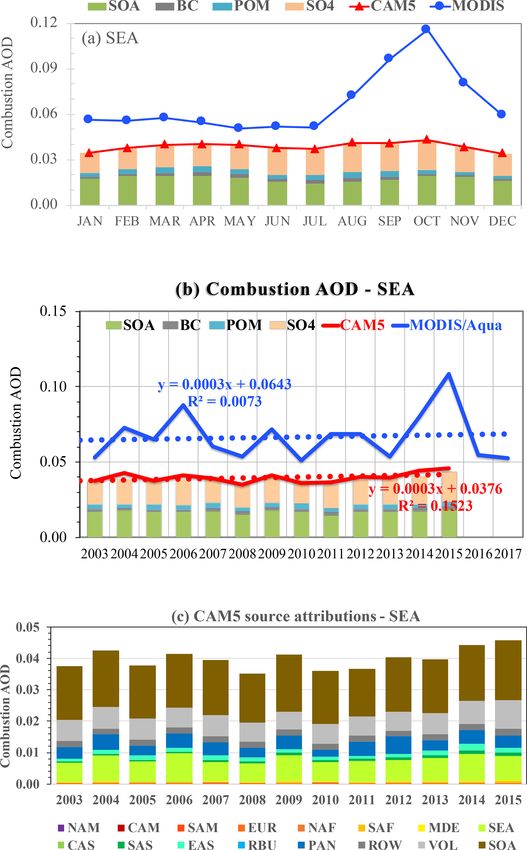
H. Yu et al.: Trends of combustion aerosol and dust during 2003–2017                                                                    143

Figure 1. Illustration of (a) 13 continental outflow regions (covering only the water-body portion of boxes) plus two remote regions (STI and
STP) overlaid onto a map of MODIS annual mean AOD climatology (color bar), (b) 14 source regions used in the CAM5 tagged simulations,
and (c) CAM5 source attributions (i.e., stacked fractions from 14 source regions plus VOL and SOA types) of combustion AOD in the outflow
regions based on 2003–2015 simulations.

and is neglected. On the other hand, fm for marine aerosol               Table 1. Characteristic fine-mode fraction for individual aerosol
is the average f in the smallest AOD bin that represents the             types (fc , fd , and fm ) as derived from the MODIS C6 data and
marine background. Table 1 lists the characteristic fc , fd ,            GOCART simulations.
and fm derived from the MODIS C6 data (both Terra and
Aqua) and the GOCART model. The three datasets consis-                          Aerosol type        MODIS       MODIS      GOCART
                                                                                                     Terra       Aqua
tently show that fc is substantially larger than fd , with fm in
between. However, some notable differences do exist among                       Combustion (fc )        0.92       0.89          0.95
them. The MODIS-based characteristic fc , fd , and fm dif-                      Dust (fd )              0.26       0.31          0.25
fer by 0.03, 0.05, and 0.07, respectively, between Terra and                    Marine (fm )            0.55       0.48          0.78
Aqua. These differences may have resulted from differences
in instrument calibrations (Levy et al., 2018). The major dif-
ference between GOCART and MODIS exists for fm , with
the GOCART fm of 0.78 being much higher than the MODIS                   occurred for fd and fm in the course of evolving data collec-
values of 0.55 for Terra and 0.48 for Aqua.                              tions. On one hand, fd has decreased from 0.51 (C4) and 0.37
   The characteristic fc , fd , and fm derived from the MODIS            (C5) to 0.26 (C6). On the other hand, fm has increased from
Terra C6 products in this study are also compared with those             0.32 (C4) and 0.45 (C5) to 0.55 (C6). These changes high-
previously derived from the C4 (Kaufman et al., 2005b) and               light the importance of the reassessment above to ensure a
C5 (Yu et al., 2009), as shown in Table 2. Although fc re-               consistent use of the MODIS products. Applying the charac-
mains nearly unchanged, notable but opposite changes have                teristic FMF values derived from the earlier versions of data
                                                                         (C5 or C4) to the MODIS C6 products would introduce large

www.atmos-chem-phys.net/20/139/2020/                                                           Atmos. Chem. Phys., 20, 139–161, 2020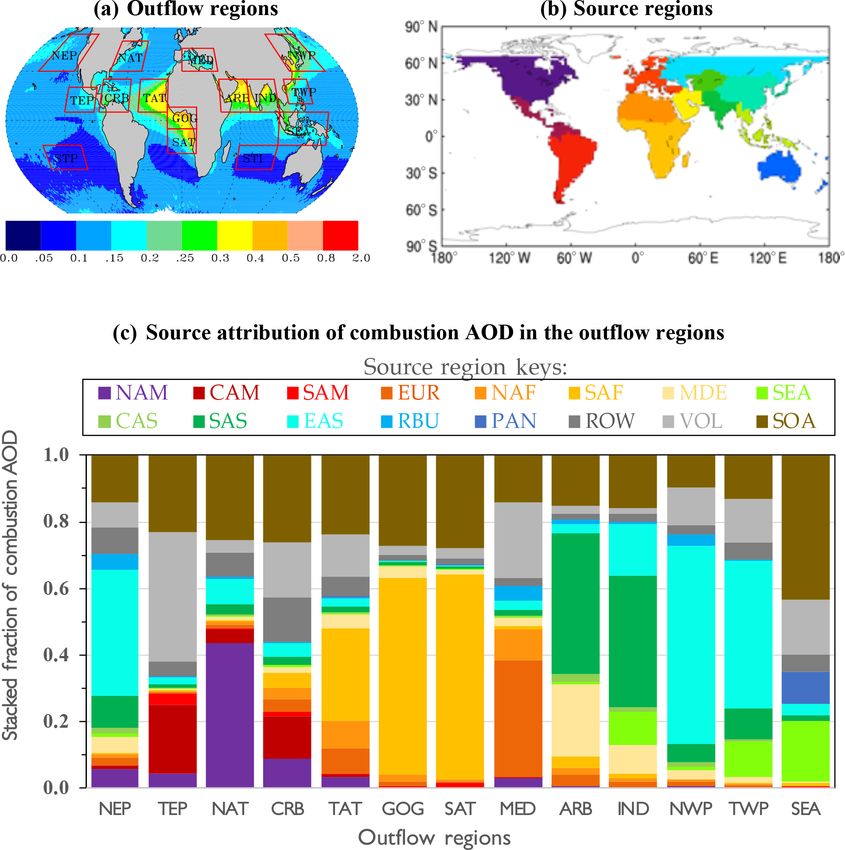
144                                                  H. Yu et al.: Trends of combustion aerosol and dust during 2003–2017

Figure 2. The 2003–2015 source-region stacked global annual
                                                                  Figure 3. Aerosol fine-mode fraction (FMF) as a function of AOD
emissions of SO2 (a), BC (b), and POM (c) used in the CAM5
                                                                  in three regions representative of marine aerosol, dust, and combus-
model.
                                                                  tion aerosol derived from the MODIS observations on Terra (a) and
                                                                  Aqua (b) and the GOCART model (c). Marine aerosol regime is
uncertainty to the calculation of τd and τc . Similarly, cau-     categorized into Marine1 and Marine2, representing May–October
                                                                  and November–April, respectively. All the data are sorted into 20
tion should be exercised when applying the MODIS-based
                                                                  AOD bins with equal data points (numbers in brackets), and the
characteristic FMF values to the VIIRS over-ocean aerosol
                                                                  mean (marked with symbol) and standard deviation (vertical bar) of
products, despite their similarity in instrument design and the   FMF are calculated.
Dark Target aerosol retrieval algorithm (Levy et al., 2015a).
It is strongly recommended that a similar assessment of the
characteristic FMFs be carried out with the VIIRS retrievals.
                                                                  ucts by following a similar method as described in Yu et
3.2   Climatology of combustion aerosol and dust from             al. (2009). τm is parameterized as a function of daily 10 m
      MODIS and CAM5                                              wind speed from the Modern Era Retrospective Analysis
                                                                  for Research and Applications version 2 (MERRA-2) (Ger-
We apply the C6-based characteristic FMF values to derive         alo et al., 2017) following the average of two relationships
τc and τd from the MODIS Terra and MODIS Aqua C6 prod-            from Kiliyanpilakkil and Meskhidze (2011) and Mulcahy et

Atmos. Chem. Phys., 20, 139–161, 2020                                                 www.atmos-chem-phys.net/20/139/2020/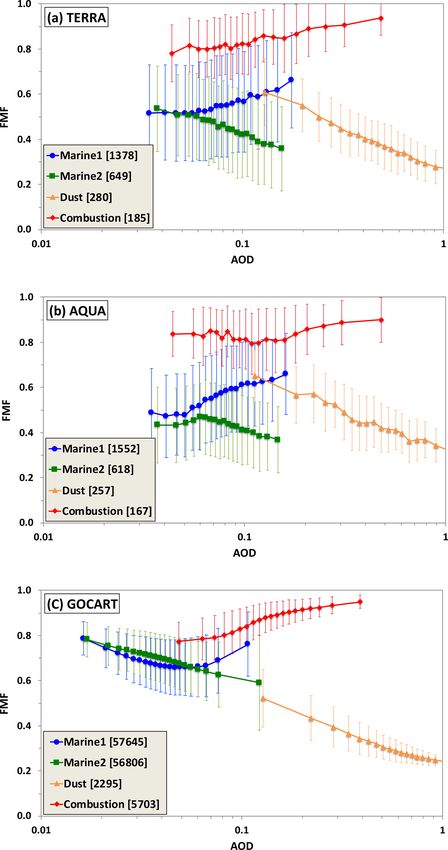
H. Yu et al.: Trends of combustion aerosol and dust during 2003–2017                                                           145

Table 2. Comparison of characteristic FMF for individual aerosol   Ocean. On the basis of the global ocean average, the MODIS-
types as derived from different MODIS data collections (C6, C5,    derived τd of 0.047 is about a factor of 5 higher than the
and C4). Values corresponding to C5 and C4 were taken from Yu et   0.009 from the CAM5 model. The MODIS-derived global
al. (2009).                                                        mean τm is 0.066 at 550 nm, which agrees well with the
                                                                   climatology based on AERONET observations (Kaufman et
            Aerosol type         C6     C5      C4                 al., 2001; Smirnov et al., 2002). Although the CAM5 model
            Combustion (fc )    0.92   0.90   0.92                 agrees with the global mean of MODIS-derived marine AOD
            Dust (fd )          0.26   0.37   0.51                 within 8 %, the model is higher at middle to high latitudes
            Marine (fm )        0.55   0.45   0.32                 but lower in tropical regions than the MODIS-derived marine
                                                                   AOD. In summary, substantial disparity in dust AOD exists
                                                                   between the MODIS retrieval and CAM5 simulations. Al-
                                                                   though the cloud contamination issues discussed earlier may
al. (2008). Figure 4 shows the 2003–2015 MODIS Aqua cli-           have biased the MODIS-derived dust AOD higher, this alone
matology of annual mean total AOD and its partition into τc ,      is unlikely to adequately explain the factor of 5 difference
τd , and τm over ocean (left panels).                              between MODIS retrievals and CAM5 simulations. We will
    The figure shows that the spatial patterns of combustion       further discuss this issue by applying insight gained from a
and dust AOD over ocean derived from the MODIS retrievals          regional analysis.
are consistent with their largely well-known upwind conti-            The partitioning of AOD is further examined on a regional
nental sources. Major outflow regions with elevated combus-        basis, focusing on 13 major continental outflow regions and
tion AOD include the following: off the coast of the Asian         two pristine regions as illustrated in Fig. 1a. Figure 5 shows
continent over the North Pacific, off the coast of the east-       the regional partition of total AOD into marine aerosol, com-
ern US over the North Atlantic, off the coast of the Indian        bustion aerosol, and dust on an annual mean basis from both
subcontinent over the tropical Indian Ocean and the Bay of         MODIS Aqua retrievals and CAM5 simulations. Both the ab-
Bengal, in the Gulf of Mexico and eastern tropical Pacific         solute value and fractional contribution of AOD by the three
Ocean, and over the tropical Atlantic Ocean downwind of            components are shown in stacked bar charts with different
the African biomass burning region. Major dust outflow re-         colors. The sum of the fractional contributions by the three
gions include the tropical Atlantic Ocean and the Caribbean        components amounts to 1.0 in the stacked bar charts. The
Basin, the North Pacific Ocean, and the Arabian Sea–tropical       seasonal variability of regional aerosol components based on
Indian Ocean. Although dust has been observed over the             the MODIS retrievals is shown in Fig. S2 in the Supplement.
southeastern Atlantic Ocean (Vickery et al., 2013; Formenti        The MODIS retrievals show that marine AOD falls into a
et al., 2019), the MODIS-derived dust AOD is likely over-          range of 0.053–0.067 across all the regions. In the pristine
estimated. The year-round presence of stratocumulus clouds         regions (STP and STI), τm accounts for about 60 % of to-
in the region poses a major challenge for aerosol retrievals,      tal AOD. The remainder is partitioned into τc of 0.015 and
probably yielding a high AOD bias, low FMF bias, and hence         τd of 0.024 on average. For comparison, the CAM5 simu-
a high bias of dust AOD. In fact, the MODIS-derived τc is          lations suggest that marine AOD accounts for about 90 %
higher than that derived from MISR and IASI south to the           of total AOD in these pristine regions, with the remaining
Equator (Yu et al., 2019). Over the tropical Pacific Ocean, a      10 % contributed largely by combustion aerosol. Although
long belt of somewhat elevated dust AOD may also indicate          the MODIS-retrieved τc and τd levels in these pristine re-
an artifact due to possible cloud contamination. The seasonal      gions do represent the smallest continental influences among
variations of τc and τd are shown in Fig. S1 of the Supple-        all the regions, they may be subject to uncertainty or bias. For
ment.                                                              example, the MODIS aerosol retrievals are inevitably con-
    The CAM5 simulations of τ and its components (τc , τd ,        taminated by imperfect cloud screening, possibly resulting in
and τm ) over both land and ocean are shown in the right pan-      a high AOD bias and low FMF bias. The parameterization of
els of Fig. 4. Here for the purpose of comparison with the         τm could also introduce uncertainty to the derived τc and τd .
MODIS data, we derive the CAM5 marine AOD as a sum                 Both the issues would affect τd more than τc . It is, however,
of the AOD of sea salt and DMS-generated SO4 and the               formidable to rigorously assess the bias without acquiring in-
combustion AOD as a sum of the AOD of SO4 (excluding               dependent measurements of dust optical depth with high ac-
those generated from DMS chemistry), BC, POM, and SOA.             curacy. Nevertheless, if we assume that these remote regions
The CAM5 model captures the major outflows of combustion           are perfectly pristine without any influence from combustion
aerosol well. On global ocean average, the CAM5 τc (0.033)         aerosol and dust, then the 0.015 and 0.024 could represent an
is lower than the MODIS retrieval of 0.038 by about 13 %.          upper bound of potential bias associated with the MODIS-
However, the CAM5 model substantially underestimates the           derived τc and τd , respectively. If it is further assumed that
dust outflows into the North Pacific Ocean and the tropical        a similar magnitude of bias exists over the global ocean, this
Atlantic Ocean, although it reproduces the MODIS-derived           yields a bracket for the MODIS-based global ocean average
dust outflow into the Arabian Sea and the tropical Indian          of 0.023–0.038 for τc and 0.023–0.047 for τd . For compari-

www.atmos-chem-phys.net/20/139/2020/                                                   Atmos. Chem. Phys., 20, 139–161, 2020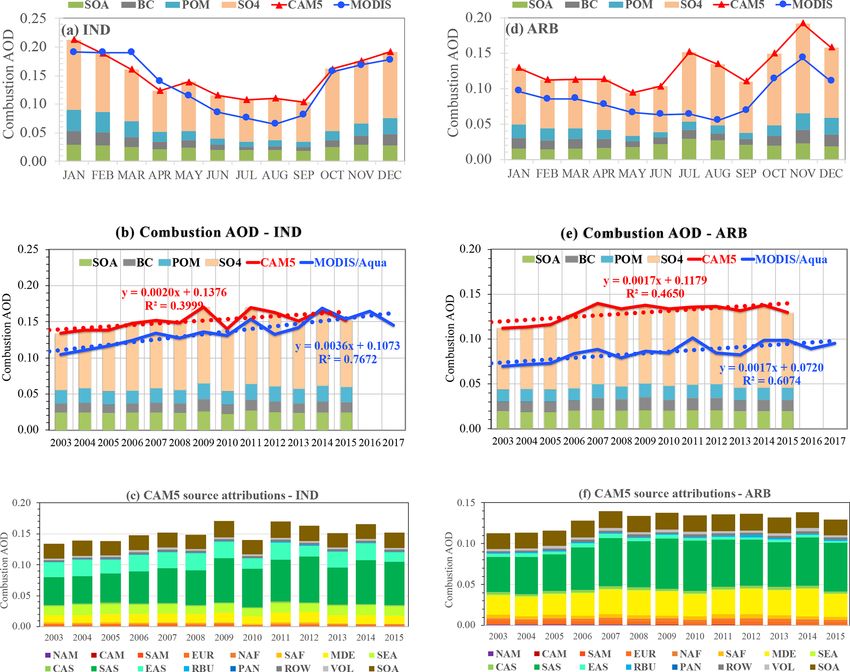
146                                                    H. Yu et al.: Trends of combustion aerosol and dust during 2003–2017

Figure 4. The 2003–2015 AOD climatology (a, e) and its partition into combustion, dust, and marine aerosol as derived from MODIS Aqua
observations (a–d) and CAM5 simulations (e–h). Note that the color scale for total AOD (a, e) is different from that of its components.

son, τc derived from the earlier versions of the MODIS prod-          trievals in Fig. 5 further indicate relative contributions of τc
uct is 0.033 (Kaufman et al., 2005c) and 0.035 (Yu et al.,            and τd in the outflow regions. The three most dust-dominated
2009) for C4 and C5, respectively. The CAM5 τc of 0.033               regions are TAT, GOG, and ARB, where τd > 0.2 and ac-
also falls into the range of the adjusted MODIS retrievals.           counts for more than 50 % of τ . The three highest regional
On the other hand, the τd of 0.009 from the CAM5 model                τc (>0.1) values occur in IND, GOG, and the northwestern
still accounts for no more than 38 % of the MODIS retrieval.          Pacific Ocean (NWP), which respectively account for about
This may suggest that a great deal of effort is needed to im-         44 %, 28 %, and 45 % of τ . The lower percentage of τc in
prove the model simulations of dust.                                  GOG results from the coexistence of high τd of 0.237 in the
   In comparison to the remote regions, the percentage of τm          region. Several regions have a lower τc that, however, ac-
contribution from the MODIS retrieval is decreased to 13 %–           counts for a higher percentage of τ due to small share of dust,
47 % in the major outflow regions, with the magnitude de-             including the tropical eastern Pacific (TEP), the southeast-
pending on the influence of continental aerosol sources. The          ern Atlantic Ocean (SAT), the Mediterranean Sea (MED),
τm contribution is more than 40 % in the northeastern Pacific         the southeastern Asia (SEA), and the tropical western Pacific
Ocean (NEP) and the northern Atlantic Ocean (NAT). The τm             Ocean (TWP). As discussed earlier, the contribution of τc in
contribution drops below 20 % in the Gulf of Guinea (GOG),            SAT may have been underestimated because the persistence
the Arabian Sea (ARB), northern Indian Ocean and the Bay              of cloudiness in the region has likely resulted in the high
of Bengal (IND), and the tropical Atlantic Ocean (TAT) be-            bias to τ and τd . In comparison to the MODIS retrievals, the
cause of strong influences of desert dust and combustion-             CAM5 simulations generally yield much smaller dust frac-
related aerosol from the upwind continent. The MODIS re-

Atmos. Chem. Phys., 20, 139–161, 2020                                                    www.atmos-chem-phys.net/20/139/2020/
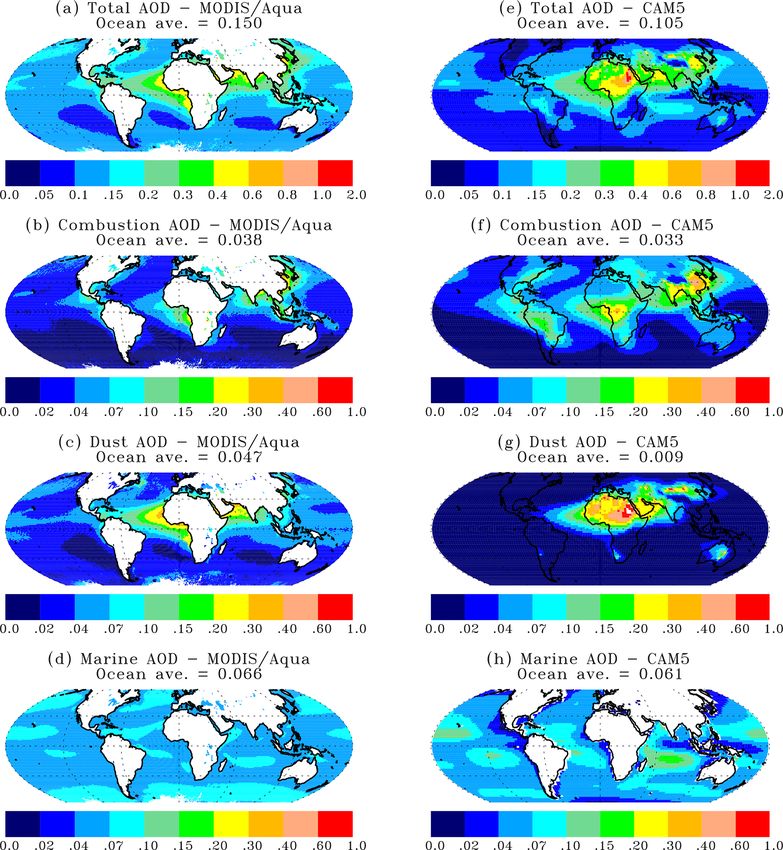
H. Yu et al.: Trends of combustion aerosol and dust during 2003–2017                                                        147

tions. One exception is the MED region where the CAM5            and possible trends of combustion and dust AOD on a re-
dust fraction is the largest among all the regions.              gional basis.
   Although the MODIS Terra retrievals (not shown) bear
great resemblance to the patterns revealed by the MODIS          3.3     Interannual variability and trends of combustion
Aqua retrievals (Fig. 4), the two differ somewhat in the mag-            aerosol and dust in major continental outflows
nitude of AOD. Previous studies have found an increasing
trend of total AOD over the global ocean from analyzing          In this section, we use the MODIS Aqua retrievals over the
the MODIS Terra retrievals but no trend from the MODIS           last 15 years (2003–2017) to study regional AOD interannual
Aqua retrievals (Zhang et al., 2017; Levy et al., 2018). It      variability and trends, separately for combustion aerosol and
has been argued that this MODIS Terra trend of global ocean      dust, focusing on the 13 major continental outflow regions
mean AOD is spurious, which could have resulted from im-         defined in Fig. 1a. The significance of a trend is checked with
perfect calibrations being implemented to correct radiances      the Student’s t test at two levels (p
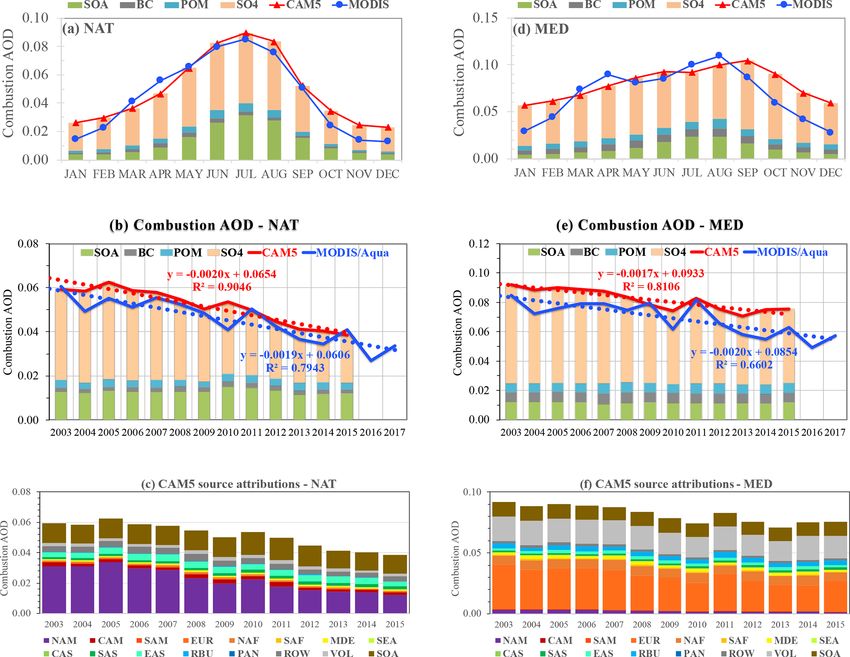
148                                                      H. Yu et al.: Trends of combustion aerosol and dust during 2003–2017

Figure 5. A climatology of aerosol components (i.e., marine, combustion, and dust) in 15 selected regions (see Fig. 1a for definition) based
on the MODIS Aqua 2003–2017 observations for (a) AOD and the (b) stacked AOD fraction as well as the CAM5 2003–2015 simulations
for (c) AOD and the (d) stacked AOD fraction. The contribution by marine, combustion, and dust aerosol is marked in blue, red, and yellow,
respectively. The sum of the fractional contribution by the three components amounts to 1 in (b) and (d)

months. The CAM5 model also reveals that the summer τc                  Table 3. Trends of combustion AOD (decade−1 ) with seasonal dis-
peak results mainly from increased sulfate and SOA, presum-             tinction derived from the MODIS Aqua retrievals and CAM5 sim-
ably due to more active photochemistry and higher relative              ulations in NAT and MED outflow regions. A trend with a signif-
humidity in summer. In the MED region, the peak of com-                 icance level of p
H. Yu et al.: Trends of combustion aerosol and dust during 2003–2017 149
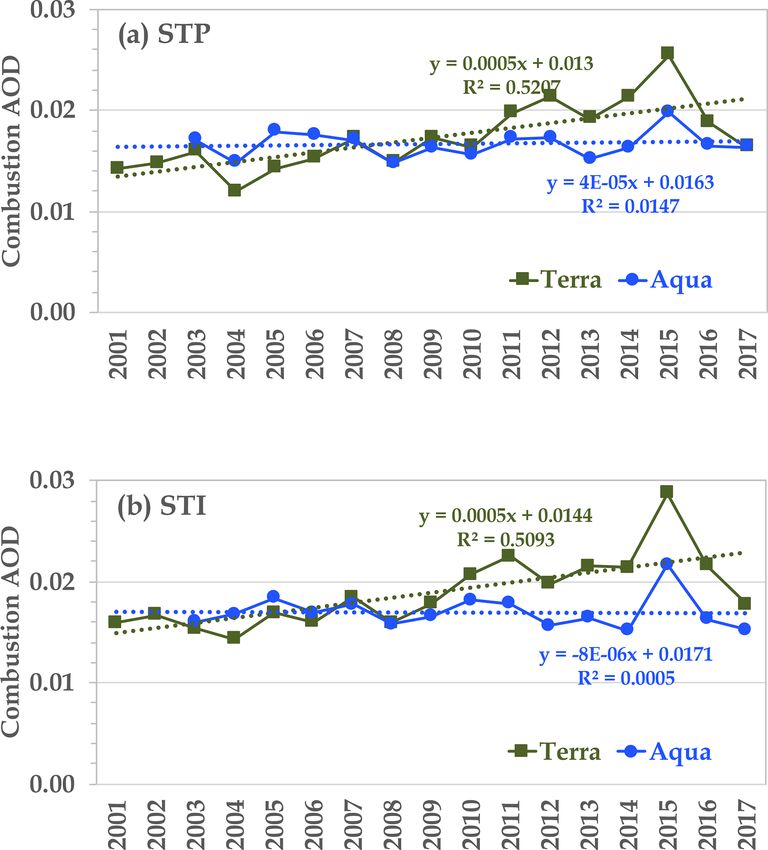
Figure 7. MODIS retrievals of τc in (a) the southern tropical Pa-
cific Ocean (STP) and (b) the southern tropical Indian Ocean (STI).
While Aqua retrievals show no trend, Terra retrievals indicate a sta-
tistically significant (p150 H. Yu et al.: Trends of combustion aerosol and dust during 2003–2017 Figure 8. Climatological seasonal cycle of τc (a, d) interannual variability (solid line) and linear trend (dotted line) (b, e) retrieved by MODIS Aqua (blue) and simulated by the CAM5 model (red) in the North Atlantic Ocean (NAT, a–c) and the Mediterranean Sea (MED, d–f) outflow regions; the stacked bar shows CAM5 τc components of SO4 (excluding those produced from DMS chemistry), POM, BC, and SOA. Panels (c, f) show the source attributions of τc simulated by the CAM5 model. sions from both South Asia and the Middle East. These two Table 4. Similar to Table 3 but for trends of combustion AOD regions combined explain 94.4 % of τc variability. Our de- (decade−1 ) in IND and ARB outflow regions. A trend with a sig- rived increasing τc trend of +0.017 per decade is a factor of nificance level of p
H. Yu et al.: Trends of combustion aerosol and dust during 2003–2017                                                                  151

Figure 9. Same as Fig. 8 but for the tropical Indian Ocean–Bay of Bengal (IND, a–c) and the Arabian Sea (ARB, d–f) outflow regions.

matter with diameter less than 2.5 µm) across China over the          ference during the dust season (March–May) could at least
2013–2018 period, which is consistent with concurrent ob-             be partially attributed to the spherical dust assumption in the
servations of SO2 and carbon monoxide (CO) (Zhai et al.,              MODIS algorithm. On the other hand, the higher MODIS
2019). While the declining PM2.5 trend is mainly attributable         τc in June and July is likely a result of cloud contamination
to drastic controls on coal combustion, meteorology makes             and limited sampling due to the more persistent presence of
a secondary but still significant contribution to the declin-         clouds. Over the period of 2003–2017, the MODIS retrievals
ing trend of PM2.5 (Chen et al., 2018, 2019; Cheng et al.,            show a decreasing trend of −0.021 per decade (p
152                                                  H. Yu et al.: Trends of combustion aerosol and dust during 2003–2017

parison, the CAM5 simulations show no statistically signifi-      Africa and southern equatorial Africa, respectively. Although
cant trend. The CAM5 simulations also suggest that 95 % of        CAM5 and MODIS agree within 0 %–11 % during the April–
τc variability can be explained by a single source region in      November period, CAM5 combustion AOD is 60 %–130 %
East Asia.                                                        higher than the MODIS-derived combustion AOD from De-
   In the TWP region, although the MODIS retrievals and           cember to March. In the SAT outflow region, combustion
CAM5 results agree well from May to December, they dif-           AOD peaks in August–September as shown by both MODIS
fer in January to April, the months of peak τc . The MODIS        and CAM5, although MODIS is 18 %–38 % higher than the
retrievals show peaks in March–April, whereas the CAM5            CAM5 simulation (Fig. 11d). In both regions, the MODIS re-
simulation suggests peaks during January–March. Over the          trievals and CAM5 simulations show interannual variations
period of 2003–2017, the MODIS retrievals show a decreas-         but no trends (Fig. 11b and e). The CAM5 source attribu-
ing trend of −0.023 per decade (p
H. Yu et al.: Trends of combustion aerosol and dust during 2003–2017                                                                 153

Figure 10. Same as Fig. 8 but for the northwestern Pacific Ocean (NWP, a–c) and the tropical western Pacific (TWP, d–f) outflow regions.

Figure 11. Same as Fig. 8 but for the Gulf of Guinea (GOG, a–c) and the southeastern Atlantic Ocean (SAT, d–f) outflow regions strongly
influenced by biomass burning smoke.

www.atmos-chem-phys.net/20/139/2020/                                                        Atmos. Chem. Phys., 20, 139–161, 2020
154                                                     H. Yu et al.: Trends of combustion aerosol and dust during 2003–2017

                                                                     τd results from a decreasing trend of −0.034 per decade or
                                                                     −2.6 % yr−1 (p
H. Yu et al.: Trends of combustion aerosol and dust during 2003–2017 155
Figure 13. Interannual variability of τd in six major outflow regions, as revealed by the MODIS Aqua retrievals (blue lines) and CAM5
simulations (red lines): (a) the tropical Atlantic Ocean – TAT, (b) the Caribbean Basin – CRB, (c) the Mediterranean Sea – MED, (d) the
northwest Pacific Ocean – NWP, (e) the Arabian Sea – ARB, and (f) the tropical Indian Ocean and the Bay of Bengal – IND.
1. The characteristic FMF for combustion aerosol, dust, AOD τd over ocean account for no more than ∼ 38 % of
and marine aerosol is derived to be 0.89, 0.31, and 0.48, the MODIS retrievals even when possible cloud con-
respectively, from the MODIS Aqua C6 product. Cor- tamination in the MODIS retrievals is empirically ac-
responding values derived from the MODIS Terra C6 counted for.
product are 0.92, 0.26, and 0.55, respectively. Signifi-
cant changes in the characteristic FMF values for dust 3. In contrast to the MODIS Aqua retrievals, the MODIS
and marine aerosol have occurred throughout the evo- Terra retrievals show a statistically significant, increas-
lution from C4 and C5 to the latest C6. Differences ing trend of combustion AOD in the remote ocean re-
in instrument calibrations and changes in the details of gions and global ocean average. This trend is considered
the aerosol retrievals may have created these differences to be spurious, possibly due to the imperfect instrument
between Aqua and Terra, as well as between different calibrations of the MODIS Terra instrument and other
data collections. The bottom line is that the MODIS issues, as presented and discussed in Levy et al. (2018).
data in each collection should be used in a consistent It is thus recommended that the MODIS Aqua retrievals
way to avoid introducing unwanted errors. Applying the only be used to examine regional AOD trends.
MODIS-based characteristic FMF directly to VIIRS ob- 4. The MODIS retrievals and CAM5 simulations consis-
servations is also not encouraged. tently yield a decreasing trend of −0.017 to −0.020
per decade for the combustion AOD (p156 H. Yu et al.: Trends of combustion aerosol and dust during 2003–2017
also consistent in depicting the seasonal variation of the depending on the region. In downwind outflow regions of
trend. North American and western European combustion sources,
the downward trends are statistically significant because of
5. In contrast, both MODIS retrievals and the CAM5 sim- continuous emission reductions. The upward trends over the
ulations display increasing τc trends over the tropical tropical Indian Ocean and Arabian Sea are also statistically
Indian Ocean–Bay of Bengal (IND) and the Arabian significant due to the continuous increase in combustion
Sea (ARB) due to the influence of increased anthro- emissions. For these regions the length of the data record
pogenic emissions from South Asia and to a lesser de- might not be very critical, and the 15 years of data used in this
gree from the Middle East in recent years. The MODIS- study are deemed to be adequate. However, in regions where
based trend of +0.036 per decade (pH. Yu et al.: Trends of combustion aerosol and dust during 2003–2017 157
cause it does not separate aerosol derived from fossil fuel and Team, and ACTIVATE – Earth Venture Suborbital-3) and the DOE
biomass burning or sulfate derived from industrial and vol- (EESM program grant).
canic activities. Although some effort is emerging in attempt-
ing retrievals of aerosol chemical composition from satellites
(Li et al., 2019), an accurate and detailed characterization of Review statement. This paper was edited by Michael Pitts and re-
chemical composition will most likely rely on an accumula- viewed by three anonymous referees.
tion of in situ observations from suborbital platforms.
References
Data availability. The MODIS Dark Target aerosol data
(MOD08_D3 and MYD08_D3) are obtained from the NASA Level Alfaro-Contreras, R., Zhang, J., Reid, J. S., and Christopher,
1 and Atmosphere Archive and Distribution System (LAADS) S.: A study of 15-year aerosol optical thickness and direct
(https://ladsweb.modaps.eosdis.nasa.gov/archive/allData/, shortwave aerosol radiative effect trends using MODIS, MISR,
last access: December 2019). The datasets have the DOIs CALIOP and CERES, Atmos. Chem. Phys., 17, 13849–13868,
https://doi.org/10.5067/MODIS/MOD04_L2.006 (Levy and Hsu, https://doi.org/10.5194/acp-17-13849-2017, 2017.
2015b) and https://doi.org/10.5067/MODIS/MYD04_L2.006 (Levy An, L., Che, H., Xue, M., Zhang, T., Wang, H., Wang, Y., Zhou, C.,
and Hsu, 2015c), respectively. The derived MODIS combustion Zhao, H., Gui, K., Zheng, Y., Sun, T., Lian, Y., Sun, E., Zhang,
aerosol and dust AOD data are archived in NASA GSFC clusters H., and Zhang, X.: Temporal and spatial variations in sand and
and personal computers. The CAM5 simulations were performed dust storm events in East Asia from 2007-2016: relationships
and archived at the DOE National Energy Research Scientific with surface conditions and climate change, Sci. Total Environ.,
Computing Center (NERSC). 633, 452–462, 2018.
Anderson, T. L., Wu, Y., Chu, D. A., Schmid, B., Redemann,
J., and Dubovik, O.: Testing the MODIS satellite retrieval of
Supplement. The supplement related to this article is available on- aerosol fine-mode fraction, J. Geophys. Res., 110, D18204,
line at: https://doi.org/10.5194/acp-20-139-2020-supplement. https://doi.org/10.1029/2005JD005978, 2005.
Anenberg, S., West, J. J., Yu, H., Chin, M., Schulz, M., Bergmann,
D., Bey, I., Bian, H., Diehl, T., Fiore, A., Hess, P., Marmer, E.,
Author contributions. HY conceived the project and derived the Montanaro, V., Park, R., Shindell, D., Takemura, T., and Den-
MODIS combustion and dust AOD with help and input from QT, tener, F.: Impacts of intercontinental transport of anthropogenic
MC, LAR, and RCL. YY, HW, and SJS designed and ran the CAM5 fine particulate matter on human mortality. Air Quality, Atmos.
simulations. HY and YY led the satellite and model integrated anal- Health., 7, 369–379, https://doi.org/10.1007/s11869-014-0248-
ysis and wrote the first draft of the paper. All other coauthors par- 9, 2014.
ticipated in discussions on data analysis and revised the paper. Boreddy, S. K. R., Haque, M. M., and Kawamura, K.: Long-
term (2001–2012) trends of carbonaceous aerosols from a re-
mote island in the western North Pacific: an outflow region
Competing interests. The authors declare that they have no conflict of Asian pollutants, Atmos. Chem. Phys., 18, 1291–1306,
of interest. https://doi.org/10.5194/acp-18-1291-2018, 2018.
Capelle, V., Chédin, A., Pondrom, M., Crevoisier, C., Armante, R.,
Crépeau, L., and Scott, N. A.: A decade of IASI infrared dust
aerosol characteristics: comparison with AERONET and analy-
Acknowledgements. This work was supported by the National
sis of the infrared to visible AOD ratio, Remote Sens. Environ.,
Aeronautics and Space Administration (NASA) Radiation Sci-
206, 15–32, 2018.
ence Program, CALIPSO/CloudSat Science Team, and Atmo-
Chedin, A., Capelle, V., and Scott, N. A.: Detection of IASI dust
spheric Composition Modeling and Analysis Program, managed
AOD trends over Sahara: How many years of data required?, At-
by Hal Maring, David Considine, and Richard Eckman, respec-
mos. Res., 212, 120–129, 2018.
tively, as well as the ACTIVATE project (a NASA Earth Ven-
Chen, Z., Xie, X., Cai, J., Chen, D., Gao, B., He, B., Cheng, N., and
ture Suborbital-3 investigation) managed through the Earth Sys-
Xu, B.: Understanding meteorological influences on PM2.5 con-
tem Science Pathfinder Program Office. Yang Yang, Hailong Wang,
centrations across China: a temporal and spatial perspective, At-
and Steven J. Smith of the Pacific Northwest National Laboratory
mos. Chem. Phys., 18, 5343–5358, https://doi.org/10.5194/acp-
(PNNL) also acknowledge support by the U.S. Department of En-
18-5343-2018, 2018.
ergy (DOE) Office of Science, Biological and Environmental Re-
Chen, Z., Chen, D., Kwan, M.-P., Chen, B., Gao, B., Zhuang, Y.,
search as part of the Earth and Environmental System Modeling
Li, R., and Xu, B.: The control of anthropogenic emissions con-
(EESM) program. The PNNL is operated for the DOE by the Bat-
tributed to 80 % of the decrease in PM2.5 concentrations in Bei-
telle Memorial Institute under contract DE-AC05-76RL01830.
jing from 2013 to 2017, Atmos. Chem. Phys., 19, 13519–13533,
https://doi.org/10.5194/acp-19-13519-2019, 2019.
Cheng, J., Su, J., Cui, T., Li, X., Dong, X., Sun, F., Yang, Y.,
Financial support. This research has been supported by NASA Tong, D., Zheng, Y., Li, Y., Li, J., Zhang, Q., and He, K.:
ROSES (Radiation Science program, Atmospheric Composition Dominant role of emission reduction in PM2.5 air quality im-
Modeling and Analysis program, CALIPSO/CloudSat Science provement in Beijing during 2013–2017: a model-based de-
www.atmos-chem-phys.net/20/139/2020/ Atmos. Chem. Phys., 20, 139–161, 2020158 H. Yu et al.: Trends of combustion aerosol and dust during 2003–2017 composition analysis, Atmos. Chem. Phys., 19, 6125–6146, O’Rourke, P. R., and Zhang, Q.: Historical (1750–2014) anthro- https://doi.org/10.5194/acp-19-6125-2019, 2019. pogenic emissions of reactive gases and aerosols from the Com- Chin, M., Diehl, T., Ginoux, P., and Malm, W.: Interconti- munity Emissions Data System (CEDS), Geosci. Model Dev., 11, nental transport of pollution and dust aerosols: implications 369–408, https://doi.org/10.5194/gmd-11-369-2018, 2018. for regional air quality, Atmos. Chem. Phys., 7, 5501–5517, Hsu, N. C., Gautam, R., Sayer, A. M., Bettenhausen, C., Li, C., https://doi.org/10.5194/acp-7-5501-2007, 2007. Jeong, M. J., Tsay, S.-C., and Holben, B. N.: Global and regional Chin, M., Diehl, T., Tan, Q., Prospero, J. M., Kahn, R. A., Remer, trends of aerosol optical depth over land and ocean using SeaW- L. A., Yu, H., Sayer, A. M., Bian, H., Geogdzhayev, I. V., Hol- iFS measurements from 1997 to 2010, Atmos. Chem. Phys., 12, ben, B. N., Howell, S. G., Huebert, B. J., Hsu, N. C., Kim, D., 8037–8053, https://doi.org/10.5194/acp-12-8037-2012, 2012. Kucsera, T. L., Levy, R. C., Mishchenko, M. I., Pan, X., Quinn, Jickells, T. D., An, Z. S., Anderson, K. K., Baker, A. R., Berga- P. K., Schuster, G. L., Streets, D. G., Strode, S. A., Torres, O., metti, G., Brooks, N., Cao, J. J., Boyd, P. W., Duce, R. A., and Zhao, X.-P.: Multi-decadal aerosol variations from 1980 to Hunter, K. A., Kawahata, H., Kubilay, N., IaRoche, J., Liss, 2009: a perspective from observations and a global model, At- P. S., Mahowald, N., Prospero, J. M., Ridgwell, A. J., Tegen, mos. Chem. Phys., 14, 3657–3690, https://doi.org/10.5194/acp- I., and Torres, R.: Global iron connections between desert 14-3657-2014, 2014. dust, ocean biogeochemistry, and climate, Science, 308, 67–71, Creamean, J. M., Suski, K. J., Rosenfeld, D., Cazorla, A., De- https://doi.org/10.1126/science.1105959, 2005. Mott, P. J., Sullivan, R. C., White, A. B., Ralph F. M., Min- Jongeward, A. R., Li., Z., He, H., and Xiong, X.: Natural and an- nis, P., Comstock, J. M., Tomlinson, J. M., and Prather, K. A.: thropogenic aerosol trends from satellite and surface observa- Dust and Biological Aerosols from the Sahara and Asia Influ- tions and model simulations over the North Atlantic Ocean from ence Precipitation in the Western U.S., Science, 339, 1572–1578, 2002 to 2012, J. Climate, 73, 4469–4485, 2016. https://doi.org/10.1126/science.1227279, 2013. Kahn, R. A., Li, W.-H., Moroney, C., Diner, D. J., Mar- de Leeuw, G., Sogacheva, L., Rodriguez, E., Kourtidis, K., Geor- tonchik, J. V., Fishbein, E., and Levy, R. C.: Satellite- goulias, A. K., Alexandri, G., Amiridis, V., Proestakis, E., derived aerosol optical depth over dark water from MISR Marinou, E., Xue, Y., and van der A, R.: Two decades and MODIS: Comparisons with AERONET and implications of satellite observations of AOD over mainland China us- for climatological studies. J. Geophys. Res., 112, D11205, ing ATSR-2, AATSR and MODIS/Terra: data set evaluation https://doi.org/10.1029/2006JD008175, 2007. and large-scale patterns, Atmos. Chem. Phys., 18, 1573–1592, Kaufman, Y. J., Smirnov, A., Holben, B. N., and Dubovik, O.: Base- https://doi.org/10.5194/acp-18-1573-2018, 2018. line maritime aerosol: methodology to derive the optical thick- Fan, B., Guo, L., Li, N., Chen, J., Lin, H., Zhang, X., Shen, ness and scattering properties, Geophys. Res. Lett., 28, 3251– M., Rao, Y., Wang, C., and Ma, L.: Earlier vegetation green- 3254, 2001. up has reduced spring dust storms, Sci. Rep., 4, 6749, Kaufman, Y. J., Koren, I., Remer, L. A., Rosenfeld, D., and Rudich, https://doi.org/10.1038/srep06749, 2014. Y.: The effect of smoke, dust, and pollution aerosol on shallow Field, R. D., van der Werf, G. R., Fanin, T., Fetzer, E. J., Fuller, R., cloud development over the Atlantic Ocean, P. Natl. Acad. Sci. Jethva, H., Levy, R., Livesey, N. J., Luo, M., Torres, O., and Wor- USA, 102, 11207–11212, 2005a. den, H. M.: Indonesian fire activity and smoke pollution in 2015 Kaufman, Y. J., Koren, I., Remer, L. A., Tanré, D., Ginoux, show persistent nonlinear sensitivity to El Nino-induced drought, P., and Fan, S.: Dust transport and deposition observed P. Natl. Acad. Sci., 113, 9204–9209, 2016. from the Terra-Moderate Resolution Imaging Spectroradiometer Formenti, P., D’Anna, B., Flamant, C., Mallet, M., Piketh, S. J., (MODIS) spacecraft over the Atlantic Ocean, J. Geophys. Res., Schepanski, K., Waquet, F., Auriol, F., Brogniez, G., Burnet, F., 110, D10S12, https://doi.org/10.1029/2003JD004436, 2005b. Chaboureau, J.-P., Chauvigne, A., Chazette, P., Denjean, C., Des- Kaufman, Y. J., Boucher, O., Tanre, D., Chin, M., Remer, L. boeufs, K., Doussin, J.-F., Elguindi, N., Feuerstein, S., Gaetani, A., and Takemura, T.: Aerosol anthropogenic component es- M., Giorio, C., Klopper, D., Mallet, M. D., Nabat, P., Monod, A., timated from satellite data, Geophys. Res. Lett., 32, L17804, Solmon, F., Namwoonde, A., Chikwililwa, C., Mushi, R., Wel- https://doi.org/10.1029/2005GL023125, 2005c. ton, E. J., and Holben, B.: The aerosols, radiation and clouds in Kiliyanpilakkil, V. P. and Meskhidze, N.: Deriving the effect of southern Africa field campaign in Namibia, B. Am. Meteorol. wind speed on clean marine aerosol optical properties using Soc., 100, 1277–1298, 2019. the A-Train satellites, Atmos. Chem. Phys., 11, 11401–11413, Gelaro, R. , McCarty, W., Suarez, M. J., Todling, R., Molod, A., https://doi.org/10.5194/acp-11-11401-2011, 2011. Takacs, L., Randles, C. A., Darmenov, A., Bosilovicj, M. G., Re- Levy, R. C., Remer, L. A., Mattoo, S., Vermote, E. F., and Kauf- ichle, R., Wargan, K., Coy, L., Cullather, R., Draper, C., Akella, man, Y.: Second-generation operational algorithm: Retrieval of S., Buchard, V., Conaty, A., da Silva, A. M., Gu, W., Kim, G.- aerosol properties over land from inversion of Moderate Res- K., Koster, R., Lucchesi, R., Merkova, D., Nielsen, J. E., Par- olution Imaging Spectroradiometer spectral reflectance, J Geo- tyka, G., Pawson, S., Putman, W., Rienecker, M., Schubert, S. D., phys Res., 112, D13211, https://doi.org/10.1029/2006JD007815, Sienkiewicz, M., and Zhao, B..: The Modern-Era Retrospective 2007. Analysis for Research and Application, Version 2 (MERRA-2), Levy, R. C., Mattoo, S., Munchak, L. A., Remer, L. A., Sayer, A. J. Climate, 30, 5419–5454, 2017. M., Patadia, F., and Hsu, N. C.: The Collection 6 MODIS aerosol Hoesly, R. M., Smith, S. J., Feng, L., Klimont, Z., Janssens- products over land and ocean, Atmos. Meas. Tech., 6, 2989– Maenhout, G., Pitkanen, T., Seibert, J. J., Vu, L., Andres, R. 3034, https://doi.org/10.5194/amt-6-2989-2013, 2013. J., Bolt, R. M., Bond, T. C., Dawidowski, L., Kholod, N., Levy, R. C., Munchak, L. A., Mattoo, S., Patadia, F., Remer, L. Kurokawa, J.-I., Li, M., Liu, L., Lu, Z., Moura, M. C. P., A., and Holz, R. E.: Towards a long-term global aerosol optical Atmos. Chem. Phys., 20, 139–161, 2020 www.atmos-chem-phys.net/20/139/2020/
You can also read