AMBIENT AIR QUALITY TRENDS REPORT 1996-2019 - DC.gov
←
→
Page content transcription
If your browser does not render page correctly, please read the page content below
july 2020

DISTRICT OF COLUMBIA

  AMBIENT
AIR QUALITY
TRENDS REPORT
           1996-2019
    monitoring and assessment branch
             air quality division
   department of energy and environment
      1200 first street, n.e., fifth floor
            washington, dc 20002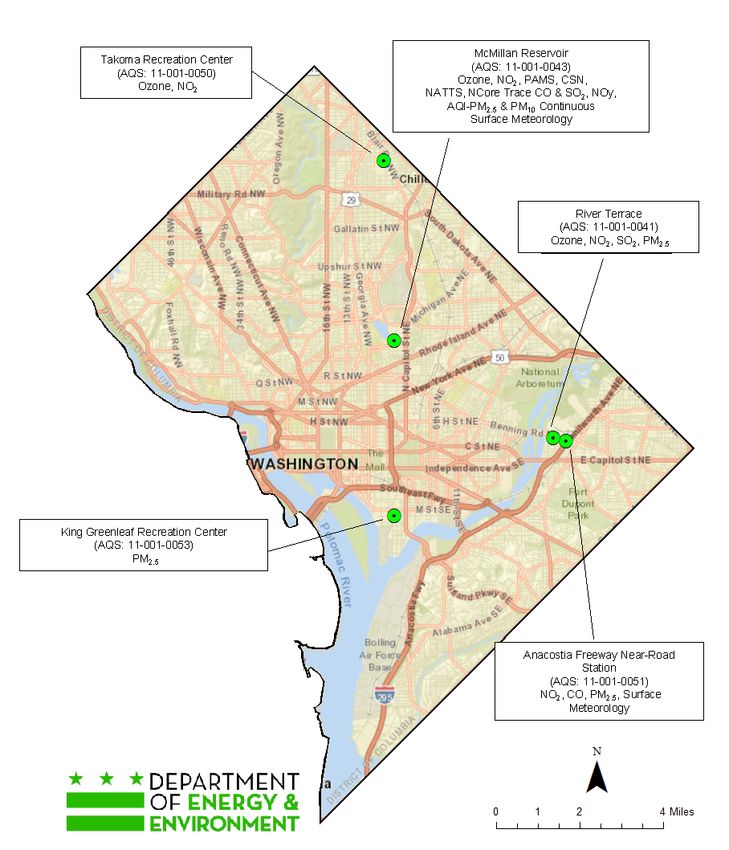
district of columbia’s ambient air quality trends report 2020

EXECUTIVE SUMMARY

Air quality in the District of Columbia (District) has improved significantly in the last two decades, meeting the National Ambient
Air Quality Standards for all criteria pollutants except for ground-level ozone. Because the District is an urban environment with
little industry, air quality issues in the District are primarily due to emissions from vehicles and air pollution transported from other
states. This Air Quality Trends Report demonstrates that despite population, employment, and housing increases and other related
activities in the District, ambient concentrations of all criteria pollutants and pollution emissions have dropped since the late
1990s. This report serves as an update to the 2014 Air Quality Trends Reporti.

           Figure 1: The District’s Air Quality in 2019 as a Percent of the National Ambient Air Quality Standards (NAAQS)

Figure 1 illustrates that the District is meeting the Environmental Protection Agency’s (EPA) National Ambient Air Quality Standards
for fine particulate matter, carbon monoxide, nitrogen dioxide, and sulfur dioxide. The District is in marginal nonattainment of the
standard for ground-level ozone pollution.

Improvements in air quality can be attributed to the ongoing work at both the state and national level. The District has adopted
several air pollution reduction regulations and has coordinated with neighboring states to help control transported pollution. There
is a push for low-emission vehicles across the nation, with several grants and programs currently underway to replace aging
fleets and invest in electric vehicle infrastructure. The EPA has also passed several regulations limiting emissions from polluting
sources. However, there is still work to be done to protect public health and welfare, particularly as EPA continues to revise the
NAAQS based on improved understandings of the relationship between air pollutants and health.

                                                                    i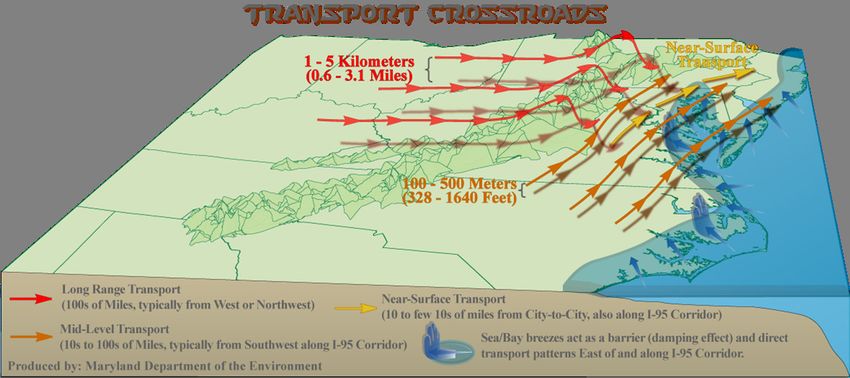
district of columbia’s ambient air quality trends report 2020

NAAQS IN THE DISTRICT OF COLUMBIA

 •   Ozone – The District and nearby counties in Maryland                   UNDERSTANDING DESIGNATIONS
     and Virginia are in “marginal” nonattainment of the 2015
     national ambient air quality standards (NAAQS) for the                Once a new standard is formulated for a pollutant,
     8-hour average of ground-level ozone (O3) of 70 parts                 the EPA will designate areas as having either
     per billion (ppb). The “marginal” designation classifies              reached attainment or nonattainment of the
     the region as being within 11 ppb of the standard. Ozone              standard.
     continues to be the biggest air pollution challenge the
     region faces, primarily due to emissions from mobile                  Attainment designations indicate that the area has
     sources and transported pollution from upwind states.                 met the standard and is measuring concentrations
     Reducing emissions from these two sources is essential                at or below the standard, which is the allowable
     to improving air quality and protecting public health. The            amount or threshold of that pollutant.
     District recently attained the former 2008 8-hr ozone
     NAAQS of 75 ppb and is currently under maintenance to                 Nonattainment designations indicate that the
     ensure the District stays below the standard.                         area has not met the standard and is measuring
                                                                           concentrations above the standard.
 •   Particulate Matter – The District is in attainment of the
     2012 annual NAAQS for fine particulate matter (PM2.5 or
     fine PM) of 12 micrograms/cubic meter (µg/m3). Fine PM is inhalable PM smaller than 2.5 micrograms. The District was
     previously in nonattainment of the 1997 annual standard but has since attained that standard. A new, reduced, fine PM
     standard was finalized by EPA in 2012, which the District had already attained by the time EPA designated areas for the
     standard. The region has since been in compliance.

 •   Carbon Monoxide – The District is in attainment for the carbon monoxide (CO) 2010 8-hour NAAQS of 9 parts per million
     (ppm) and the ambient air quality levels have been below the standards since 1996. In February 2010, EPA retained the
     existing CO standard from 1994.

 •   Sulfur dioxide, Nitrogen dioxide – The District has always attained both the sulfur dioxide (SO2) and nitrogen dioxide
     (NO2) standards, with monitored levels far below the NAAQS. New, stricter, NAAQS were developed for each pollutant in
     2010. The District is in attainment of the 2010 1-hour SO2 NAAQS of 75 ppb and the 2010 annual NO2 NAAQS of 53 ppb.
     In 2019, EPA retained the 2010 SO2 NAAQS without revision.

 •   Lead – In 2016, the District stopped monitoring for lead (Pb) because levels were consistently very low compared to
     the NAAQS. Lead NAAQS were first established in 1978 and, in 2008, EPA updated the standard to be ten times more
     stringent. Monitoring for lead began in January 2012 to determine compliance with the new standard. Due to consistently
     low readings (about 3% of the NAAQS) for four consecutive years, the District discontinued the lead monitor in 2016.

                                                              ii
district of columbia’s ambient air quality trends report 2020

TABLE OF CONTENTS
List of Figures.................................................................................................................................................................................v
List of Tables................................................................................................................................................................................. vi
PART 1: BACKGROUND INFORMATION............................................................................................................. 1
      1.0 BRIEF HISTORY OF AIR POLLUTION AND CONTROL IN THE UNITED STATES.........................................................................2
      2.0 CRITERIA POLLUTANTS AND AIR QUALITY STANDARDS.......................................................................................................4
		 2.1 GROUND-LEVEL OZONE.................................................................................................................................................4
			 2.1.1 Ozone NAAQS Review............................................................................................................................................5
		 2.2 PARTICULATE MATTER ..................................................................................................................................................6
			 2.2.1 PM NAAQS Review................................................................................................................................................7
		 2.3 CARBON MONOXIDE......................................................................................................................................................8
			 2.3.1 CO NAAQS Review.................................................................................................................................................8
		 2.4 SULFUR DIOXIDE...........................................................................................................................................................8
			2.4.1 SO2 NAAQS Review................................................................................................................................................8
		 2.5 NITROGEN DIOXIDE........................................................................................................................................................9
			2.5.1 NO2 NAAQS Review...............................................................................................................................................9
		 2.6 LEAD.............................................................................................................................................................................9
			 2.6.1 Lead NAAQS and Monitoring Review......................................................................................................................9
      3.0 AIR POLLUTION IMPACTS..................................................................................................................................................10
		 3.1 HEALTH IMPACTS........................................................................................................................................................10
		 3.2 ENVIRONMENTAL IMPACTS..........................................................................................................................................10
			3.2.1 Water Quality.......................................................................................................................................................11
			 3.2.2 Climate Change...................................................................................................................................................11
		 3.3 FACTORS THAT IMPACT AIR QUALITY IN THE DISTRICT.................................................................................................12
			 3.3.1 Meteorology and Topography...............................................................................................................................12
			 3.3.2 Employment, Population, and Households............................................................................................................13
			 3.3.3 Interstate Transport of Ozone Pollution.................................................................................................................14
      4.0 OVERVIEW OF THE DISTRICT’S AIR QUALITY IMPROVEMENT PROGRAM.............................................................................15
      IN FOCUS: THE DISTRICT’S MONITORING NETWORK ..............................................................................................................16
      5.0 PUBLIC OUTREACH...........................................................................................................................................................18

                                                                                               iii
district of columbia’s ambient air quality trends report 2020

PART 2: TRENDS ANALYSIS............................................................................................................................ 19
     1.0 AIR QUALITY TRENDS........................................................................................................................................................20
     2.0 EMISSIONS TRENDS.........................................................................................................................................................21
     3.0 POLLUTANT-SPECIFIC TRENDS.........................................................................................................................................21
		 3.1 OZONE MONITORING RESULTS AND EMISSIONS..........................................................................................................21
		 3.2 PM2.5 MONITORING RESULTS AND EMISSIONS.............................................................................................................24
			3.2.1 PM10 Monitoring Results......................................................................................................................................25
		 3.3 CO Monitoring Results and Emissions..........................................................................................................................26
		 3.4 SO2 MONITORING RESULTS AND EMISSIONS...............................................................................................................27
		 3.5 NO2 MONITORING RESULTS.........................................................................................................................................28
		 3.6 LEAD MONITORING RESULTS.......................................................................................................................................28
     4.0 SECTOR-BY-SECTOR ANALYSIS.........................................................................................................................................29
		 4.1 STATIONARY POINT SOURCES......................................................................................................................................29
		 4.2 STATIONARY NONPOINT SOURCES...............................................................................................................................30
		 4.3 NONROAD MOBILE SOURCES......................................................................................................................................31
		 4.4 MAR – MARINE, AIRCRAFT, AND RAILROADS................................................................................................................33
		 4.5 ONROAD MOBILE SOURCE...........................................................................................................................................33
     5.0 OTHER AIR POLLUTANTS..................................................................................................................................................34
		 5.1 AIR TOXICS..................................................................................................................................................................34
			 5.1.1 HAPs Monitoring/Modeling Results......................................................................................................................35
		 5.2 REGIONAL HAZE..........................................................................................................................................................36
		 5.3 GREENHOUSE GASES ..................................................................................................................................................36
		 5.4 ACID RAIN PRECURSORS AND STRATOSPHERIC OZONE DEPLETING SUBSTANCES.......................................................37
     6.0 DISTRICT’S AIR QUALITY STATUS – SUMMARY..................................................................................................................37
APPENDIX A..................................................................................................................................................................................38
ENDNOTES AND REFERENCES......................................................................................................................................................39

                                                                                             iv
district of columbia’s ambient air quality trends report 2020

LIST OF FIGURES
Figure 1: The District’s Air Quality in 2019 as a Percent of the National Ambient Air Quality Standards (NAAQS)................................i
Figure 2: Timeline of Significant Clean Air Act Achievementsiv..........................................................................................................3
Figure 3: Metropolitan Washington 8-hour Ozone Nonattainment Region (Washington, DC-MD-VA).................................................6
Figure 4: Size and comparisons of PM10 and PM2.5 µg/m3................................................................................................................7
Figure 5: The mean change in number of high ozone days above 75 ppb by 2050.........................................................................11
Figure 6: Employment, Population, and Household Trends in the District........................................................................................13
Figure 7: Locations of air quality monitors in the District...............................................................................................................17
Figure 8: Normalized Ambient Air Quality Levels for Ozone (warm colors) and Fine Particulate Matter (cool colors) in the District
compared to the DC-MD-VA Region..............................................................................................................................................20
Figure 9: 2017 Emissions of VOC (left) and NOX (right) in the DC Nonattainment Area....................................................................20
Figure 10: Criteria Pollutant Emissions in the District over Time (tpy).............................................................................................21
Figure 11: 8-hour Ozone design values for each monitor in the District compared to several Ozone NAAQS..................................22
Figure 12: Number of exceedance days in the District compared to the 2015 8-hour Ozone NAAQS..............................................22
Figure 13: Days over 90ºF (Dulles) and 8-hour ozone exceedance days in Metropolitan DC Region (2015 NAAQS) (Regional
analysis by MWCOG).....................................................................................................................................................................23
Figure 14: Annual PM2.5 design values for each monitor in the District compared to the NAAQS.....................................................24
Figure 15: 24-hour PM2.5 design values for each monitor in the District compared to the NAAQS...................................................25
Figure 17: 24-hour PM10 design values for each monitor in the District compared to the NAAQS...................................................25
Figure 16: PM2.5-Primary Emissions over time (tpy).......................................................................................................................25
Figure 19: Total CO emissions in the District over time (tpy) (left) and by sector in 2017 (right)......................................................26
Figure 18: 8-hour CO design values for each monitor in the District compared to the NAAQS........................................................26
Figure 20: 1-hour SO2 design value for each monitor compared to the NAAQS..............................................................................27
Figure 21: Point source SO2 emissions by fuel type (tpy)................................................................................................................27
Figure 22: Annual NO2 design Vvalues for each monitor in the District compared to the NAQQS.....................................................28
Figure 23: Lead concentrations recorded at the McMillan Monitoring Station................................................................................28
Figure 25: NOx Emissions by Sector and Year (tpy).........................................................................................................................29
Figure 24: Total Emissions by Sector and Year (tpy).......................................................................................................................29
Figure 26: VOC Emissions by Sector and Year (tpy)........................................................................................................................29
Figure 27: Point source emissions in the District (tpy)...................................................................................................................30
Figure 28: 2017 nonpoint emissions in the District by sector (tpy).................................................................................................30
Figure 29: 2017 nonpoint source emissions of VOCs (tpy).............................................................................................................30
Figure 30: 2017 nonpoint source emission of particulate matter (tpy)............................................................................................31
Figure 31: Nonpoint source fuel combustion emissions (tpy).........................................................................................................31
Figure 32: 2017 nonroad emissions by fuel type (tpy)....................................................................................................................32
Figure 33: CO emissions from nonroad sources by fuel type (tpy)..................................................................................................32
Figure 34: 2017 NOX and VOC emissions by fuel and sector (tpy)...................................................................................................32
Figure 35: 2017 MAR sources in the District (tpy)..........................................................................................................................33
Figure 36: Onroad mobile emissions in the District over time (tpy).................................................................................................34
Figure 37: Annual NOX emissions by vehicle type (tpy)...................................................................................................................34
Figure 38: Atmospheric CO2 at Mauna Loa Observatory from 1958 to 2020...................................................................................36

                                                                                           v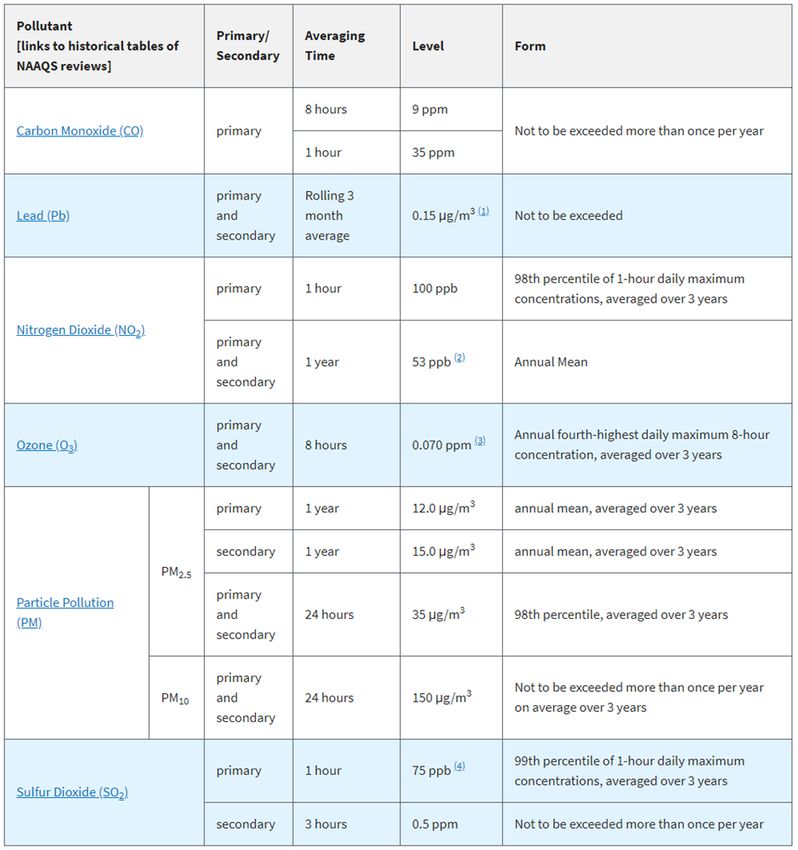
district of columbia’s ambient air quality trends report 2020

LIST OF TABLES
Table 1: Designation Classifications for each Ozone NAAQS............................................................................................................5
Table 2: Current Attainment Status of PM2.5 and PM10 NAAQS..........................................................................................................8
Table 3: Modeled 2017 and monitored (2016-2018) design values (ppb) at three monitors in the Districtxxvi..................................23
Table 4: Health outcomes modeled to not occur if the District had attained the 2015 Ozone Standards in 2016, 2017, 2018.........23
Table 5: Risk associated with long- and short-term exposure hazardous pollutants to HAPs in the District from the 2014 NATA....35

                                                                                 vi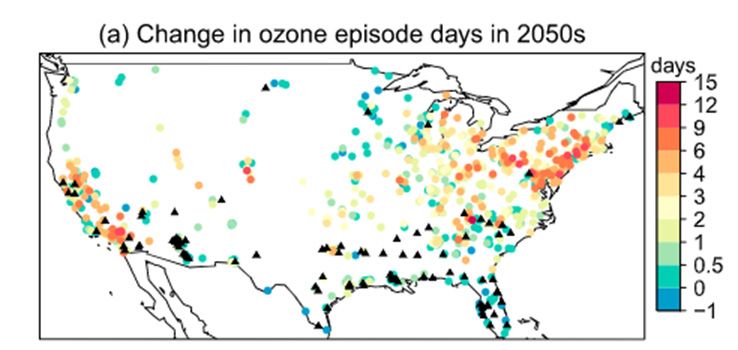
district of columbia’s ambient air quality trends report 2020

PART 1: BACKGROUND
INFORMATION

                                 1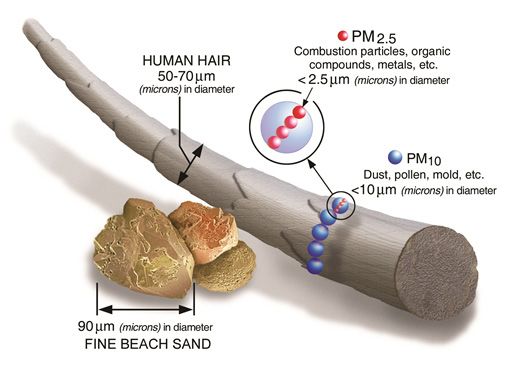
district of columbia’s ambient air quality trends report 2020

1.0 BRIEF HISTORY OF AIR POLLUTION AND CONTROL IN THE UNITED STATES
As population hubs developed, the release of chemicals and matter into the air, commonly known as air pollution, became
pervasive in the United States. As early as the 1880s, pollution from the burning of coal and wood became impediments to public
wellbeing. As a consequence, cities like Chicago and Cincinnati passed the nation’s first smoke ordinances.

As industries expanded globally, several alarming incidents heightened concerns about the impact air pollution had on people’s
health. In Belgium in 1930, an air pollution episode – when persistent meteorological conditions kept emissions trapped near
the earth’s surface – killed at least 60 people and caused over 600 to become ill. In 1947, summer smog events in Los Angeles,
California, significantly affected the health of residents and visibility, resulting in the passage of the nation’s first state air pollution
law. In 1948, a strong temperature inversion occurred in Donora, Pennsylvania, while a nearby factory continued to contaminate
the air. This resulted in nearly 20 deaths and 14,000 of the town’s population fell ill. A similar event in London, England, known as
the “London Fog” of 1952, resulted in more than 4,000 premature deaths.

In the United States, the first nationwide air pollution control law was passed in 1955. The Air Pollution Control Act (APCA)
mandated and funded research on air pollution and authorized the federal government to provide states with technical assistance
to prevent and control emissions. This prompted the study of air quality criteria as well as the meteorological and topographical
aspects of air pollution. A national continuous air quality monitoring program (CAMP) emergedii in the late 1950s. The District was
one of six cities in the national CAMP network of ambient air quality stations.

The APCA was amended several times to consider motor vehicle exhaust and air pollution issues that extended across state and
country borders. Increased awareness and concern about air pollution led to Congress’s passage of the first prominent Clean Air
Act (CAA) in 1970 and the creation of the U.S. Environmental Protection Agency (EPA). EPA was authorized to establish national
ambient air quality standards (NAAQS) for pollutants shown to threaten human health and public welfare. The national approach
with statutory deadlines for meeting standards represented a shift in thinking. With it came a belief that economic growth could
be accomplished without the sacrifice of human health and the environment.

The CAA was amended in 1977, and then again in 1990. The changes in legislation focused on curbing three major threats:
acid rain, urban air pollution, and toxic air emissions. The CAA and the 1990 amendments establish authority and a framework
for the permitting and enforcement of air pollution sources to achieve compliance with NAAQS. As a result, federal, state and
local governments have been able to work together to design, implement, and enforce measures that have improved air quality
substantially.iii

                                                                     2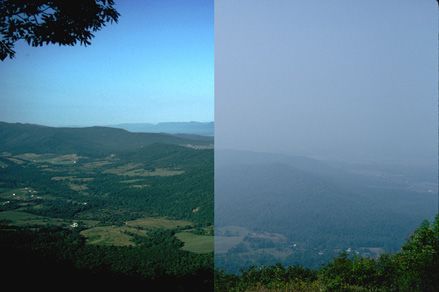
district of columbia’s ambient air quality trends report 2020

                                         1970
Creation of EPA and establishment of NAAQS for
                              Criteria Pollutants                                 1973
                                                                                  EPA began the phase-out of leaded gasoline
                                          1977
    The CAA Amendments protected air quality
  and visibility in designated national parks and
                                wilderness areas                                  1981
                                                                                  New motor vehicles met the CAA standards
  Congress established the New Source Review                                      for the first time, due to improved catalytic
                           permitting program                                     converters

                                                                                  1983
                                                                                  The first vehicle Inspection and Maintenance
                                                                                  (I/M) programs were established
                                         1990
     The CAA Amendments required states to
  demonstrate progress in improving air quality                                   1994
       and imposed the first acid rain controls                                   EPA set many of the first standards to reduce air
                                                                                  toxic emissions
        Title V Operating Permits became a CAA
  requirement, and CAA enforcement provisions                                      1996
                             were strengthened                                     Lead in gasoline fully phased out
                                          1999
  The first tailpipe standards for SUVs and light-
                             duty trucks were set                                  2003
                                                                                   EPA began administering a market-based
                                                                                   cap and trade program for NOx emissions
                                        2009                                       from large stationary sources
     EPA made the determination that GHGs are
                  subject to CAA requirements                                      2011
                                                                                   National Mercury and Air Toxics Standards were
                                                                                   passed to set limitations to how much coal-
                                         2014                                      and oil-fired power plants with a capacity of 25
EPA set new tailpipe and evaporative emissions                                     megawatts or greater could emit of mercury
  standards for vehicles and lowered the sulfur                                    and toxic air pollutants
content of gasoline, considering the vehicle and
                its fuel as an integrated system

                                   Figure 2: Timeline of Significant Clean Air Act Achievementsiv

                                                                 3
district of columbia’s ambient air quality trends report 2020
2.0 CRITERIA POLLUTANTS AND AIR QUALITY STANDARDS
The federal Clean Air Act authorized EPA to set National Ambient Air Quality
Standards (NAAQS) for pollutants that threaten human health and public UNDERSTANDING THE NAAQS
welfare throughout the country. EPA established NAAQS for the six most
common pollutants called “criteria” air pollutants: ozone (O3), particulate Averaging Time of the Standard – The
matter [particles less than 10 micrometers in aerodynamic diameter (PM10 or time period over which air pollutant
coarse PM) and particles less than 2.5 micrometers in diameter (PM2.5) or fine concentrations are collected and averaged.
PM], carbon monoxide (CO), sulfur dioxide (SO2), nitrogen dioxide (NO2), and The averaging times are for one hour,
lead (Pb). EPA periodically revises the standards based on new science. When eight (8) hours, daily, quarterly, and annual,
ambient air quality in a jurisdiction exceeds the NAAQS for a criteria pollutant, depending on the pollutant.
the area is said to be in “nonattainment” for that pollutant.
Level of the Standard – The allowable
There are two types of NAAQS: primary and secondary. Primary NAAQS are concentration of air pollutants. The unit of
established according to criteria designed to protect the health of people who measurement for most pollutants is parts
breathe the air. They include an adequate margin of safety to protect sensitive per million (ppm) or parts per billion (ppb)
populations, including children and the elderly. Secondary NAAQS are set to by volume. Due to the nature of pollutants,
protect public welfare by preventing decreased visibility, damage to crops or the unit of measurement for some
buildings, and other impairment of the natural environment. The CAA requires pollutants, such as lead and particulate
that the NAAQS be revisited every five years based on up-to-date scientific matter, is mass of pollutant per unit volume
research findings. Appendix A includes a table of the existing NAAQS. of air and is expressed as micrograms of
pollutant per cubic meter of air (µg/m3).
Pollutant levels in the air are measured using a network of air quality
monitors. Once the measurements for a pollutant are quality-assured, this Form – The methodology for summarizing
data is analyzed to calculate a design value (DV). The DV is a statistical value actual concentrations. The form can
based on ambient air monitoring measurements that capture the air quality be directly compared to the NAAQS to
status of an area or region relative to the NAAQS. The DV is a statistically- determine compliance.
derived average of a specified number of measurements over a specific
period of time. DVs are used to more accurately represent exposures to air
pollution. DVs from a jurisdictional network of monitors are compared to
NAAQS to determine the air quality status.
2.1 GROUND-LEVEL OZONE
Ground-level ozone, also known as smog, is the most widespread criteria
pollutant. Ozone is a colorless, odorless gas composed of three oxygen
atoms. It exists naturally in the stratosphere, the Earth’s upper atmosphere,
where it shields the Earth from the Sun’s ultraviolet rays. It is also found
close to the Earth’s surface in the troposphere where we live and breathe.
Ground-level ozone is not emitted directly into the air by specific pollution
sources, but rather is created by a chemical reaction between precursor
Depiction of ozone formation. Photo from EPA
pollutants, volatile organic compounds (VOCs) and oxides of nitrogen (NOx), in
the presence of sunlight and high temperatures. NOx and VOC sources include power plants, industrial processes, vehicle exhaust
(onroad and nonroad), and commercially available products such as paints, insecticides, and cleaning solvents. VOCs also come
from natural sources such as trees and plants.
Because ground-level ozone is the result of photochemical reactions, ozone takes time to form. Concentrations generally become
4district of columbia’s ambient air quality trends report 2020
elevated during the hotter, drier days of warmer months of the year when there is little wind. Daily ozone levels generally peak
during afternoon and early evening hours, when precursor pollutants are most exposed to sunlight and higher temperatures.
“Ozone season” in the Washington, DC, region is between May 1st and September 30th. Ozone is transported through the air into
the District from other areas, and then mixes with precursor emissions from local sources of air pollution.
2.1.1 OZONE NAAQS REVIEW
The first ozone NAAQS from 1979 were set based on a daily maximum 1-hour average concentration. Shortly after passage of
the Clean Air Act Amendments (CAAA) of 1990, EPA classified the DC-MD-VA region (see Figure 3) as a “serious” nonattainment
area for the 1-hour NAAQS. The region failed to achieve the 1-hour standard by the CAA mandated deadline and was bumped
up by EPA to a “severe” nonattainment area in 2003. At that time, EPA set an attainment deadline of 2005, and the District and
the metropolitan area were able to meet the standard by this deadline. To continue meeting CAA requirements, regulations and
policies that reduce emissions must remain in place. Table 1 below shows the designation classification levels for each ozone
standard. The standard unit of measure for ozone is parts per million (ppm). However, ozone will be expressed in parts per billion
(ppb) in this report.
Table 1: Designation Classifications for each Ozone NAAQS
2015 8-hr Standard 2008 8-hr Standard 1997 8-hr Standard 1979 1-hr Standard
Classification
(70 ppb) (75 ppb) (80 ppb) (120 ppb)
Marginal 71 ≤ DV < 81 ppb 76 ≤ DV < 86 ppb 85 ≤ DV < 92 ppb 121 ≤ DV < 138 ppb
Moderate 81 ≤ DV < 93 ppb 86 ≤ DV < 100 ppb 92 ≤ DV < 107 ppb 138 ≤ DV < 160 ppb
Serious 93 ≤ DV < 105 ppb 100 ≤ DV < 113 ppb 107 ≤ DV < 120 ppb 160 ≤ DV < 180 ppb
Severe 151 105 ≤ DV < 111 ppb 113 ≤ DV < 119 ppb 120 ≤ DV < 127 ppb 180 ≤ DV < 190 ppb
Severe 17 111 ≤ DV < 163 ppb 119 ≤ DV < 175 ppb 127 ≤ DV < 187 ppb 190 ≤ DV < 280 ppb
Extreme 163 ppb ≤ DV 175 ppb ≤ DV 187 ppb ≤ DV 280 ppb ≤ DV
In 1997, EPA revised the ozone NAAQS to better reflect new scientific health studies that demonstrated cumulative effects from
exposure over an entire day. The 1997 NAAQS was the first ozone standard based on an 8-hour averaging period. In 2004, EPA
officially designated the region as a “moderate” nonattainment area for the 1997 standard. In June 2005, EPA revoked the 1-hour
ozone standard while implementing the 1997 8-hour standards.
The 8-hour ozone standard was revised again in 2008. Based on the monitored air quality data, EPA designated the DC-MD-
VA region as a “marginal” nonattainment area for the 2008 standard. The District and the metropolitan area submitted a
redesignation request and maintenance plan in 2017. EPA approved the maintenance plan for the metropolitan area in 2018. On
July 16, 2019, the District was redesignated to attainment for the 2008 8-hour ozone NAAQS.
In 2015, EPA further revised the 8-hour standard to 70 ppb. On August 3, 2018, the DC-MD-VA region (Figure 3) was designated
as “marginal” nonattainment based on the 2016 design value of 72 ppb. The designations were based off the 2016 design value
because 2016 was the most recent three-year period with fully-certified data. The region has a total of three years, or until August
3, 2021, to attain the 70 ppb standard.
1. Severe 15 and Severe 17 indicate that an area has 15 and 17 years to attain the standard, respectively
5district of columbia’s ambient air quality trends report 2020
Figure 3: Metropolitan Washington 8-hour Ozone Nonattainment Region (Washington, DC-MD-VA)
Image courtesy of the Metropolitan Washington Council of Governments
2.2 PARTICULATE MATTER
Particulate matter is comprised of a broad class of extremely
small airborne solid particles and liquid droplets, from fine smoke
and soot (products of incomplete fuel combustion) to larger-
sized dusts and industrially generated particles. Particulate
matter also includes particles formed by complex reactions
of gaseous pollutants in the atmosphere. Precursors for fine
inhalable PM include ammonia, SO2, and NOx. Sulfates, nitrates,
organic carbon, and elemental carbon contribute to the make-up
of condensable fine PM. Particulates can be different sizes and
shapes. The size of particles measured over time has decreased
with improvements in monitoring technology, as researchers
have found that smaller particles have potential for causing more
complex health or visibility problems. Particles less than 2.5
micrometers (microns) in diameter (PM2.5 or fine PM) can travel
deep into the lungs and move into the bloodstream. As shown Fireworks contribute to short-term PM pollution. Photo
in Figure 4 below, they are about 1/30th the average width of a from DCRA
6district of columbia’s ambient air quality trends report 2020
Figure 4: Size and comparisons of PM10 and PM2.5 µg/m3
(Image from EPA)
human hair and are invisible to the human eye. Their smaller size is hazardous to human health and makes them a major focus
for regulation and policy.
Fine PM concentrations vary daily and sometimes hourly, as they tend to be higher during peak traffic times. The physical and
chemical compositions of fine PM vary seasonally, since these characteristics are influenced by meteorological conditions, such
as temperature, humidity, wind flow, etc.
2.2.1 PM NAAQS REVIEW
The first PM standards were set in 1971. They addressed total suspended particulates (TSP), which are non-respirable particles.
In 1987, annual and daily NAAQS were set for inhalable particles with an aerodynamic diameter of 10 microns, called PM10, or
less.
In 1997, the PM10 standards were slightly revised to regulate inhalable “coarse” particulates that account for particles greater
than 2.5 microns and less than 10 microns in diameter.
EPA also established two more refined health standards for annual and 24-hour average inhalable “fine” particulates less than
2.5 microns in diameter, or PM2.5. The PM2.5 standards account for emissions that are filterable (directly emitted) and condensable
(secondarily formed in the atmosphere from gaseous pollutants). The region was officially designated as being in nonattainment
of the PM2.5 annual standard in April 2005, but was redesignated to attainment in 2014.
In 2006, the annual PM10 standard was revoked due to a lack of evidence linking health problems to long-term exposure, leaving
only a daily PM10 standard. A new daily standard for PM2.5 was also established that same year. EPA determined that the District
metro area was in attainment for both the daily PM10 and PM2.5 standards.
In 2012, EPA revised the annual PM2.5 standard to make it more stringent. The existing PM2.5 ambient air monitors in the District
and metropolitan area have been measuring concentrations below the new 2012 standards. However, the new standards required
monitoring near major roadways. By 2015, the District, Maryland, and Virginia had all established new near-road monitoring
stations. Given the adequate data collection from the new near-road monitoring network, EPA has designated the DC-MD-VA
region as an attainment area for the 2012 PM2.5 NAAQS. Table 2 outlines the District’s attainment status for each standard for both
PM2.5 and PM10.
7district of columbia’s ambient air quality trends report 2020
Table 2: Current Attainment Status of PM2.5 and PM10 NAAQS
Current Attainment Status of PM2.5 NAAQS Current Attainment Status of PM10 NAAQS
1997 24-hour attainment 1997 24-hour attainment
redesignated to
PM2.5 - 1997 annual attainment in 2014 PM10 - 1997 annual attainment
fine 2006 24-hour coarse 2006 24-hour REMANDED
attainment attainment
2006 annual attainment 2006 annual standard revoked
2012 24-hour attainment2 2012 24-hour attainment
2.3 CARBON MONOXIDE
Carbon monoxide is a colorless, odorless gas that can be poisonous in high concentrations. When it enters the bloodstream,
it reduces the capacity of the body to deliver oxygen to organs and tissues. Concentrations tend to be highest during winter
months due to the “cold starting” of automobile engines. In some areas, inefficient or poorly maintained space heating systems,
residential wood burning, or industrial processes (metals processing and chemical manufacturing) are prominent sources.
Improvements in motor vehicle emissions controls and the use of oxygenated fuels have reduced CO levels significantly (although
oxygenated fuels have not been used in the District since 1996).
2.3.1 CO NAAQS REVIEW
The first CO standards were set in 1971. In 1985, EPA revoked the secondary CO standards due to a lack of evidence that
ambient concentrations adversely affect public welfare. Both the 1-hour and 8-hour primary CO standards were retained after
EPA’s review in 1994. The DC-MD-VA region attained the 8-hour NAAQS in 1996. Attainment areas are required to demonstrate
that ambient levels will “maintain” design value concentrations that are under the NAAQS for 20 years after redesignation. In
February 2010, EPA retained the existing CO standards while expanding the ambient air monitoring requirements. All parts of the
country currently meet the CO NAAQS.
2.4 SULFUR DIOXIDE
Sulfur dioxide (SO2) is a highly reactive gas that forms both from the burning of fuels containing sulfur (mainly coal and oil) and
during industrial processes, such as metal smelting and oil refining. It is one of a group of oxides of sulfur. When combined with
other pollutants and chemicals, SO2 can react with oxygen and water in the atmosphere to form acid rain.
2.4.1 SO2 NAAQS REVIEW
EPA first set both primary and secondary SO2 NAAQS in 1971. During the next NAAQS review in 1996, the standards were not
revised.
In June 2010, EPA issued and revised the primary NAAQS to establish a new 1-hour standard to protect against short-term
exposures. The existing annual and daily standards were revoked. EPA also proposed to revise the SO2 monitoring rule to require
both monitoring and refined modeling of local pollutant dispersion from upwind sources to determine compliance. In 2012, the
1971 secondary 3-hour average standards were retained without revision. EPA retained the 2010 primary 1-hour standards in
2019.
2. EPA designates attainment areas and unclassifiable areas as both “attainment/unclassifiable”
8district of columbia’s ambient air quality trends report 2020
2.5 NITROGEN DIOXIDE
DID YOU KNOW?
Nitrogen dioxide (NO2) is a brownish and highly chemically reactive gaseous
pollutant. It is the indicator of a class of compounds called nitrogen oxides (NOx), SO2 is considered to be a main
which contribute to ground-level ozone and fine particulate pollution. NO2 is contributor to regional haze in federally
formed during high-temperature combustion of fuels and by vehicle engines designated “Class I” national parks and
and industrial processes, such as electricity generation. All areas in the country wilderness areas, such as the nearby
currently meet the annual NO2 standards. Mobile source regulations are expected Shenandoah National Park. These
to continue reducing NO2 concentrations into the future. NO2 can exasperate photos show views from the park on a
asthma and respiratory issues. clear day compared to a hazy day.
2.5.1 NO2 NAAQS REVIEW
The first primary and secondary NO2 NAAQS were set by EPA in 1971. They were
reviewed twice but never revised. In its January 2010 revision, EPA retained
the current annual NO2 standards, while setting a new 1-hour NO2 standard to
protect against short-term exposures. The existing NO2 ambient air monitors in
the District and metropolitan area have been measuring concentrations below the
2010 standards. However, the new standards required an expanded monitoring
within 50 meters of major roadways and additional monitors in large urban areas.
By 2016, the District, Maryland, and Virginia had all established new near-road Views from Dickey Ridge (split image). Photo
monitoring stations. Given the adequate data collection from the new near-road from NPS
monitoring network, EPA has designated the DC-MD-VA region as an attainment
region for the 2010 NO2 standard. EPA retained the secondary annual NO2 standards without revision in 2012.
2.6 LEAD
Lead is a metal found naturally in the environment and in manufactured products. Soils and dusts can be contaminated with lead
from older paints, deposited emissions from mobile sources, construction materials, and industrial processes such as smelters or
battery plants. Lead levels dropped dramatically after 1973 when, following regulations promulgated by EPA, the country began
phasing out the use of leaded gasoline. Today, lead levels in ambient air are very low. Current inhalable lead exposure results
mainly from disturbed soils and dusts contaminated with lead, older paints and other lead-containing construction materials, and
aviation gasoline. The highest levels are usually found near lead smelters, where lead is extracted from ores. High exposure to
lead can result in serious neurological damage.
2.6.1 LEAD NAAQS AND MONITORING REVIEW
Ambient lead monitoring in the District has a long history. Through the 1960s and 1970s, the District’s air monitors reported high
concentrations of lead. In 1976, the phase-out of leaded gasoline caused monitors to report a significant drop in ambient lead
concentrations. The first lead NAAQS were established in 1978 and the country continued to see reduced lead levels and by the
1990s, lead concentrations consistently measured below five percent of the standard.
In 2008, EPA revised and replaced the lead NAAQS with a standard that was ten times more stringent than the previous standard.
The District’s air program revived the population-based ambient lead measurements in January of 2012, as required by the new
standard. Due to consistently low concentrations, at about 3% of the standard, the District ceased measurements of lead in 2016
under the provisions of 40 C.F.R.
9district of columbia’s ambient air quality trends report 2020
3.0 AIR POLLUTION IMPACTS
Air pollution is a result of the combustion of fuels (gasoline, natural gas, oil, diesel, coal, wood, etc.), release of vapors, suspension
of aerosols, disturbance of matter, and other commercial or industrial processes. Some pollutants are directly harmful to the
public or the environment, while others undergo chemical reactions in the air that make them more harmful. While impacts
of criteria pollutants on each individual can vary and be pollutant-specific, short-term and long-term exposure to air pollution
is linked to heart and lung disease as well as premature death. Air pollution can also negatively impact natural and built
environments, which can in turn affect human health.
3.1 HEALTH IMPACTS
Health impacts of air pollution include the following:
• Inflammation and irritation of the respiratory tract;
• Coughing, throat irritation, difficulty breathing;
• Aggravated asthma and other lung (respiratory) diseases leading to increased medication use, hospital admissions,
emergency department visits, and premature mortality;
• Aggravated heart (cardiovascular) diseases leading to increased medication use, hospital admissions, emergency
department visits, and premature mortality; alterations in pulmonary defenses;
• Lung or heart disease;v
• (Carbon monoxide) – Visual impairment, reduced work capacity, poor learning ability, difficulty in performance of complex
tasks; headaches and nausea;vi
• (Lead) – Damage to the developing nervous system, resulting in IQ loss and impacts on learning, memory, behavior, and
growth in childrenvii; kidney (renal) effects in adults; anemia; reproductive disorders; neurological impairments;viii
• (Ozone) Increased risk of pre-eclampsia and preterm birth from high exposure of ozone during the first trimester;ix
• (PM) high exposure to particulate matter can be linked to low birth weight and an increased risk of the child developing
asthma later in life since particulate matter can travel into the placenta;x and
• Recent research suggests that air pollution may be linked to mental health and neuropsychiatric disorders.xi
According to the 2016 National Survey of Children’s Health, the 2016 childhood asthma rate in DC was 12.1% compared to a
national average of 8.4%.xii Based on 2017 and 2018 data, there were an estimated 13,885 cases of asthma in children under
age 18 and 67,121 cases of adult asthma in the District.xiii Asthma is the leading cause of school absences from a chronic illness
in children aged five to seventeen, and accounts for roughly 1.8 million emergency room visits in the United States each year.xiv
3.2 ENVIRONMENTAL IMPACTS
Air pollution impacts on the natural and built environment include:
• Damage to vegetation such as visible injury to leaves, reduced
photosynthesis, impaired reproduction and growth, and
decreased crop yields;
• Damage to physical structures and property, especially marble
and limestone;
• Acid rain and acidification of lakes and streams; and
eutrophication (a reduced amount of oxygen) in coastal waters,
which is destructive to fish and other wildlife; According to the U.S. National Park Service, green streaks
• Reduced visibility; are evidence of acid rain’s effects.
Photo from NPS
10district of columbia’s ambient air quality trends report 2020
• Formation of greenhouse gases such as carbon dioxide (CO2) and ozone; and
• Decreased plant uptake of CO2 and soil, which can harm plants and wildlife.
3.2.1 WATER QUALITY
The Chesapeake Bay, the largest estuary in the United States and one of the most polluted, is affected by air pollutants,
particularly nitrogen that enters its waters when it rains. Roughly one third of all nitrogen compounds in the Bay are deposited
from the air.xv
3.2.2 CLIMATE CHANGE
Climate change is another serious impact of emissions. Emissions of greenhouse gases (GHGs) gather in the atmosphere and
slow the loss of heat from the earth to space, resulting in warming of the earth.xvi Climate change is altering the timing and
location of traditional rainfall and other weather patterns, ecosystem structure, biodiversity, and numerous other systems,
negatively impacting human health and wildlife.
Climate change also contributes to an increase in pollution. Due to the chemical nature of how ozone forms in the atmosphere,
ozone is more likely to form when temperatures are high and in the presence of sunlight. As GHGs are warming the planet, ozone
production increases due to more prevalent higher temperatures. In addition to temperature, pollution is strongly influenced by a
number of meteorological conditions such as humidity, wind flow, atmospheric stability, and cloud coverage. High temperatures
are usually accompanied with weak winds and stagnant conditions, which will allow pollutants to accumulate and ozone levels
to rise. In addition to this, during high temperature days, there is increased use of power consumption from air conditioners,
which requires more energy production from power plants, and thus more emissions. Due to climate change, the number of high
ozone days (days above 75 ppb) is expected to increase by 6-9 days annually in the District by 2050.xvii Figure 5 illustrates these
changes throughout the nation.
As climate change continues to affect global climate and increase temperatures, meeting ozone standards and ensuring healthy
air throughout the District will become even more challenging.
Figure 5: The mean change in number of high ozone days above 75 ppb by 2050
11district of columbia’s ambient air quality trends report 2020
3.3 FACTORS THAT IMPACT AIR QUALITY IN THE DISTRICT
Pollutants are emitted by sources referred to as “stationary sources,” which are in fixed locations, and “mobile sources,” which
do not have a fixed location and are generally propelled by or operated using an internal combustion engine.
Natural “biogenic” sources such as trees, crops, soils, and vegetation, also emit volatile organic compounds that can influence the
formation of ground-level ozone.
Air pollution emissions can be minimized using technology at a source or by adapting how or when a source is used. The costs
and effectiveness of an air pollution control measure is often inherent in decisions to use them. Additional factors are integral to
the quality of the District’s ambient air, as discussed below.
STATIONARY POINT STATIONARY
SOURCES NONPOINT SOURCES
Larger stationary “point” Smaller stationary “nonpoint”
sources are individual facilities or nonpoint sources are
with smoke stacks (factories, not identified individually
power plants), generally because they have more
Simon Law
classified as electric generating impact collectively (such as
units (EGUs) or non-EGUs. Non- small industrial or commercial
EGUs include facilities such facilities, gas stations, printing
as universities, large hotels, operations, auto maintenance
hospitals, etc. facilities, painting operations,
use of consumer products, and
fires).
USGS Shuttershock
MOBILE
MOBILE NONROAD
ONROAD Mobile “nonroad” or offroad
Mobile “onroad” highway Jason Reed/Reuters vehicles or equipment J. Jakuta
vehicles include cars, trucks, include locomotives, boats,
buses, and motorcycles. aircraft, construction
equipment, and lawn and
garden equipment
RaksyBH/Shuttershock Rainer Dittrich via Getty Images
3.3.1 METEOROLOGY AND TOPOGRAPHY
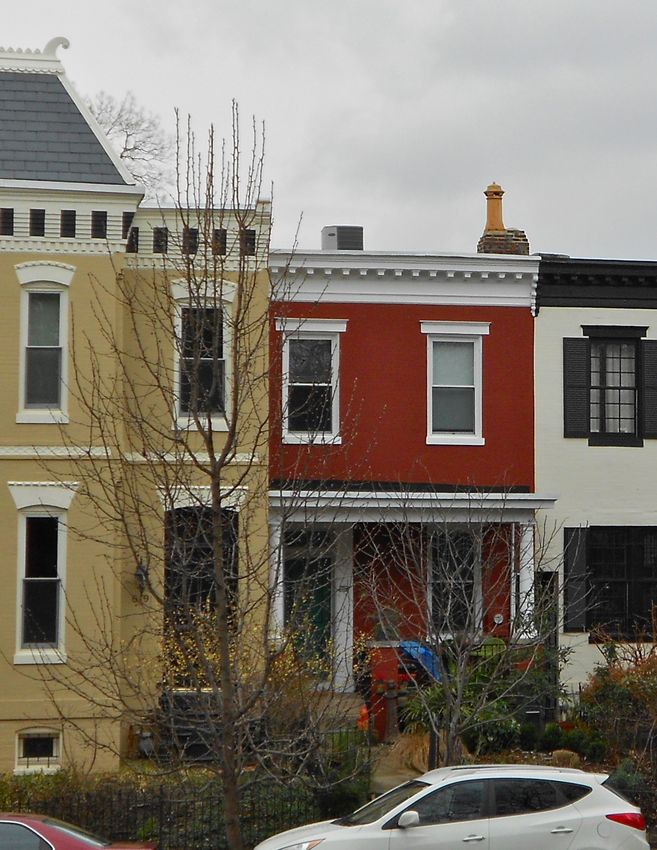
Chemical and physical interactions can occur between elements naturally in the air and emissions produced by human activity.
The District is predominantly a built urban environment scattered with forested parks and open spaces. It is situated close to sea
level at the confluence of the Anacostia and Potomac Rivers. There are four seasonal temperature fluctuations per year. Average
temperatures (in degrees Fahrenheit) range from the low 20s in January to the high 80s in July. Precipitation distribution is
uniform at roughly 40 inches annually in the form of rain or snow throughout the year.
12district of columbia’s ambient air quality trends report 2020
The District is located in the Mid-Atlantic region, between more rigorous climates in the
north and warm temperate climates in the south. Weather patterns are influenced by the DID YOU KNOW?
Chesapeake Bay and Atlantic Ocean to the east and the Appalachian Mountains to the west
and north. Since the District is near the average path of the low pressure systems that Paints, solvents, adhesives,
move across the country, changes in wind direction are frequent. During the summer, the cleaners, and other
area is influenced by large semi-permanent high pressure system commonly known as the household products often
Bermuda High, which is typically centered over the Atlantic Ocean near the coast of Florida contain volatile organic
that brings warm humid air to the Washington area. Downtown areas often experience a heat compounds (VOCs), which
island effect. The proximity of large bodies of water and the inflow of winds from the south contribute to formation of
contribute to high relative humidity during much of the year. ground-level ozone (smog),
particularly on hot days.
3.3.2 EMPLOYMENT, POPULATION, AND HOUSEHOLDS
Employment, population, and household estimates are often used as indicators of emissions activity. More activity in an area
means more people are driving, more energy is used, and more goods are produced and consumed. The Metropolitan Washington
Council of Governments (MWCOG) projects how much change will occur in the region and periodically publishes a “cooperative
forecast”.
The number of jobs, people, and households in the District dropped in the 1990s. The drop in population was accompanied by
a rise in population in surrounding areas. As indicated in Figure 6, there has been growth in employment, population, and the
number of households in the District in the past decade. The District currently has over 700,000 residents. Its population doubles
in size each day due to commuters and the millions of national and international tourists that visit the Nation’s Capital on an
annual basis.
Between 2013 and 2023, employment is projected to increase by one percent per year, or about 10 percent for the 10-year
period, which is slightly higher than anticipated during the 2011 to 2021 and 2009 to 2019 time periods. The District will see a
31% increase in job growth between 2015 and 2045. In the region as a whole, employment will reach 4.2 million jobs by 2045.
The highest gains expected by 2045 include professional and business services, construction, and information sectors (86%,
66%, and 65% respectively).xviii
Figure 6: Employment, Population, and Household Trends in the District
(Based on MWCOG Cooperative Forecast Round 9.1a)
13You can also read