Gender Violence, Enforcement, and Human Capital: Evidence from All-Women's Justice Centers in Peru
←
→
Page content transcription
If your browser does not render page correctly, please read the page content below
Gender Violence, Enforcement, and Human Capital: Evidence

                  from All-Women’s Justice Centers in Peru∗

            Guadalupe Kavanaugh†                Maria Micaela Sviatschi‡             Iva Trako§

                                           November 15, 2019

                                                 Abstract

      In many developing countries, access to justice remains unequal, especially for women. What
      are the implications of this inequality for gender-based violence and investment in children?
      This paper provides evidence from Peru’s all-women’s justice centers (WJCs), specialized in-
      stitutions that employ mostly female officers and provide police and legal services to reduce
      gender-based violence. Examining the gradual rollout of WJCs across districts and villages,
      we find that the opening of a center increases reporting and prosecutions for gender-specific
      crimes by 40%; it also reduces the incidence of gender-based violence, as measured by do-
      mestic violence, femicide, and hospitalizations due to mental health, by about 10%. We find,
      moreover, that this decrease in women’s exposure to violence has intergenerational effects:
      WJCs substantially increase human capital investments in children, raising enrollment, at-
      tendance, and test scores. These results are consistent with a bargaining model in which
      women’s access to justice determines the threat point.

      JEL Classification: J12, J16, I25, K38
      Keywords: gender-based violence, access to justice, children, household bargaining

  ∗
     We are very grateful for the abundance of support, guidance, and helpful comments from Karen Macours and
Thomas Fujiwara. We also gratefully acknowledge all the helpful comments and suggestions from Oliver Vanden
Eynde, Gustavo Bobonis, Leah Boustan, Janet Currie, John Giles, Martin Ravallion, Dominique van de Walle,
Denis Cogneau, Sylvie Lambert, Zach Brown, Suresh Naidu, Brendan O’ Flaherty, Cristian Pop-Eleches, Miguel
Urquiola, Bentley MacLeod, Jonas Hjort, Fabiola Alba, Maria Fernanda Rosales, Sofia Amaral, Will Dobbie, and
Ilyana Kuziemko, as well as seminar participants at Columbia University, Princeton University, Paris School of
Economics, NBER children, Barnard College, World Bank, IDB, IZA Labor and Gender Economics conference
and IZA Gender in developed and developing countries. We are very thankful to Sarita Ore Quispe, who provided
excellent research assistance. We are responsible for all remaining errors.
   †
     Rutgers University
   ‡
     Princeton University
   §
     Paris School of Economics and World Bank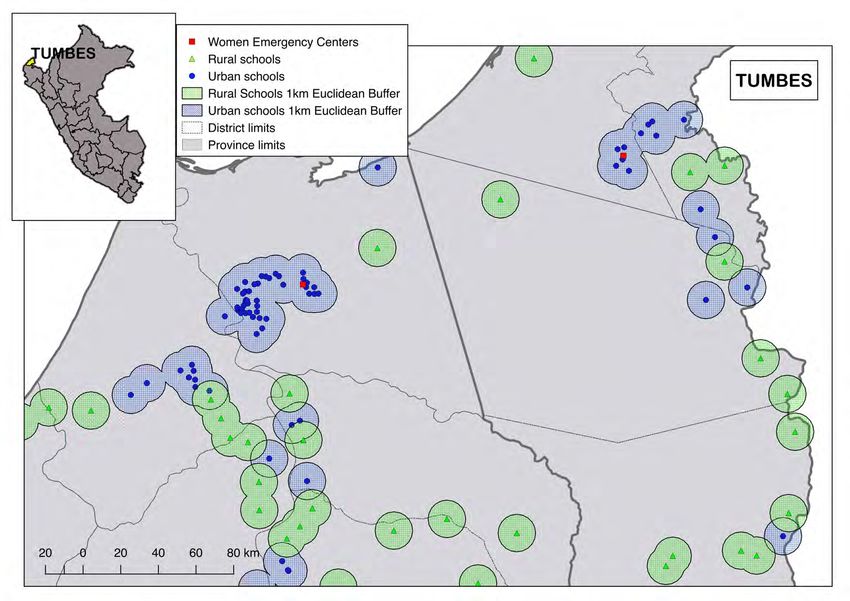
1    Introduction
Gender-based violence is a widespread social problem that affects 30% of women each year
worldwide (WHO, 2013) and has long-term negative consequences for women’s human capital
(Borker, 2017) and their children (Aizer, 2011). This problem is particularly relevant in devel-
oping countries, where women cannot rely on the justice system as a credible enough threat to
prevent violence against them. High rates of under-reporting of gender-based violence and low
arrest rates for crimes against women in these locations imply unequal access to the law, partic-
ularly for women (Eswaran, 2018).1 Women may not trust formal institutions enough to report
violence, given that police regularly ignore gender-based violence complaints (e.g. Jubb et al.,
2010; Boesten, 2012).2 In addition to all this, despite the fact that women’s representation in
politics has shown positive effects on the public goods provisions that women prefer (e.g. Chat-
topadhyay and Duflo, 2004; Beaman et al., 2009), the persistent lack of female representation in
law and enforcement exacerbates inequalities in access to justice.3 Might this low enforcement
of gender-based violence generate substantial costs for women and children?
    In this paper, we provide evidence that in Peru, increasing the enforcement of violence against
women reduces the incidence of gender-based violence, and consequently improves children’s
outcomes. We exploit the impact of an innovative form of access to and representation of
justice: all-women’s justice centers (WJCs). WJCs are specialized state institutions that employ
primarily female officers in efforts to reduce gender-based violence, bringing together police, legal,
and medical services in a single office in order to integrate all steps of the complaint process.
WJCs have gained popularity in developing countries in recent years, yet little is known about
their effectiveness.4
    This paper explores two questions about the relationship between WJCs, gender-based vio-
lence, and human capital investments. First, we ask whether WJCs improve the reporting and
deterrence of gender-based violence, which we measure using (i) administrative data from hos-
pitals and district attorney offices about femicides, female deaths due to aggression, and female
mental health, (ii) administrative reported-crime data from police station and WJC complaints,
(iii) administrative incarceration data, and (iv) self-reported domestic violence from household
surveys. Second, we examine the intergenerational effects of increasing women’s access to justice,

    1
      Evidence from India finds that only three percent of women have ever had contact with the police, although
the rate of gender violence is very high (Banerjee et al., 2012).
    2
      In cases of family violence in rural Peruvian communities, for example, women are often assumed to be
partially to blame for the conflict (Revilla, 1999). In many cases, police ignore domestic violence complaints
entirely, reasoning that “domestic disputes” should be worked out within families and are not a police matter.
Moreover, traditional methods of justice based on local customs are also often discriminatory toward women
(Franco and González, 2009).
    3
      For instance, according to the Peruvian National Census of Police Stations (Censo Nacional de Comisarı́as)
for 2017, only 13.3% of the 47,265 police officers who work at police stations are female.
    4
      This type of intervention has been implemented in Brazil, El Salvador, Argentina, Ghana, India, Pakistan,
Mexico, Brazil, Ecuador, Uganda, and South Africa.

                                                       1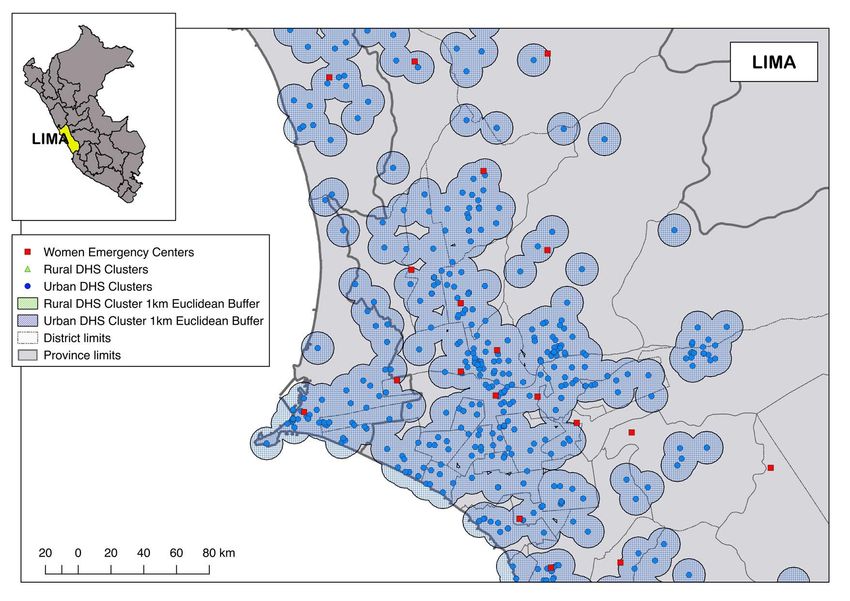
focusing on investments in children’s human capital using (iv) school census data and household
surveys. These data provide insight into whether household investments in children increase
when violence against women declines.
   To estimate the causal impact of improving women’s access to justice, we exploit the gradual
rollout of WJCs across locations in Peru from 2006 to 2014. The problem of violence against
women is particularly acute in Peru, which has the third-highest rate of intimate partner sexual
violence in the world, at 46.6%, and also one of the highest rates of violence against women
in the region (WHO, 2012; United Nations, 2015).5 To address this endemic problem, the
Peruvian Ministry for Women and Vulnerable Populations created the WJCs in 1999 as part
of the National Program against Sexual and Family Violence. The opening of WJCs has been
a large-scale national program implemented across the entire country. During the period of
analysis, the number of WJCs grew from 13 in the first year to 226 in the last, covering all of
the country’s 24 regions and 96% of its provinces.
   Given this setting, we use a difference-in-differences strategy that exploits time variation
in the opening of WJCs and spatial variation in the exposure of a household or school to
a WJC, together with province-by-year fixed effects. We geo-match households and schools
with detailed data on WJC locations and founding years in order to construct two different
measures of exposure to a center: the presence of a WJC within 1 kilometer of a household/school
and the presence of a WJC in a household or school’s district. This empirical strategy allows
us to compare changes over time in the outcomes of (a) households (including women and
their children) and (b) schools already residing in proximity to a WJC center (“treatment
households/schools”) to those not yet reached by the program (“control households/schools”).
   To observe these sources of variation, we build a detailed panel using multiple geocoded
datasets during the period 2006–2014. Our panel comprises individual and household-level sur-
vey data, administrative school-level data, administrative crime data, femicides, female deaths
due to aggression, and female hospitalizations for mental health problems. These categories of
data enable us to analyze gender-based violence at a very disaggregated level before and after
the opening of WJCs. Moreover, since a large part of our data comes from non-self-reported
administrative records (e.g., femicides and hospitalizations), we can disentangle the effects of
the reporting bias usually present in crime data.
   Our first finding is that improving access to justice for women reduces domestic violence
and female deaths due to aggression. We also find that it improves women’s mental health.
In particular, using survey data we find that after a WJC opens, women who live within a
1-kilometer radius are significantly less likely to experience physical and emotional violence at
the hands of their spouses. In addition, using administrative data the presence of a WJC center
in the district is associated with a 7% reduction in female deaths due to aggression and a 10%
decline in mental health hospitalizations. We find no effects for men over the same period,

   5
       This rate is well above the Latin American and Caribbean averages, which range from 5% to 15%.

                                                       2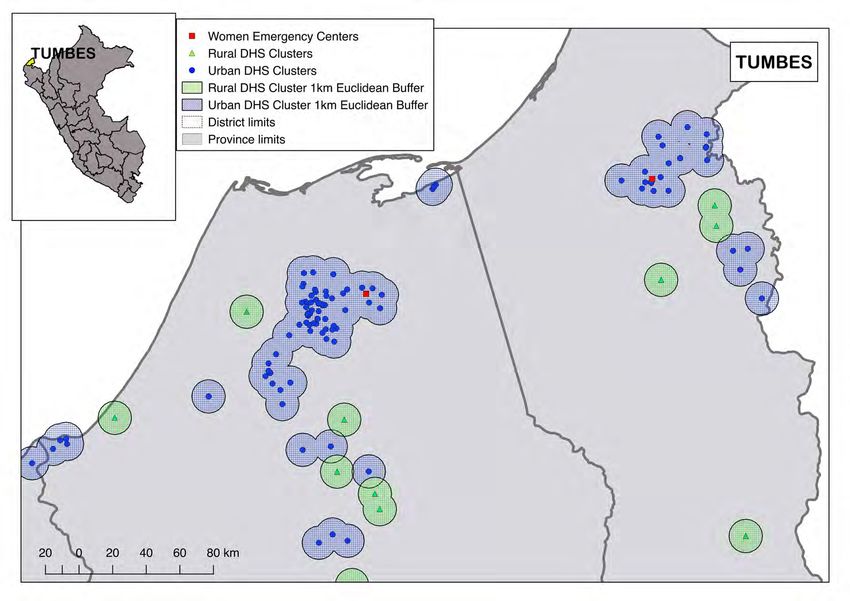
suggesting that no overall improvement in law and enforcement conditions or policy changes is
driving our results, only the opening of the WJCs.
    WJCs have several innovative features that can explain the reduction in gender violence.
WJCs pose a credible threat to offenders by ensuring more thorough and frequent reporting,
enforcing criminal penalties, or offering the issue of restraining orders in gender-based violence
cases. In particular, WJCs are likely to improve the quality of service provision and effectiveness
by allowing women to pursue all the steps of their complaints in a single office.6 In addition,
the presence of female officers may increase the likelihood that women will feel comfortable
approaching the police and other government institutions to seek help.7 For example, female
officers may be more responsive to gender violence because they are more aware of the challenges
female victims face when initiating such complaints.8
    Consistent with these mechanisms, we find evidence that after a WJC opens in a district,
women increase the reporting of gender-based violence cases, and the probability that a perpetra-
tor is prosecuted increases. Specifically, we find that gender-based violence complaints increase
by 40%. This result is consistent with administrative data for 2017, which shows that 75%
of women who went to a WJC completed the entire complaint process against their aggressor,
compared to 10% of those who went to a traditional police station.9 In addition, we also show
that WJCs actually increase the costs for perpetrators through their ability to better collect
evidence against them. We find a significant increase in the probability of being prosecuted for
sexual assault, femicide, and rape after the opening of these centers.
    Our second main finding is that WJCs can have positive inter-generational effects on children
by reducing gender violence. We find that after the opening of a WJC, children living in
households located near the center are significantly more likely to be enrolled, attend school, pass
a grade, and have better national test scores, and they are less likely to drop out of school. These
results are robust to using different datasets that measure educational outcomes. Moreover,

    6
       There is substantial qualitative evidence that traditional police fail to adequately investigate reports of sexual
assault in Peru. In many cases, for example, police neglect to request lab testing of rape kits and other forensic
evidence.
     7
       Female victims may feel more confident about reporting such crimes to female officers. On a related note,
Iyer et al. (2012) find that as women increase their representation in politics, a higher percentage of female victims
report crimes in their areas of jurisdiction.
     8
       According to qualitative evidence from the United States, female police officers are more likely to be engaged
in domestic violence cases (Bureau of Justice, 2000). For example, a study done in Washington, D.C., found that
female officers were less likely than male officers to dismiss or ignore victims who had made repeated calls to the
police (Lonsway, 2000). Women are also known to be less corrupt and less violent, and they are proven to have
more pro-social traits and better interpersonal skills (Brollo and Troiano, 2016; Schacht, Rauch and Mulder, 2014;
Eckel and Grossman, 2008; Nowell and Tinkler, 1994), which may predispose them to better handle gender-based
violence once in office. According to recent surveys (Pew 2017), there is also a significant gender gap in attitudes
on policing. Female officers are less likely than male officers to agree that aggressive tactics are necessary. These
differences in preferences, traits, and sensitivity toward gender-based violence suggest that female police officers
will behave differently than their male counterparts when dealing with complaints of violence against women.
     9
       Press release issued by the Peruvian Ministry for Women and Vulnerable Populations on January 8, 2018.
https://www.mimp.gob.pe/salaprensa/nota-prensa.php?codigo=2662

                                                           3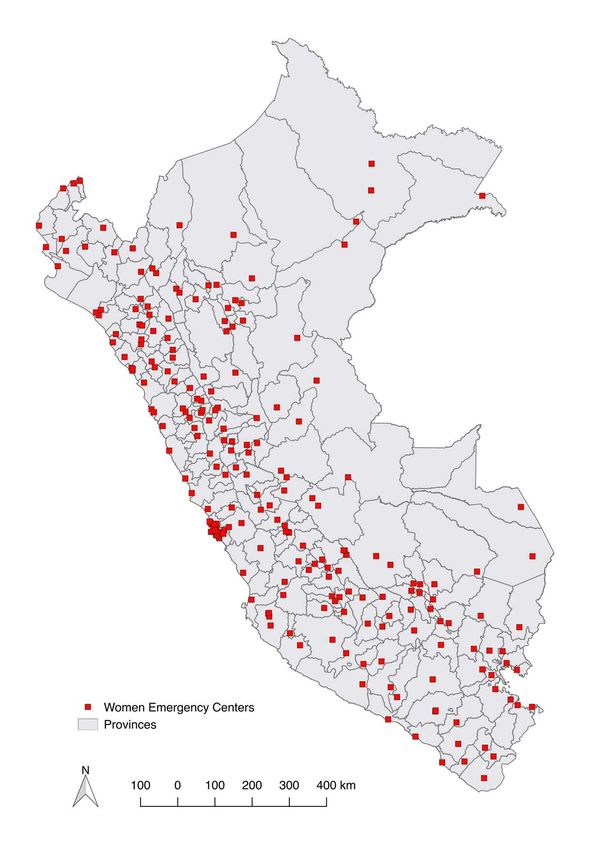
we find that the main results for children are driven by those from potentially historically
violent households (measured by whether their grandmother was subject to domestic violence),
suggesting that WJCs’ intervention in abusive households may change the behavior of offenders
and victims by improving the situation of the women in the household and consequently their
investments in their children.
    We next examine further the mechanisms driving the results for children. Several economic
theories of household bargaining power suggest that policies designed to increase women’s outside
options when they are in abusive relationships may also affect intra-household allocation of
resources through changes in their relative bargaining positions (Farmer and Tiefenthaler, 1996;
McElroy and Horney, 1981; Manser and Brown, 1980).10 Similarly, the threat point for women
may increase when they have access to justice and support services are more helpful. WJCs
may allow women to credibly threaten offenders with police involvement or to decrease offenders’
incentives to use violence given the higher probability of criminal penalties.
    While we cannot disentangle the specific mechanisms driving the results for children, we find
suggestive evidence of an improvement in the bargaining power of women in the household. In
particular, we find that women living near a WJC are more likely to make joint decisions with
their husband. This mechanism may operate by changing women’s bargaining power within the
household, as well as improving their health by reducing their exposure to violence. While we
cannot disentangle these effects, we find evidence that both mechanisms may be important.
    The main threat to our identification strategy is the potential for time-varying unobservables
that are correlated with both the timing of the opening of a WJC and changes in the prevalence of
domestic violence and education outcomes. To ensure that our results are not driven by selection
or time-varying unobservables, we perform several falsification exercises and robustness checks.
First, we look at the data for non-gender-specific complaints, such as property crimes, and find
no difference.11 In addition, we find no effects on children’s education for historically non-violent
households and for households where the father is not present. These results, combined with the
fact that we find a reduction only in the incidence of violence against women and not men, help
rule out other confounding factors, such as an improvement in police presence or investments in
education in these areas. Second, we find no evidence of pre-trends on the main outcomes, and
we do not find any effects on several district time-varying outcomes, such as municipal income
and expenditures on education by the government. Third, we show that WJC placement was not
anticipated by changes in gender-based violence and schooling.12 Finally, we limit the samples
    10
       Previous empirical studies have shown that an increase in women’s income appears to benefit children
(Bobonis, 2009; Attanasio and Lechene, 2002; Thomas, 1990; Lundberg, Pollak and Wales, 1997). Most of this
literature finds that households in which women’s income share is higher spend a larger fraction of their income
on children’s clothing and food. Although in the case under study we do not find a change in women’s income or
labor-force participation, when justice for women increases (thus triggering a decline in gender-based violence),
women are more likely to invest in children.
    11
       Property crimes include theft, robbery, fraud, extortion, and usurpation. Nor do we find any effects on
economic, finance, public, or drug crimes.
    12
       A central issue in our analysis is the fact that WJCs are not placed randomly. Conversations with policy-

                                                       4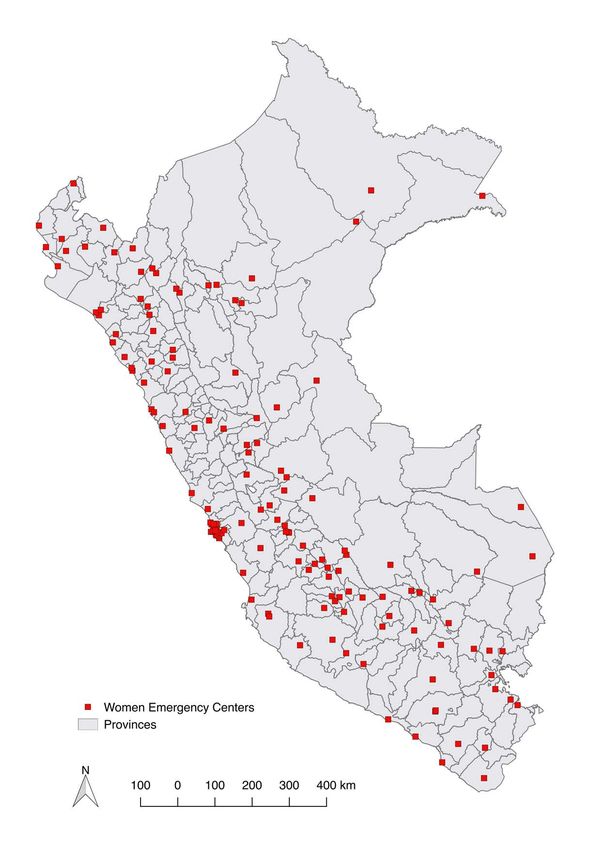
to areas that are most comparable to those with WJCs—urban schools and urban clusters of
households—since WJCs are more likely to be located in more densely populated areas. We
further examine the results by limiting the sample to all districts that ever had a WJC.
    This paper can inform several strands of literature. It complements the literature on minority
representation in politics and public goods provision (Chattopadhyay and Duflo, 2004; Pande,
2003; Clots-Figueras, 2012; Brollo and Troiano, 2016; Beaman et al., 2009) by providing evidence
on the role of female representation in another sphere—law enforcement—that may have a
significant impact on reducing crimes against women. In this regard, our paper is closely related
to a nascent literature exploring the effects of female officers’ presence at police stations on
the reporting of gender-specific crimes in India (Amaral, Bhalotra and Prakash, 2018) and the
US (Miller and Segal, 2018). This paper complements this literature by analyzing an integral
approach that increases both women’s access to and representation in law and enforcement at all
stages of the complaint process. Having a more integrated approach that combines all services in
one office can be particularly important, given that most victims do not follow up on their case
after visiting the police and that only a small fraction of gender-based violence complaints pass
to the next step due to lack of evidence. Moreover, while contemporaneous evidence in India
and the US mainly focuses on whether there is a change in reporting gender-based violence, we
complement this work by showing that actual violence against women also declines after the
introduction of WJCs. This may be due to the complementary services offered at WJCs, such
as legal and medical support, that help these cases succeed. For example, Amaral, Bhalotra and
Prakash (2018) find that although reporting increases after the introduction of female officers,
the arrest rates and incidence of violence do not change, likely due to lack of evidence. WJCs,
in contrast, help decrease actual violence by offering tools to increase the likelihood that cases
succeed and offenders face consequences.
    This paper is also related to the literature linking economic conditions and gender-based vio-
lence (e.g. Haushofer and Thomas, 2018; Aizer, 2010). While it is often assumed that improving
the economic situation of women and ensuring they get an equal share of resources within their
households will alleviate gender-based violence, recent research has shown that this is not always
the case (Bobonis, González-Brenes and Castro, 2013; Eswaran and Malhotra, 2011; Bloch, Rao
and Desai, 2004).13 A potential explanation for this result could be that the enforcement of jus-

makers and WJC managers suggest that they choose where to locate them based primarily on population density,
level of infrastructure, and proximity to certain institutions. There was no mention of choosing their locations
based on anticipated or recent increases in violence or schooling. All results are robust to including pre-existing
characteristics interacted with year fixed effects. Moreover, in order to control for the non-random placement
of WJCs, we include a province-by-year fixed effect that controls for any characteristics that may vary at the
province and year level. By using province-by-year fixed effects, our identification assumption is that treatment
schools/households would otherwise have changed in the same ways, on average, as control schools/households in
the same province.
   13
      On the one hand, employment opportunities, conditional cash transfers, or access to welfare services may em-
power women by increasing their resources within the household and outside options, increasing bargaining status
in their relationship and thus decreasing their exposure to violence (Farmer and Tiefenthaler, 1996; Stevenson
and Wolfers, 2006; Aizer, 2010; Hidrobo and Fernald, 2013). On the other hand, increasing the resources available

                                                        5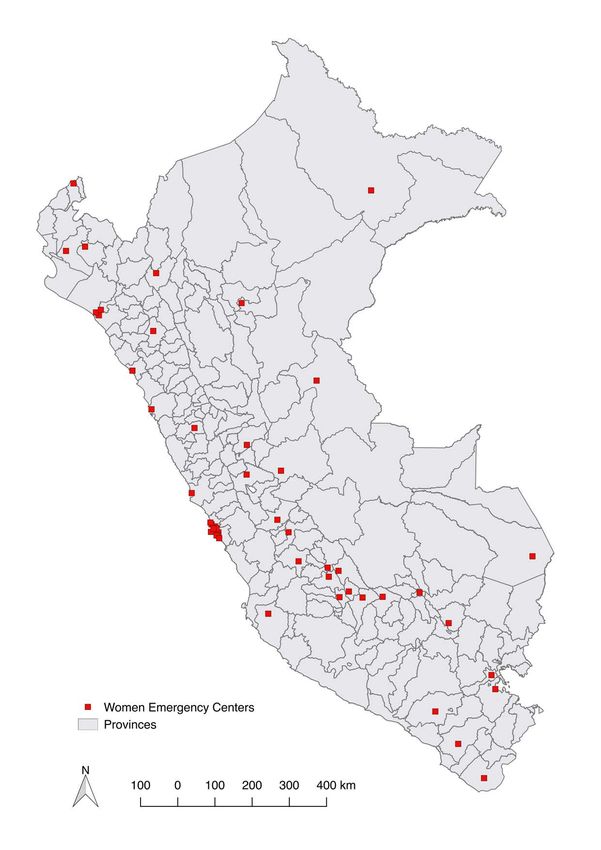
tice around crimes committed against women may be perceived to be low, allowing perpetrators
to threaten violence without repercussions. Our data on WJCs offers an alternate scenario, in
which offenders are punished for their crimes.
    Finally, this paper provides new causal evidence on the effects of gender-based violence on
children. The results are in line with previous research in developed countries that document, as
a correlation, that children exposed to domestic violence tend to have more health, emotional,
and behavioral problems, as well as poorer academic performance (Edleson, 1999; Wolfe et al.,
2003; Pollak, 2004; Fantuzzo et al., 1997; Koenen et al., 2003; Holt, Buckley and Whelan, 2008;
Baldry, 2003; Carlson, 2000; Currie, 2006; Black, Sussman and Unger, 2010). To the best of
our knowledge, the closest related papers that rely on a quasi-experimental approach are Aizer
(2011), Agüero (2013), and Currie, Mueller-Smith and Rossin-Slater (2018). These papers,
using different approaches and datasets, all find that domestic violence has a negative impact on
women’s pregnancies and infant health. We complement these findings by providing new causal
evidence on the relationship between gender-based violence and children’s education. Moreover,
we provide this new evidence in the context of developing countries, where gender-based violence
is high and, in many households, perceived as commonplace and justified.
    The remainder of this paper is organized as follows. Section 2 presents a brief background on
the prevalence of domestic violence in Peru and on the WJC intervention. Section 3 describes
the data. Section 4 presents the empirical strategy. Section 5 presents the main results and
investigates the channels through which WJCs affect domestic violence and children’s schooling.
Section 6 provides supporting evidence consistent with the identification assumptions. Section
7 concludes.

2      Background
2.1     Women’s Justice Centers Program
The 1994 Inter-American Convention on the Prevention, Punishment, and Eradication of Vio-
lence against Women, known later as the Convention of Belem do Pará, significantly expanded
Latin America’s definition of domestic and sexual violence by describing violence against women
and establishing their fundamental right to a life without it. As a consequence, many countries
in the region modified or enacted new legislation incorporating these issues into their political
agenda. In particular, Peru altered the jurisdiction of its police and justice system to encompass
domestic and sexual violence complaints and resolution. This new legal framework, paired with
the government’s awareness of the country’s high levels of domestic violence, led in 1999 to the

to women may strengthen men’s incentives to threaten or use violence to control these newly obtained resources
or to regain decision-making power within the household. As a result, women may become more vulnerable to
mistreatment (Bobonis, González-Brenes and Castro, 2013; Eswaran and Malhotra, 2011; Bloch, Rao and Desai,
2004).

                                                      6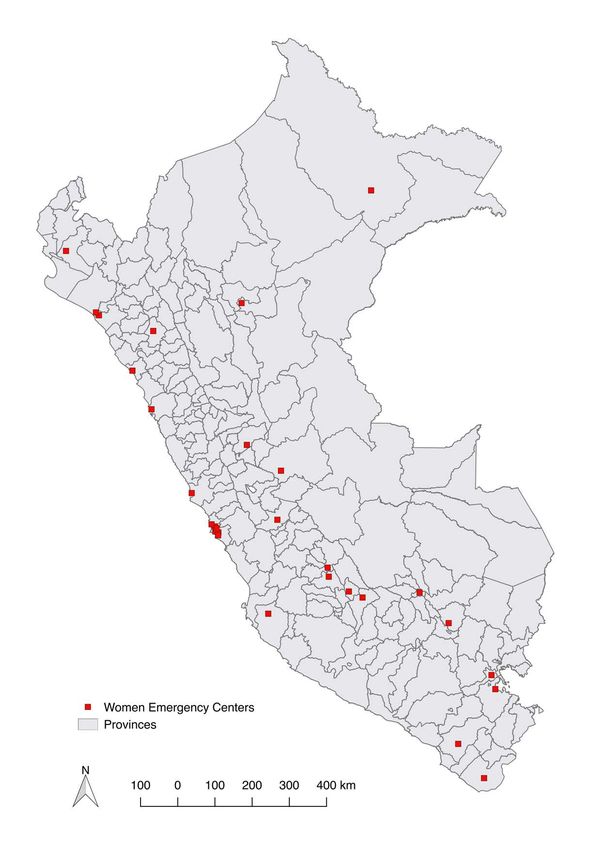
creation of women’s justice centers (WJCs) by the Peruvian Ministry for Women and Vulnerable
Populations (MIMP) as part of the National Program against Sexual and Family Violence.14
    Women’s justice centers (WJCs) are free-of-charge public centers that aim to strengthen the
justice system’s capacity to detect, process, and assist victims of domestic and sexual violence
through an interdisciplinary approach that includes access to legal, social, and psychological
resources. Basically, incoming victims receive a service designed to integrate all the steps of the
complaint process (e.g., police station, attorney’s office, and medical doctor) in a single office.
The goal is to reduce, to the extent possible, the time and hassle required to file a complaint
and follow the legal procedures of the corresponding court of justice. In addition, to reduce
the emotional toll by making the process easier after a traumatic experience. WJCs are thus
frequently located a short distance from partner establishments, such as prosecutors’ offices and
health facilities.15
    The first women’s justice center opened in the district of Lima in 1999. During the period
1999–2014, the number of centers has grown from 13 to 226, covering 100% of Peru’s 24 regions
and 96% of its provinces (188 of 196). Figure 1 shows the distribution and growth of the
opening of the WJCs over time. Whereas WJCs opened gradually throughout the first years of
implementation, the program expanded exponentially after 2006. Up to that year, the average
opening rate was about six WJCs per year; from 2006 to 2014, this rate climbed to 22 WJCs
per year. Such escalation was provoked by a 2006 decentralization decree that granted local
governments the right to open their own WJCs at the district level.
    From a geographical coverage point of view, as of 2014, most of the WJCs were concentrated
in Metropolitan Lima and Lima Provinces (31 WJCs). Outside that was the Callao region, with
4 WJCs; the rest of the coastal region outside Callao and Lima, with 46; the sierra region, with
117; and the jungle region, with 28 (Figure 2). Given the above-mentioned strong ties to local
justice and health institutions, WJCs tend to be heavily concentrated in urban areas throughout
these regions.
    According to MIMP’s statistics, the number of domestic violence cases registered in the
WJCs has increased substantially: from 29,759 in 2002 to more than 60,000 in 2016 (see Figure
A-1). Whereas 40% of reported cases concern women between 25 and 45 years old, children and
teenagers (0–17 years old) constitute the second largest group (30%). One of the most telling
pieces of data on their effectiveness is a 2006–2008 survey of 51 WJCs administered by MIMP,
which revealed that for the majority (75%) of women who visited a WJC, domestic violence

   14
      Note that the Peruvian Ministry for Women and Vulnerable Populations, now known as the Ministerio
de la Mujer y Poblaciones Vulnerables (MIMP), was called the Ministry for Women and Social Development
(Ministerio de la Mujer y Desarrollo Social, or MIMDES ) when the WJC program was rolled out in 1999.
http://www.mimp.gob.pe/contigo/contenidos/pncontigo-articulos.php?codigo=14
   15
      These centers are staffed by representatives of government institutions, such as police officers, prosecutors,
counsellors, psychologists, and social workers, whose objective is to help the victims of domestic abuse (MIMDES,
2007).

                                                         7
stopped during or after the program intervention (MIMDES, 2009).16
3 The Data
This paper makes use of three different types of datasets, which provides variation across geo-
graphical regions and time at different levels of aggregation: (1) individual- and household-level
data, (2) school-level data, and (3) administrative data on WJCs, crime complaints, femicides,
female deaths due to aggression, and female hospitalizations for mental health problems at the
district level.
3.1 Individual- and Household-Level Data
To study the impact of WJCs on outcomes for women and their children, we rely on microdata
from the Peruvian Demographic and Health Survey (DHS), which has been collected for the
period 2000–2014.17 These surveys are cross sections designed to be representative at the na-
tional and regional (second administrative) levels. The DHS employs a stratified random cluster
sampling procedure in which the country is divided into several primary sampling units (in this
case, districts) and clusters of households are randomly selected.
The survey collects primarily demographic and health information from women aged 15 to
49 years old, including data on their fertility, weight, marital status, employment status, house-
hold decision making, and socio-economic characteristics, among other things. Additionally,
it includes demographic and socioeconomic characteristics for each of the women’s household
members (e.g., husband and other children), which we exploit in our analysis.
In addition to the standard survey, the Peruvian DHS also includes a domestic violence
module that asks eligible women if they have experienced physical, sexual, or emotional abuse
from their current or previous partner in the previous 12 months.18 While all women between
the ages of 15 and 49 are asked to participate in the standard survey, only one woman in each
household who has been or is married or partnered is randomly selected to complete the domestic
violence module. Women who are not married or cohabiting are excluded from the sample.
This selection process is undertaken by the DHS program in order to minimize underreporting
of domestic violence events.19 The DHS captures four different types of domestic violence:
16
Ministerio de la Mujer y Desarrollo Social. 2009. Investigacion operativa: “Eficacia de la intervencion de
los Centros Emergencia Mujer”. Available at http://www.mimp.gob.pe/files/programas_nacionales/pncvfs/
estadistica/eficacia_intervencion_cem.pdf
17
The Encuesta Demografica y de Salud Familiar (ENDES) is the Peruvian version of the Demographic and
Health Surveys (DHS). These surveys are available for the following years: 2000, 2004–2008, and 2009–2014. The
Peruvian DHS is a continuous survey, which means that the data has been collected quarterly (as opposed to
every five years) since 2004.
18
It should be noted that although this is an important measure of domestic violence, it does not report the
various forms of gender-based violence that affect women beyond spousal and inter-family relationships.
19
The domestic violence module of questions is implemented only to a subsample of the women selected for the
Peruvian DHS sample. In general, the interviewers are women trained to elicit trust from the respondents. There
8moderate physical violence, severe physical violence, sexual violence, and emotional violence.
These domestic violence categories are defined by the DHS as ex-post classified questions.20
Since the last measure is less visible and more difficult to measure, in this study we define
exposure to a domestic violence event as a woman’s experiencing any type of moderate or severe
physical or sexual violence during the previous 12 months.
One advantage of using this household survey is that we can link children’s outcomes (e.g.,
school attendance status or involvement in child labor) with their mother’s and grandmother’s
self-reported domestic violence. This information is crucial in order to be able to understand
the mechanisms behind the results. Since attendance rates are not accounted for in the School
Census, we use the Peruvian DHS to estimate the share of children in primary and secondary
grades who are enrolled in and attending school.21 This survey also allows us to measure
children’s school performance (e.g., passed a grade, repeated a grade, dropped out) and whether
the child is involved in any child labor.
Panel B of Tables A-1 and A-2 provides summary statistics on women’s characteristics and
children’s school attendance status during 2006–2014, respectively.22 According to the Peruvian
DHS, the data indicates that 39% of ever-partnered Peruvian women disclosed experiencing
abuse from their spouse during the previous 12 months, which is remarkably high. As for
children’s education outcomes, the school attendance rate at the primary level is 97% for both
boys and girls, which is almost universal. The school attendance rate at the secondary level
is also quite high (89%) and very similar between genders. Given that secondary school is not
compulsory, the drop-out rate reaches 9% at this educational level.
are three security and ethical precautions increasingly mandated by the DHS program for those collecting data
on domestic violence. The first requires that the interviewer not continue with the questions on domestic violence
if privacy cannot be ensured. The second requires that only one eligible woman in each selected household is to
be administered the module questions, even if more than one is eligible. Interviewing only one woman in each
household allows for the minimization of possible security breaches caused when others in the household discover
that information on domestic violence was given. The third requires that the domestic violence questions only
be administered to previously or currently married or cohabiting women, even though the DHS sample includes
all women age 15–49. Only 1% of eligible women were not interviewed because privacy was not possible in the
household. Despite the selection measures taken by the DHS program, this empirical analysis may still suffer
from measurement issues due to under-reporting. In order to account for this, we also study alternative outcomes
to measure violence against women, including femicides and female deaths due to aggression.
20
Specifically, the DHS defines moderate physical violence as a woman experiencing at least one of the following
acts from her spouse or partner: (a) the spouse has pushed, shaken, or thrown anything; (b) the spouse has slapped
the respondent; (c) the spouse has punched the respondent with his fist or something harmful; (d) the spouse
has kicked or dragged the respondent. Severe physical violence is defined as a woman experiencing at least one
of the following acts: (e) the spouse has tried to strangle or burn the woman; (f) the spouse has threatened the
woman with a knife, gun, or other weapon; (g) the spouse has attacked the woman with a knife, gun, or other
weapon. Sexual violence is defined as a woman experiencing at least one of the following acts: (h) the spouse
has physically forced sex when not wanted; (i) the spouse has forced other sexual acts on the woman when not
wanted; (j) the spouse has twisted the woman’s arm or pulled her hair.
21
For the children’s school attendance analysis, we also use the 1996 Peruvian DHS in order to assess the
validity of the identification strategy.
22
We focus our analysis on the middle of the rollout period, 2006–2014, for which identifying assumptions are
likely to hold. We discuss this choice in more detail in Section 6.
9In addition, the Peruvian DHS also records GPS coordinates for every cluster of households
in a certain district, which allows us to measure not only the presence of WJCs in the district
of residence but also proximity to the closest WJC.23 Although this data was collected yearly,
in this study we were able to obtain the GPS cluster locations for only the 2000, 2004–2008,
2009–2011, and 2014 Peruvian DHS Surveys. Since the DHS does not disclose the names of
the villages (centros poblados) where the clusters are located, the final sample is a repeated
cross section of individuals (women and children) in which the lowest geographical unit we can
condition on is the district.
One potential concern with this database is linked to the fact that the GPS locations of
the sampled DHS clusters of households are displaced before public release to preserve the
confidentiality of respondents. The GPS displacement is randomly carried out so that urban
clusters are uniformly displaced up to two kilometers and rural clusters are displaced up to
five kilometers, with 1% of the rural clusters displaced up to 10 kilometers. In addition, the
displacement is restricted so that the points stay within the second administrative level, which
is the province. Therefore, the GPS displacement procedure introduces a random error, which
could substantively affect the results of the analysis (Burgert et al., 2013).
Thus, we follow several recommendations proposed by Perez-Heydrich et al. (2013) for re-
ducing distance measurement errors. First, they suggest that the amount of measurement error
depends on the spatial density of the resource facilities. As the density of resource facilities
decreases, the probability that a DHS cluster is correctly linked to the closest WJC increases
for all types of locations (urban and rural). In Peru, there are a total of 226 WJCs by 2014;
this means that the spatial density of the WJCs is quite low, and thus the measurement error
is likely to be significantly reduced. Second, the authors recommend studying the effect of the
service within a reasonable buffer distance, rather than using the closest distance to the resource
facility. For this reason, we measure exposure to the WJC through different groups of Euclidean
distance buffers. Finally, we also limit our analysis to urban areas, because in these locations
the range of displacement is less than in rural areas.
3.2 School-Level Data
We use two school-level datasets: the Peruvian School Census (Censo Escolar, CE) and the
Census Evaluation of Students (Evaluacion Censal de Estudiantes, ECE). The Peruvian School
Census is a large-panel dataset on primary and secondary school enrollment that covers the
universe of schools in Peru during the period 1998–2014. This dataset has been collected on a
yearly basis by the Peruvian Ministry of Education (with the exception of the year 2003), and
it contains a rich set of information at the school level.
More specifically, the School Census collects comprehensive data on the total number of
23
In the Peruvian DHS (2000 - 2014), there are on average 25 households per cluster, which may range from
1 to 45 households.
10enrolled students by age, grade, and gender. This data is designed to reflect enrollment (not
attendance) statistics corresponding to the months of May–July. The School Census also collects
data on school characteristics such as language of instruction, public or private, urban or rural
area, and other physical plant characteristics (e.g., electricity or piped water). We complement
this data with the Census Evaluation of Students, which contains the standardized test scores of
a national exam administered every year to all primary school students in second grade during
the period 2007–2014. This exam has two portions: math and (Spanish) language skills.
Each school in these datasets is given a unique ID number, which allows us to follow schools
over time. In addition, one of the main advantages of these school datasets is that they are
geocoded, which means that we can observe the exact location of the schools. We can then
combine these data with the data on the geographic location of WJCs to see whether the
area/district of the school is located near a WJC and thus affected by the opening of these
centers.
Panel A of Table A-3 shows the years of data coverage and the number of schools by ru-
ral/urban region. In order to be consistent with the individual-level data, for this analysis, we
also use data that covers the period 2006–2014. In the later years, the dataset covers a larger
share of schools. It is important to note that during the period of study, some schools closed
and others opened; additionally, as mentioned above, no data was collected for the year 2003.
Although this means we do not have a balanced panel, by including school fixed effects, we en-
sure that we compare the same schools over time. The main analysis, then, draws on a nine-year
unbalanced panel dataset of 36,994 primary schools (grades 1–6) and 12,811 secondary schools
(grades 1–5).24
Panel C of Table A-3 provides some summary statistics on school enrollment and school
characteristics. The average primary school in our sample has 95.9 students, while the average
secondary school has 175 students. The proportion of primary schools is higher in rural areas,
while urban areas tend to have a higher number of secondary schools per capita. Around one
third of primary schools in Peru are not equipped with electricity and piped water. The majority
of primary schools are public and teach in Spanish, but there is also a small proportion that
teach in Quechua and other native languages. In contrast, a large proportion of secondary
schools (40%) are private, and in almost all secondary schools the language of instruction is
Spanish.
A final important issue with the School Census data is that it measures the total number
of children enrolled, not enrollment/attendance rates. This may lead to the concern that our
results reflect changes in population, instead of the proportion of children enrolled or attending.
We discuss this issue in greater detail in Section 4. As an additional robustness check, we also
use the Peruvian DHS to estimate the share of children who are attending school.
24
The primary-school sample covers between 4.1 and 3.5 million students each year, whereas the secondary
school sample covers between 2.3 and 2.7 million students.
113.3 District-Level Data
Information on the rollout of the WJCs was provided by the Peruvian Ministry for Women
and Vulnerable Populations (MIMP) and consists of a directory of WJCs across all of Peru.
This directory contains the name of the WJCs, their founding dates (date-month-year), their
administrative locations (district-province-department), and their addresses during the period
1999–2014. By using the administrative locations and addresses provided in the directory of
the MIMP, we were able to geocode all the WJCs, which allows us knowledge of not only the
district where they are located but also their exact GPS location.
This data collection project resulted in a dataset of 226 WJCs from 1999 to 2014. Figure 1
shows a histogram of WJC founding dates and also illustrates the evolution of the opening of
WJCs from 1999 to 2016. Figure 2 maps the rollout of the WJCs at the national level, which
allows one to visualize the extensiveness and national scope of the program. From both figures,
we can clearly see a substantial growth in the number of centers over time, with 81% of them
being founded after the year 2005.
Data on the number of femicides at the district level was obtained from the Peruvian Crime
Observatory at the Ministry of Public Affairs, and it covers the period 2009–2015. In Peru,
femicides are classified in two categories: (1) intimate femicide, when the homicide is committed
by the woman’s partner, ex-partner, or other family member, and (2) non-intimate femicide,
when the homicide is committed by a stranger, neighbor, friend, or in the case of sex workers,
a client (INEI, 2017). This data is recorded by each district attorney office in the country.
Unfortunately, this data is only available at the district level and is not geocoded. In this
analysis, we only consider cases of intimate femicide in order to maintain consistency with the
DHS data. This captures the majority of cases: Of the 852 femicides in Peru from 2009 to 2015,
762 (90%) were intimate and 90 (10%) were non intimate (see Figure A-3).
We complement this information with data on female deaths due to aggression and female
hospitalizations for mental health problems, which were obtained from the Peruvian Ministry
of Health – National Institute of Statistics and Informatics (INEI). This database contains the
number of registered cases of hospitalizations by type of illness, age, and gender. For the purpose
of this analysis, we use female hospitalizations for mental health problems. It also records the
number of hospitalizations that resulted in deaths for different types of causes. The main cause
of female mortality that is relevant to this analysis is death due to aggression. This information
is recorded by health facilities such as hospitals and is only available at the district level. The
number of registered cases in health facilities includes women between the ages of 18 and 59 and
covers the period 2006 to 2015. Figure A-3 shows the number of female deaths due to aggression
and female hospitalizations for mental health problems over time in Peru.
Finally, we use information on complaints of crimes registered in the Police Reporting System
of the National Police of Peru (Sistema Informático de Denuncias Policiales, SIDPOL) and the
National Registry of Complaints of Crimes and Misdemeanors of the INEI (Registro Nacional de
12Delitos en las Dependencias Policiales). This database contains the number of crimes according
to type of crime and place of registration for the period 2011–2017, and this data is available at
the district level.25
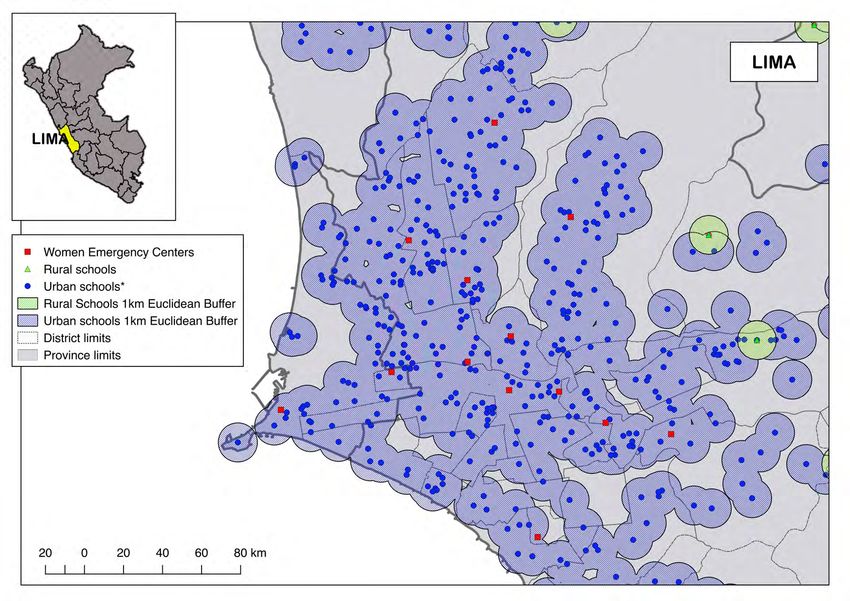
3.4 Measuring Exposure to WJCs
In order to be able to match the data on WJCs with the outcomes of interest, we construct two
measures of exposure to the program: (i) WJC within a 1-kilometer Euclidean buffer of the DHS
cluster of households/school and (ii) WJC in the district of the DHS cluster of households/school.
The first measure uses the GPS coordinates of the DHS clusters/schools to measure a 1-
kilometer Euclidean distance buffer from every DHS cluster/school location. For this method,
the Euclidean buffer of one kilometer is first centered on each DHS cluster/school, then each
DHS cluster/school is linked to a WJC if the WJC falls within the buffer, without consideration
of district administrative borders. For instance, a DHS cluster/school located within one kilo-
meter of a WJC founded in 2008 is coded as having a WJC within one kilometer of the DHS
cluster/school since 2008. Figure 3 shows a visual representation of the Euclidean buffers for
two specific regions in Peru: Lima and Tumbes.
The second measure matches the presence of a WJC in the district, based on its date of
opening and location, with the DHS cluster/school’s district. For instance, a DHS cluster/school
in the district of Lima with a WJC introduced in 2006 is coded as having a WJC in the district
of Lima since the year 2006.
The Euclidean buffer is our preferred measure, since we want to estimate the impact of
having a WJC in the neighborhood of the school/household. Therefore, for geocoded outcomes
we measure exposure based on how far the centers are from respective households, such that
individuals residing at different points in the same district may have different levels of exposure
to the WJCs. Panel A of Tables A-1 and A-2 and Panel B of Table A-3 show descriptive statistics
of exposure to the WJCs at the individual (women and children) and school level. The main
reason for our choice of a one-kilometer distance buffer instead of a larger one is that once it
increases the radius is similar to district level. For example, the measure of exposure using a
five-kilometer Euclidean buffer looks very similar to the measure of the presence of a WJC in
the district. We present the results using both measures of exposure to a WJC for our main
outcomes of interest.
25
Typology of crimes according to the Penal Code. For more detail see the Penal Code (Legislative Decree No.
635), Title II. http://spij.minjus.gob.pe/content/publicaciones_oficiales/img/CODIGOPENAL.pdf
134 Empirical Strategy
4.1 Placement of WJCs
A central methodological issue in our analysis is the fact that WJCs are not placed randomly
across the country. Although our analysis will take advantage of variation over time, which will
account for any fixed differences across districts and schools, it remains important to understand
what drives placement, since this type of decision may not be orthogonal to other factors that
could affect women and children’s outcomes of interest.
We address this concern in a number of ways that lead us to believe that the link between the
opening of the WJCs and the outcomes of interest is causal. First, we had several discussions
with Peruvian policymakers and WJC managers about the location choices. From the foundation
of the first WJC in 1999 to the end of 2005, the primary criteria they cited when deciding
where to locate were population density and level of infrastructure at the regional level. In this
stage, they prioritized capitals and large cities for WJC placement. Starting in 2006, after the
decentralization process that transferred the responsibility of the WJCs to local governments
(districts), Peruvian policymakers decided to open new WJCs at the district level. To do so,
they incorporated additional criteria such as proximity to police stations, district attorney offices
(known as fiscalias), and health establishments.
Even though program guidelines suggested that priority should be given to poorer districts
with sufficient judicial and medical infrastructures to support a WJC, on several occasions
political representatives had a certain autonomy in deciding the order in which districts received
the program. There is also anecdotical evidence from the authorities that the placement of
WJCs was primarily developed by taking population density into account, without considering
the incidence of violence against women. This is likely due to a lack of reliable data on domestic
violence or femicides for all the districts in Peru prior to the opening of the centers. Official data
on femicides in Peru started to be recorded only after 2009, and several ministerial reports have
documented the fact that WJCs failed to consider the rate of incidence of violence against women
in program placement.26 Moreover, our conversations with Peruvian policymakers suggest that
educational considerations, particularly enrollment rates and school performance, were never
factored into program placement decisions.
A second way to address the concern about the non-random placement of WJCs is that
we are able to evaluate this endogenous placement statistically using our data. To do this we
estimate, at the district level, (a) the determinants of having a WJC by the end of the sample
in 2014 and (b) the determinants of adding a WJC during 2006–2014, the period when the
program grew substantially. We focus on several variables at the district level cited by Peruvian
26
See, for instance, Ombudsman Office, Informe Defensorial N 144. Centros de Emergencia Mujer: Supervisión
de los servicios especializados en la atención de vı́ctimas de violencia familiar y sexual, July 2009, Ministerio de
la Mujer y Desarrollo Social, Investigacion operativa: “Eficacia de la intervencion de los Centros Emergencia
Mujer”, August 2009.
14policymakers, including the number of justice courts, district attorney offices, police stations,
and health establishments. We also control for district population at baseline and department
fixed effects. Moreover, in order to verify that education patterns before the program began do
not predict where the WJCs are introduced, we also control for pre-program changes in primary
and secondary school enrollment at the district level. Unfortunately, we are unable to perform
the same test for femicides, due to a lack of pre-program data on these variables for all the
districts in Peru. We do, however, control for baseline (self-reported) domestic violence at the
district level by using the 2000 Peruvian DHS, which contains a representative sample of 700
districts in Peru. Moreover, in the next section we perform an event study for all the variables
of interest exploiting variation in the years when data is available.
The results from these regressions are shown in Table 1. In general, the results corroborate
the evidence we collected from our conversations with Peruvian policymakers and WJC man-
agers. In general, districts that contain more police stations, district attorney offices, and health
establishments and are more densely populated are more likely to have WJCs by 2014 and more
likely to add them during the 2006–2014 period. However, none of the coefficients except pop-
ulation are statistically significant. Clearly, urban areas with more infrastructure development
are more likely to have these specialized centers for women. In addition, pre-program changes
in districts’ primary and secondary school enrollment do not seem to have any impact. Neither
coefficient is statistically significant, and both are very small. Similarly, domestic violence does
not appear to have any impact on WJC placement. These findings suggest that WJC placement
between 2006–2014 does not seem to have been based either on pre-program changes in schooling
or on baseline levels of domestic violence.
Finally, we note two additional concerns that might threaten the validity of our research
design. First, one might be worried that another shift (e.g., a government program or policy
change) might have been rolled out during the same period and in the same places as the
WJCs that might also have an impact on education outcomes. An obvious candidate is the
CCT program Juntos, which was launched in September 2005, just as WJCs started to be
implemented more intensively.27 Juntos integrates two broad objectives. In the short run, it
aims to reduce poverty by providing households with cash transfers. In the long run, it aims
to break the intergenerational transmission of poverty by promoting human capital through
improving access to education and health services.
In spite of this, several reasons lead us to believe that Juntos is not a confounding factor in
our empirical strategy. Districts were selected for program participation based on an index that
includes poverty rate and the percentage of villages affected by violence during the 1980-2000
civil conflict. The aim of Juntos was to reach some of the most vulnerable and marginalized
segments of the population; it focused particularly on rural areas with high poverty rates and
27
See Figure A-4 on the presence of both programs at the district level and Figure A-5 on the timing of CCT
Juntos and the implementation of the WJC program. Two large expansions of the CCT Juntos program took
place, first in 2007 and then in 2012.
15limited access to state services.28 By 2014, about 1,142 districts have CCTs and 225 districts
have WJCs. However, more than half of the districts with WJCs (123 districts) are not covered
by the CCT Juntos program. This evidence clearly suggests that while WJCs were more likely to
be implemented in urban areas, the CCT program was more likely to cover dispersed populations
in the poorest rural areas. We test this assumption more directly by analyzing whether WJC
placement at the district level was correlated with the CCT Juntos implementation. Columns
2 and 4 in Table 1 indicate that the placement of WJCs was not determined by the rollout of
the CCT Juntos program.29
The second concern related to WJC placement is that if we estimate the impact of WJCs on
all areas, our results might include rural areas that do not qualify for a WJC in the first place, due
to low population or a lack of infrastructure, and thus may not provide an accurate comparison
for those areas that get a WJC. Given this, we will focus our analysis on a specification in which
we limit the sample to urban areas (urban schools and households), which are the ones more
likely to receive a WJC placement. As a further robustness check, we will also limit our samples
to districts in which a WJC was opened during the sample period.
4.2 Individual-Level Specification
We use a difference-in-difference empirical strategy to estimate the impact of WJCs on women
and children’s outcomes. We exploit the variation created by the differential timing in the
opening of WJCs and also the spatial variation in the exposure of a woman/child to a WJC.
In order to estimate the impact of WJCs on women and children’s outcomes, the following
specification is used:
0
yidt = γ0 + γ1 W JC idt + αd + λpt + δXidt + εit (1)
where (yidt ) represents the outcome of interest of woman i (or the child of woman i) at year t
who resides in district d, (W JCidt ) is an indicator variable that takes the value of one if there
is a WJC within one kilometer of the woman/child’s household or in the district of residence of
woman/child i in year t, (αd ) is a district fixed-effect, (λpt ) is a province-by-year fixed effect,
0
(Xidt ) is a vector of individual-level characteristics for woman/child i depending on the sample
28
Juntos targets the population living in poverty and extreme poverty: households with children under 14,
pregnant women, widowed parents, and/or older adults. It is particularly focused on getting children out of
poverty and improving their education, health, and nutrition. The program is also seen explicitly as a way to
tackle the special vulnerability of populations who were most affected by the political violence prevalent in Peru
between 1980 and 2000. Most of the victims of this conflict were poor populations living in rural areas and
Quechua speakers.
29
We also construct a panel database at the district level on WJC and CCT Juntos placement from 2005 to
2014, which allows us to better analyze whether program implementations where correlated over space and time.
By using a fixed-effects model, we can control for any time-invariant locality factors at the district level and also
year dummies. The results in Table A-4 corroborate the idea that the CCT Juntos is not a confounding factor in
our research design.
16You can also read