Long-Term Embrittlement of Ancient Copper and Silver Alloys
←
→
Page content transcription
If your browser does not render page correctly, please read the page content below
heritage

Review
Long-Term Embrittlement of Ancient Copper and Silver Alloys
Omid Oudbashi 1, *               and Russell Wanhill 2, *

                                          1   Department of Conservation of Cultural and Historical Properties, Art University of Isfahan, P.O. Box 1744,
                                              Isfahan 8146834615, Iran
                                          2   Aerospace Vehicles Division, Royal Netherlands Aerospace Centre, P.O. Box 153,
                                              8300 AD Emmeloord, The Netherlands
                                          *   Correspondence: o.oudbashi@aui.ac.ir (O.O.); rjhwanhill@gmail.com (R.W.)

                                          Abstract: The manifestations of ancient metals’ embrittlement, cracking and fracture, are challenging
                                          problems for restorers and conservators, yet the scientific understanding of these problems is limited.
                                          In particular, the study and interpretation of fracture surfaces, fractography, is a minor or non-
                                          existent consideration for most archaeometallurgical investigations. This paper presents a survey
                                          of fractographic analyses, in combination with the more widely used disciplines of microstructural
                                          studies, metallography, and chemical analyses for some Old-World copper alloy (bronzes) and high-
                                          silver alloy artifacts that have undergone long-term corrosion and embrittlement damage. We show
                                          that fractography, as an adjunct to metallography, can improve the interpretation of these types of
                                          damage and assist in selecting the best methods for restoration and conservation of the objects made
                                          from these alloys.

                                          Keywords: copper alloys; high-silver alloys; corrosion; embrittlement; fracture surfaces; fractography;
                                          metallography; chemical analysis; restoration; conservation


Citation: Oudbashi, O.; Wanhill, R.
                                          1. Introduction
Long-Term Embrittlement of Ancient
Copper and Silver Alloys. Heritage              This paper surveys damage, particularly cracking, caused by long-term corrosion-
2021, 4, 2287–2319. https://doi.org/      induced embrittlement of ancient copper and silver alloys, as well as long-term, microstruc-
10.3390/heritage4030130                   turally induced embrittlement of silver alloys. The emphasis is on fractography, the analysis
                                          and interpretation of fracture surfaces, which is, or should be, an important adjunct to
Academic Editor: Chiara Soffritti         microstructural metallographic studies and chemical analyses. The occurrence of crack-
                                          ing and fracture are obviously important for restoration and conservation, yet detailed
Received: 12 August 2021                  knowledge of the causes and significance of such damage has rarely been obtained. For
Accepted: 7 September 2021                example, there are (i) excellent books and symposium proceedings with metallographic
Published: 10 September 2021              and chemical analyses for ancient and historic metals, but no fractography [1–5]; and
                                          (ii) authoritative publications on research frameworks and guidelines for best practice
Publisher’s Note: MDPI stays neutral      that do not mention fractography [6,7]. This situation is partly because metallography
with regard to jurisdictional claims in   has proven to be a powerful diagnostic technique for ancient objects (artifacts and coins);
published maps and institutional affil-
                                          partly because of a general unfamiliarity with fractography; and also because it is difficult
iations.
                                          to obtain suitable samples that can be broken open to reveal cracking and fracture details.
                                          These details would otherwise (except for high-karat gold and platinum-group alloys) be
                                          obliterated by centuries and millennia of general corrosion in burial environments.
                                                We have been able to provide several examples (case studies) to improve the appre-
Copyright: © 2021 by the authors.         ciation of fractography as a diagnostic technique, as well as the detailed significance of
Licensee MDPI, Basel, Switzerland.        cracking and fracture. With the aid of these examples, and taking relevant ethical consider-
This article is an open access article    ations into account, the latter part of this paper discusses the actual and potential remedial
distributed under the terms and
                                          measures for the restoration and conservation of corroded, cracked, and broken artifacts.
conditions of the Creative Commons
Attribution (CC BY) license (https://
creativecommons.org/licenses/by/
4.0/).

Heritage 2021, 4, 2287–2319. https://doi.org/10.3390/heritage4030130                                          https://www.mdpi.com/journal/heritage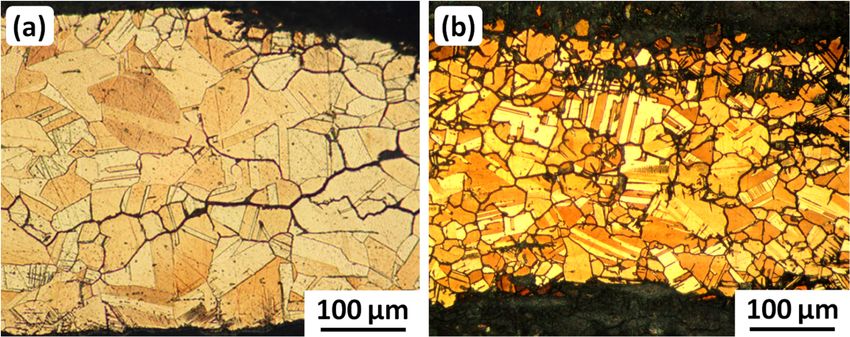
Heritage 2021, 4                                                                                                2288

                   2. Corrosion and Embrittlement of Old World Copper Alloy Objects
                   2.1. Production and Processing
                        Native copper was the first material used to produce artifacts in prehistory. Evidence
                   of native copper use is observed in early metallurgy around the ancient world [8]. Some-
                   what later, pyrometallurgy was developed to extract copper from oxidic ores. Copper
                   compounds such as malachite (CuCO3 ·Cu(OH)2 ) were smelted in crucibles inside prim-
                   itive furnaces, and the extracted metallic copper was used to produce small objects by
                   using manufacturing processes such as casting in simple open molds, hammering, or a
                   mixture of both [9]. Further developments enabled the smelting of sulfidic copper ores, a
                   more complicated process, to obtain copper [9,10]. This led to greater amounts of copper
                   to produce larger objects. Contemporaneously developed manufacturing and shaping
                   techniques allowed the metalworkers to make bigger and more complex objects, including
                   large sculptures with complex forms, larger and more functional weapons and tools, as well
                   as decorative artifacts. There is clear evidence that these process developments occurred
                   during the Neolithic and Chalcolithic periods (ca. 7000–3000 BC) in the Old World, i.e., the
                   Near East and Europe [10,11].
                        The first attempts to improve the physical/mechanical properties of copper were to
                   add other metallic elements to produce early alloys. According to the literature, arsenical
                   copper (Cu-As alloy) was the first copper alloy to appear in ancient times, although early
                   examples are considered to be accidental alloys caused by smelting As-bearing copper ores.
                   Nevertheless, the later arsenical copper objects were made by intentional alloying processes
                   such as direct smelting of polymetallic Cu-As-bearing ores or adding speiss (a mixture of
                   impure metallic arsenides) to copper [12–14].
                        Another, and the most important, copper alloy was (and is) tin bronze (Cu-Sn). Early
                   evidence of tin bronze objects has been found at the beginning of the so-called Bronze
                   Age (ca. 3000 BC) [15]. Tin bronze was produced by different alloying processes such as
                   co-smelting, cementation, adding metallic tin to metallic copper, or smelting of tin-bearing
                   copper ores [16,17]. These ancient alloys are classified as low-tin (15 wt.%) bronzes, corresponding to single-phase or multiple-phase microstructures,
                   although the formation of other phases is observed in low-tin bronzes owing to non-
                   equilibrium solidification [10].
                        Copper alloys metallurgy was further developed by adding other elements, notably
                   zinc to produce brasses. The high solubility of zinc in copper allows the production of a
                   single-phase Cu-Zn alloy with a wide variation in zinc content [10]. Brass was made from
                   about 2000 years ago by ancient civilizations such as the Roman Empire [18].

                   2.2. General Corrosion
                        Ancient and historic copper alloy artifacts show diverse and complicated corrosion
                   behavior in different environments. Many factors affect the rate, mechanisms, and mor-
                   phology of corrosion in copper alloys, including the chemico-physical conditions of the
                   environment(s), the alloy compositions, and the manufacturing processes [19–21]. Never-
                   theless, the long-term placement environments (soil, seawater, or outdoor exposure) play
                   dominant roles.
                        Corrosion of buried copper alloys in soil environments is a complex process leading to
                   the formation of various and variable morphologies with different corrosion products. The
                   artifacts may be covered by a more or less thick layer consisting of corrosion/oxidation
                   products, or they may be corroded completely into a multi-layered bulk material without
                   any remaining metal [21,22]. In alkaline soils, a thin layer of cuprite (Cu2 O) may be
                   formed over the metal, on top of which there may be a significant layer of malachite
                   (Cu2 CO3 (OH)2 ). Malachite (or basic copper carbonate) is formed by the reaction between
                   copper/copper oxides and carbonate/bicarbonate anions dissolved in soil water, leading to
                   the formation of a green patina [21,23]. Other possibilities are (i) azurite (Cu3 (CO3 )2 (OH)2 ),
                   an isomer of malachite, a rare corrosion product that has been reported for some buried
                   copper alloys [23]; and (ii) the presence of chloride ions in the soil may lead to the formation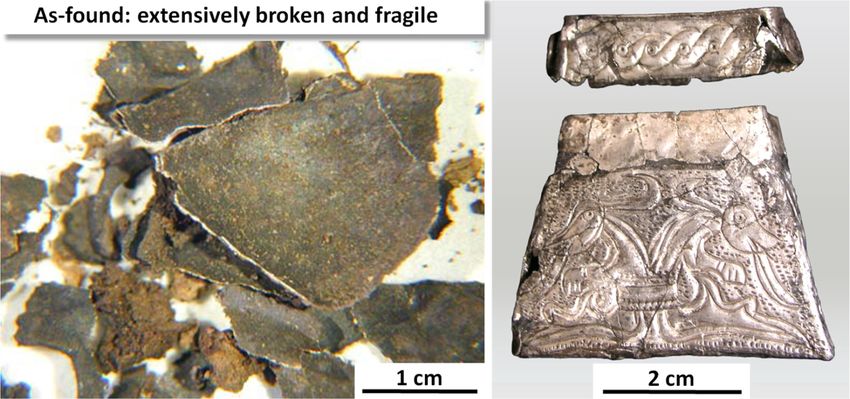
Heritage 2021, 4                                                                                            2289

                   of nantokite (CuCl), which forms the copper trihydroxychlorides atacamite or paratacamite
                   (Cu2 (OH)3 Cl) in the presence of moisture and oxygen. This latter corrosion process is
                   called “Bronze Disease”. It is a cyclic reaction caused by transformation of nantokite to
                   trihydroxychlorides and continues until all the copper is transformed into copper corrosion
                   products [21,22,24].
                        Corrosion of copper alloys in (deep) seawater tends to be more anaerobic owing to the
                   lower oxygen concentration at depths below about 10 m. The corrosion is also influenced
                   by an interplay between the toxicity of the copper corrosion products and growth of
                   microorganisms on the metal surface [21,25]. Various corrosion products form, including
                   oxygen-bearing copper oxides and trihydroxychlorides as well as sulfides. The formation
                   of these compounds strongly depends on the oxygen content of the seawater: At shallow
                   depths (aerobic), the first group of corrosion products forms; in deeper water (anaerobic),
                   the second group is the main corrosion products. The copper sulfides are due to the activity
                   of sulfate-reducing bacteria (SRB) [21,26,27].
                        Corrosion of copper-based artifacts exposed to the outdoor environment depends on
                   the types and concentrations of atmospheric pollutants. In today’s world, the corrosion
                   products are different for urban, rural, and seaside environments [21]. In urban environ-
                   ments, basic copper sulfates such as brochantite, antlerite, and posnjakite are commonplace
                   corrosion products, together with cuprite; while in rural regions, copper oxides and car-
                   bonates are the main corrosion products [28]. Copper trihydroxychlorides are observed
                   on some corroded copper-based statues located near the sea [21,28]. These variations
                   show that the main factors determining the corrosion of copper-based objects in outdoor
                   environments are the presence and concentration of gaseous and particulate pollutants
                   such as SOX , NOX , CO2 , dust, and salt spray from the sea [21]. N.B.: This summary is not
                   necessarily, or even at all, applicable to ancient urban environments, which would be largely
                   or entirely free of today’s industrial pollutants.

                   2.3. Alloying Element Influences on Corrosion
                        As noted in Section 2.2, copper alloy corrosion varies in different environments. Unal-
                   loyed copper corrodes via oxidation, dissolution, and re-deposition of copper ions, leading
                   to the formation of a cuprite patina and copper II corrosion products: Atacamite and
                   paratacamite (Cu2 Cl(OH)3 ), brochantite (Cu4 SO4 (OH)6 ), posnjakite (Cu4 SO4 (OH)6 ·H2 0),
                   malachite (Cu2 CO3 (OH)2 ), and gerhardite (Cu2 NO3 (OH)3 ) [21]. The types and composi-
                   tions of Cu II products strongly depend on the environment [20,22]. Copper alloys, e.g.,
                   Cu-As, Cu-Zn, and Cu-Sn alloys, exhibit more complex and interesting corrosion features
                   due to different reactions of the constituent metallic elements with the environments.

                   2.3.1. Arsenical Copper Alloys (Cu-As)
                        The corrosion of arsenical copper (arsenical bronze) objects has not been investigated
                   sufficiently in detail to obtain definitive conclusions about the mechanisms of corrosion
                   and morphologies of the corrosion products. However, the presence of arsenic as an
                   alloying element may lead to some resistance against corrosion during long-term burial,
                   and also decrease the corrosion rate [21]. It is worth noting that a specific corrosion
                   morphology due to arsenic has not been reported. N.B.: A silvery appearance is observed
                   in some ancient Cu-As objects, and this has been attributed to different causes: Inverse
                   segregation, cementation, or corrosion (probably artificially initiated corrosion) [29–31].
                   This phenomenon is not well understood and is under investigation.

                   2.3.2. Brass Alloys (Cu-Zn)
                        The most well-known corrosion process in brasses is dezincification [32,33]. This
                   occurs due to selective dissolution (leaching) of zinc during corrosion, whereby zinc is lost
                   and copper is left behind, leading to the formation of a copper-rich surface [34]. This is a
                   type of de-alloying due to the loss of the more reactive component (zinc) from the alloy [35].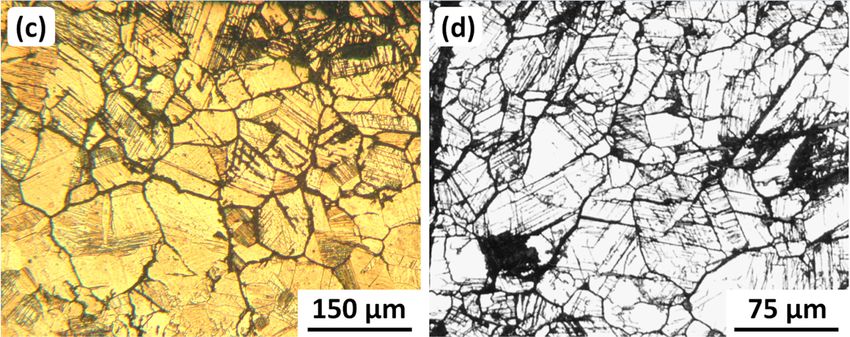
Heritage 2021, 4                                                                                             2290

                   The main corrosion products from Cu-Zn alloys are similar to those for unalloyed copper
                   objects, although some evidence of zinc corrosion products may be observed [36,37].

                   2.3.3. Bronze Alloys (Cu-Sn)
                         The presence of tin in bronze objects results in some interesting features of their
                   corrosion mechanisms and corrosion product morphologies. In fact, the main difference
                   between the corrosion morphologies of other copper alloys and tin bronzes is due to the
                   behavior of tin during corrosion [21]. The main corrosion mechanism in ancient bronzes
                   (in all natural environments) is selective dissolution of copper and internal oxidation of
                   tin [38–40]. This process is also generally independent of the manufacturing techniques of
                   objects, although some variations are visible on a microscopic scale, namely whether the
                   microstructure is dendritic (castings) or worked and annealed [38,39,41].
                         The metallographic literature enables the identification of two main corrosion mor-
                   phologies for archaeological tin bronze objects [38,42,43]. The first, type I corrosion, is a
                   two-layered corrosion structure consisting of:
                   •    An external layer with variable thickness on the same object and on different ob-
                        jects. This layer consists of powdery minerals that include basic copper carbonates,
                        malachite, and azurite, together with some soil minerals or contamination materials.
                   •    An internal layer below the original surface. This layer is tin-rich relative to the bulk
                        metal, compact, and green/blue/grey in color, and may retain evidence of the original
                        alloy’s microstructure and inclusions (secondary phase particles).
                        This corrosion morphology occurs in tin bronze objects exposed to non-corrosive or
                   moderately corrosive environments such as low-chloride burial soil, freshwater, or rural
                   atmospheric environments [39,41,44,45].
                        The second corrosion morphology, type II, is observed on objects buried in or exposed
                   to chloride-contaminated environments for long periods [38,46]. This is a three-layered
                   corrosion structure consisting of:
                   •    An external layer with variable thickness on the same object and on different objects.
                        This layer consists of powdery minerals that include basic copper chlorides.
                   •    A thick red layer of copper oxide that contains the original surface, although this is
                        not visibly detectable.
                   •    An internal corrosion layer below the original surface that is tin-rich relative to the
                        bulk metal. In some cases, all of the bulk metal has been transformed to corrosion
                        products.
                        The formation of internal tin-rich corrosion layers for both corrosion types is due to
                   selective dissolution of copper during long-term burial or exposure in corrosive environ-
                   ments, and internal oxidation of tin [38,47,48]. In more detail, (i) the dissolved copper
                   ions migrate to the external surface and react with available anions to form different cop-
                   per II corrosion products [38,40]; and (ii) oxidation of the tin-rich internal layer retains
                   ‘ghost structure’ remnants of the original tin bronze microstructure [38–40,46]. The ‘ghost
                   structure’ is more visible in type I corrosion layers owing to a very low rate of corrosion.
                   However, ‘ghost structures’ have been observed in type II corrosion layers [38]. Another
                   difference between type I and type II corrosion is the corrosion crust thicknesses. In type I
                   corrosion, the crust thickness is thin, rarely more than 100 µm. However, type II corrosion
                   is generally much thicker and can even consume the entire object [46], as mentioned above.
                        Another interesting aspect of tin bronze corrosion is the formation of a very thin layer
                   of corrosion along the metal-corrosion interfaces for both types of corrosion. This layer re-
                   sembles localized intergranular or transgranular corrosion (see Section 2.3.2) but its color is
                   mostly red. This thin red layer represents the early stages of corrosion/oxidation of copper
                   caused by a corrosive solution penetrating into the metal. If this becomes extensive, this
                   localized corrosion may result in cracking and embrittlement of archaeological tin bronzes,
                   especially if they retain large amounts of deformation in the microstructure [38–40].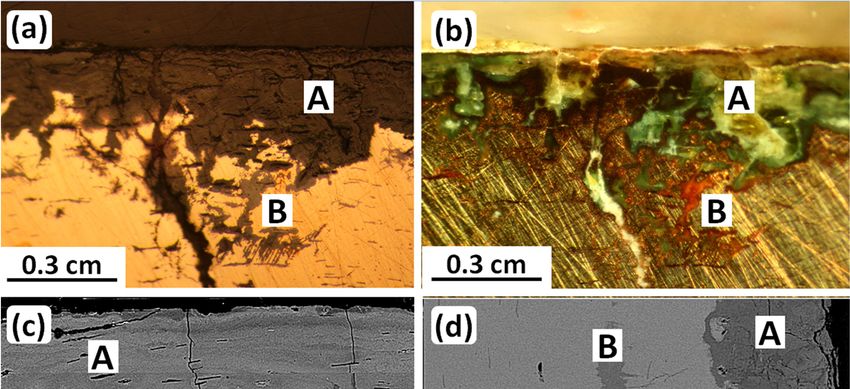
Heritage 2021, 4 FOR PEER REVIEW 5
Heritage 2021, 4 2291
tin bronzes, especially if they retain large amounts of deformation in the microstructure
[38–40].
2.4.
2.4. General
General Corrosion
Corrosion
Some
Some examples of
examples of general
general corrosion
corrosion of
of archaeological
archaeological copper
copper alloys
alloys will
will be
be discussed
discussed
in the following subsections.
in the following subsections.
2.4.1. Tin
2.4.1. Tin Bronze
Bronze Luristan Coffin, 6th–10th Centuries BC
The coffin,
The coffin, with
with contents,
contents, isis shown
shown in Figure 1. It It was
was discovered
discovered in in Western Iran
(Luristan), had broken into
(Luristan), into large
large pieces,
pieces,and
andwas
wascovered
coveredwithwithaathick
thicklayer
layerofofgreen
greencorro-
cor-
sion products
rosion products mixed
mixedwith soil.
with Inductively
soil. Inductivelycoupled
coupledplasma–mass
plasma‒mass spectroscopy
spectroscopy(ICP-MS)
(ICP-
analysis
MS) determined
analysis determinedthat the
thatalloy composition
the alloy is 90.32
composition wt.%wt.%
is 90.32 Cu, 8.23
Cu,wt.% Sn, 0.39
8.23 wt.% Sn,wt.%
0.39
Pb, 0.30
wt.% Pb,wt.% P, 0.24P,wt.%
0.30 wt.% 0.24 As,
wt.%and As,0.13
andwt.%
0.13 Fe.
wt.%Metallography showed
Fe. Metallography that the
showed coffin
that the
has a worked and annealed grain microstructure in which remnants
coffin has a worked and annealed grain microstructure in which remnants of coring (leftof coring (left over
from from
over initialinitial
casting) were visible
casting) as parallel
were visible bands in
as parallel etched
bands samples.
in etched These details
samples. These demon-
details
strated that the working and annealing process was insufficient
demonstrated that the working and annealing process was insufficient to remove to remove all of the initial
all of
coring
the [49].
initial coring [49].
Figure
Figure 1.
1. Bronze
Bronze coffin
coffin from
from Luristan,
Luristan, Iran.
Iran. Original
Original images
images with
with permission:
permission: Falak-ol-Aflak
Falak-ol-Aflak Museum,
Museum, Khorramabad.
Khorramabad.
The
The corrosion
corrosion occurring
occurring during
during burial
burial was
was studied
studied by by scanning
scanning electron
electron microscopy
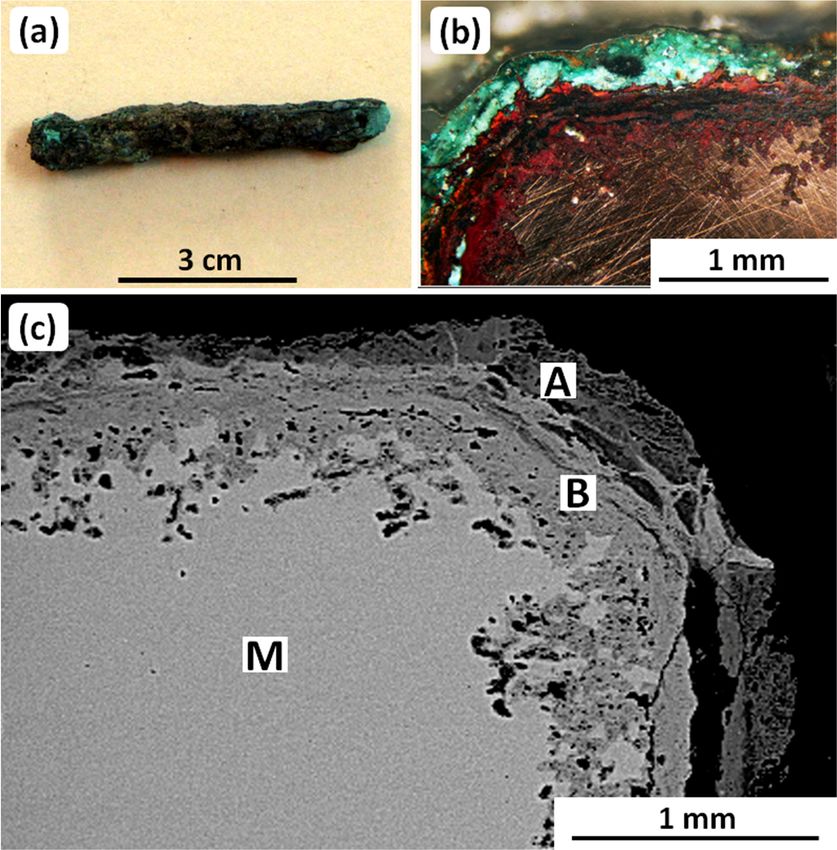
with energy dispersive analysis of X-rays (SEM-EDS). Figure 2 shows SEM backscattered
electron (BSE)
electron (BSE) metallographic
metallographic cross-sections.
cross-sections. These
These havehave aa two-layered
two-layered morphology
morphology con-con-
sisting of
sisting of an
an external
external layer
layer (A)
(A) and
and internal
internal layer
layer (B), with some remnants of a metallic
structure (M), as
structure as seen
seen inin Figure
Figure 2a.
2a. Furthermore,
Furthermore, significant
significant intergranular
intergranular corrosion
corrosion attack
attack
is visible
is visible inin the
the metallic
metallic structure at the higher magnification, as shown in Figure 2b.
EDS analyses
EDS analyses ofof these
these layers
layers are
are presented
presented in Table 1. The metallic structure (M) has
a composition typical
a composition typical of tin of tin bronze, as was shown by the ICP-MS analysis. Note that the
internal corrosion
internal corrosion layer (B) shows a higher Sn/Cu proportionthan
Sn/Cu proportion than the
the metallic
metallic structure,
structure,
i.e., the
i.e., theinternal
internallayer
layerhashasbeen
beenenriched
enriched in in
tin.tin.
OnOn the the other
other hand,
hand, the external
the external layerlayer
(A),
(A), formed
formed over over the original
the original surface,
surface, has alow
has a very very tinlow tin concentration
concentration compared compared
to the Mtoand
the
M and B
B locations. locations.
The morphology and chemistry of the corrosion layers suggest, on the whole, that the
coffin represents type I corrosion. However, while the internal corrosion layer is composed
of Cu, Sn, and O, consistent with type I corrosion, the external corrosion layer is composed
of Cu, O, and Cl, which is more relatable to type II corrosion. A high concentration of Cl in
the external corrosion layer, besides Cu and O, can be attributed to basic copper chlorides
(copper trihydroxychlorides) such as atacamite and paratacamite [50]. These have formed
a pale green patina on the coffin surface.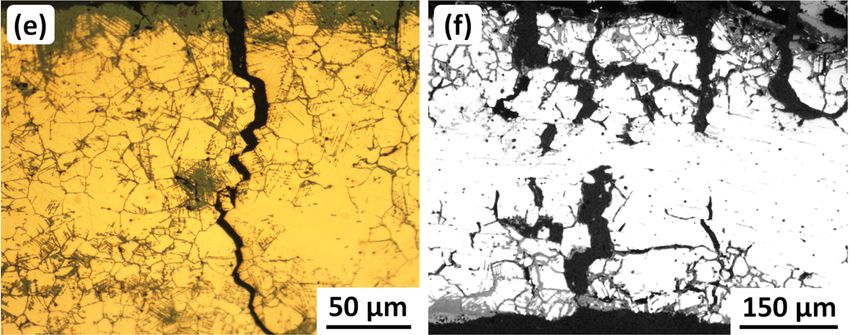
Table 1. EDS results from a metallographic sample of the Luristan Coffin, wt.%.
Cu Zn As Sn Pb O Al Cl S Zn
Heritage 2021, 4
M 90.66 0.90 2.68 5.74 0.01 − − − − 0.90
2292
A 63.05 − − 0.69 − 16.46 0.54 19.25 − −
B 67.96 − − 15.09 0.59 16.19 − 0.08 0.09 −
Figure
Figure 2.
2. SEM-BSE
SEM-BSE micrographs
micrographs ofof sample
sample cross-sections
cross-sections from
from the
the Luristan
Luristan coffin.
coffin. (a)
(a) shows
shows two
two corrosion
corrosion layers:
layers: External
External
(A)
(A) and internal (B); and also the remains of the original metal. (b) shows significant intergranular attack inin
and internal (B); and also the remains of the original metal. (b) shows significant intergranular attack thethe remains
remains of
of the metal. Original images: Omid Oudbashi.
the metal. Original images: Omid Oudbashi.
The morphology and chemistry of the corrosion layers suggest, on the whole, that
Table 1. EDS results from a metallographic sample of the Luristan Coffin, wt.%.
the coffin represents type I corrosion. However, while the internal corrosion layer is com-
posed of Cu, CuSn, and Zn O, consistent
As with type
Sn Pb I corrosion,
O the
Al external
Cl corrosionS layer
Zn is
composed
M
of Cu,
90.66
O, and
0.90
Cl,2.68
which is
5.74
more relatable
0.01 -
to type II
-
corrosion.
-
A high
-
concen-
0.90
tration
A of Cl in the external
63.05 - corrosion
- 0.69layer, besides
- Cu and0.54
16.46 O, can19.25
be attributed- to basic
-
copper
B chlorides
67.96 (copper
- trihydroxychlorides)
- 15.09 0.59 such as atacamite
16.19 - and
0.08 paratacamite
0.09 [50].
-
These have formed a pale green patina on the coffin surface.
As mentioned earlier, according to the literature, type I corrosion occurs in tin
As mentioned earlier, according to the literature, type I corrosion occurs in tin bronzes
bronzes buried in non-corrosive or moderately corrosive environments. These have very
buried in non-corrosive or moderately corrosive environments. These have very low
low soluble Cl contents that allow the formation of basic copper carbonates (e.g., mala-
soluble Cl contents that allow the formation of basic copper carbonates (e.g., malachite)
chite)
on theon the external
external surfacessurfaces
[38,40]. [38,40].
Clearly,Clearly, the morphology
the morphology and chemistry
and chemistry of theofcorrosion
the cor-
rosion
layers layers
on the on the cannot
coffin coffin cannot
be simplybe simply explained
explained as dueastodue
typetoItype I orIItype
or type II corrosion.
corrosion.
To resolve this issue, it is suggested that the coffin has undergone
To resolve this issue, it is suggested that the coffin has undergone type I corrosiontype I corrosion
that
that transitioned to an early stage of type II corrosion in which “Bronze
transitioned to an early stage of type II corrosion in which “Bronze disease” (discussed disease” (dis-
in
cussed
Sectionin Section
2.2) 2.2) occurring.
has been has been occurring.
2.4.2.
2.4.2. Copper
CopperObject
Object (Rod)
(Rod) from
from Southwestern
Southwestern Iran,
Iran, ca.
ca. 14th
14th Century
Century BC
BC
Figure 3a shows a
Figure 3a shows a small small rod excavated from Haft Tappeh, Southwestern Iran. The
rod
rod was
was disinterred
disinterred from
from aa Cl-rich
Cl-rich corrosive
corrosive soil in
in which
which all
all buried
buried copper-based
copper-based objects
had
had suffered
suffered bronze
bronze disease
disease [24]: Most
Most had
had been
been transformed
transformed completely
completely to corrosion
products
products[51].[51].Nevertheless,
Nevertheless, a few objects,
a few including
objects, the rod,
including the retained some metallic
rod, retained struc-
some metallic
ture. This isThis
structure. illustrated in Figure
is illustrated 3b,c, which
in Figure shows shows
3b,c, which an optical metallographic
an optical cross-section
metallographic cross-
and an SEM
section and anmetallograph used forused
SEM metallograph EDSfor
analysis.
EDS analysis.
Table 2. EDS analyses from the cross-section of the copper rod, wt.%.
Cu Sn O Cl Mg Si Al Ca K
M 99.77 0.23 - - - - - - -
A 54.59 - 30.77 9.26 0.56 4.02 0.34 0.38 0.09
B 85.78 - 13.66 0.56 - - - - -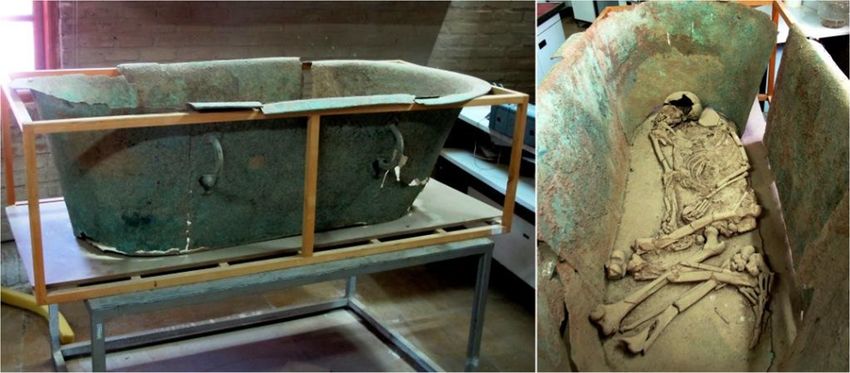
The EDS analyses are given in Table 2. The analysis of the metallic matrix, M, shows
                                  that the rod was made of 99.77 wt.% Cu and 0.23 wt.% Sn, i.e., unalloyed copper. Further-
                                  more, EDS analyses of the internal and external corrosion layers (B and C, respectively)
Heritage 2021, 4                  show that the internal corrosion layer is formed by copper oxides, while the external cor-
                                                                                                                          2293
                                  rosion layer mainly consists of basic copper chlorides. These corrosion products are typi-
                                  cal for the bronze objects excavated from the site [46,51].

      Figure
      Figure 3.
             3. (a)
                (a) The
                    The copper-based
                         copper-based rod
                                        rod from
                                            from Haft
                                                  Haft Tappeh,   southwestern Iran,
                                                       Tappeh, southwestern   Iran, (b) metallographic image
                                                                                    (b) metallographic  image of
                                                                                                               of corrosion
                                                                                                                  corrosion layers
                                                                                                                            layers
      formed
      formed on
              on the
                  the surface
                      surface of
                              of the
                                 the rod,
                                     rod, and
                                          and (c)
                                              (c) SEM-BSE
                                                  SEM-BSE micrograph
                                                           micrograph showing
                                                                        showing EDS
                                                                                 EDS analysis
                                                                                      analysis locations
                                                                                               locations for
                                                                                                         for the
                                                                                                             the metal
                                                                                                                 metal matrix
                                                                                                                       matrix and
                                                                                                                              and
      corrosion layers; see Table 2 and the main text. Original images: Omid Oudbashi.
      corrosion layers; see Table 2 and the main text. Original images: Omid Oudbashi.

                                  TableThe
                                       2. EDS
                                           EDSanalyses from
                                                analyses    thegiven
                                                          are   cross-section
                                                                     in Tableof2.the
                                                                                  Thecopper rod, of
                                                                                       analysis  wt.%.
                                                                                                    the metallic matrix, M, shows
                                  that the rodCuwas made Snof 99.77Owt.% CuCl and 0.23Mg
                                                                                       wt.% Sn,Sii.e., unalloyed
                                                                                                          Al     copper.
                                                                                                                   Ca     Further-
                                                                                                                             K
                                  more,
                                     M   EDS   analyses
                                             99.77      of
                                                        0.23the internal
                                                                    -    and  external
                                                                              -        corrosion
                                                                                       -         - layers (B
                                                                                                           - and C, -respectively)
                                                                                                                             -
                                  show that the internal corrosion layer is formed by copper oxides, while the external
                                     A       54.59        -       30.77     9.26     0.56      4.02      0.34     0.38     0.09
                                  corrosion layer mainly consists of basic copper chlorides. These corrosion products are
                                     B       85.78        -       13.66     0.56       -         -         -        -        -
                                  typical for the bronze objects excavated from the site [46,51].
                                       Metallographic observations on the unetched cross-section of the rod showed no
                                  evidence of intergranular corrosion attack, although some pitting was visible under the
                                  internal corrosion layer. In addition, the etched cross-section showed that the rod had been
                                  shaped by forging with subsequent annealing. Finally, although the rod had been buried
                                  in very corrosive soil and therefore was attacked by “Bronze Disease”, the corrosion rate
                                  must have been very slow for so much of the metal matrix to have remained.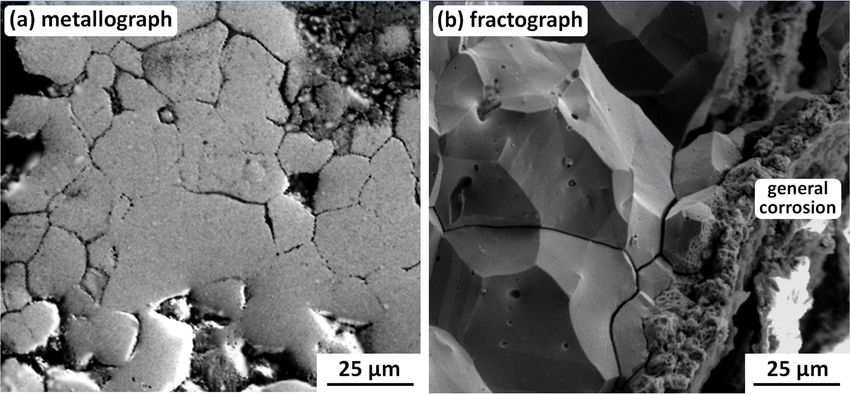
Metallographic observations on the unetched cross-section of the rod showed no ev-
idence of intergranular corrosion attack, although some pitting was visible under the in-
ternal corrosion layer. In addition, the etched cross-section showed that the rod had been
Heritage 2021, 4 shaped by forging with subsequent annealing. Finally, although the rod had been buried 2294
in very corrosive soil and therefore was attacked by “Bronze Disease”, the corrosion rate
must have been very slow for so much of the metal matrix to have remained.
2.4.3. A
2.4.3. A Bronze
Bronze Age
Age Low-Arsenic
Low-Arsenic Copper
Copper Dagger,
Dagger, 3rd Millennium BC
The dagger
The dagger was
was excavated
excavated from
from aa small
small Bronze
Bronze Age
Agesettlement
settlementin
inSouthwestern
SouthwesternIran.
Iran.
Figure 44 shows
Figure shows the
the dagger, which was corroded but intact. Chemical
Chemical analysis
analysis by
by SEM-
SEM-
EDS showed
EDS showed that
that the
the dagger
dagger is a low-arsenic
low-arsenic copper
copper alloy
alloy containing
containing 1.19
1.19 wt.% As and
1.92 wt.% Pb, as seen in Table
1.92 wt.% Pb, as seen in Table 3. 3.
Figure
Figure 4.
4. The
The Bronze
Bronze Age
Age dagger
dagger from
from Southwestern
Southwestern Iran.
Iran. Original
Original image:
image: Omid
Omid Oudbashi.
Oudbashi.
Table
Table 3.
3. EDS
EDS analyses
analyses from
from the
the cross-section
cross-section of
of the
the low-arsenic
low-arsenic copper
copper dagger, wt.%; see
dagger, wt.%; see Figure
Figure 55 also.
also.
O Mg Al Si P S Cl K Fe Ni Cu Zn As Sn Sb Pb
O Mg Al Si P S Cl K Fe Ni Cu Zn As Sn Sb Pb
Matrix (M) - - - - 0.05 0.58 0.14 - 0.32 0.30 93.75 0.94 1.19 0.28 0.52 1.92
Matrix (M) - - - - 0.05 0.58 0.14 - 0.32 0.30 93.75 0.94 1.19 0.28 0.52 1.92
A A 18.91
18.91 - - - - - - - - 1.08
1.08 0.13
0.13 -- 0.20
0.20 0.50
0.50 75.87
75.87 1.21
1.21 0.63
0.63 0.18
0.18 0.28
0.28 1.01
1.01
BB 54.31 - - - - 15.39
54.31
Heritage 2021, 4 FOR PEER REVIEW
15.39 0.06
0.06 -- 0.12
0.12 -- 0.41
0.41 0.39
0.39 25.90
25.90 0.85
0.85 0.59
0.59 0.52
0.52 0.64
0.64 90.81
0.81
CC 60.463.283.28 6.73
60.46 6.73 16.88
16.88 0.13
0.13 0.11
0.11 0.13
0.13 1.02
1.02 3.46
3.46 0.82
0.82 5.28
5.28 1.10
1.10 0.33
0.33 - - 0.26
0.26
The SEM-BSE micrographs from which the analyses were obtained are presented in
Figure 5. The micrographs show a variably thick corrosion crust. The original dagger sur-
face is preserved between the corrosion layers A (internal) and B + C (external). The inter-
nal layer includes copper (75.87 wt.%) and oxygen (18.91 wt.%), while the arsenic and lead
contents are present in lower concentrations than in the matrix. All three corrosion layers
contain only low concentrations of chlorine, thereby providing the main reason that the
dagger has a protective patina and did not fragment or corrode completely. In other
words, the dagger has undergone type I corrosion.
Figure
Figure 5.
5. SEM-BSE
SEM-BSE micrographs
micrographs from
from the
the dagger
dagger cross-section,
cross-section, showing the surface
showing the surface corrosion layers. Original
corrosion layers. Original images:
images: Omid
Omid
Oudbashi.
Oudbashi.
2.4.4. Tin Bronze Vessel from
The SEM-BSE Luristan,from
micrographs 7th–8th
whichCentury BC
the analyses were obtained are presented in
Figure
A 5. The thin-walled
fragmented micrographsvessel
showexcavated
a variablyfrom
thickthe
corrosion
Iron Agecrust.
site ofThe original dagger
Sangtarashan,
surfaceIran
in Western is preserved
(Luristan),between
has beenthe corrosion
found layers
to have A (internal)
several andaspects.
interesting B + C (external).
These are The
internal
uniform layer
surface includes and
corrosion copper (75.87patina
a noble wt.%) [40];
and oxygen (18.91
and stress wt.%), while
corrosion the arsenic
cracking (SCC) and
lead contents are present in lower concentrations than in the matrix. All three
[52], which is discussed in Section 2.5. Figure 6 shows how seriously the vessel had broken corrosion
layers contain only low concentrations
into fragments, most probably during excavation. of chlorine, thereby providing the main reason that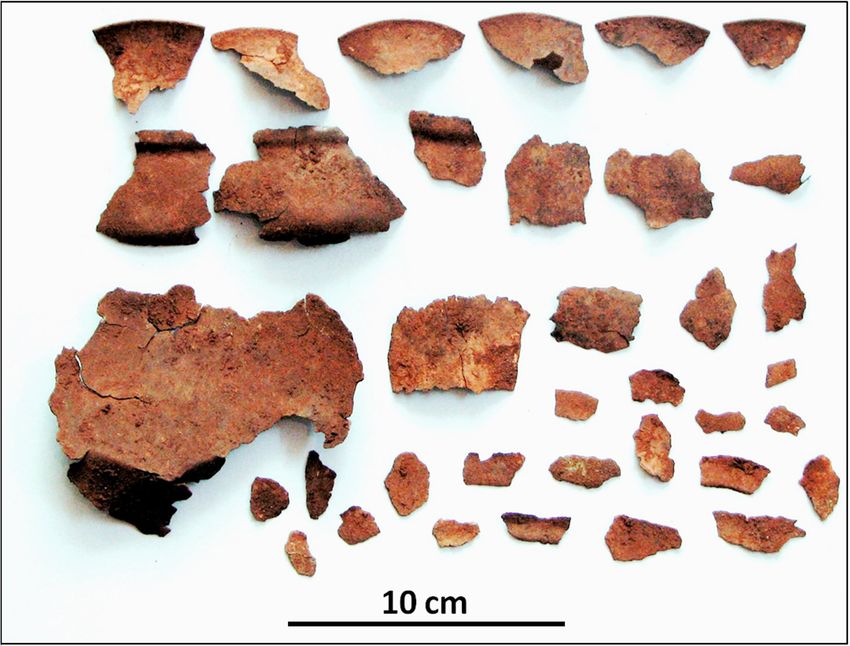
Heritage 2021, 4 2295
the dagger
Figure 5. SEM-BSE micrographs hasthe
from a protective patina and
dagger cross-section, did not
showing the fragment or corrode
surface corrosion layers.completely. In other
Original images: Omid
Oudbashi. words, the dagger has undergone type I corrosion.
2.4.4. Tin Bronze Vessel
Vessel from
fromLuristan,
Luristan,7th–8th
7th–8thCentury
CenturyBC BC
A fragmented thin-walled vessel excavated from the Iron Age site of Sangtarashan,Sangtarashan,
in Western
Western Iran
Iran (Luristan),
(Luristan), has
has been
been found
found to
to have
have several
several interesting
interesting aspects.
aspects. These
These are
are
uniform
uniform surface
surfacecorrosion
corrosionand
anda noble
a noble patina [40];
patina andand
[40]; stress corrosion
stress cracking
corrosion (SCC)(SCC)
cracking [52],
which is discussed
[52], which in Section
is discussed 2.5. Figure
in Section 6 shows
2.5. Figure how how
6 shows seriously the vessel
seriously had broken
the vessel into
had broken
fragments, most probably during excavation.
into fragments, most probably during excavation.
Figure 6.
Figure 6. The
The broken
broken vessel
vessel excavated
excavated from
from the
the Sangtarashan
Sangtarashan Iron
Iron Age
Age site,
site, Western
Western Iran.
Iran. Original
Original
image: Omid Oudbashi.
image: Omid Oudbashi.
The corrosion occurring during burial was was studied
studied byby optical
optical metallography
metallography and
and
SEM-EDS metallography as seen in Figure 7 and Table Table 4.
4. The
The results
results revealed
revealed an
an internal
internal
two-layer crust consisting of a 100–200-µm-thick smooth patina, layer A, and a region with
localized intergranular and transgranular attack, layer B. The EDS results showed that
(i) the vessel is a binary Cu-Sn alloy, (ii) layer A is a tin-rich noble patina with considerable
oxygen content owing to tin oxidation, and (iii) the layer B tin content was slightly higher
than that of the metal matrix (not indicated in Figure 7).
The transgranular attack in layer B, shown most clearly in Figure 7a,b, occurred along
slip planes. This corrosion-induced visibility of slip therefore indicates some retained
deformation after final annealing.
Finally, X-ray diffraction (XRD) chemical analysis identified copper oxides and basic
copper carbonates as the main corrosion products formed over the surface of the vessel
and other tin bronze objects at this site [40]. These results confirm that type I corrosion,
with the formation of a tin-rich noble patina, was typical for this site. Consequently, the
corrosion rate was low, persisting for nearly 3000 years of burial time.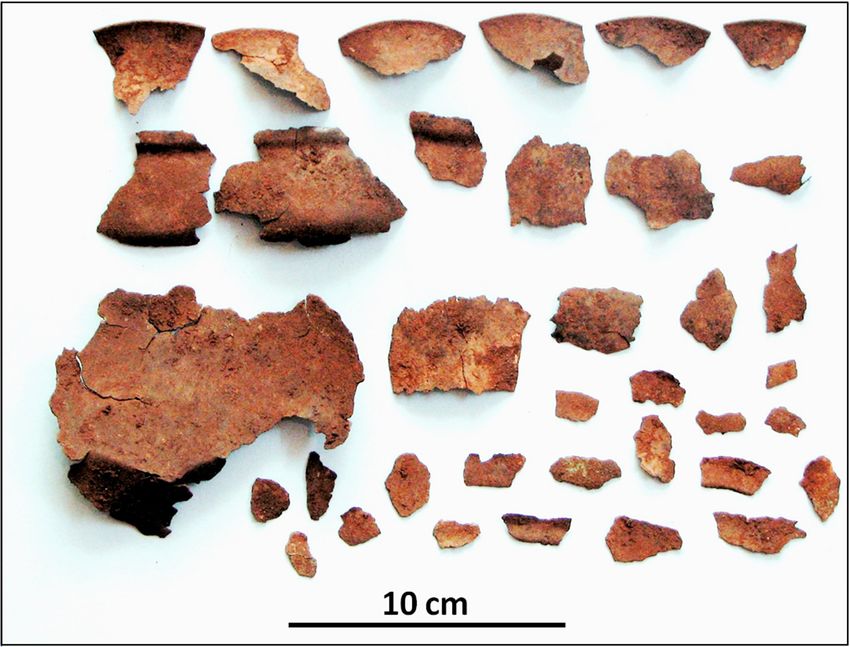
Table 4. EDS results of phases analyzed from the cross-section of the Sangtarashan bronze vessel, wt.%.
Cu Sn Pb As Zn Ni Fe Cl O S P Si Ca
Matrix 84.88 13.36 1.16 0.22 0.02 0.01 0.01 - - 0.15 0.20 - -
Heritage 2021, 4 2296
A 10.77 42.02 0.43 0.05 - - - 0.04 42.98 - 1.20 1.69 0.81
B 54.82 19.74 0.78 - - - - 1.31 22.76 - 0.59 - -
FigureFigure
7. Metallography
7. Metallographyandand
SEM-BSE
SEM-BSE micrographs
micrographsof
ofaa cross-section
cross-section ofofthe
thetintin bronze
bronze Luristan
Luristan vessel.
vessel. All four
All four images
images
(a–d,)(a–d)
showshow
the tin-rich noble patina A and the corrosion attacks in layer B. (a,b) show intergranular and transgranular
the tin-rich noble patina A and the corrosion attacks in layer B. (a,b) show intergranular and transgranular
attackattack
alongalong
slip planes in the
slip planes layer
in the B. B.
layer Original
Originalimages:
images: Omid Oudbashi.
Omid Oudbashi.
2.5. Selective
Table 4. EDS results of phases Corrosion: Stress
analyzed from Corrosion Cracking
the cross-section (SCC) bronze vessel, wt.%.
of the Sangtarashan
Cu Sn Pb As isAsevidentZnfrom theNi examples
Fe presented
Cl Oin Section
S 2.4, ancient
P bronze
Si objects
Ca are
Matrix 84.88 13.36
highly
1.16
susceptible
0.22
to
0.02
corrosion.
0.01
This
0.01
includes
-
selective
-
corrosion
0.15
owing
0.20
to
-
stress corrosion
-
A 10.77 42.02 cracking
0.43 (SCC).
0.05 We - have obtained
- - evidence
0.04 for SCC
42.98 mainly
- from metallography,
1.20 1.69 0.81and also,
B 54.82 19.74 with
0.78 difficulty,
- from
- fracture
- surfaces
- (fractography).
1.31 22.76 This
- is because
0.59 naturally
- occurring
-
2.5. Selective Corrosion: Stress Corrosion Cracking (SCC)
As is evident from the examples presented in Section 2.4, ancient bronze objects are
highly susceptible to corrosion. This includes selective corrosion owing to stress corrosion
cracking (SCC). We have obtained evidence for SCC mainly from metallography, and also,
with difficulty, from fracture surfaces (fractography). This is because naturally occurring
fracture surfaces during burial are corroded beyond recognition. Instead, some samples
have been broken open in the laboratory for SEM fractography [52].
2.5.1. Metallography of Ancient Bronze SCC
Examples of SCC in ancient Iranian bronzes are shown in Figure 8, and their details
are given in Table 5. It is evident that severe intergranular attack can lead to breakages.Figure along slip lines and twin
Vessel: Luristan: 7th–8th Century Cu-18.2Sn-0.06As
8d boundaries: large intergranular
Figure crack in (e)
Button: Baba Jilan: 8th Century Cu-8.41Sn-0.42As-0.09Zn-0.31Pb
8e
Heritage 2021, 4 2297
Figure
Vessel: Luristan: 7th–8th Century Cu-9.5Sn-0.33As Large intergranular cracks
8f
Heritage 2021, 4 FOR PEER REVIEW 12
FigureFigure
8. Metallographic examples
8. Metallographic of progressive
examples SCC damage
of progressive in ancient
SCC damage in Iranian
ancient bronzes. All six images
Iranian bronzes. All six(a–f) show
images in- show
(a–f)
tergranular cracking. (b) shows some attack along twin boundaries; and (c‒e) show attack along twin boundaries and slip
intergranular cracking. (b) shows some attack along twin boundaries; and (c–e) show attack along twin boundaries and
lines. More details about the samples are given in Table 5. Original images with permission: (a–c,e) Omid Oudbashi; (d,f)
slip lines. More details about the samples are given in Table 5. Original images with permission: (a–c,e) Omid Oudbashi;
George Vander Voort, Vander Voort Consulting LLC, Wadsworth, IL 60083-9293, USA.
(d,f) George Vander Voort, Vander Voort Consulting LLC, Wadsworth, IL 60083-9293, USA.
2.5.2. Fractography of Ancient Bronze SCC
Fractographic examination of gold-coated (needed for SEM imaging) samples from
six cracked and fragmented Iranian ancient bronze vessels showed that most of the frac-
ture surfaces were too corroded to determine any SCC characteristics. However, samples
from a Baba Jilan vessel (8th Century BC) and the Sangtarashan vessel (7th–8th Century
BC) discussed in Section 2.4.4 enabled both intergranular and transgranular SCC to be
observed, as shown in Figure 9.Heritage 2021, 4 2298
Table 5. Details of Iranian ancient bronze metallographic samples shown in Figure 8.
Figure Artifact: Location: BC Date Composition (wt.%) Remarks
Figure 8a Vessel: Marlik: 10th–14th Century Cu-8.71Sn-0.02As-0.12Zn Intergranular cracking
Intergranular cracking and
Figure 8b Vessel: Deh Dumen: 20th–25th Century Cu-7.69Sn-0.23As-0.12Zn some attack along twin
boundaries
Figure 8c Vessel: Deh Dumen: 20th–25th Century Cu-8.41Sn-0.11As-0.12Zn-0.11Pb Intergranular cracking and
attack along slip lines and
Figure
Figure8.8d
Metallographic
Vessel:examples
Luristan:of progressive
7th–8th CenturySCC damage inCu-18.2Sn-0.06As
ancient Iranian bronzes. All six images (a–f) show in-
twin boundaries: large
tergranular
Figure 8e cracking. (b) shows some attack along
Button: Baba Jilan: 8th Centurytwin boundaries; and (c‒e) show attack
Cu-8.41Sn-0.42As-0.09Zn-0.31Pb along twin boundaries
intergranular crackand slip
in (e)
lines. More details about the samples are given in Table 5. Original images with permission: (a–c,e) Omid Oudbashi; (d,f)
Figure 8f Vessel: Luristan: 7th–8th Century Cu-9.5Sn-0.33As Large intergranular cracks
George Vander Voort, Vander Voort Consulting LLC, Wadsworth, IL 60083-9293, USA.
2.5.2.
2.5.2.Fractography
Fractographyof
ofAncient
Ancient Bronze SCC
Bronze SCC
Fractographic
Fractographic examination
examination ofofgold-coated
gold-coated (needed
(needed for for
SEMSEM imaging)
imaging) samples
samples from
from six
sixcracked
cracked and fragmented Iranian ancient bronze vessels showed that most
and fragmented Iranian ancient bronze vessels showed that most of the fracture of the frac-
ture surfaces
surfaces werewere too corroded
too corroded to determine
to determine anycharacteristics.
any SCC SCC characteristics. However,
However, samplessamples
from
a Baba
from JilanJilan
a Baba vessel (8th Century
vessel BC) and
(8th Century BC)the
andSangtarashan vessel vessel
the Sangtarashan (7th–8th Century
(7th–8th BC)
Century
BC)discussed in Section
discussed 2.4.4 enabled
in Section both intergranular
2.4.4 enabled and transgranular
both intergranular SCC to be observed,
and transgranular SCC to be
as shownas
observed, inshown
Figure 9.
in Figure 9.
Figure 9. SEM
Figure 9. SEMsecondary
secondaryelectron
electron(SE)
(SE)fractographs
fractographsfrom
from broken-open fragmentsofoftwo
broken-open fragments twoancient
ancientIranian
Iranian bronze
bronze vessels:
vessels:
(a) (a)
Baba Jilan (8th Century BC) showing intergranular SCC, with two arrows pointing to cracking and spalling
Baba Jilan (8th Century BC) showing intergranular SCC, with two arrows pointing to cracking and spalling of of a thin
a
corrosion layer overlying the fracture surface; (b) Sangtarashan (7th–8th Century BC) showing crystallographic
thin corrosion layer overlying the fracture surface; (b) Sangtarashan (7th–8th Century BC) showing crystallographic transgran-
ulartransgranular
SCC along many slip planes
SCC along andplanes
many slip possibly
andsome annealing
possibly twin boundaries.
some annealing OriginalOriginal
twin boundaries. images:images:
Omid Omid
Oudbashi.
Oudbashi.
3. Corrosion and Embrittlement of Old World High-Silver Objects
3.1. Production and Processing
Native silver was, and is, scarce, and has seldom been used for artifacts, some of
which have recently been dated to as early as 4300–4000 BC [53]. The main source of silver
is as a minor component in the ores of other metals, notably lead [54]. Sometime before
3000 BC, in the near- and middle-East, lead obtained from smelting argentiferous leadHeritage 2021, 4 2299
ores was further processed by cupellation [55,56] to extract silver. This process became the
primary method of obtaining silver for the manufacture of silver objects [57–61], although
some were made from silver obtained via direct smelting of silver ores [54].
Cupellation produces silver above 95 wt.% purity [60,62], though it usually contains
minor-to-trace amounts of gold, copper, bismuth, and lead (generally below 1 wt.% for
each), and traces of antimony, arsenic, tellurium, zinc, and nickel [58,61,63]. Several studies
have shown that copper contents above 0.5–1 wt.% indicate deliberate additions [58,63],
most probably to increase the strength and wear resistance in high-silver alloys, and also in
larger amounts to make lower-quality artifacts and coins. Copper additions appear to have
been conducted since about 3000 BC [58].
Aggregations of cupelled silver ‘buttons’, with or without additions of copper, were
remelted into ingots. The ingots were used to manufacture artifacts and coinage. Artifacts
were usually made by cold working with intermittent annealing, although cast silver
objects were also produced. The artifacts were often high-quality thin-walled vessels with
exquisite craftsmanship and raised or chased designs. Most coins were made by casting
blanks and then striking (hammering) them between dies, although some were cast directly
to shape in molds.
3.2. General Corrosion
General corrosion in high-silver artifacts and coins is the slow conversion of the metal
surface to silver chloride [57,64,65]. The silver chloride forms a moderately cohesive finely
granular crust under which the original surface topography may be retained [64]. However,
unfavorable conditions can result in an object being completely converted to silver chloride,
sometimes retaining its shape, sometimes not [57,64].
3.3. Selective Corrosion: Stress Corrosion Cracking (SCC)
Selective corrosion penetrates the metal along preferred paths, reducing an object’s
resistance to fragmentation [66–70]. There are three types: (i) Intergranular corrosion in me-
chanically worked and annealed objects; (ii) interdendritic corrosion in cast objects [65]; and
(iii) both intergranular and transgranular corrosion in objects retaining significant amounts
of cold work in the finished condition [71,72]. In fact, the study of six corrosion-embrittled
artifacts of widely varying dates and provenance [72] has recently led to the conclusion
that both intergranular and transgranular corrosion, and the ensuing embrittlement, are
due to stress corrosion cracking (SCC). Three examples will be discussed in the following
three Sections 3.3.1–3.3.3.
3.3.1. Romanesque Kaptorga (Amulet and Relic Container), AD 10th Century
The Kaptorga is shown in Figure 10. It took more than a year to restore, and this is
nonreversible owing to the Kaptorga’s fragility. The bulk composition, determined by
EDX/EDS, is 94–95 wt.% Ag, 3.3–3.5 wt.% Cu, and 2.3–2.5 wt.% Au [69]. The Kaptorga
has a fully annealed and therefore nominally stress-free microstructure [69], and should
have been immune to SCC. However, it was originally (and now after restoration) a hollow,
thin-walled object. Thus, during burial, the soil pressing down on it would have introduced
bending stresses in the side surfaces. The tensile components of these stresses, amplified
by some grooves in the external decorations, must have enabled localized SCC to occur.
Figure 11 shows SEM images that illustrate (a) corrosion pitting at grain boundaries, linking
to form SCC cracks, and (b) an intergranular SCC fracture that was being slowly destroyed
by general corrosion proceeding inwards from a side surface [72].Heritage 2021, 4 FOR PEER REVIEW 14
Heritage 2021, 4 FOR PEER REVIEW 14
Heritage 2021, 4 occur. Figure 11 shows SEM images that illustrate (a) corrosion pitting at grain bounda- 2300
ries, linking to form SCC cracks, and (b) an intergranular SCC fracture that was being
occur. destroyed
slowly Figure 11 shows SEM corrosion
by general images that illustrate (a)
proceeding corrosion
inwards pitting
from a sideatsurface
grain bounda-
[72].
ries, linking to form SCC cracks, and (b) an intergranular SCC fracture that was being
slowly destroyed by general corrosion proceeding inwards from a side surface [72].
Figure 10.
Figure 10. The
TheKaptorga
Kaptorgaininthe as-found
the condition
as-found andand
condition restored. Original
restored. images
Original with permission:
images Jiří Dĕd,
with permission: JiříInstitute of Chem-
Dĕd, Institute of
Figure
ical 10. The Kaptorga
Technology; Institute in Archaeology
of the as-found condition
of the and restored.
Czech Academy Original
of imagesPrague,
Sciences; with permission:
Czech Jiří Dĕd, Institute of Chem-
Republic.
Chemical Technology; Institute of Archaeology of the Czech Academy of Sciences; Prague, Czech Republic.
ical Technology; Institute of Archaeology of the Czech Academy of Sciences; Prague, Czech Republic.
Figure
Figure
Figure 11.11.
11. Example
Example
Example SEM
SEM
SEM SESEmetallograph
SE metallographand
metallograph andfractograph
and fractograph showing
fractograph showing(a)
showing (a)corrosion
(a) corrosionpitting
corrosion pittingcoalescing
pitting coalescing
coalescing to to
form
to formintergranular
form intergranular
intergranular
cracks,
cracks, and (b) integranular SCC being destroyed by general corrosion proceeding inwards from a side surface [72]. Orig-
Original
cracks, and
and (b)
(b)integranular
integranularSCC SCCbeing
beingdestroyed
destroyedbybygeneral
generalcorrosion
corrosionproceeding inwards
proceeding inwards from a side
from a sidesurface [72].
surface [72]. Orig-
inal images with permission: Pavel Bartuška, Institute of Physics, Czech Academy of Sciences; Jaroslava Vaníčková, Institute
inal images
images withwith permission:
permission: Pavel
Pavel Bartuška,
Bartuška, Institute
Institute of Physics,
of Physics, Czech
Czech Academy
Academy of Sciences;
of Sciences; Jaroslava
Jaroslava Vaníčková,
Vaníčková, Institute
Institute of
of Chemical Technology; Prague, Czech Republic.
of Chemical
Chemical Technology;
Technology; Prague,
Prague, Czech
Czech Republic.
Republic.
It is important to note that the fractograph in Figure 11b is from a sample broken
It is
is important
importanttotonote
notethat
thatthethe
fractograph in Figure
fractograph 11b 11b
in Figure is from a sample
is from broken
a sample
open in the laboratory [69], i.e., the intergranular SCC fracture surfaces were close to-
open
broken
in the in
open laboratory [69], i.e., the i.e.,
intergranular SCC fracture surfaces were closewere
together until
gether until then. This means that SCC nucleated and grew with very limited access to the to-
the laboratory [69], the intergranular SCC fracture surfaces close
then.
gether This means that SCC nucleated and grew with very limited access to the
external burial environment, i.e., it occurred under oxygen-depleted conditions that mustthe
until then. This means that SCC nucleated and grew with very limited external
access to
burial
externalenvironment, i.e., it occurred
burial environment, under oxygen-depleted
i.e., it occurred conditions
under oxygen-depleted that must
conditions that have
must
prevented general corrosion within the crack. This may be explained with the aid of
Figure 12, a silver-water-chloride Pourbaix diagram derived from McNeil and Little [26]:• Line (a) is the oxygen line above which water is thermodynamically unstable with
respect to the generation of oxygen gas.
• Line (b) is the hydrogen line below which water is thermodynamically unstable with re-
spect to the generation of hydrogen gas.
Heritage 2021, 4 • Between lines (a) and (b), water is thermodynamically stable. 2301
• Line (c) separates stability regions for silver chloride (AgCl) and metallic silver, Ag
(metal).
• The upper shaded region represents conditions easily achieved in stagnant waters in
• Line (a) is the oxygen line above which water is thermodynamically unstable with
a near-surface archaeological environment.
respect to the generation of oxygen gas.
• The lower shaded region indicates other conditions possible in the biosphere.
• Line (b) is the hydrogen line below which water is thermodynamically unstable with
Ifrespect
the oxygen
to the content
generationof the water decreases,
of hydrogen gas. the conditions that govern corrosion
shift
• downwards
Between lines on(a)
theand
diagram [26,73].
(b), water This makes it increasingly
is thermodynamically stable. likely that these con-
ditions
• Line (c) separates stability regions for silver chloride (AgCl) ceases
will fall below line (c). When this occurs, general corrosion but SCC
and metallic is pos-
silver, Ag
sible (metal).
for a wide range of environmental water pH, provided that (i) the metal (a high-
silver
• alloy)
The is susceptible
upper to SCC,
shaded region and (ii)conditions
represents tensile stresses
easily are present
achieved in in the metal.
stagnant Thein
waters
evidence from the Kaptorga and the other
a near-surface archaeological environment. five case histories is consistent with these two
conditions
• [72]. shaded region indicates other conditions possible in the biosphere.
The lower
Figure
Figure12.
12.Pourbaix
Pourbaixdiagram
diagramfor
foraasilver‒water–chloride
silver–water–chloridesystem:
system:After
AfterMcNeil
McNeiland
andLittle
Little[26].
[26].The
The
upper
uppershaded
shadedregion
regionrepresents
representsconditions
conditionsreadily
readilyachieved
achievedininstagnant
stagnantwaters
watersinina anear-surface
near-surface
archaeological environment. The lower shaded region indicates other conditions possible in the
biosphere. For further explanation, see the main text.
If the oxygen content of the water decreases, the conditions that govern corrosion shift
downwards on the diagram [26,73]. This makes it increasingly likely that these conditions
will fall below line (c). When this occurs, general corrosion ceases but SCC is possible for a
wide range of environmental water pH, provided that (i) the metal (a high-silver alloy) is
susceptible to SCC, and (ii) tensile stresses are present in the metal. The evidence from the
Kaptorga and the other five case histories is consistent with these two conditions [72].Heritage 2021, 4 2302
3.3.2. Gundestrup Cauldron, 1st–2nd Century BC
The Gundestrup Cauldron and analysis program, using small metallographic samples
from different parts of the Cauldron, is shown in Figure 13. The Cauldron was found
dismantled in a Danish peat bog in 1891. It has been reversibly assembled and is now
in the National Museum of Denmark, Copenhagen. As may be seen from Figure 13, the
Cauldron was made from a high-silver alloy (or alloys) and the sample copper contents
varied significantly. It was also found from the EBSD investigation that the samples
contained varying amounts of retained cold work. Both these unforeseen variations proved
to be important for interpreting the analysis results [71,72], and will be discussed after
Heritage 2021, 4 FOR PEER REVIEW 17
describing some of the EBSD results (Figure 14); the complete results are available from
Wanhill et al. [71,74].
Figure 13.
Figure 13. Gundestrup
Gundestrup Cauldron
Cauldron and
and outline
outline of
of the
the investigation:
investigation: EPMA
EPMA == Electron Probe Microanalysis;
Electron Probe Microanalysis; EBSD
EBSD == Electron
Electron
Backscatter Diffraction. NLR = Nationaal Lucht- en Ruimtevaartlaboratorium (National Aerospace Laboratory),
Backscatter Diffraction. NLR = Nationaal Lucht- en Ruimtevaartlaboratorium (National Aerospace Laboratory), the Neth-
the
erlands. Original image: Wikipedia.
Netherlands. Original image: Wikipedia.
3.3.3.The
Egyptian
EBSDVase,images 2nd‒3rd Century
in Figure 14 areBCarranged top-down in the order of increasing
retained
The cold work Vase
Egyptian in theissamples.
shown in Sample
Figure363
15.isThe
omitted
X-raybecause
radiographthe results
revealswere similar
(i) much of
to those
the vase ofis sample
missing361. andThe images
(ii) an show the
‘egg-shell’ following:
pattern of large cracks. Two of these cracks, la-
belled
Sample[A], 366:follow
Annealedexternal chasing grooves.
microstructure, shownThe Vase color
by solid was restored
equiaxedearly
grainsinand
the annealing
20th Cen-
tury
twinsand is fragile
(seen owing
as yellow to a synergistic
parallel combination
lines) on the boundaryof corrosion-induced
rotation embrittlement
angle map; discontinuous
and microstructurally
precipitation of copperinduced
at grain intergranular embrittlement.
boundaries (arrows This latter type of embrittle-
point to examples).
ment
Sample is discussed
361: Retained in Section
cold work3.4 for a Roman
shown by (i)Kantharos
color shiftsandinthe Vase.
grains and annealing twins;
The Vase’s(red)
(ii) dislocations average
mainlycomposition,
near graindetermined
boundaries by andfully quantitative
deformation EDX/EDS
twins of three
(narrow-spaced
samples, is 97.1 wt.%
irregular yellow lines)Ag,
on the0.9 boundary
wt.% Cu, 0.8 wt.% angle
rotation Au, 0.2 wt.%
map. TheSn,internal
0.7 wt.% Pb, areas
black and 0.3 wt.
repre-
sent
% Sbintergranular corrosion,
[68]. Significantly, as willwhich was preferentially
be mentioned in Sectionassociated
3.5, bismuthwith retained
(Bi) was notcold work.
detected.
Sample 365: Extensive
Furthermore, retained
the relatively highcold work
silver shown
purity andbylow(i) copper
elongated grains
content (inwith more color
archaeological
shifts; (ii)
terms) meanswidespread
that in thedislocations and numerous
annealed condition, deformation
the vase would have twins
beenonoverly
the boundary
liable to
rotation angleduring
deformation map. The internalInblack
handling. fact,areas are mixtures
the Vase samples of intergranular
were and transgranular
found to contain significant
corrosion,ofwhich
amounts retainedappears predominant
cold work [68]. in this sample.You can also read


