EVALUATING THE IMPACT ON THE DISTRIBUTION NETWORK DUE TO ELECTRIC VEHICLES: A CASE STUDY DONE FOR HAMMARBY SJÖSTAD - DIVA
←
→
Page content transcription
If your browser does not render page correctly, please read the page content below
DEGREE PROJECT IN ENERGY AND ENVIRONMENT,
SECOND CYCLE, 30 CREDITS
STOCKHOLM, SWEDEN 2020

Evaluating the impact on the
distribution network due to electric
vehicles: A case study done for
Hammarby Sjöstad.

ROBERT KARLSSON

KTH ROYAL INSTITUTE OF TECHNOLOGY
SCHOOL OF INDUSTRIAL ENGINEERING AND MANAGEMENT

Evaluating the impact on the distribution
network due to electric vehicles: A case
 study done for Hammarby Sjöstad.

 Robert Karlsson

 Master of Science Thesis TRITA-ITM-EX 2020:5
 Industrial Engineering and Management
 ITM
 Royal Institute of Technology
Master of Science Thesis
 TRITA-ITM-EX 2020:5

 Evaluating the impact on the distribution network
 due to electric vehicles: A case study done for
 Hammarby Sjöstad.

 Robert Karlsson

 Approved Examiner Supervisor
 2019-09-17 Björn Laumert Monika Topel
 Commissioner Contact person

Abstract
When the low voltage electric grid is dimensioned electric loads are predicted by analyzing the area by
certain factors such as geographical data, customer type, heating method etc. So far, the charging of Plug-
in Electric Vehicles (PEVs) is not considered as one of these factors. Approximately 30% of the distribution
grid in Sweden is projected to need reinforcements due to the increased loads from PEVs during winters if
the charging isn’t controlled. In addition to this Stockholm face the problem of capacity shortage from the
transmission grid, limiting the flow of electricity into the city. This research is therefore conducted to
analyze the impact that the increase of PEVs will have on the distribution grid in the future.

This thesis simulates the electric grid for three substations located in Hammarby Sjöstad by using power
flow analysis and electric grid data from 2016. To approach this problem a method to disaggregate the total
power consumption per substation into power consumption responding to each building was developed.
In addition to this the number of PEVs in the future was projected. Nine different scenarios were used to
compare different outcomes for the future, namely the years of 2025 and 2040. In order to simulate the
worst possible case for the electric grid all the PEVs were assumed to be charged at the same time, directly
when arriving home on the Sunday when the power demand peaks in 2016.

The results indicate that PEVs can have a considerable impact on the components of the low voltage
distribution network and controlled charging should be implemented. By examining the impact on the
simulated electric grid from the different scenarios the limit of PEV penetration is found. In the area of
Hammarby this limit seems to be around 30 % of the total cars if there is no controlled charging. Without
any controlled charging the peak power demand increases by 30% with a 30% share of PEVs, which is
projected to happen in 2025. In 2040 when share of PEVs is projected to be about 95% the peak power is
instead increased by more than 100% which shows the impact that PEVs can exert on the electric grid.
Utilizing a simple method of controlled charging where the PEVs are instead charged during the night when
the power demand is low, the peak power is not increased at all. This also results in the small cost benefit
for PEV owners since the electricity is cheaper during the night and controlled charging can therefore save
about 15% of the electricity charging cost. However, the main savings are for the grid owners since the
need to reinforce the grid is heavily reduced. In addition to this the power losses are reduced heavily from
about 14% down to 5% in the electric grid that is simulated.

Key words: Plug-in Electric vehicle (PEV), Peak power, Distribution network, Charging strategies, Energy
system modelling.

 ii
Examensarbete
 TRITA-ITM-EX 2020:5

 Påverkan på distributionsnätet från elbilar: En
 fallstudie gjord på Hammarby Sjöstad.

 Robert Karlsson

 Godkänt Examinator Handledare
 2019-09-17 Björn Laumert Monika Topel
 Uppdragsgivare Kontaktperson

Sammanfattning
När dimensioneringen av distributionsnätet utförs analyseras området genom att räkna med elektriska laster
som till exempel kan bero på geografiska data, typ av konsument, uppvärmningsmetod etcetera. Än så länge
har laddningen av elbilar (PEVs) inte varit en av dessa faktorer trots den förväntade tillväxten av elbilar.
Ungefär 30% av Sveriges distributionsnät förväntas behöva förstärkningar på grund av den ökade
elkonsumtionen från elbilar under vintrarna om laddningen inte kontrolleras. Utöver detta står Stockholm
inför problemet med effektbrist från elöverföringsnätet. Denna uppsats genomförs således för att analysera
påverkan från elbilar på fördelningsnätet i framtiden.

Denna masteruppsats simulerar det elektriska nätet för tre nätstationer i Hammarby Sjöstad genom en
analys av effektflödet. En metod för att disaggregera elkonsumtionen per nätstation ned till elkonsumtionen
per byggnad utvecklades och antalet elbilar i framtiden uppskattades. För att utvärdera elbilars påverkan
skapades nio olika scenarion för framtiden genom att undersöka hur det kommer att se ut år 2025 och år
2040. Genom att anta att laddningen av alla elbilar i området sker samtidigt, samma tid som den maximala
förbrukningen av el sker under en söndag 2016, analyseras det värsta möjliga scenario för det elektriska
nätet.

Resultaten visar att elbilar kan ha enorm påverkan på de maximala lasterna för ett lågspänningsnät och
därför kommer kontroll av laddningen behövas. Genom att undersöka elnätets påverkan i de olika
scenariona uppskattades gränsen för hur många elbilar det modellerade elnätet klarar av. I Hammarby
Sjöstad ligger denna gräns på ungefär 30% elbilar. Utan kontrollerad laddning ökar maxlasten med 30% år
2025 då antalet elbilar förväntas vara 30% av alla bilar i Hammarby Sjöstad. År 2040 då antalet elbilar
uppnår ungefär 95 % av alla bilar ökar maxlasterna med mer än 100% vilket visar den enorma påverkan
elbilar kan ha på elnätet. Genom att använda en simpel modell av kontrollerad laddning som består av att
flytta laddningen från eftermiddagen till natten, då förbrukningen av elektricitet är låg, ökar inte maxlasten
för dygnet alls jämfört med scenariot utan elbilar. Detta resulterar också i besparingen av
elektricitetskostnad för elbilsägaren med cirka 15% eftersom elektriciteten ofta är billigare under natten
jämfört med kvällens elpriser. Detta är dock små summor jämfört med besparingar elnätsägarna kan göra
då elnätet inte behöver förstärkas lika mycket som skulle behövas utan kontroll av laddningen. Utöver detta
så sänks även förlusterna av elektricitet i det simulerade nätet från 14% ned till 5% genom att utnyttja denna
modell av kontrollerad laddning.

Nyckelord: Elbil (PEV), Maximal last, Lågspänningsnät, Laddningsstrategier, Modellering av energisystem.

 iii
Acknowledgements
First and foremost, I would like to extend my gratitude to my supervisor at KTH Monika Topel Capriles
for inspiring me during the new course Practical Optimization of Energy Networks. This course got me
into the immensely interesting subject of the electric grid which eventually led to me doing this project.
Secondly, I would like to thank my examiner Björn Laumert who provided me with valuable feedback. I
would also like to thank Ellevio for providing me with the data making this thesis possible.

Finally, I would like to thank my family and friends who provided feedback and valuable support during
the making of this report.

Robert Karlsson
Stockholm, September 2019

 iv
List of Abbreviations
Abbreviations that are used in this thesis are presented here:

AC Alternating Current
BAU Business as Usual
BEV Battery Electric Vehicle
CC Controlled Charging
DC Direct Current
EV Electric Vehicle
HEV Hybrid Electric Vehicle
HS Hammarby Sjöstad
ICEV Internal Combustion Engine Vehicle
LiB Lithium-ion Battery
NEPP North European Power Perspectives
PEV Plug-in Electric Vehicle
PF Power Factor
PHEV Plug-in Hybrid Electric Vehicle
SDS Sustainable Development Goals
SoC State-of-Charge
SVK Svenska Kraftnät
UC Uncontrolled Charging
V2G Vehicle to Grid
Wh Watt-hour

 v

Contents
Abstract ............................................................................................................................... ii
Sammanfattning ................................................................................................................. iii
Acknowledgements............................................................................................................. iv
1 Introduction .......................................................................................................................1
 1.1 Background ....................................................................................................................................................... 1
 1.2 Problem Formulation ...................................................................................................................................... 2
 1.3 Objectives.......................................................................................................................................................... 2
 1.4 Research Questions ......................................................................................................................................... 2
 1.5 Delimitations .................................................................................................................................................... 3
 1.6 Thesis Disposition ........................................................................................................................................... 3
2 Methodology .................................................................................................................... 5
 2.1 Collection of Data ........................................................................................................................................... 5
 2.1.1 Projecting PEV Increase ........................................................................................................................ 5
 2.1.2 Researching the Grid .............................................................................................................................. 5
 2.1.3 Analyzing Energy Projections .............................................................................................................. 5
 2.2 Formulating Scenarios.................................................................................................................................... 5
 2.3 Building the Network ..................................................................................................................................... 6
 2.3.1 Software Choice....................................................................................................................................... 7
 2.4 Load Disaggregation....................................................................................................................................... 7
 2.5 Validity and Reliability .................................................................................................................................. 7
3 Previous Research ............................................................................................................ 8
 3.1 Scenario Creation ............................................................................................................................................ 8
 3.2 PEV Projections ............................................................................................................................................... 8
 3.3 Charging Strategies ......................................................................................................................................... 8
 3.4 Area Profiles ..................................................................................................................................................... 9
 3.5 Summarizing Previous Research ................................................................................................................. 9
4 Theoretical Background .................................................................................................. 10
 4.1 The Electric Grid ........................................................................................................................................... 10
 4.1.1 Electrical Principles .............................................................................................................................. 10
 4.1.2 The Swedish Electrical Grid ............................................................................................................... 11
 4.2 Power Flow Analysis .................................................................................................................................... 12
 4.3 Plug-In Electric Vehicles ............................................................................................................................. 12
 4.3.1 Battery Electric Vehicles ..................................................................................................................... 14

 vi

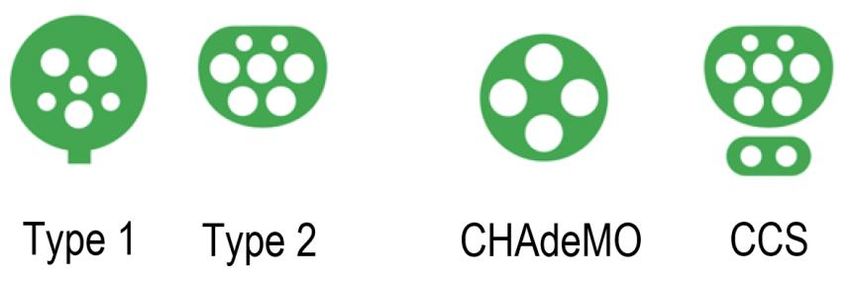
4.3.2 Plug-in Hybrid Vehicles ...................................................................................................................... 14
 4.3.3 Environmental Benefits from PEVs .................................................................................................. 14
 4.4 Batteries ........................................................................................................................................................... 16
 4.5 Charging .......................................................................................................................................................... 19
 4.5.1 Normal Charging ................................................................................................................................... 19
 4.5.2 Fast Charging ......................................................................................................................................... 20
 4.6 Power Shortage .............................................................................................................................................. 20
 4.7 Impact on the Electrical Distribution System ......................................................................................... 22
 4.7.1 Uncontrolled Charging ......................................................................................................................... 22
 4.7.2 Controlled Charging ............................................................................................................................. 23
 4.7.3 Vehicle to Grid....................................................................................................................................... 23
 4.8 Hammarby Sjöstad ........................................................................................................................................ 24
5 Projections .......................................................................................................................25
 5.1 PEV Forecasts ................................................................................................................................................ 25
 5.1.1 Sweden..................................................................................................................................................... 25
 5.1.2 Hammarby Sjöstad PEVs .................................................................................................................... 26
 5.2 Electric Consumption Forecasts................................................................................................................. 29
 5.2.1 Hammarby Sjöstad Electric Consumption ....................................................................................... 30
6 Modeling ..........................................................................................................................32
 6.1 Scenarios ......................................................................................................................................................... 32
 6.2 Charging Strategies ....................................................................................................................................... 32
 6.2.1 Uncontrolled Charging ......................................................................................................................... 32
 6.2.2 Controlled Charging ............................................................................................................................. 33
 6.3 Model Execution ........................................................................................................................................... 33
 6.4 Disaggregation of Loads .............................................................................................................................. 35
 6.4.1 Population Calculations ....................................................................................................................... 36
 6.4.2 Load Calculations .................................................................................................................................. 38
 6.5 Cost Calculation............................................................................................................................................. 39
 6.6 Calculating Losses ........................................................................................................................................ 39
 6.7 Assumptions ................................................................................................................................................... 39
7 Results .............................................................................................................................. 41
 7.1 Reference Scenario ....................................................................................................................................... 41
 7.2 Business as Usual .......................................................................................................................................... 43
 7.2.1 BAU with Controlled Charging ......................................................................................................... 44

 vii
7.3 Only PEVs ...................................................................................................................................................... 49
 7.3.1 Only PEVs with Controlled Charging .............................................................................................. 50
 7.4 Summarizing Results .................................................................................................................................... 52
8 Discussion ........................................................................................................................55
 8.1 Reference Scenarios...................................................................................................................................... 55
 8.1.1 The Present ............................................................................................................................................. 55
 8.1.2 The Future ............................................................................................................................................... 55
 8.2 Future Scenarios with PEVs ....................................................................................................................... 56
 8.2.1 Controlled Charging Possibilities ...................................................................................................... 57
 8.3 Analyzing Assumptions ............................................................................................................................... 57
 8.3.1 PEV assumptions ................................................................................................................................... 57
 8.3.2 Charging Behavior ................................................................................................................................ 58
 8.3.3 Slow Charging........................................................................................................................................ 58
 8.4 Neglected Factors .......................................................................................................................................... 58
 8.4.1 Heavy Transport Electrification ......................................................................................................... 58
 8.4.2 Car Ownership ....................................................................................................................................... 59
 8.3.3 Local Electricity Production ............................................................................................................... 59
 8.4.4 Vehicle to Grid....................................................................................................................................... 59
 8.5 Climate goals .................................................................................................................................................. 60
9 Conclusions ...................................................................................................................... 61
10 Future Work ..................................................................................................................62
 10.1 PEV projections ........................................................................................................................................... 62
 10.2 Improving the Model .................................................................................................................................. 62
11 Bibliography ..................................................................................................................63

 viii
1 Introduction
This section presents the background of the thesis as well as the problem formulation. The objectives and research questions
that this thesis will answer are also introduced here together with delimitations. Finally, the thesis disposition declares the
structure of the report.

1.1 Background
Climate Change is one of the biggest challenges of human history and will force us to adapt and mitigate
the changes as far as possible. Weather patterns, rising sea levels and other catastrophes will lead to a need
for a new approach of living for our society. The main cause of this is due to the greenhouse gases (mainly
CO2) added since the industrial revolution keeping more and more heat from the sun inside the atmosphere.
As such there has been a call for urgent action from scientists for decades. The Paris Agreement established
2015 was a global agreement uniting all the nations with a goal to limit the temperature increase to 2.0
degrees Celsius compared to pre-industrial level and striving to limit it to 1.5 degrees Celsius. Due to the
UN Intergovernmental Panel on Climate Change (IPCC) the science is available to reach these goals and
impart the urgent need for action to heavily limit CO2 emissions in the coming years (UN, 2018)

Sweden have ambitious environmental goals to meet in the coming decades. By the year of 2045 the net
emissions shall be zero and thereafter reach negative emissions. The emissions from domestic
transportation, air transportation excluded, shall be 70% lower by 2030 compared to the emissions year
2010 (Regeringskansliet, 2017). To reach this goal the transport sector plays a big role since transportation
is responsible for one third of the total emissions in Sweden today. These emissions are mainly from cars
and trucks which means that the transport sector needs to convert quickly from fossil fuels to renewable
fuels. A part of this solution is electric cars and there are projections for plug-in electrical vehicles (PEVs)
in Sweden by the year 2030 predicting between 1 million (Ellevio, 2017) and 2.5 million PEVs (Powercircle,
2018). Compared to about 50 000 electric cars 2017 this indicates an exponential growth rate in the coming
years. PEVs will introduce new loads on the electric grid and the demand for electricity will therefore be
higher (Ellevio, 2017).

In addition to the expected increase in electric consumption there is a transformation to renewable
electricity production in the world. The Swedish goal that is set for 2040 by the parliament to have an
electricity production that is 100% renewable will also lead to challenges regarding the electric distribution
(Regeringskansliet, 2016). The intermittent nature of renewable energy such as wind and solar power makes
it necessary with energy storage to handle overproduction, frequency regulation and capacity storage.
Batteries are expected to be part of this energy storage due to the decreasing price, which could consist of
PEVs (Sweco, 2017).

The PEVs connect two distinct systems together, which are the electric grid and the transport sector. When
the transport sector is transitioning from fossil fuels to electricity the electric grid will need to support the
increased electric loads from the PEVs. In the worst-case scenario this may lead to a capacity shortage since
the peak loads on the electricity grid may coincide with the time when people want to charge their PEVs.
The effect might be lessened by smart charging, which usually means charging when the electricity demand
is low (NEPP, 2013). Approximately 30% of the distribution grid in Sweden is projected to need
reinforcements due to the increased loads from PEVs during winters if no smart charging is utilized (NEPP,
2015). In addition to this several cities in Sweden face the problem of capacity shortage from the
transmission grid, limiting the flow of electricity into the cities (Ellevio, 2019).

 1
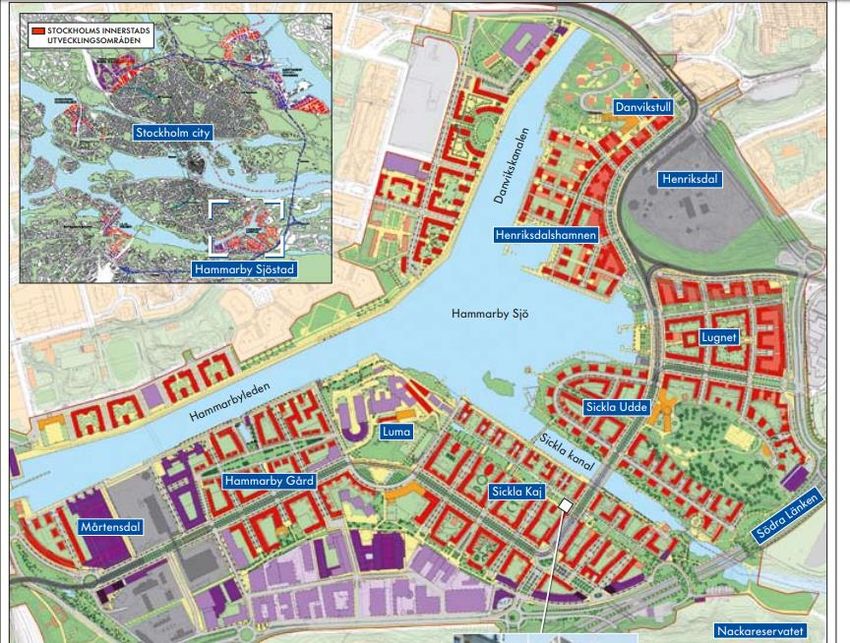
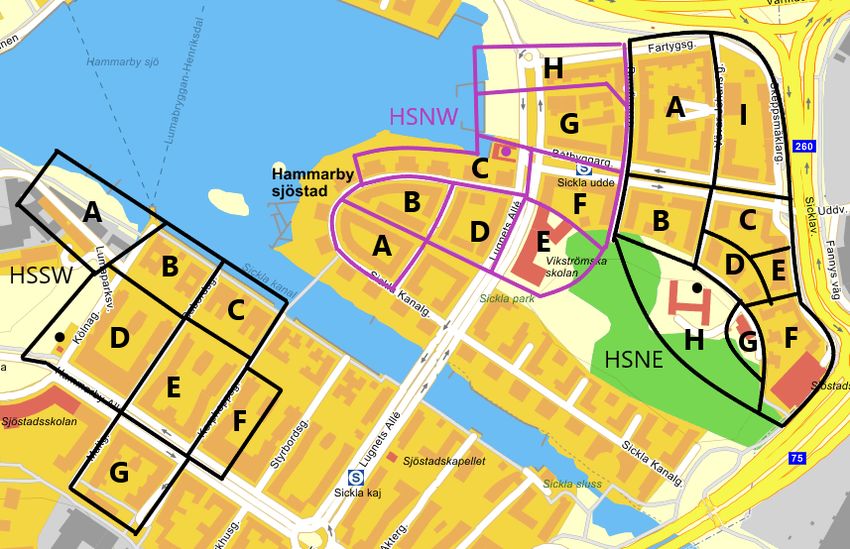
The area chosen for this research is Hammarby Sjöstad (HS) which is part of Stockholm city with a focus
on being a sustainable area. The area is striving for sustainability and the average income is well above the
average for Stockholm city. which probably means a lot of PEVs will be introduced in the coming years
(Foletta, 2014). This is supported by initiatives such as “LaddaHemma” which is a local guide for installing
charging outlets for PEVs and comparisons of PEVs (Hammarbysjostad20, 2018). Due to this the HS
distribution grid is interesting to investigate since it is also part of Stockholms electric grid which is facing
capacity shortages already and reinforcements are coming as late as 2030 (Ellevio, 2019). The PEVs might
lead to a solution of this problem by charging when the electricity demand is low. PEVs could therefore
even out the electricity demand and is therefore interesting to simulate for the electric grid owners,
Stockholms city as well as producers and consumers of electricity.

1.2 Problem Formulation
The introduction of PEVs will transform the energy market completely in only 5-10 years if the growth of
PEVs will continue. Previous research has shown that the energy consumed by the PEVs will only be about
8 % of the total energy which is about the same as the net export in the year of 2016. The energy is therefore
not the big problem, but the issue lies in the power shortage that may occur during the winter on certain
peak hours on cold days. Since the charging of PEVs most likely will occur when owners arrive home from
work there will be a big increase in load since this coincides with the regular peak demand. Local systems
might be particularly weak to these increases due to overloading, cables, transformers or fuses (Kristensson,
2018). There is already a capacity shortage today in cities such as Stockholm and the increased demand
from PEVs might add to this problem if nothing is done (Nohrstedt, 2019).

Due to the high focus on sustainability in the modeled area of HS combined with a high average income, a
lot of PEVs will be introduced into the area in the coming years. In addition to this, local initiatives that
promote heat pumps and more electric loads will add even more strain to the grid (Hammarbysjostad20,
2014). All of this makes HS a great example how the future electric grid and electricity consumption might
look in Sweden. The problems that may arise in the future for the electric grid will therefore be analyzed
by comparing the loads today with the loads of the future with varying numbers of PEVs.

1.3 Objectives
 ● Examine the impact that PEVs will have on the low voltage distribution grid of a neighborhood in
 Stockholm, in the future.
 ● Evaluate the decrease in peak electricity usage that controlling the charging of PEVs can have in
 the area of HS and the impact this will have on the electrical grid.
 ● Estimate the allowed penetration of PEVs in the area before the electrical grid components are
 strained above their limit.

1.4 Research Questions
How is the electric grid looking today (2016) based on the data for the neighborhood?
How will the electric usage, without PEVs, look in 2025 and 2040?
How will the PEVs affect the electric grid in 2025 and 2040?
How can controlled charging be applied in order to decrease electricity peak demand?

 2
1.5 Delimitations
This thesis will simulate the electric grid in the urban area of HS in Stockholm municipality. The results can
be used as an indication for other electric grids in Sweden but are most relevant for Stockholm and especially
HS.

 ● This thesis will neglect any heavy transport, buses or other vehicles that can be electrified. This
 assumption is mostly done since the area is mainly residential and the vehicles that will be charged
 in the area are therefore assumed to be mostly cars. It is also hard to predict the routes and how
 much heavy transports will affect the distribution grid.
 ● Power quality such as harmonics, voltage fluctuations and transients will not be analyzed in the
 model due to lack of time.
 ● V2G will not be analyzed in the model due to restricted time and instead focusing on the scenarios
 and projections that are rather unique on the subject. The theoretical chapter will however
 introduce what V2G is for the curious mind.
 ● Only the PEVs are considered in this thesis since the hybrid vehicles that charge their batteries
 while deaccelerating does not affect the electric grid or consumption. PEVs will hereafter refer to
 BEVs and PHEVs which are defined by their possibility to charge with electricity from the electric
 grid. The EVs that exclusively use electricity are the Battery Electric Vehicles which are abbreviated
 to BEVs in this thesis. PHEVs is the abbreviation for Plug-in Hybrid Vehicles which have a smaller
 battery package than the BEVs but are complemented by an internal combustion engine.
 ● Any fast charging that is available in the area is neglected and charging is assumed to be conducted
 at home of the PEV owner.

1.6 Thesis Disposition
This report is structured as follows:

Chapter 1 Introduction. This chapter presents the background and how the research relates to other
studies on the subject. The scope of the study is also described here as well as the disposition of the thesis.

Chapter 2 Methodology. This chapter describes the methodological steps that were made during the
process of making this thesis.

Chapter 3 Previous research. This chapter summarizes the most important papers used as references for
the project.

Chapter 4 Theoretical background. This chapter contains the needed theory that is required to
understand and analyze the results brought forth in this report. Topics covered are PEVs, their relevant
aspects and how these affect the electric grid.

Chapter 5 Projections. This chapter describes how the forecasts for PEVs were calculated which are used
for the future scenarios.

Chapter 6 Modeling. This chapter covers how the modeling was done using the tool Pandapower. This
chapter should provide sufficient information to replicate the results.

Chapter 7 Results. This chapter presents the results and answers the research questions.

 3
Chapter 8 Discussion. This chapter discusses the results and the impact these may have as well as other
interesting areas. How the assumptions that were made might affect the results are also discussed here as
well as how reliable and valid the results are.

Chapter 9 Conclusions. This chapter concludes the research and answers the research question.

Chapter 10 Future work. This chapter presents how the thesis done can be complemented in future
research in order to expand the field of knowledge.

 4
2 Methodology
This section describes how the research was conducted and why certain sources were used. How validity and reliability of the
research was achieved to the greatest extent is also presented here.

2.1 Collection of Data
In order to produce results, a literature study was conducted where the theory behind the electric grid and
EVs was compiled. In order to contribute with something new on the field the previous research was
compared, and main findings, approaches and assumptions were identified. The most important research
that have been used in this thesis is discussed in chapter 3. Knowledge had to be gathered about three main
subjects, which were The Electric Grid, PEVs and Energy projections. The most relevant info for these
subjects is gathered in the theoretical chapter 4 which should be enough to understand the results and
discussion.

2.1.1 Projecting PEV Increase
To be able to model how PEVs will impact the electric grid in the future, projections had to be made in
order to approximate how many PEVs there will be, how these will be used and the technical specifications
of the PEVs. The primary source to estimate how many PEVs there will be, has been the database of ELIS
and their reports published on the Power Circle website (Powercircle, 2018). Through extensive research
Power Circle was deemed the most reliable source for these kinds of projections without exterior influence.
In order to make the projections for this thesis even more reliable, data from the official government
statistics of Statistics Sweden (SCB) from recent years was used. Statistics for how many cars and projected
number of cars by fuel type could therefore be calculated by combining these two sources. The result of
these projections is outlined in the projection chapter 5.

2.1.2 Researching the Grid
In order to be able to model and understand the Electric Grid extensive research went into this part of the
process. The Electric Grid of Stockholm had to be understood and what components are part of it and
how these would change by injecting PEVs into the balance of the grid. The interaction of these
components was studied and how the layout of the grid might change in the future. Since the Swedish
electric grid is owned by a few big actors these companies and their info were mainly used. The most
important of these were Ellevio, the owners of Stockholm Electric Grid (Ellevio, 2018), and SVK.
Svenska Kraftnät (SVK) is the national owner of the backbone grid which delivers electricity from the big
producers to the regional networks and their publications were of great help for future scenarios.

2.1.3 Analyzing Energy Projections
Energy projections had to be made to be able to calculate the electric consumption of the model in the
coming years. These projections were constructed using mainly the source of NEPP for this thesis.
North European Power Perspectives (NEPP) is a research project which develops projections for the
ulterior energy system in Sweden, Scandinavia and Europe (NEPP, 2017). The emphasis on future scenarios
for 2020, 2030 and 2050 made it perfect for this thesis in order to develop realistic scenarios and models.

2.2 Formulating Scenarios
After the overview of literature study was made the scenarios could be formulated by identifying the
different outcomes for the future PEV and energy market. As such the scenarios include the case where no

 5
PEVs are included and the scenario when there are 100% PEVs in Stockholm. The initial data received for
the network in HS corresponds to the year of 2016 and this is therefore the year that is used as the “today”
scenario. The projections for the different scenarios are using the years of 2025 and 2040. This is due to
the immediate capacity shortage that is projected for the Stockholm region around 2025. At around 2030
there will be a capacity increase for the Stockholm region built by SVK that will make the problem look
completely different. This makes 2040 interesting to use since it will be interesting to investigate if this
increase in capacity is enough for the projected increase in electricity consumption (Ellevio, 2019). The
years of 2016, 2025 and 2040 were as such chosen for the scenarios.

Since peak demand is the most interesting to evaluate how the electric grid and its components handles the
electricity demand. The 24th of January was chosen based on the facts that January is the month with the
highest average daily demand. This week and day had the highest demand for 2 of the 3 substations that
were evaluated. The chosen Sunday of 24th of January is also a recurring peak for most years. As such all
the results should take the fact that it is a Sunday and the driver behavior will look different due to this.
During Sundays the inhabitants of Stockholm also drive more than during the weekdays and as such the
PEVs will have to be charged longer. These factors are described in more detail in 6.2 Charging strategies.

In order to analyze how PEVs will affect the electric grid for these years the scenarios were developed with
three different PEV penetration levels. First the scenario without any PEVs was constructed to have a
reference scenario for the years of 2016, 2025 and 2040. The PEVs were then added according to how
many there will be for each year from the PEV projections, this is the BAU scenario. Lastly the situation
when there are only PEVs in Stockholm was created, the Only PEVs scenario. To be able to determine the
impact that controlled charging (CC) would have on the electric grid these scenarios were then divided into
one case where uncontrolled charging (UC) is used and the other case where CC is implemented. This
finally led to the creation of 9 different scenarios: The reference scenario for year 2016, 2025 and 2040, The
BAU scenario for 2025 and 2040 with controlled and UC for both years and lastly the Only PEVs scenario
in 2025 using both controlled and UC. The Only PEVs scenario wasn’t used for 2040 since it was almost
the same PEV penetration as BAU for the year 2040. These scenarios are described in more detail in chapter
6.

2.3 Building the Network
In order to complete the objectives and answer the research questions of this thesis a model of the electric
grid had to be made. This model had to be developed and for this the software of Pandapower was used
which is described below. The electric components used for the electric grid model created in Pandapower
are cables, transformers, buses, loads and the external grid. The transformers and the external grid data
were included in the model received on the 11 kV level. Data for the buses and cables were programmed
into the model using the proper functions in Pandapower while the loads were received from the load
disaggregation and PEV projections and put into the model. In figure 2.1, the mandatory input data are
declared together with the output data . Chapter 6.3 presents an in depth explanation on how the network
was programmed.

 6
Input Data Output Data
 Panda
 Power
 • Electric Demand • Cable Loading
 • PEV Load • External Grid
 • Load Profile • Transformer Loading
 • Cable Properties
 • Transformer Data

 Figure 2.1 The model created in Pandapower

2.3.1 Software Choice
The model was created in the Python plug-in tool Pandapower for this thesis. Pandapower is based upon
Python and is an open source power system analysis tool for network calculations and optimization. The
Pandapower tool combines the power system analysis toolbox PYPOWER and the data analysis library
pandas into one power system library, a power flow solver and many other functions. The program is
developed for static analysis of balanced power systems which makes transmissions systems and balanced
distribution systems, such as the ones found in Europe, possible to evaluate. Common elements used to
build the network in Pandapower are transformers, DC cables, generators and loads (Pandapower, 2018).
The program was chosen in this project due to previous experience with the program while doing a course
on KTH where it was used to analyze a network in Stockholm.

2.4 Load Disaggregation
Since the load was aggregated into the 11 kV level a disaggregation had to be made in order to get the cable
loading on the low voltage level. Since the previous methods found for this type of disaggregation was
lacking in the literature study it had to be developed from scratch. As such the cable loading depends heavily
on this disaggregation since the load in each cable is based on this. To make this the most realistic approach
it was based on inhabitant data for each building and this was found on Ratsit.com, which was deemed
reliable. This results in a bottom up approach and seemed the most realistic due to the heavy correlation
between population and energy consumption. The other way of doing the load disaggregation would be to
divide the load by area or buildings. This approach was deemed inaccurate since square meters doesn’t have
to correlate to energy consumption. Chapter 6.4 provides a detailed explanation of this method.

2.5 Validity and Reliability
For the study to be organized in the correct way validity and reliability was controlled during the entire
research. To be able to replicate the results for an objective party this was deemed a crucial component. As
such the modeling is also described as far as it is possible. To make the collected data is reliable and valid it
was analyzed by using several different independent sources and comparing these sources (mainly
PowerCircle, SCB, Trafikanalys, NEPP and Ellevio). Because the scenarios depend so heavily on the input
data and number of parameters, the most important element affecting the reliability and validity of the
results is the caliber of the data and number of parameters in the model that are included. In order to not
include too many parameters only the most important ones were utilized. The method and results were
compared with previous research done on the subject which is described in the following chapter 3.

 7
3 Previous Research
Previous research done when analyzing the impact that PEVs will have on the electric grid are mainly done on present situation
and longer projections are rarely simulated. There are a couple of studies done on different cities and Sweden but in-depth
simulations on Stockholm are lacking. Similar studies on the subject have nevertheless been conducted and their findings are
presented here.

3.1 Scenario Creation
The paper by Steen (2012) was made as a thesis for the degree of licentiate of engineering at Chalmers in
2012. The purpose of the study was to evaluate the impact of PEVs charging on the low voltage distribution
system, using different charging strategies. In addition to this electrical heating loads and their impact on
the low voltage distribution system if controlled are analyzed. This was evaluated for the distribution system
of Gothenburg using six different scenarios.

Conclusions of this study are that the charging of the PEVs will affect the results and as such the type of
area needs to be considered, using demographical data. With UC the residential district will have their peak
power increased by 21-35%. The scenario where losses are minimized would not increase the peak demand
whereas price optimization for customers would increase the peak power by 78% in the residential district.
The results indicate that UC of PEVs would impact the grid heavily and loss optimal charging strategy
would decrease the need to reinforce the low voltage distribution system (Steen, 2012).

3.2 PEV Projections
The research by Gustafsson & Nordström (2017) was done as a master thesis at The Royal Institute of
Technology, Stockholm in 2017. The focus of this study was to evaluate if the electric grid of Uppsala
municipality is ready for the increase in PEVs that is projected, more specifically in 2030. A very detailed
PEV projection was created together with an in-depth study of how driving patterns will affect the electric
grid. Recommendations were created for the company of Vattenfall that are the owners of the electric grid
in many parts of Sweden. These recommendations show that Vattenfall should follow the trend of the PEV
market closely and create solutions to alleviate the increase in peak power. This includes how trends of car
ownership will develop and essentially bring PEVs into the calculations of future electric demand.

3.3 Charging Strategies
The PhD thesis was made in 2013 by Grahn (2013) at The Royal Institute of Technology, Stockholm. The
objective of this study was to fill in knowledge gaps in the subject of how PEVs will affect the electric grid
and the peak power demand. Different types of PEV charging was analyzed to compare their impact
combined with different load profiles.

Load data is combined with transport data to simulate the electric grid using five different charging
scenarios for the PEVs. The conclusion determines that three main factors impact the load, these are time
of charging, charging location and the demand of charging. Significant increase in peak load is achieved
when UC is simulated together with a 100% share of PEVs (Grahn, 2013).

 8
3.4 Area Profiles
The master thesis by Gode (2016) was published in 2016 at The Royal Institute of Technology, Stockholm.
The study was conducted together with Ellevio to investigate how PEVs would affect the electric grid in
Stockholm. Using the software Tekla five different areas were simulated in Stockholm. The maximum
number of charging EVs that could fit before the maximum current and power exceeds allowed levels in
cables and transformers was then calculated. The five different areas and their electrical grid was compared,
and it was found that the city grid can handle the highest share of PEVs due to a more robust electric grid.
Analyzing charging during the day yielded the result that the cables are the most vulnerable components in
the grid but charging the PEVs during the night can mitigate this result.

3.5 Summarizing Previous Research
The previous research done on the subject provide a starting point and a frame of reference for the
completion of the research. The research done by Steen (2012) will help making the scenarios for the study
and serve as technical background. Gustafsson & Nordström (2017) created a thorough model how to do
a PEV projection and the PEV projection presented in chapter 5 will be based upon this model. Different
charging strategies together with different load profiles was the focus point for the research done by Grahn
(2013) and these strategies were used to shape the charging strategies used in this thesis. Finally, Godes
(2016) study of different areas in Stockholm and their electric grid provided a reference what kind of results
were expected for the suburban area of HS. The previous research presented here confirm that the research
questions for this thesis are relevant and provide new knowledge in the subject with the combination of
long term scenarios and different charging strategies for a neighborhood in Stockholm.

 9
4 Theoretical Background
This section presents the knowledge required to understand and analyze the results. Firstly, the relevant electric theory used in
the research is presented, covering how the Swedish electric works and some basic electric theory. Following this chapter is
theoretical background on PEVs, the charging of PEVs and relevant battery knowledge. Finally, the theoretical impact on
the electric grid from PEVs is presented followed by information about the neighborhood of Hammarby Sjöstad.

4.1 The Electric Grid
The electric theory used for this thesis is presented in the following chapter.

4.1.1 Electrical Principles
Today most electric transmission is done by three phases alternating current (AC) which was invented by
Nicolas Tesla in the late 19th century. This technology is better in most cases for several reason. The biggest
advantage of the AC technique is the fact that power losses through a three phase AC transmission system
is half of the losses compared to when using a single line transmission, direct current (DC) (Ceraolo & Poli,
2014).

Active power (P) is given by the power that resistive components consume. Active power can be calculated
from equation 4.1. Reactive power (Q) on the other hand is defined as the power supplied or consumed by
the reactive components, which are inductors and capacitors. Reactive power can be calculated according
to equation 4.4. Capacitors supply reactive power while inductors consume it. Apparent power (S) is
calculated according to equation 4.5 and is defined as the magnitude of the total power, volts (U) times
amps (I) supplied by the source (McHutchon, 2013). Equations 4.1-4.3 show that power is increasing by a
quadratic factor to the current. This is also true for any power losses and it is therefore better to raise the
voltage and keep the current minimal which is done in the electric grid. The losses are proportional to the
resistance and is depending on the material used. The cost of a cable depends on both current and voltage
since higher current requires larger, more expensive conductors and higher voltage needs more insulation
(Rajan & Sekar, 2005).

 = ( ) 4.1
 = ∗ 4.2
 = ∗ 2 cos( ) 4.3
 = ( ) 4.4
 = √ 2 + 2 = ∗ 4.5
Where:
P is Power (Watt)
V is Voltage (Volt)
R is Resistance (Ohm)
I is Current (Ampere)
Q is Reactive Power (Volt Ampere Reactive, VAR)
S is Apparent Power (Volt Ampere, VA)
φis the relation between current and voltage phase angle

The voltage and current are changing sinusoidally in an AC circuit which means that current flows back
and forth between the source and the load. The direction depends on the load, if it is resistive, capacitive
or inductive. If it is purely resistive power always flows into the load. Capacitors and inductors cause the

 10
current to move out of phase to the voltage since they store energy which results in reactive power being
produced. This is essentially a loss since it goes back to the source and not into the load (McHutchon,
2013). The phase angle between current and voltage phase angle is denoted as . If equals zero the load
is purely resistive which is shown with equation 4.4 being equal to zero, no reactive power is produced
(Rajan & Sekar, 2005). The power triangle shown in figure 4.1 is often used to illustrate the relation between
P, Q, S and the angle φ.

 Figure 4.1 The power triangle with the P, Q, S and φ (McHutchon, 2013)

The Power factor (PF) is an important number in power systems since it gives the relation between active
and reactive power as equation 4.6 shows (McHutchon, 2013).

 ( ) = = = 4.6

Since active power is the part that is sold there are lower amounts of sold power and therefore energy if the
PF is low. In order to maximize revenue, the PF should be as high as possible, this can be achieved by
penalizing customers for low power factor. Capacitors are used to provide reactive power to equipment
that absorbs a lot of reactive power. Capacitors can therefore decrease the supplied reactive power and
improve the PF. The cost of capacitors is weighed against the savings that are made due to the improvement
of PF (Rajan & Sekar, 2005).

4.1.2 The Swedish Electrical Grid
The electricity grid transports the electricity from the place of generation directly to the consumer.
Electricity can be transported large distances and the electricity that is produced must be consumed directly
since the transmission is almost instant. Due to this there must be the same production of electricity as
there is demand all the time, otherwise the system will collapse and blackouts will occur (Lindholm, 2018).

The Swedish electricity grid is divided into three parts which distributes electricity at different voltage levels.
The transmission network is the backbone of the electric grid which transports electricity over long
distances. Svenska Kraftnät is the responsible government body for the transmission network and do the
reinforcements needed. The transmission is mostly done with the voltage level of 400 kV alternating current
(AC) and otherwise 220 kV AC. The transmission network distributes the electricity down to the regional
networks which either transports it to consumers that require high amounts of electricity or to the smaller
local networks. The regional network is usually distributing electricity with voltage levels of 33 - 130 kV but
even lower levels can occur. Local networks distribute electricity to every consumer and the electricity must
be transformed down to voltage levels of 230/420V before it is distributed into the common electricity
outlet. This is done by net stations/substations which contains a transformer that reduces the voltage level
down to the low-voltage level of around 420V. Figure 4.2 shows the electricity network voltage levels and
layout of the system (SVK, 2017).

 11
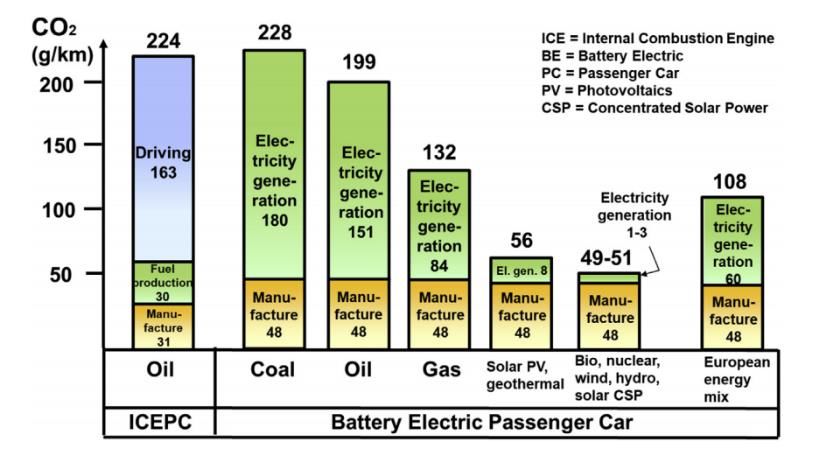
Figure 4.2 The electricity network system in Sweden shown from producers to consumers and the
 different components between with voltage levels indicated (Gode, 2016).

With the introduction of local electricity production such as wind and solar this layout generation in the
transmission grid is changing. For example, wind power is usually connected to the regional network with
voltage levels of 10-30kV (SVK, 2014).

The main reason for different levels of voltage is because the transmission losses and amount of cables are
reduced with higher voltage levels. The higher voltage levels used for transmission must then be
transformed in transformers down to usable voltage levels. To transfer the same amount of effect at a
voltage level of 220 kV as the 400kV level there needs to be 4-8 times more cables. Due to this economic
factor and losses 400 kV is used as standard on the transmission network. Airborne cables are used since
they are easier to repair, cheaper and longer life expectancy compared to cables that are buried (SVK, 2017).

4.2 Power Flow Analysis
Calculating the load flow in an electric grid network is the result of several equations that are nonlinear.
The resulting power flow in a network is resolved by the impedances of the cables between buses and
voltage at each bus. Impedance is the AC equivalent of resistance which is used for DC networks. The sum
of power flows out of and into each bus consist of the power flow of all the cables connected to that bus.
Finding the set of voltages together with the network impedances for each bus produces the load flow
problem and results in the correct load flows. The first step to solve a power system is viewing it as a
collection of buses, linked together by cables. At each bus there is a possibility of equipment that either
remove or supply power to the system (Kirtley, 2011).

Different algorithms to solve these equations are used in the literature. The Newton-Raphson iterative
method is one of the most common approaches to solving a power flow problem, iterating until a solution
is found. Other used methods are the Gauss-seidel iterative technique and the backward/forward sweep
approach. The iterative methods need initial values for the voltage vector, consisting of magnitude and an
angle. This thesis used the program Pandapower to solve the power flow equations set up by the network
(Thurner et al. 2018).

4.3 Plug-In Electric Vehicles
In modern history there has been a change of perspective on the future of automobile industry. There are
several factors that have contributed to this change, mainly the 2008 financial crisis, the fluctuating oil prices
and the shift of awareness of the environmental impact. These factors all lead to the realization that internal
combustion engine vehicles (ICEVs) will be replaced, probably by PEVs, partly due to low efficiency and

 12
You can also read