Anthropocene climate warming enhances autochthonous carbon cycling in an upland Arctic lake, Disko Island, West Greenland - Biogeosciences
←
→
Page content transcription
If your browser does not render page correctly, please read the page content below
Biogeosciences, 18, 2465–2485, 2021
https://doi.org/10.5194/bg-18-2465-2021
© Author(s) 2021. This work is distributed under
the Creative Commons Attribution 4.0 License.

Anthropocene climate warming enhances autochthonous carbon
cycling in an upland Arctic lake, Disko Island, West Greenland
Mark A. Stevenson1,2,a , Suzanne McGowan1 , Emma J. Pearson3 , George E. A. Swann1 , Melanie J. Leng4,5 ,
Vivienne J. Jones6 , Joseph J. Bailey1,7,b , Xianyu Huang8 , and Erika Whiteford9,10,c
1 Centre for Environmental Geochemistry, School of Geography, University of Nottingham, University Park,
Nottingham, NG7 2RD, UK
2 School of Natural and Environmental Sciences, Newcastle University, Newcastle-upon-Tyne, NE1 7RU, UK
3 School of Geography, Politics and Sociology, Newcastle University, Newcastle-upon-Tyne, NE1 7RU, UK
4 National Environmental Isotope Facility, British Geological Survey, Keyworth, Nottingham, NG12 5GG, UK
5 Centre for Environmental Geochemistry, School of Biosciences, University of Nottingham,

Sutton Bonington Campus, Leicestershire, LE12 5RD, UK
6 Environmental Change Research Centre, Department of Geography, University College London, London, WC1E 6BT, UK
7 Geography Department, York St John University, YO31 7EX, York, UK
8 State Key Laboratory of Biogeology and Environmental Geology and School of Geography and Information Engineering,

China University of Geosciences, Wuhan 430078, China
9 Department of Geography, Loughborough University, Loughborough, LE11 3TU, UK
10 School of Science and Technology, Nottingham Trent University, Nottingham, NG11 8NS, UK
a Present address: School of Natural and Environmental Sciences, Newcastle University, Newcastle-upon-Tyne, NE1 7RU, UK
b Present address: Geography Department, York St John University, YO31 7EX, York, UK
c Present address: School of Science and Technology, Nottingham Trent University, Nottingham, NG11 8NS, UK

Correspondence: Mark A. Stevenson (mark.stevenson@newcastle.ac.uk)

Received: 22 September 2020 – Discussion started: 29 October 2020
Revised: 27 January 2021 – Accepted: 14 February 2021 – Published: 19 April 2021

Abstract. The Arctic is rapidly changing, disrupting biogeo-       mentary carbon/nitrogen (C/N) ratios, the C isotope com-
chemical cycles and the processing, delivery and sedimen-          position of organic matter (δ 13 Corg ) and biomarker ratios
tation of carbon (C), in linked terrestrial–aquatic systems.       (n-alkanes, n-alkanols, n-alkanoic acids and sterols) showed
In this investigation, we coupled a hydrogeomorphic assess-        that sedimentary organic matter (OM) in these lakes is mostly
ment of catchment soils, sediments and plants with a recent        derived from aquatic sources (algae and macrophytes). We
lake sediment sequence to understand the source and qual-          used a 210 Pb-dated sediment core to determine how carbon
ity of organic carbon present in three Arctic upland lake          cycling in a lake–catchment system (Disko 2) had changed
catchments on Disko Island, located just south of the low–         over recent centuries. Recent warming since the end of the
high Arctic transition zone. This varied permafrost landscape      Little Ice Age (LIA ∼ 1860 CE), which accelerated after ca.
has exposed soils with less vegetation cover at higher alti-       1950, led to melt of glacier ice and permafrost, releasing
tudes, and lakes received varying amounts of glacial melt-         nutrients and DOC to the lake and stimulating pronounced
water inputs. We provide improved isotope and biomarker            aquatic algal production, as shown by a > 10-fold increase
source identifications for palaeolimnological studies in high-     in β-carotene, indicative of a major regime shift. We also
latitude regions, where terrestrial vegetation is at or close to   demonstrate that recent increases in catchment terrestrial
its northerly and altitudinal range limit. The poorly devel-       vegetation cover contributed to the autochthonous response.
oped catchment soils lead to lake waters with low dissolved        Our findings highlight that in Arctic lakes with sparsely de-
organic carbon (DOC) concentrations (≤ 1.5 mg L−1 ). Sedi-         veloped catchment vegetation and soils, recent Anthropocene

Published by Copernicus Publications on behalf of the European Geosciences Union.
2466                                                             M. A. Stevenson: Climate warming enhances carbon cycling

warming results in pronounced changes to in-lake C process-         chains of macrophytes, and longer chains of terrestrial plant
ing and the deposition of more reactive, predominately au-          input (Cranwell et al., 1987; Meyers, 2003; Ficken et al.,
tochthonous C, when compared with extensively vegetated             2000), while pigments (e.g. β-carotene) are effective au-
low-Arctic systems.                                                 totroph biomarkers (McGowan, 2013). The type and quality
                                                                    of terrestrial OC supplied to lakes change microbial com-
                                                                    munities and may ultimately regulate whether lakes are CO2
                                                                    sources or sinks (Jansson et al., 2000; Kortelainen et al.,
1   Introduction                                                    2013).
                                                                       Palaeoenvironmental records from lakes integrate carbon
The carbon (C) stored and cycled in permafrost, soils and           from the lake and catchment and allow the reconstruction of
lake sediments of Arctic landscapes is a vital component            variability of C cycling on timescales that would otherwise
of the terrestrial C budget (Hugelius et al., 2014; Ander-          be unobtainable (Leavitt et al., 1989, 2009). Palaeolimnol-
son et al., 2019), but Arctic ecosystems are changing rapidly       ogy of Arctic lakes can be used to help estimate C burial
(Saros et al., 2019). Climate warming in Arctic regions             rates over the Holocene (Anderson et al., 2009, 2019) and
(Smol and Douglas, 2007) can change the ecosystem struc-            to understand how lakes in different regions process terres-
ture of catchments and lakes with probable implications for         trial OM (McGowan et al., 2018). Investigations of carbon
landscape-scale C cycling (Anderson et al., 2018). In par-          cycling across the transition between the cooler Little Ice
ticular, changes in vegetation quantity and quality associ-         Age (LIA) and warmer recent conditions in the Arctic pro-
ated with long-term climate shifts can influence soil devel-        vide a way of understanding how Arctic systems respond to
opment (Wookey et al., 2009) and C transfer between ter-            climate change. Lacustrine records from close to the Jakob-
restrial and aquatic environments. “Arctic greening”, where         shavn Isfjord, near Ilulissat, east of Disko suggest that the
warmer temperatures have enhanced terrestrial vegetation            lowest Holocene temperatures occurred here in the 19th cen-
growth (Arndt et al., 2019), or “Arctic browning”, where            tury (LIA) (Axford et al., 2013; Briner et al., 2016), rising in
changing climate regimes such as drought and winter warm-           the early 20th century (Box et al., 2009; Yamanouchi, 2011)
ing can reduce vegetation productivity (Phoenix and Bjerke,         and accelerating with recent warming (Hanna et al., 2012).
2016), has the potential to alter primary production in lakes          Qeqertarsuaq (Disko Island, West Greenland) is situated
(McGowan et al., 2018), with associated implications for C          in a low-Arctic region, just south of the high-Arctic tran-
cycling. Warming also leads to glacial recession, increas-          sition zone, and has a heterogeneous cover of herbaceous
ing meltwater discharge into Arctic watersheds (Slemmons            plants and bryophytes and several glaciers. This paper in-
et al., 2013). Arctic regions lying close to the high-Arctic–       vestigates the organic geochemistry of OM in the catch-
low-Arctic transition zone (below 75◦ N latitude in western         ments and lake sediments on Disko Island to identify how
Greenland; Daniels and De Molenaar, 1993) are likely to             terrestrial and aquatic δ 13 Corg biomarkers (C/N ratios and
experience particularly marked shifts in C cycling. Charac-         δ 13 Corg /δ 13 CFAMEs , chlorophyll and carotenoid pigments)
terised by the presence (low Arctic) or absence (high Arctic)       can be interpreted as palaeoenvironmental proxies in this
of vegetation, warming may push marginal ecosystems into            sparsely vegetated Arctic region. By investigating sites span-
different ecological states (Corell et al., 2013).                  ning different catchment sizes, vegetation cover and proxim-
   Accurate methods for tracing how the quality and trans-          ity to glacial features, we aim to understand how these ter-
fer of C are changing across catchment–lake systems are             restrial factors influenced lake water quality and OC compo-
required for predicting broader-scale future impacts on the         sition to ultimately be archived in the sediment record. We
Arctic C cycle (with global implications), for which geo-           use this information to guide the interpretation of a sedi-
chemical analyses of lake–catchment samples are especially          ment sequence from one lake spanning the transition from
insightful (Karlsson et al., 2009; Lapierre and del Giorgio,        the LIA towards warmer conditions after 1950 to help under-
2012; McGowan et al., 2018). Previous studies in Greenland          stand how pronounced climate warming can alter terrestrial–
have used δ 13 Corg and C/N to track particulate catchment in-      aquatic carbon cycling.
puts (Anderson et al., 2018; Leng et al., 2012), but due to
their narrow ranges with some specimens, using these tech-
niques in isolation cannot always distinguish source identi-        2     Materials and methods
ties (Lacey et al., 2018; Holtvoeth et al., 2016). Here we
additionally use lipid biomarker chain length compositions          2.1    Study area
and the C isotopic composition of fatty acid methyl esters
(FAMEs) as a potential solution to this challenge (Castañeda        Qeqertarsuaq (Disko Island) (Fig. 1) is located within Disko
and Schouten, 2011). These techniques, which have been              Bay, a large marine embayment between 69◦ 150 –70◦ 200 N
rarely applied in high-latitude lake catchments, can provide        and 51◦ 500 –55◦ 000 W. Disko is the largest island to the west
additional understanding because shorter chains are typi-           of Greenland (8575 km2 ) and is extensively glaciated with
cally indicative of algae and photosynthetic bacteria, mid-         the main Sermersuaq (Storbræe) and Bræpasset ice caps

Biogeosciences, 18, 2465–2485, 2021                                                     https://doi.org/10.5194/bg-18-2465-2021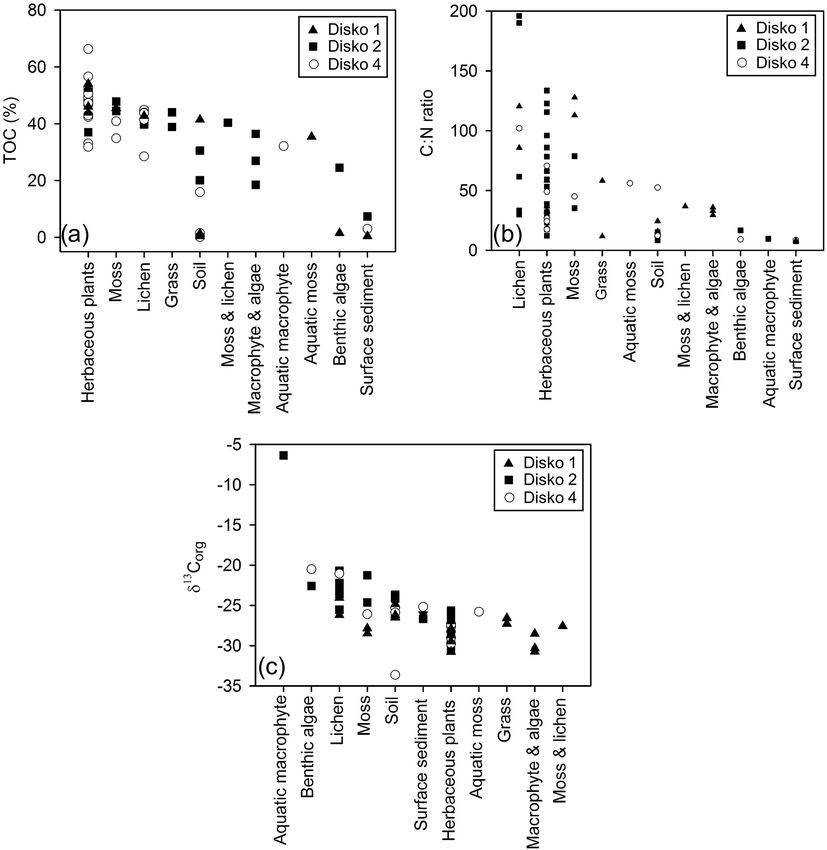
M. A. Stevenson: Climate warming enhances carbon cycling                                                                     2467

covering the central plateaus. The geology is composed             plants and total bare ground) was estimated, with key plant
of 5000 m deep and 60 million years old Tertiary basalts,          species identified following Rune (2011).
part of the Disko–Nussuaq surge cluster (Chalmers et al.,
1999; Humlum, 1996). There are prominent U-shaped val-             2.2.2    Water chemistry analysis
leys, cirques, talus slopes and fjords. Vegetation at a low al-
titude includes verdant dwarf shrub heaths in well-drained         Water samples were filtered in the field using Whatman G/C
sites and small mires in wet or snowpack-fed localities (Ben-      filter papers, refrigerated and taken back to the laboratory for
nike, 1995). Salix glauca is the dominant shrub, and sparser       analysis. Filter papers were wrapped in foil, sealed in poly-
fell-field vegetation is present at higher elevations (Callaghan   thene and stored at −20 ◦ C for chlorophyll and carotenoid
et al., 2011).                                                     (pigment) and trichromatic chlorophyll a analyses. TP (total
   Disko Island has been subject to recent climate change,         phosphorus), SRP (soluble reactive phosphorus) and NH4 -N
with a warming trajectory since the end of the LIA and at          (ammonium) concentrations were measured by colorimetry
an increasing rate since the 1990s (Box, 2002; Hansen et al.,      using the methods in Mackereth et al. (1978). DOC was mea-
2006). This has been confirmed locally by tree ring evidence       sured using a Shimadzu TOC-VCSN analyser, with DOC
of winter warming (Hollesen et al., 2015) and both locally         calculated as the sum of organically bound C present in wa-
and regionally by instrumental records (Hanna et al., 2012;        ter that originates from compounds which can pass through a
Hansen et al., 2006). Mechanistically, warming has con-            0.45 µm filter. Total nitrogen (TN) was additionally analysed
tributed to the destabilisation of permafrost soils (Rowland       for the summer 2013 samples using a Ganimede TN analyser
et al., 2010) and retreat of catchment ice (including glaciers)    by alkaline digestion with peroxodisulfate.
(Anderson et al., 2017), releasing nutrients into downstream
                                                                   2.3     Sediment core collection and chronology
lakes. Old C released from melting catchment permafrost
(Pautler et al., 2010; Schuur et al., 2009) could be one such      In April 2013 sediments were sampled from Disko 2 and
source of C entering the lakes (as Disko is in a known per-        Disko 4 (Table 1) by drilling through lake ice using a HON-
mafrost active layer monitoring zone; Humlum et al., 1999),        Kajak corer. Disko 2 was selected for intensive study due
along with minor contributions of catchment bryophytes and         to its well-dated sediment sequence. Sediment samples were
plant vegetation, evidenced by lipid ratios contributing to        extruded at 0.5 cm intervals, and water samples were taken
sedimentary C.                                                     under the lake ice at a depth of 1 m. The core (Disko 2
                                                                   K1; length of core 31.5 cm) was analysed for 210 Pb, 226 Ra,
2.2     Hydro-geomorphological survey and catchment                137 Cs and 241 Am by direct gamma assay using an OR-
        sampling                                                   TEC HPGe GWL Series well-type coaxial low-background-
                                                                   germanium detector at the Environmental Change Research
Three lakes (named Disko 1, 2 and 4), spanning a range             Centre, University College London. Total 210 Pb was mea-
of altitudes (214 to 575 m) and catchment sizes (358 to            sured by gamma emissions at 46.5 keV, with 226 Ra by the
1829 ha), were visited in April and August 2013 (Fig. 1c).         combined daughter isotope emissions of 295 and 325 keV
In April, catchment soils and plants were sampled from ex-         to infer “supported” 210 Pb (Fig. S1a in the Supplement).
                                                                   137 Cs and 241 Am were measured at 662 and 59.5 keV (Ap-
posed snow-free areas using a trowel into plastic bags. Fur-
ther sampling was conducted in August 2013 to collect addi-        pleby et al., 1986), with absolute efficiencies determined by
tional catchment soils, plants, benthic rock-scrape algae and      comparison with standards (Fig. S1b). The constant rate of
                                                                   210 Pb supply (CRS) model was used because slight depar-
lake edge water samples (lake edge, ∼ 3–5 m) for nutrient,
DOC and pigment analysis.                                          tures from a monotonic declining trend in 210 Pb activity in-
                                                                   dicated variable sediment supply. A composite age–depth
                                                                   model was produced using the 1963 peak in 137 Cs and 241 Am
2.2.1    Vegetation composition surveys
                                                                   from radioactive fallout at 3.25 cm, as the 210 Pb placed this
                                                                   slightly earlier at 5 cm and so was corrected by 1.75 cm at
Field notes, aerial imagery (Landsat and QuickBird through         this point in line with radiometric dating convention (Ap-
Google Earth) and mapping (Disko Island, Qeqertarsuaq 1 :          pleby, 2001) (Fig. 6). Estimated ages in the extrapolated part
100 000 hiking map) were combined to estimate the percent-         of the core (below 10 cm) are assumed to have the same error
age cover of alpine vegetation, bare ground, snow cover and        (±18 years) as the final measured sample in 1845 CE. The or-
glaciers present in each lake catchment (including defining        ganic carbon mass accumulation rate (CMAR) was obtained
catchment boundaries) by manually delineating the areas us-        by multiplying the dry mass accumulation rate (DMAR) by
ing the 2D area function in Google Earth Pro 7. In each lake       the decimal of TOC (Fig. S3 in the Supplement).
catchment up to five 10 m × 10 m plots were surveyed for
vegetation cover, within which five 1 m × 1 m quadrats were
placed randomly and photographed, and the percentage cover
of plant functional types (defined as total moss/lichen, total

https://doi.org/10.5194/bg-18-2465-2021                                                   Biogeosciences, 18, 2465–2485, 2021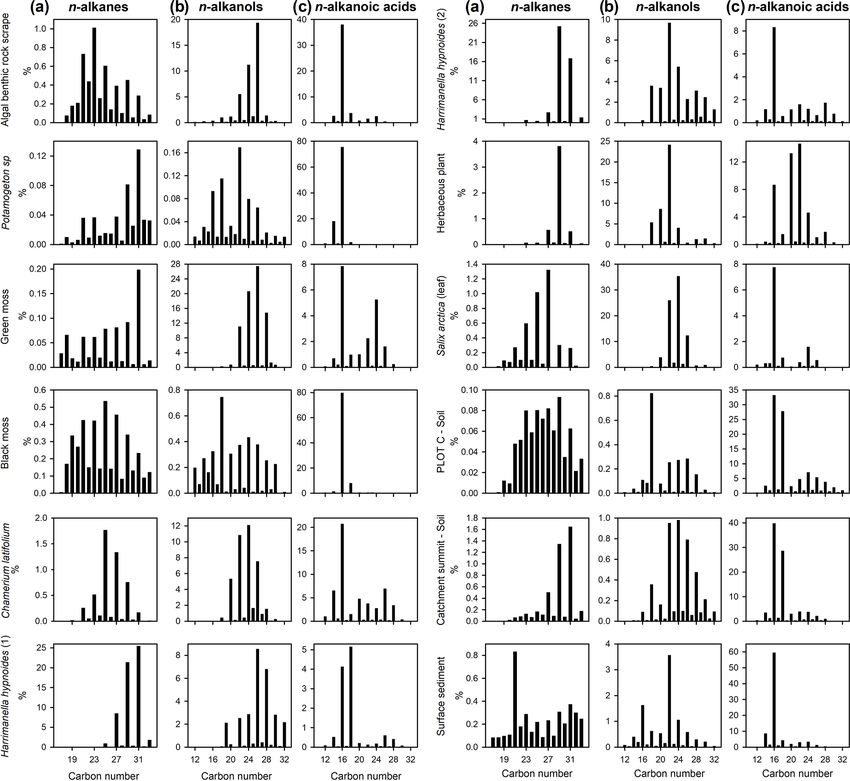
2468                                                                           M. A. Stevenson: Climate warming enhances carbon cycling

Figure 1. (a) Location of Disko Island and study area (indicated) in West Greenland. (b) Location of Disko Island relative to Greenland. (c)
Location of study catchments to the north of Qeqertarsuaq and Disko Island. See Stevenson (2017) for local catchment maps.

Table 1. Key lake characteristics. Presented in descending elevation order.

                                                             Disko 2                              Disko 1                        Disko 4
 Lake coordinates                              69◦ 23.3420 N, 53◦ 24.0850 W         69◦ 21.2040 N, 53◦ 29.4210 W     69◦ 17.8410 N, 53◦ 48.5480 W
 Elevation (m a.s.l.)                          575                                  299                              214
 Lake type                                     Cirque lake                          U-shaped valley bottom lake      Valley-end lake
 Outflow type                                  Over scree-covered shallow           Wide braided wetland outflow –   Direct outflow
                                               wetlands                             more marked channel ∼ 50 m d/s
 Total catchment area (ha)                     358                                  1455                             1829
 Imagery-derived vegetation (ha)               46                       13 %        569                     39 %     497                     27 %
 Imagery-derived bare earth/rock (ha)          284                      79 %        650                     45 %     1250                    68 %
 Imagery-derived permanent ice/glacier (ha)    17                        5%         203                     14 %     67                      3.6 %
 Vegetation-survey-derived total moss/lichen   27.3 %                               37.5 %                           37.0 %
 Vegetation-survey-derived total plants        19.2 %                               32.7 %                           44.4 %
 Vegetation-survey-derived total bare ground   53.5 %                               29.8 %                           18.6 %
 Catchment : lake area ratio                   45 : 1                               66 : 1                           122 : 1
 Outflow type                                  Over scree-covered shallow           Wide braided wetland outflow –   Direct outflow
                                               wetlands                             more marked channel ∼ 50 m
                                                                                    downstream

Biogeosciences, 18, 2465–2485, 2021                                                                    https://doi.org/10.5194/bg-18-2465-2021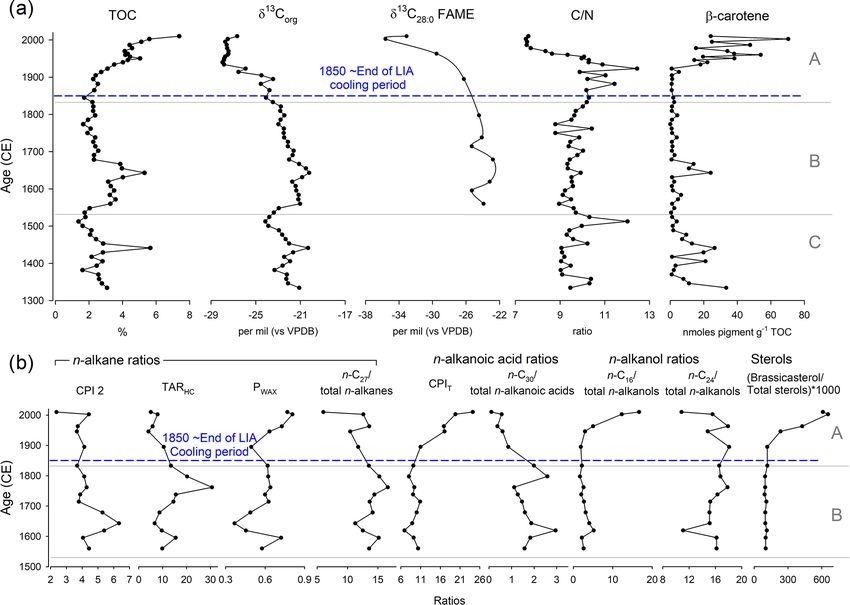
M. A. Stevenson: Climate warming enhances carbon cycling                                                                    2469

2.4     Geochemical analyses                                        2.4.3    Lipid biomarker analysis

2.4.1    Chlorophyll and carotenoid pigment analysis                Lipid compounds were extracted from freeze-dried and
                                                                    homogenised plant, benthic macroalgae, soil and sedi-
Chlorophyll a (chl a) was measured spectrophotometrically           ment samples from Disko 2 using 15 mL HPLC grade 3 :
against an extraction solvent blank, after extracting What-         1 CH2 Cl2 : CH3 OH and a MARS 5 microwave system
man G/C filter residues in acetone overnight (Jeffrey and           (CEM Microwave Technology, UK). The total lipid ex-
Humphrey, 1975). Filtered residues from Whatman GF/F                tracts (TLEs) were dried under N2 and saponified using
(0.45 µm pore size) and freeze-dried sediments were ex-             6 % KOH in CH3 OH, and the neutral compounds were
tracted in an acetone, methanol and water mixture (80 : 15 :        separated using hexane (after Pearson et al., 2011). Ex-
5), filtered using a 0.22 µm polytetrafluoroethylene (PTFE)         cess salts were removed from the neutral fraction us-
filter, dried under N2 gas and re-dissolved into injection so-      ing CH2 Cl2 -extracted ultrapure H2 O. The neutral fractions
lution, prior to analysis on an Agilent 1200 series high-           were derivatised using bis(trimethylsilyl)trifluoroacetamide
performance liquid chromatography (HPLC) unit using a               (BSTFA) to form trimethylsilyl esters prior to analysis by gas
ODS Hypersill column (250 mm × 4.6 mm; 5 µm particle                chromatography–mass spectrometry (GC–MS). Following
size) and a photo-diode array detector (350–750 nm). Sep-           the removal of the neutral compounds, the remaining extract
aration conditions are detailed in McGowan et al. (2012).           was acidified with HCL, and the acid fraction was subse-
Pigments were identified and quantified from the chro-              quently separated using hexane. Prior to analysis by GC–MS,
matograms by comparing retention times and spectral char-           the isolated acid fraction was esterified using BF3 /MeOH,
acteristics with calibration standards (DHI Denmark).               and the fatty acid methyl esters (FAMEs) were extracted us-
                                                                    ing C6 H14 . Neutral and FAME samples were analysed using
2.4.2    Bulk δ 13 C and C/N analysis                               an Agilent 7890A GC coupled to a 5975C MS. Samples were
                                                                    injected in pulsed splitless mode at 280 ◦ C in CH2 Cl2 us-
δ 13 Corg and C/N analyses were conducted on sediment core,         ing a HP DB5-MS (30 m × 0.25 mm i.d.: 0.25 µm film thick-
soil and vegetation samples. Sediment core and soil samples         ness) column and a temperature programme, and compound
were pre-treated in excess 5 % HCl (hydrochloric acid), dried       identification and quantification were performed following
and homogenised with an agate pestle and mortar. Plants             Pearson et al. (2007). Diagnostic lipid ratios and equations
and bryophyte samples were placed in 5 % HCl for 5 min              were selected based on those which were most informative
to remove carbonates, checked for a visible reaction, washed        in the catchment study to interpret changes in source inputs
in deionised H2 O, dried and ground to powder by freezer            (Fig. 5) and down-core changes in OM source and reactivity
milling using liquid nitrogen. TOC, TN (from which we cal-          (Fig. 7b).
culated C/N ratios) and δ 13 Corg analyses were performed
at the British Geological Survey online using a Costech             2.4.4    Compound-specific isotope analysis
ECS4010 elemental analyser (EA) coupled to a VG Triple
                                                                    Compound-specific δ 13 C was obtained by injecting FAME
Trap and a VG Optima dual-inlet mass spectrometer. δ 13 C
                                                                    acid fractions spiked with squalene in splitless mode into a
values were calibrated to the VPDB (Vienna Pee Dee Belem-
                                                                    Thermo Finnigan Trace GC coupled to a Thermo Finnigan
nite) scale using within-run laboratory standards (BROC2
                                                                    Delta Plus XP isotope ratio mass spectrometer using a com-
and SOILB) calibrated against NBS-18, NBS-19 and NBS-
                                                                    bustion interface (GC–C-IRMS) according to conditions in
22. Analytical precision of δ 13 Corg was to within ± < 0.1 ‰
                                                                    Huang et al. (2018). Samples were run in at least duplicate,
(1 SD). C/N is presented as the weight ratio. To facili-
                                                                    with reproducibility achieved to at least ±0.5 ‰ (SD). An n-
tate statistical analysis, samples were grouped into aquat-
                                                                    alkane standard was used as a within-run laboratory standard
ics, core sediments, terrestrial vascular plants and “terrestrial
                                                                    with known δ 13 C values (Chiron, Norway) and daily com-
other”, with significant differences examined using one-way
                                                                    bined isotopic reference samples from C12 to C32 (Indiana
ANOVA. Post-hoc Tukey HSD was confirmed using Welch’s
                                                                    University). δ 13 C values were relative to the VPDB (‰), and
t test. An isotopic mixing model based on a Bayesian frame-
                                                                    corrections were made for the additional C atoms introduced
work was developed using SIAR V4 (Stable Isotope Anal-
                                                                    by BF3 -MeOH derivatisation (Boschker et al., 1999).
ysis in R) (Inger et al., 2010) in R (v3.5.2) (R Core Team,
2020) to couple catchment δ 13 Corg and C/N ratio as source
data with down-core measurements (grouped by sedimentary            3     Results
zone). Proportional boxplots were produced for both broad
catchment groups (terrestrial other, vascular plant and aquat-      3.1     Hydro-geomorphology and vegetation surveys of
ics) and at the finer species level (Figs. S4–S7 in the Sup-                lake catchments
plement). Trophic enrichment factors were set at a mean of
1.63 ‰ and standard deviation of 0.63 ‰ for δ 13 C (Inger           The highest-elevation cirque lake (Disko 2) had the least
et al., 2010), with a value of zero used for C/N ratio.             imagery-derived catchment vegetation and the smallest

https://doi.org/10.5194/bg-18-2465-2021                                                   Biogeosciences, 18, 2465–2485, 2021
2470 M. A. Stevenson: Climate warming enhances carbon cycling
catchment: lake area (CA : LA) ratio (Table 1, Fig. 2). The lichen, moss and soil samples that had higher δ 13 Corg values
U-shaped valley bottom lake (Disko 1) with a moderately (∼ −20 ‰ to −23 ‰) (Fig. 4). Benthic macroalgae samples
sized CA : LA ratio had the highest proportion of imagery- had δ 13 Corg values around −25 ‰. Lake sediment core sam-
derived vegetation cover. The lowest elevation valley-end ples from Disko 2 and 4 had low C/N ratios (7.5 to 18.4),
lake (Disko 4) was located < 2 km from to the coast and had and δ 13 Corg values ranged from −28 ‰ to −20 ‰. Statistical
moderate imagery-derived vegetation cover and the highest analyses demonstrated that C/N ratios of terrestrial vascu-
CA : LA ratio. All lakes had permanent glacial ice present in lar plants were significantly different from aquatics and lake
the catchment, but this coverage was greatest in the catch- sediments, and terrestrial other also differed from lake sed-
ment of Disko 1, which is fed directly by the Lyngmarks- iments (Table 3). There was more overlap in δ 13 Corg , and
bræen ice cap (Fig. 1c). Close to the lake margins, plant cover so terrestrial vascular plant measurements were only signif-
(assessed by vegetation transects) was highest at Disko 4 and icantly different to core sediments and terrestrial other (Ta-
lowest at Disko 2 (Table 1). Detailed vegetation composition ble 3; Fig. 4). Compound-specific δ 13 CFAMEs values tended
surveys are available in Table S1 in the Supplement. to become progressively lower (more negative) for higher-
chain-length fatty acids than shorter chains, compared with
3.2 Water chemistry bulk δ 13 Corg (Fig. S3).
In all lakes, soluble reactive phosphorus (SRP) concentra- 3.4 Lipid distributions and ratios from the Disko 2
tions were higher in April than in August, with the highest catchment
levels in Disko 1 and lowest in Disko 2 (Table 2). Seasonal
total phosphorus (TP) concentrations in Disko 1 were similar Lipid histograms of n-alkane, n-alkanol and n-alkanoic
in April (67.9 µg L−1 ) and August (67.8 µg L−1 ) but declined acid distributions from Disko 2 (Figs. 5 and S2) showed
in Disko 2 (from 37.5 µg L−1 in April to 2.9 µg L−1 in Au- that n-alkane samples displayed an odd-over-even pre-
gust) and Disko 4 (164.8 µg L−1 in April to 2.9 µg L−1 in Au- dominance whereas n-alkanols and n-alkanoic acids were
gust). Dissolved inorganic nitrogen (DIN) was present pre- even-dominated, as expected for naturally derived samples
dominantly as nitrate (NO3 -N), which was highest in Disko 1 (Bianchi and Canuel, 2011). Proportionately (given limi-
(0.05 µg L−1 in August) and lowest in Disko 2 (0.01 µg L−1 tations of single ion filtering) n-alkanoic acids were the
in April) whereas NH+ 4 -N concentrations were below detec- most abundant (mean 56.7 %; range 11.7 %–98.8 %) fol-
tion limits, except in August in Disko 1 and Disko 2 (11.54 lowed by n-alkanols (mean 31.5 %; range 0.8 %–83.5 %) and
and 3.15 µg L−1 respectively). DOC was low in all lakes in n-alkanes (mean 11.8 %; range 0.5 %–59.0 %). Differentia-
both April and August; the highest values were recorded in tion between catchment samples was possible; for example
April for Disko 4 (1.5 mg L−1 ). Biomarker pigments in the among n-alkanes the algal benthic rock scrape sample was
water column of all lakes in August (ice-free conditions) dominated by n-C23 , while for Potamogeton sp. and green
were characterised by high concentrations of pheophytin b moss, n-C31 was dominant. Herbaceous plants like Harri-
(0.95 nmol L−1 ), a chlorophyll b derivative from chloro- manella hypnoides tended to be dominated by n-C29 or n-
phytes, euglenophytes and higher plants and lower concen- C31 while dominant chain lengths were slightly shorter in
trations of diatoxanthin from siliceous algae. Diatoxanthin Salix arctica (n-C27 ).
concentrations were much higher in Disko 1 (0.63 nmol L−1 ) Soil sample n-alkane distributions were either clearly ter-
than in the other lakes (Disko 2, 0.05 nmol L−1 ; Disko 4, restrially influenced (e.g. catchment summit soil, dominant
0.08 nmol L−1 ). in n-C31 ) or more mixed (e.g. plot C soil sample, taken
close to the Disko 2 shoreline), and surface sediments also
3.3 TOC, C/N ratios and δ 13 C values (bulk and reflected mixed inputs with a slight odd predominance and
compound specific) of modern samples an extended range. n-Alkanols could also be used to differ-
entiate between samples, for example, dominance of n-C26
TOC content varied between a maximum of 66.3 % in herba- in the algal benthic rock scrape but n-C22 in Potamogeton
ceous plants and 0.1 % in soil and 0.5 % in lake surface sedi- sp. Higher plants were typically mid-chain dominant in n-
ment (Fig. 3a). C/N ratios varied most in lichens (from 25 alkanols (e.g. Harrimanella hypnoides with a maximum at
to nearly 200) and terrestrial plants (∼ 15 to ∼ 130) and either n-C26 or n-C22 and Salix arctica at n-C24 ), and the
were lowest in algae (9–17), aquatic macrophytes (9–36) and bimodal distribution of lake surface sediments suggests mul-
lake surface sediment samples (7.6–8.6) (Fig. 3b). δ 13 Corg tiple inputs. Although the algal benthic rock scrape and one
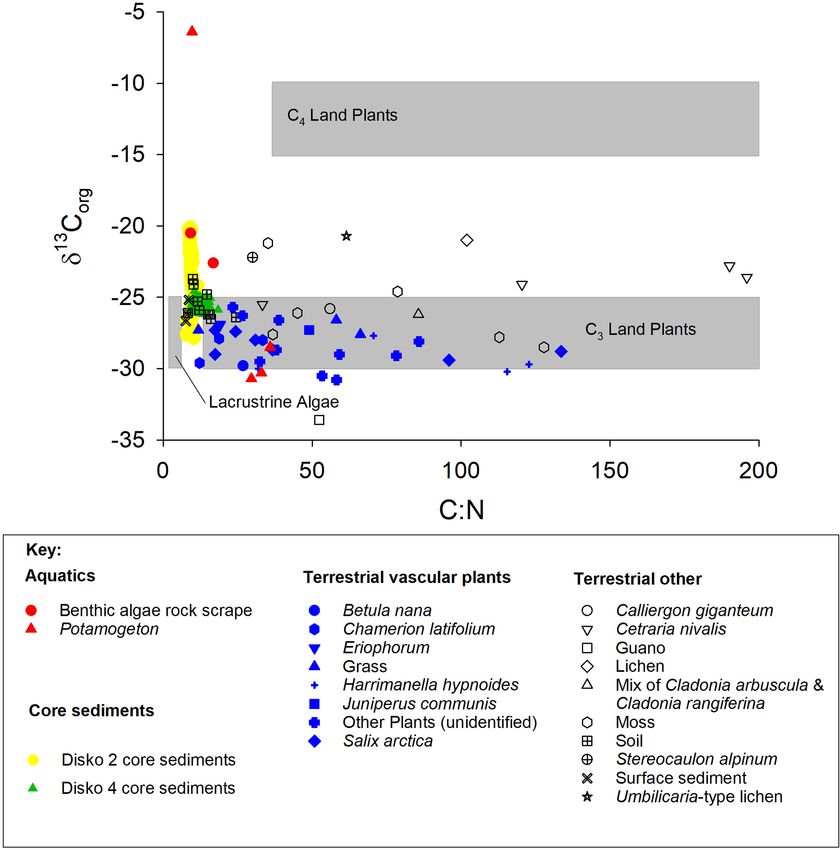
ranged between −6.4 ‰ and −33.6 ‰ (Fig. 3c). Compar- H. hypnoides sample had similar n-C26 alkanol dominance,
ing the C/N ratio and δ 13 Corg values, most samples plot- H. hypnoides also has higher-chain-length compounds which
ted across the ranges typical of C3 land plants and lacus- the algal benthic rock scrape does not, and the degree of
trine algae (Leng et al., 2012; Meyers and Teranes, 2001; dominance in the algal rock scrape (n-C26 ca. 20 %) is dif-
Anderson et al., 2018), with one outlying aquatic macro- ferent compared with H. hypnoides (n-C26 ca. 9 %), mak-
phyte sample (Disko 2, Potamogeton sp. −6.4 ‰) and some ing these compositions distinguishable. The n-alkanoic acid
Biogeosciences, 18, 2465–2485, 2021 https://doi.org/10.5194/bg-18-2465-2021M. A. Stevenson: Climate warming enhances carbon cycling 2471
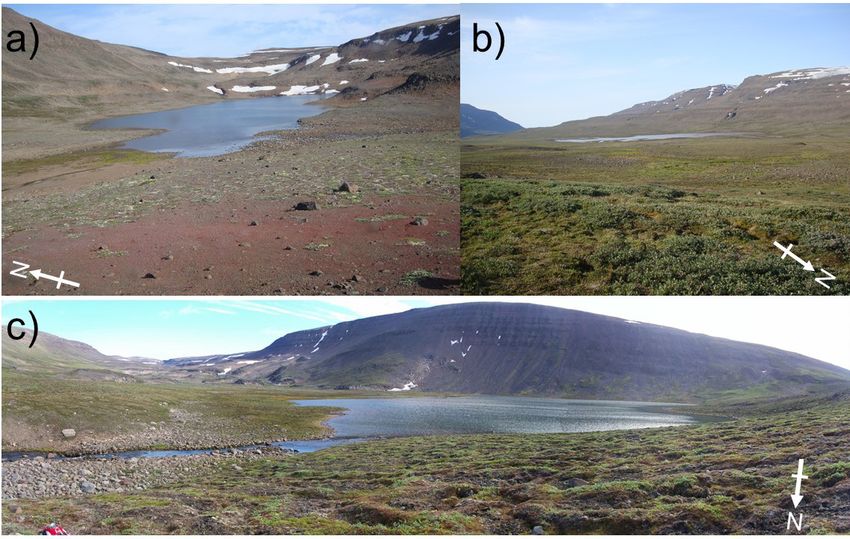
Figure 2. Images of study catchments and lakes on Disko Island in August 2013: (a) Lake Disko 2 (M. Stevenson); (b) Lake Disko 1
(M. Stevenson); (c) Lake Disko 4 (J. Bailey).
Table 2. Selected water chemistry spot samples from Disko Island lakes in April and August 2013. Dashes denote missing values; BDL:
below detection limit.
Lake Disko 2 Disko 1 Disko 4
2013 sampling April August April August April August
SRP (µg L−1 ) 10.5 0.7 59.8 13.8 16.3 1.9
TP (µg L−1 ) 37.5 2.9 67.9 67.8 164.8 2.9
NO3− (µg L−1 ) 0.01 0.04 0.05 0.03 0.02 0.04
NH+ −1
4 (µg L ) BDL 3.2 BDL 11.5 BDL BDL
Spectrophotometric chl a (µg L−1 ) 0.9 0.7 1.0 0.4 0.1 1.0
Total N (mg L−1 ) – BDL – BDL – BDL
DOC (mg L−1 ) 1.0 0.6 0.6 0.9 1.5 0.8
Diatoxanthin (nmol pigment L−1 ) – 0.05 – 0.63 – 0.08
Chlorophyll a (nmol pigment L−1 ) – 0.55 – 0.46 – 0.85
Pheophytin b (nmol pigment L−1 ) – 0.33 – 0.95 – 0.35
Date of collection 19 April 3 August 17 April 2 August 21 April 7 August
n-C16 was ubiquitous and abundant in all samples, but dis- to be a good indicator of terrestrial plants, terrigenous-to-
tributions still provided some differentiation, for example a aquatic ratio (TARHC ) is an excellent indicator of leafy vas-
secondary abundance in green moss around n-C24 , n-C22 in cular plants, PWAX indicates multiple terrestrial inputs and n-
the unidentified herbaceous plant sample, n-C24 in the Salix C27 is a good indicator of key plant species like Salix arctica
arctica (leaf) sample and n-C18 in the plot C soil sample. and Chamerion latifolium. Among n-alkanoic acids CPIT is
Lipid ratios for catchment and surface sediment samples a good indicator of aquatic macrophytes and mosses and n-
are provided in Table 4 with interpretation of source attribu- C30 of non-woody herbaceous terrestrial inputs. n-Alkanol
tion described in Table S2 in the Supplement. In this system indicator ratios are n-C16 for aquatic macrophytes and n-C24
the n-alkane ratios carbon preference index (CPI) 2 appear
https://doi.org/10.5194/bg-18-2465-2021 Biogeosciences, 18, 2465–2485, 20212472 M. A. Stevenson: Climate warming enhances carbon cycling
Figure 3. (a) TOC (%), (b) Corg : N ratio and (c) δ 13 Corg plotted against sample type, separated by lake catchment.
for woody terrestrial plants. The ratio of brassicasterol/total 24.1 nmol pigment g−1 TOC (Fig. 7a). In zone B around
sterols is a clear indicator of algae and moss. ∼ 1643 (±18) CE there were peaks in CPI 2 and decreases
in PWAX and the C26 n-alkanes, with increases in TARHC
3.5 Down-core changes in bulk and compound-specific around 1762 (±18) CE and ∼ 1653/1798 (±18) CE for the
isotopic and geochemical parameters C30 n-alkanoic acids (Fig. 7b).
The most pronounced changes in all geochemical prox-
ies were in zone A (1833 (±18)–2013 (±2) CE) which in-
Stratigraphic zones determined using optimal sum-of-
cludes the ∼ 1850 (±18) CE end of the LIA cooling pe-
squares partitioning were from 2010–1833 CE (Zone A),
riod (Fig. 7). TOC increased from < 2.3 % to 7.4 % by the
1833–1530 CE (Zone B) and 1530–1334 CE (Zone C). In
top of the core, while δ 13 Corg decreased from ∼ −23.5 ‰
zone C (1300–1530 (±18) CE) TOC generally declined from
to −28 ‰ by ∼ 1940 CE, where it remained stable to ∼
∼ 3 % to 1.4 %, except for a peak to ∼ 5.7 % around
2003 (±2) CE (Fig. 7a). δ 13 C28:0 FAME also decreased from
∼ 1440 (±18) CE, and δ 13 Corg ranged between −20.3 ‰
−26.3 ‰ in ∼ 1895 CE to −35.6 ‰ by ∼ 2003 (±2) CE
and −24.1 ‰ (Fig. 7a). C/N ratio ranged between 9 and
(Fig. 7a). In contrast, C/N increased fluctuations around
12 (reaching a higher value of ∼ 1510 (±18) CE), while
∼ 1923 (±6) CE (12.4) followed by a steep decline to ∼
β-carotene ranged between 1.1 and 33.3 nmol pigment g−1
7.5 by ∼ 1987 (±3) CE, while β-carotene increased 70-
TOC with a peak around ∼ 1440 (±18) CE (Fig. 7a). Zone B
fold (from 0.9 nmol pigment g−1 TOC in 1906 (±7) CE
(1530–1833 (±18) CE) proxies were relatively stable, except
to 70.4 nmol pigment g−1 by 2003 (±2) CE) (Fig. 7a). In
for an increase to ∼ 5 % TOC at ∼ 1640 (±18) CE, where
zone A PWAX , CPIT , C16 n-alkanol and the ratio of
δ 13 Corg was high (∼ −20.2 ‰) and β-carotene reached ∼
Biogeosciences, 18, 2465–2485, 2021 https://doi.org/10.5194/bg-18-2465-2021M. A. Stevenson: Climate warming enhances carbon cycling 2473
Figure 4. Corg /N vs. δ 13 Corg for catchment end-member samples and sediments from all three Disko catchment study areas. Grey shaded
regions show expected zones for C4 land plants, C3 land plants and lacustrine algae according to Meyers (2003).
brassicasterol/total sterols increased to the top of the core, 4 Discussion
whilst the C27 n-alkane, C30 n-alkanoic acid and C24 n-
alkanols declined, and CPI 2 and TARHC were both gener- 4.1 How is catchment and aquatic carbon structured
ally stable until the uppermost sample (Fig. 7b). Both DMAR on Disko?
and CMAR were characterised by a clear pulsed increase to
higher levels between ∼ 1930 and 1960 CE (Fig. S2).
The soil TOC content of the catchments was highly variable
SIAR isotopic mixing model analysis linking the catch-
(Fig. 3a). Local decomposition mediated by temperature and
ment with down-core δ 13 C and C/N ratios revealed higher
moisture can regulate Arctic soil loss or retention and litter
proportional densities (expressed in both histograms and
quality (Wookey et al., 2009). In Arctic regions generally,
boxplots) for vascular plants in group 1 (zone A 2013–
patchy organic soils indicate faster recycling rates or specific
1830 CE) than groups 2 (zone B 1830–1530 CE) and 3
local sources of OM controlled by the topographically var-
(zone C 1530–1300 CE) (Figs. S4 and S5). At the species
ied dynamic glacio-fluvial geomorphic system (Conant et al.,
level, although mixed, changes in Betula nana, Chamerion
2011; Castellano et al., 2015; Anderson et al., 2017). Vegeta-
latifolium, Eriophorum, guano and soil explain the most vari-
tion changed with elevation, with the highest lake (Disko 2)
ation in group 1 (zone A 2013–1830 CE), the most evidenced
catchment having more “bare ground” and rock/gravel sub-
by proportional histograms and boxplots (Figs. S6 and S7).
strates (Table 1). The terrestrial plant species we observed are
For both groups 2 (zone B 1830–1530 CE) and 3 (zone C
common on Disko (e.g. Callaghan et al., 2011; Daugbjerg,
1530–1300 CE), although mixed, the aquatic group is the
2003) and other parts of West Greenland (Fredskild, 2000),
most important with benthic algae being the greatest contrib-
but the plant communities were less species-rich than in other
utor.
lowland areas of Disko (Tables 1 and S1) (Callaghan et al.,
2011). The woody species Betula nana and Juniperus com-
https://doi.org/10.5194/bg-18-2465-2021 Biogeosciences, 18, 2465–2485, 20212474 M. A. Stevenson: Climate warming enhances carbon cycling
Table 3. Significant differences between pairings using parametric ANOVA post-hoc Tukey and non-parametric Mann–Whitney U .
ANOVA post-hoc Man–Whitney U Significant for both
Tukey parametric and
p adj p value non-parametric tests?
C/N
Core sediments vs. aquatics 0.48 0.01 ×
Terrestrial other vs. aquatics < 0.01 0.31∗ ×
Terrestrial vascular plants vs. aquatics 0.01 0.03 X
Terrestrial other vs. core sediments < 0.001 < 0.001 X
Terrestrial vascular plants vs. core sediments < 0.001 < 0.001 X
Terrestrial vascular plants vs. terrestrial other 0.94 0.30∗ ×
δ 13 Corg
Core sediments vs. aquatics 0.51 0.74 ×
Terrestrial other vs. aquatics 0.15 1∗ ×
Terrestrial vascular plants vs. aquatics < 0.001 0.46 ×
Terrestrial other vs. core sediments 0.22 0.03 ×
Terrestrial vascular plants vs. core sediments < 0.001 < 0.001 X
Terrestrial vascular plants vs. terrestrial other < 0.001 < 0.001 X
Significant differences (p < 0.05) are bold.
∗ Cannot compute exact p value with ties.
munis were uncommon and only present in the Disko 4 catch- highest glacier cover as part of the Lyngmarksbræen ice cap
ment (Table S1) probably because it is more sheltered with is present in the catchment and so the water chemistry is dif-
better drained soils than the other sites and located closer to ferent to Disko 2 and 4. High-summer-nutrient conditions in
the high diversity of the coast (Callaghan et al., 2011; Holle- Disko 1 (Table 2: SRP 13.8 µg L−1 , TP 67.9 µg L−1 and NH+ 4
sen et al., 2015). 11.5 µg L−1 ) are probably linked to the catchment glacier
Differences in vegetation cover, soil development and source, which can influence algal production and community
glacial meltwaters appeared to influence water chemistry composition (Slemmons and Saros, 2012). Glacier outwash
and aquatic production. DOC concentrations were low in all into Disko 1 appears to profoundly affect phytoplankton
lakes (≤ 1.5 mg L−1 , Table 2), reflecting limited soil matu- composition, with the degradation products (pheophytin b,
rity and development in all three catchments, as observed in a chlorophyll b derivative) being most abundant in Disko 1,
high-Arctic lakes with similar topographies (Michelutti et al., whereas chlorophyll a was dominant at other sites (Table 2).
2002). The DOC concentrations are much lower than other Chlorophytes also grow on glaciers (Williamson et al., 2018)
low-Arctic sites in Alaska or Norway which have more veg- and degrade into pheophytin b by UVR damage to algae
etated catchments (McGowan et al., 2018). Sparser vegeta- (Leavitt et al., 2003), which can be released to downstream
tion cover of the Disko 2 (13 %) catchment compared with waterbodies via ice melt. High diatoxanthin from siliceous
Disko 1 (39 %) probably reduced organic matter leachates algae in Disko 1 can be explained by photo-degradation due
from soils or permafrost, reducing microbial-induced phos- to low DOC (high water clarity) and shallow depth (< 5.9 m),
phorus leaching (Buckeridge et al., 2015). Hence, TP and without refuge from UVR (Sommaruga, 2001), while high
SRP concentrations were lower in Disko 2 than 4 (Table 2) chlorophyll a in Disko 4 can be explained by nutrient inputs
during the spring thaw period. The extensive wetlands in the from a large catchment with extensive plant cover (Table 1).
Disko 1 and 4 catchments are typical of Arctic environments Overall, catchment characteristics such as glaciers, soil type
where waterlogging leads to terrestrial OM transfer, lead- and plant cover appear to be tightly coupled to water qual-
ing to slightly higher C/N ratios in Disko 4 compared with ity, giving the potential for allochthonous inputs to influence
Disko 2, which is located in a cirque where bare earth is pre- autochthonous production.
dominant (Hobbie et al., 2000) (Table 1; Figs. 1 and 4).
Permanent ice/glaciers accounted for between 3.6 % and 4.2 Can catchment and in-lake composition of modern
14 % of catchment cover (Table 1), and glacial inputs are bulk OM discriminate between C sources and
known to influence waterbodies via effects of seasonal melt- sinks?
water release on lake water residence time and nutrient re-
lease from glacial melt (Anderson et al., 2017; Slemmons
Despite the potential for terrestrial–aquatic linkages, the bulk
et al., 2013). Of the three lakes, Disko 1 stands out with the
geochemical composition of catchment vegetation and soils
Biogeosciences, 18, 2465–2485, 2021 https://doi.org/10.5194/bg-18-2465-2021M. A. Stevenson: Climate warming enhances carbon cycling 2475 Figure 5. Lipid distribution histograms for (a) n-alkanes, (b) n-alkanols and (c) n-alkanoic acids for catchment plant, soil and surface sediment samples from Disko 2 lake and catchment analysed using GC–MS. Expressed as the relative proportion of total saturated n- alkanes, n-alkanols and n-alkanoic acids. Soil samples are taken from close to the Disko 2 shoreline (plot C) and close to the highest point in the catchment at 893 m (catchment summit). Locations detailed in Stevenson (2017). Numbers (1) and (2) indicate replicates of separate samples from the Disko 2 catchment with the same identification. was very different to the surface and down-core lake sedi- some can be N2 fixing. Degradation of terrestrial vegetation ments (Figs. 3 and 4), suggesting that lake OM was either by microbial and physical processes can result in substantial predominantly derived from in-lake/autochthonous rather DOC loss from catchments (Moody et al., 2013). However, than catchment sources or was extensively chemically altered the low OM abundance in these catchments likely leads to prior to deposition in the lakes (Table 3). The low C/N ratios low DOC fluxes, as evidenced by low lake water DOC (all of surface sediments (range 7.6 to 8.6) also suggest an algal ≤ 1.5 mg L−1 ). The OM sedimented in lakes is a combina- (low cellulose, aquatic) source rather than terrestrial plants tion of autochthonously and allochthonously sourced C of- with much higher values: lichen (30.0–196.0), herbaceous ten with varying susceptibility to degradation (Catalán et al., plants (12.2–133.6) and moss (35.2–127.9) (Fig. 3b) (Mey- 2013). The low C/N values are similar to values measured in ers and Teranes, 2001). C/N variation in lichens is likely as https://doi.org/10.5194/bg-18-2465-2021 Biogeosciences, 18, 2465–2485, 2021
2476                                                                   M. A. Stevenson: Climate warming enhances carbon cycling

                                                                          is expected to be high because aquatic plants can access C
                                                                          (and DIC) from different lake habitats which are in vari-
                                                                          able equilibrium with atmospheric CO2 . Higher values of
                                                                          δ 13 Corg in these lake sediments indicate either greater contri-
                                                                          butions of algae, phytobenthos and macrophytes or increases
                                                                          in productivity. The few low C/N ratios (approaching ∼ 12
                                                                          in some terrestrial specimens, e.g. Salix arctica, Chamerion
                                                                          latifolium) are probably linked to new plant growth (with
                                                                          less lignin) or differences in sample response to inorganic C
                                                                          cleaning during acidification (Brodie et al., 2011). Low val-
                                                                          ues in soils may be caused by soil algae which are common
                                                                          in Arctic areas (Pushkareva et al., 2016) and loss of carbon
                                                                          by diagenesis.

                                                                          4.3   Does the molecular composition of modern samples
                                                                                help distinguish C sources and sinks?

                                                                          Several molecular ratio indicators were particularly useful
                                                                          markers of terrestrial samples (see Table S3 in the Supple-
                                                                          ment for interpretation summary). For n-alkanes, higher CPI
                                                                          2 values were a good indicator of leafy catchment plants (e.g.
                                                                          Harrimanella hypnoides, Chamerion latifolium) (Table 4)
                                                                          (Marzi et al., 1993), although they made a small contribu-
                                                                          tion to the total organic carbon pool. The low n-alkane CPI
                                                                          2 values in soil and surface sediment reflect both the pos-
Figure 6. (a) Age–depth models and sedimentation rates using cor-         sibility of degradation of any minor terrestrial sources and
rected CRS model for the Disko 2 K1 core. The simple CRS (con-            in sediments and the predominant aquatic source in the lake
stant rate of supply) model derived from 210 Pb dating only is in-        sediments evidenced by C/N ratios (Meyers and Ishiwatari,
dicated by purple triangles. The corrected CRS (constant rare of          1993) (Fig. 4). Similarly, the n-alkane TARHC ratio, com-
supply) model is derived from a 210 Pb base, with manual splice           monly used as an indicator of terrestrial (higher) to aquatic
corrections based on the 137 Cs 1963 peak indicated by blue circles.      algae (lower) inputs (Bourbonniere and Meyers, 1996), was
(b) Extrapolated model for Disko 2 K1 short core with linear ex-          a robust indicator of the ericaceous shrub Harrimanella hyp-
trapolation of dates between 1940 and 1845 CE used to extend the
                                                                          noides and other herbaceous plants. The TARHC ratio had
chronology to the base of the core. Error bars indicate measured
210 Pb samples to 1σ standard error.                                      moderate values in aquatic macrophytes such as Potamoge-
                                                                          ton sp. but only minor values in Salix arctica. The highest n-
                                                                          alkane PWAX index values (Zheng et al., 2007) were found in
                                                                          vascular plants such as Harrimanella hypnoides, catchment
lakes in the low-Arctic area of Sisimiut in south-west Green-             soil samples, the aquatic macrophyte Potamogeton sp. and
land (Leng et al., 2012; Anderson et al., 2018).                          green moss. Although the PWAX ratio in this system cannot
   Compared with C/N, for δ 13 Corg there was more overlap                distinguish among specific terrestrial inputs, the low contri-
in values between surface sediment and terrestrial samples,               butions from the algal benthic rock scrape sample make the
making differentiation more challenging (Fig. 3c), proba-                 index a good indicator of terrestrial vs. aquatic inputs. C30 n-
bly due to the competing effects of productivity and source               alkanoic acid contributions were highest in the Harrimanella
in influencing C isotope composition (Hodell and Schelske,                hypnoides (2) sample and the plot C soil sample, and so this
1998; Meyers and Teranes, 2001). Despite the overlap, we                  ratio appears to be a good indicator of non-woody vascular
found the δ 13 Corg of terrestrial vascular plants was statisti-          plant and soil terrestrial inputs. The C24 n-alkanol ratio was
cally distinct from core sediments, but also from samples in              a good indicator of lignin-rich higher plants like Salix arctica
the terrestrial other category (bryophytes and lichens) (Ta-              and Chamerion latifolium.
ble 3), suggesting that autochthonous algae and not terres-                  Other molecular ratio indicators were useful markers of
trial vegetation is the main source of sedimentary C (Meyers              aquatic algae, macrophytes, bryophytes and soil samples (see
and Teranes, 2001). In contrast to higher plants, bryophytes              Table S3 for interpretation summary). The CPIT index for
lack stomata, and their isotope fractionation is closer to atmo-          n-alkanoic acids was a good indicator of how degraded (or
spheric CO2 (Smith and Griffiths, 1996; Hanson et al., 2014;              petrogenic) the C is (Matsuda and Koyama, 1977), with the
Glime, 2007). On the other hand, variability in δ 13 Corg of              highest contributions in Potamogeton sp., black moss and the
aquatic algae and macrophyte samples (−6.4 ‰ to −30.7 ‰)                  algal benthic rock scrape indicating high proportions of non-

Biogeosciences, 18, 2465–2485, 2021                                                          https://doi.org/10.5194/bg-18-2465-2021
M. A. Stevenson: Climate warming enhances carbon cycling 2477
Figure 7. (a) Down-core bulk and compound-specific isotopic geochemical parameters from the Disko 2 (K1) short core, presented against
modelled age (CE). (b) Down-core lipid geochemical ratios and equations including CPI 2, TARHC , PWAX , n-C27 /total n-alkanes, CPIT ,
n-C30 /total n-alkanoic acids, n-C16 /total n-alkanols, n-C24 /total n-alkanols and (brassicasterol/total sterols) ×1000. For abbreviations see
Table 4.
degraded C (Table 4). The C16 n-alkanol was most abundant 4.4 Evidence for changes in C cycling through the LIA
in surface sediment, the aquatic macrophyte Potamogeton sp. and recent warming periods
and plot C soil but can also be interpreted as a bulk produc-
tivity indicator (Cranwell, 1981). Brassicasterol is known to The dominant feature of the lake sediments across all catch-
be present in samples containing cyanobacteria, algal mats, ments is the low C/N ratios (Fig. 4), suggesting that most
diatoms and Brassicaceae (Pearson et al., 2007; Volkman, sedimentary OM in these lakes is autochthonous in origin,
2003; Volkman et al., 1998; Rampen et al., 2010) but is com- corroborated by high brassicasterol (algal indicator), C16 n-
monly used in lakes as a diatom biomarker due to its high alkanols (macrophyte indicator) and n-alkanoic acid CPIT
abundance (Nelson and Sachs, 2014). The markedly higher ratio (indicator of both young, fresh OM and shorter-chain
brassicasterol contribution in the Disko 2 surface sediments algal source) in the uppermost sediments (Table 4). This is
points to a pelagic algal source (mainly diatoms) of this com- mirrored by declines after ∼ 1750 CE in both long-chain n-
pound, with the next highest contributions in the algal ben- C27 and n-C30 total n-alkanoic acid ratios (Fig. 7b), which
thic rock scrape sample, moss samples and the plot C soil highlight that proportionally shorter chain lengths indicative
sample. The C27 ratio to total saturated n-alkanes was also a of aquatic algae increased (Cranwell et al., 1987). Dated sed-
good indicator of some plants such as the Salix arctica leaf iments from Disko 2 therefore allow shifts in predominantly
fragment and Chamerion latifolium. Combined, these mark- autochthonous C sources to be tracked through the LIA cool-
ers not only distinguish terrestrial from aquatic but also infer ing period (LIA ∼ 1300 to ∼ 1850 CE; Miller et al., 2012;
more subtle changes in the type of terrestrial cover. Matthews and Briffa, 2005) and subsequent warmer period
after 1950 to understand how catchment-mediated climate
changes affect C cycling in this snowpack-fed cirque lake.
https://doi.org/10.5194/bg-18-2465-2021 Biogeosciences, 18, 2465–2485, 20212478 M. A. Stevenson: Climate warming enhances carbon cycling
Table 4. Selected lipid ratios for catchment samples from Disko 2 analysed using GC–MS.
Sample TOC % n-Alkane ratios n-Alkanoic acid n-Alkanol ratios Sterols
(FAMEs) ratios
CPI 21 TAR HC2 P3WAX n-C27 /total CPI4T n-C30 /total n-C16 /total n-C24 total (Brassicasterol/
n-alkanes n-alkanoic n-alkanols n-alkanols total sterols)
acids ×1000
Harrimanella hypnoides (1) 43.0 39.6 18 899.2 1.2 14.4 43.2 0.7 0.1 9.8 6.4
Harrimanella hypnoides (2) 42.4 27.6 2980.3 1.0 5.5 15.3 4.2 0.7 16.3 16.3
Unidentified herbaceous plant 49.2 25.9 1523.1 1.1 10.8 24.3 0.6 0.3 8.5 7.1
Black moss 40.9 3.7 3.0 0.7 11.2 69.7 0.0 8.2 11.0 56.6
Potamogeton sp. 32.1 3.6 68.5 0.9 7.7 74.3 0.0 12.4 9.8 14.5
Green moss 34.9 5.4 8.0 0.9 10.3 32.4 0.1 0.1 26.2 44.2
Algal benthic rock scrape 24.5 3.5 6.2 0.5 7.7 40.6 0.0 0.8 25.5 57.8
Chamerion latifolium 33.1 16.4 129.9 0.7 26.0 27.5 0.7 0.0 29.3 3.5
Salix arctica (leaf) 47.0 18.5 19.6 0.9 31.3 17.3 0.0 0.2 42.2 0.4
Catchment – soil5 0.3 5.2 357.7 1.1 11.1 15.1 0.2 2.0 21.6 20.4
Plot C – soil6 0.1 1.3 18.9 0.8 10.2 11.7 2.0 4.9 12.3 44.7
Surface sediment 7.4 2.4 5.1 0.8 6.0 24.2 0.1 16.7 10.8 608.7
1 CPI 2 – carbon preference index 2 (Marzi et al., 1993) = ((C + C + C ) + (C + C + C ))/2 × (C + C + C ).
23 25 27 25 27 29 24 26 28
2 TAR
HC – terrigenous-to-aquatic ratio (Bourbonniere and Meyers, 1996) = (C27 + C29 + C31 )/(C15 + C17 + C19 ).
3P
WAX – index of waxy n-alkanes to total hydrocarbons (Zheng et al., 2007) = (C27 + C29 + C31 )/(C23 + C25 + C29 + C31 ).
4 CPI – carbon preference index (for the entire range) (Matsuda and Koyama, 1977)
T
= 0.5 × ((C12 + C14 + C16 ) + (C22 + C24 + C26 + C28 + C30 )) + ((C14 + C16 + C18 ) + (C24 + C26 + C28 + C30 + C32 ))/((C13 + C15 + C17 ) + (C23 + C25 + C27 + C29 + C31 ))
brassicasterol = 24-methylcholesta-5,22-dien-3β -ol.
5 From close to the highest point in the catchment 893 m (catchment summit).
6 From close to shoreline (plot C).
Aside from brief increases in % TOC and β-carotene carotene after ∼ 1900 CE (Meyers and Teranes, 2001) indi-
around ∼ 1450 and ∼ 1650 CE, there was a major shift in cate increased algal production, similar to post-LIA increases
these proxies after∼ 1860 CE (corresponding to the end of in pigments in Baffin Island lake sediments (Florian, 2016;
the LIA) to the present day, with a > 10-fold increase in Florian et al., 2015; Michelutti et al., 2005). The decrease
β-carotene (from ∼ 1910 CE to the recent maximum) in- in δ 13 Corg in the most recent sediments in Disko 2 is oppo-
dicating a major increase in phototrophic production. One site to the expectation that higher productivity from nutri-
scenario is that the catchment thawed and the permanent ent enrichment leads to higher δ 13 Corg (Hodell and Schelske,
ice cover (snowpack, cirque glacier) reduced, resulting in 1998). This decline of ∼ 1.4 ‰ over the last ∼ 50 years may
nutrients being released into the lake, stimulating algal be partly accounted for by the Suess effect from fossil fuel
growth (Slemmons and Saros, 2012; Slemmons et al., 2013). contamination (Verburg, 2007; Tans et al., 1979). However,
Increases in the length of the ice-free period have been most of the reduction in δ 13 Corg probably results from a
correlated with diatom responses in high-Arctic locations source change such as increased algae and macrophyte abun-
(Michelutti et al., 2020; Griffiths et al., 2017). Although dance. Combined, these geochemical markers show that fol-
changes in the ice-free period have been associated with bi- lowing the end of the LIA cooling, algal production increased
ological and chemical changes in low-Arctic lakes (Saros markedly in Disko 2, with this shift becoming more pro-
et al., 2019; Hobbs et al., 2010), it is rare to see the major nounced with the onset of recent warming and regional Disko
directional shifts in low-Arctic biota in response to warming glacier retreat (since ∼ 1950 CE) (Yde and Knudsen, 2007;
that are more commonly observed in high-Arctic sites. Hollesen et al., 2015; Box, 2002). The major two-step thresh-
The high elevation of Disko 2 (575 m a.s.l) and its lim- old shift since the end of the LIA (Fig. 7) is likely regulated
ited catchment vegetation appear to suggest that the lake by catchment processes associated with a glacier and/or per-
response to warming is simple and directional and funda- manent ice processes (e.g. nivation hollows, other periglacial
mentally changed carbon cycling in the lake by respond- processes) in the Disko 2 catchment, releasing N and P to the
ing in a two-stage, pulsed manner. This contrasts with many lake, shifting nutrient conditions and stimulating an algal re-
low-Arctic systems, where catchment vegetation is more es- sponse. Although 2013 surveys revealed only a small amount
tablished (Anderson et al., 2019), leading to more com- of permanent ice in this catchment, it is likely that in the LIA
plex whole-lake responses to climate. The probable loss of there was a larger cirque glacier in the catchment. Glaciers
a cirque glacier in the catchment after the LIA would have can respond not only to temperature but also to precipitation,
changed meltwater regimes, reducing lake water dilution and which regulates their hydrological connectivity and subse-
turbidity, making the lake more suited to algal production quent release of N, P and C to lakes. During retreat, ice-
after ∼ 1900 CE. Decreases in C/N ratio and increases in β- entrained nutrition can be discharged and soil surfaces ex-
Biogeosciences, 18, 2465–2485, 2021 https://doi.org/10.5194/bg-18-2465-2021M. A. Stevenson: Climate warming enhances carbon cycling 2479 posed, contributing to threshold shifts in algal species and Disko 2 catchment may have been particularly active during abundance (Slemmons et al., 2017, 2013; Colombo et al., the mid-20th century, likely associated with glacier retreat or 2019). One possible source of N and P accumulation on changes in catchment periglacial processes. glaciers is via aeolian transport of dust, which has many po- Although terrestrial OM was unlikely to be the dominant tential sources on Disko, an actively glaciated environment, source of OM to Disko 2 sediments, there are indications that with likely greater permanent ice cover in the LIA. Mecha- the type and magnitude of terrestrial OM fluxes have subtly nistically, regional dust variability in Greenland is known to varied over time and that recent changes in the catchment be a key determinant of sediment supply (Bullard and Mock- may be reflected in changes in the sediment. For example, ford, 2018), and there is evidence that dust-supplied P can increases in the C/N ratio around ∼ 1900 CE suggest catch- stimulate Arctic lake algal response (Anderson et al., 2017). ment dieback, facilitated by warming during melt season ex- This is because dust is known to stimulate microbial and posure from reduced ice cover (Leng et al., 2012). The com- algal abundance on the glacier surface (Stibal et al., 2015), position of catchment-derived C also shifted after ∼ 1895 CE which subsequently becomes entrained in glacier ice and re- with a decline in δ 13 C28:0 FAME from terrestrial plants, indi- leased to downstream lakes on retreat. cating a shift in terrestrial species with lower δ 13 C28:0 values The timing of the most marked lacustrine response (Fig. 7) as the catchment thawed and nutrient availability increased. appears to be from the mid-20th century onwards, slightly δ 13 CFAME values of Disko 2 catchment samples were lower later than the changes after the end of the LIA. Evidence (isotopically depleted) in higher plants (e.g. Harrimanella for recent regional warming includes significant Greenland hypnoides and Chamerion latifolium) (Fig. S3). Increases in summit annual surface temperature increase between 1982 n-alkane CPI 2 index between 1700 and 1600 CE probably and 2011 (McGrath et al., 2013), increased runoff from melt reflect an earlier period of increased herbaceous plant in- from the Greenland ice sheet in response to climate warm- put as a result of erosive freeze–thaw action in the catch- ing (Hanna et al., 2008), recent warming at west Greenland ment (Fig. 7b). Despite some degradation in the OM, the coastal weather stations between 1981 and 2011/12 (Hanna CPI 2 value is consistently > 2 down-core, which suggests n- et al., 2012), significant increases in the Greenland Blocking alkane diagenesis is not a key process, with relatively fresh Index (GBI) since 1981 in all seasons and annually (Hanna material potentially sourced from release of preserved OM et al., 2016), and significant warming of the polar water from permafrost thaw in the catchment from climate warm- layer in Disko Bay, responsible (in part) for the retreat of the ing (Schuur et al., 2009; Pautler et al., 2010). The peak in Jakobshavn Isbrae at Ilulissat (Myers and Ribergaard, 2013). n-alkane TARHC (index strongly biased towards the erica- Although recent warming (last ∼ 40 years) is known to be ceous shrub Harrimanella hypnoides and other herbaceous the most pronounced, it is challenging to interpret whether plants) in the 1760s is probably linked to catchment input of warming was more pronounced in the middle 20th cen- terrestrial material brought in during the LIA, which is prob- tury than ∼ 100 years earlier, when the LIA ended due to ably partly old organic C, fluvially released from soils (Vonk limitations from instrumental temperature records. Taking a et al., 2010). The steep topography surrounding Disko 2 is palaeoclimate approach, Overpeck et al. (1997) summarised suited to the delivery of old OM, with visible seasonal thaw multiple records suggesting that peak 20th century temper- slope failure (Fig. 2a) confirmed by occasional gravel layers ature in 1945 CE across the Arctic was around 1.2 ◦ C more in other cores in this lake (Stevenson, 2017) which are a prob- than in 1910. This suggests that mid-20th century warmth able C delivery source (Lamoureux and Lafrenière, 2014). in the Arctic overall was probably greater than at the end However, the n-alkane PWAX , an indicator of waxy hydro- of the LIA, but due to the spatial heterogeneity of these cli- carbons which are particularly abundant in terrestrial plants, mate changes in different localities of the Arctic it is hard was highest in the most recent ∼ 70 years, implying recent to compare these time periods specifically on Disko Island. delivery of allochthonous material. Although the TARHC and However, these indicators are not direct temperature or cli- PWAX records disagree, they both suggest that the type of mate proxies (Fig. 7), but rather indicators of carbon cycling terrestrial material brought into the lake in the most recent which are indirectly related to both catchment processes and period has changed and could be related to the sensitivity climate, releasing nutrients and carbon and stimulating the of TARHC to Harrimanella hypnoides and other herbaceous recent algal response. Temperature is typically only one of plants, or their expansion (Table 4). The ratio of n-C24 to to- many factors which drive changes in ecological thresholds in tal n-alkanols declined only in the uppermost samples (post Greenland lakes (Anderson et al., 2018; Law et al., 2015; ∼ 2003 CE), perhaps influenced by the most recent changes McGowan et al., 2018; Saros et al., 2019; Axford et al., in catchment vegetation on Disko (Hollesen et al., 2015), or 2013). Therefore the ecological response to regional warm- dilution by recent abundant short-chain n-alkanols. Increases ing is probably indirect through changes in catchment and in PWAX in the most recent sediments (Fig. 7b) highlight shifts in the terrestrial carbon cycle, rather than solely a di- (through comparison with modern samples, Fig. 4, Table S3) rect lake water algal temperature response. Interestingly, both that there are some recent increases in terrestrial contribu- DMAR and CMAR increased in a pulsed manner between tions (but of a different source to that explained by TARHC ) ∼ 1930 and 1960 CE (Fig. S2), suggesting processes in the contemporaneous with the recent increases in algal material https://doi.org/10.5194/bg-18-2465-2021 Biogeosciences, 18, 2465–2485, 2021
You can also read