Ground-based validation of the Copernicus Sentinel-5P TROPOMI NO2 measurements with the NDACC ZSL-DOAS, MAX-DOAS and Pandonia global networks - AMT
←
→
Page content transcription
If your browser does not render page correctly, please read the page content below
Atmos. Meas. Tech., 14, 481–510, 2021
https://doi.org/10.5194/amt-14-481-2021
© Author(s) 2021. This work is distributed under
the Creative Commons Attribution 4.0 License.

Ground-based validation of the Copernicus Sentinel-5P TROPOMI
NO2 measurements with the NDACC ZSL-DOAS, MAX-DOAS
and Pandonia global networks
Tijl Verhoelst1 , Steven Compernolle1 , Gaia Pinardi1 , Jean-Christopher Lambert1 , Henk J. Eskes2 ,
Kai-Uwe Eichmann3 , Ann Mari Fjæraa4 , José Granville1 , Sander Niemeijer5 , Alexander Cede6,7,8 ,
Martin Tiefengraber7,8 , François Hendrick1 , Andrea Pazmiño9 , Alkiviadis Bais10 , Ariane Bazureau9 ,
K. Folkert Boersma2,11 , Kristof Bognar12 , Angelika Dehn13 , Sebastian Donner14 , Aleksandr Elokhov15 ,
Manuel Gebetsberger7,8 , Florence Goutail9 , Michel Grutter de la Mora16 , Aleksandr Gruzdev15 , Myrto Gratsea17 ,
Georg H. Hansen18 , Hitoshi Irie19 , Nis Jepsen20 , Yugo Kanaya21 , Dimitris Karagkiozidis10 , Rigel Kivi22 ,
Karin Kreher23 , Pieternel F. Levelt2,24 , Cheng Liu25 , Moritz Müller7,8 , Monica Navarro Comas26 , Ankie J. M. Piters2 ,
Jean-Pierre Pommereau9 , Thierry Portafaix27 , Cristina Prados-Roman26 , Olga Puentedura26 , Richard Querel28 ,
Julia Remmers14 , Andreas Richter3 , John Rimmer29 , Claudia Rivera Cárdenas16 , Lidia Saavedra de Miguel13 ,
Valery P. Sinyakov30 , Wolfgang Stremme16 , Kimberly Strong12 , Michel Van Roozendael1 , J. Pepijn Veefkind2 ,
Thomas Wagner12 , Folkard Wittrock3 , Margarita Yela González23 , and Claus Zehner11
1 Royal  Belgian Institute for Space Aeronomy (BIRA-IASB), Ringlaan 3, 1180 Uccle, Belgium
2 Royal  Netherlands Meteorological Institute (KNMI), Utrechtseweg 297, 3730 AE De Bilt, the Netherlands
3 Institute of Environmental Physics (IUP), University of Bremen, Otto-Hahn-Allee 1, 28359 Bremen, Germany
4 Norsk Institutt for Luftforskning (NILU), Instituttveien 18, 2007 Kjeller, Norway
5 Science & Technology Corporation (S&T), Delft, the Netherlands
6 Goddard Space Flight Center (NASA/GSFC), Greenbelt, MD, USA
7 LuftBlick, Kreith, Austria
8 Institute of Meteorology and Geophysics, University of Innsbruck, Innsbruck, Austria
9 Laboratoire Atmosphères, Milieux, Observations Spatiales (LATMOS), UVSQ Université Paris-Saclay/Sorbonne

Université/CNRS, Guyancourt, France
10 Laboratory of Atmospheric Physics, Aristotle University of Thessaloniki (AUTH), Thessaloniki, Greece
11 Meteorology and Air Quality group, Wageningen University, 6700 AA Wageningen, the Netherlands
12 Department of Physics, University of Toronto, 60 St. George Street, Toronto, Ontario, M5S 1A7, Canada
13 European Space Agency/Centre for Earth Observation (ESA/ESRIN), Frascati, Italy
14 Max-Planck-Institut für Chemie (MPI-C), Hahn-Meitner-Weg 1, 55128 Mainz, Germany
15 A.M. Obukhov Institute of Atmospheric Physics (IAP), Russian Academy of Sciences, Moscow, Russian Federation
16 Centro de Ciencias de la Atmósfera, Universidad Nacional Autónoma de México (UNAM), Mexico City, Mexico
17 National Observatory of Athens, Lofos Nymphon – Thissio, P.O. Box 20048 – 11810, Athens, Greece
18 Norsk Institutt for Luftforskning (NILU), P.O. Box 6606 Langnes, 9296 Tromsø, Norway
19 Center for Environmental Remote Sensing, Chiba University (Chiba U), Chiba, Japan
20 Danish Meteorological Institute (DMI), Lyngbyvej 100, 2100 Copenhagen, Denmark
21 Japan Agency for Marine-Earth Science and Technology (JAMSTEC), Yokohama, Japan
22 Space and Earth Observation Centre, Finnish Meteorological Institute, Tähteläntie 62, 99600 Sodankylä, Finland
23 BK Scientific GmbH, Astheimerweg 42, 55130 Mainz, Germany
24 University of Technology Delft, Mekelweg 5, 2628 CD Delft, the Netherlands
25 Department of Precision Machinery and Precision Instrumentation, University of Science and

Technology of China, Hefei, 230026, China
26 Atmospheric Research and Instrumentation, National Institute for Aerospace Technology (INTA), Madrid, 28850, Spain
27 Laboratoire de l’Atmosphère et des Cyclones (LACy), Université de La Réunion, Saint-Denis, France

Published by Copernicus Publications on behalf of the European Geosciences Union.
482 T. Verhoelst et al.: Ground-based TROPOMI NO2 validation
28 NationalInstitute of Water and Atmospheric Research (NIWA), Private Bag 50061, Omakau, Central Otago, New Zealand
29 Universityof Manchester, Oxford Rd, Manchester, M13 9PL, United Kingdom
30 Kyrgyz National University of Jusup Balasagyn (KNU), 547 Frunze Str., Bishkek, Kyrgyz Republic
Correspondence: Tijl Verhoelst (tijl.verhoelst@aeronomie.be)
Received: 10 April 2020 – Discussion started: 26 May 2020
Revised: 12 October 2020 – Accepted: 5 November 2020 – Published: 22 January 2021
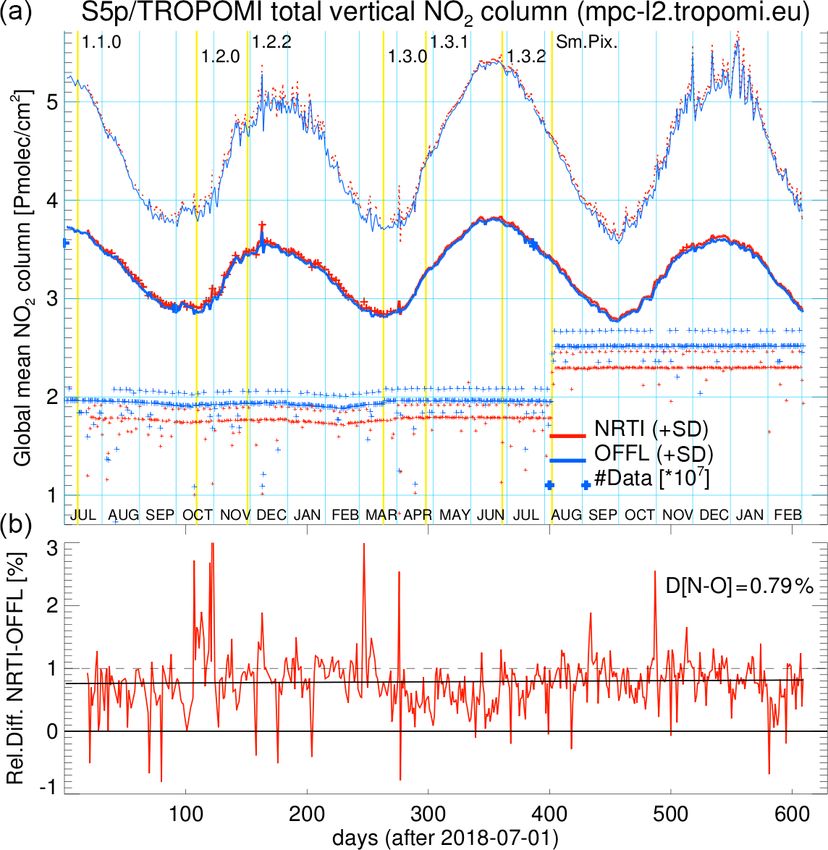
Abstract. This paper reports on consolidated ground-based processor provide similar NO2 column values and validation
validation results of the atmospheric NO2 data produced op- results when globally averaged, with the NRTI values being
erationally since April 2018 by the TROPOspheric Mon- on average 0.79 % larger than the OFFL values.
itoring Instrument (TROPOMI) on board of the ESA/EU
Copernicus Sentinel-5 Precursor (S5P) satellite. Tropo-
spheric, stratospheric, and total NO2 column data from
S5P are compared to correlative measurements collected 1 Introduction
from, respectively, 19 Multi-Axis Differential Optical Ab-
Nitrogen oxides, and in particular the NOx (NO and NO2 ),
sorption Spectroscopy (MAX-DOAS), 26 Network for the
are important trace gases both in the troposphere and the
Detection of Atmospheric Composition Change (NDACC)
stratosphere. In the troposphere they are produced mainly
Zenith-Scattered-Light DOAS (ZSL-DOAS), and 25 Pando-
by the combustion of fossil and other organic fuels and by
nia Global Network (PGN)/Pandora instruments distributed
the production and use of nitrogen fertilizers for agriculture.
globally. The validation methodology gives special care
They can also have a natural origin, e.g. lightning, biological
to minimizing mismatch errors due to imperfect spatio-
processes in soils, and biomass burning. The NO/NO2 ratio
temporal co-location of the satellite and correlative data, e.g.
varies with solar illumination primarily, from 0.2–0.5 during
by using tailored observation operators to account for differ-
the day down to zero at night. NOx are converted to nitric
ences in smoothing and in sampling of atmospheric struc-
acid and nitrates, which are removed by dry deposition and
tures and variability and photochemical modelling to reduce
rain, resulting in a tropospheric lifetime of a few hours to
diurnal cycle effects. Compared to the ground-based mea-
days. Tropospheric NOx are pollutants as well as proxies for
surements, S5P data show, on average, (i) a negative bias for
other pollutants resulting from the (high-temperature) com-
the tropospheric column data, of typically −23 % to −37 %
bustion of organic fuels. They are precursors for tropospheric
in clean to slightly polluted conditions but reaching values as
ozone and aerosols and contribute to acid rain and smog. Be-
high as −51 % over highly polluted areas; (ii) a slight nega-
cause of their adverse health effects, local to national regula-
tive median difference for the stratospheric column data, of
tions limiting boundary layer NOx concentrations are now in
about −0.2 Pmolec cm−2 , i.e. approx. −2 % in summer to
place in a long list of countries across the world. In the strato-
−15 % in winter; and (iii) a bias ranging from zero to −50 %
sphere, NOx are formed by the photolysis of tropospheric ni-
for the total column data, found to depend on the amplitude
trous oxide (N2 O) produced by biogenic and anthropogenic
of the total NO2 column, with small to slightly positive bias
processes and going up through the troposphere and strato-
values for columns below 6 Pmolec cm−2 and negative val-
sphere. Stratospheric NOx control the abundance of ozone as
ues above. The dispersion between S5P and correlative mea-
a catalyst in ozone destruction processes but also by mitigat-
surements contains mostly random components, which re-
ing ozone losses caused by catalytic cycles involving anthro-
main within mission requirements for the stratospheric col-
pogenic halogens through the lock-up of these halogens in
umn data (0.5 Pmolec cm−2 ) but exceed those for the tropo-
so-called long-lived reservoirs.
spheric column data (0.7 Pmolec cm−2 ). While a part of the
The global distribution, cycles, and trends of atmospheric
biases and dispersion may be due to representativeness dif-
NO2 have been measured from space by a large number
ferences such as different area averaging and measurement
of instruments on low Earth orbit (LEO) satellites. Since
times, it is known that errors in the S5P tropospheric columns
the late 1970s, its stratospheric and sometimes mesospheric
exist due to shortcomings in the (horizontally coarse) a pri-
abundance have been measured by limb-viewing and solar-
ori profile representation in the TM5-MP chemical transport
occultation instruments working in the UV–visible and in-
model used in the S5P retrieval and, to a lesser extent, to
frared spectral ranges: SME, LIMS, SAGE(-II), HALOE,
the treatment of cloud effects and aerosols. Although consid-
and POAM-2/POAM-3, etc. and, in the last decade, OSIRIS,
erable differences (up to 2 Pmolec cm−2 and more) are ob-
GOMOS, MIPAS, SCIAMACHY, Scisat ACE, and SAGE-
served at single ground-pixel level, the near-real-time (NRTI)
III. Follow-on missions combining limb and occultation
and offline (OFFL) versions of the S5P NO2 operational data
measurements are in development, like ALTIUS planned for
Atmos. Meas. Tech., 14, 481–510, 2021 https://doi.org/10.5194/amt-14-481-2021
T. Verhoelst et al.: Ground-based TROPOMI NO2 validation                                                                     483

the coming years. Pioneered in 1995 with ERS-2 GOME
(Burrows et al., 1999), which for the first time brought NO2
column measurements into space by Differential Optical Ab-
sorption Spectroscopy (DOAS; Noxon et al., 1979; Platt and
Perner, 1983), the global monitoring of tropospheric NO2
has continued uninterruptedly with a suite of UV–visible
DOAS instruments with improving sensitivity and horizon-
tal resolution: Envisat SCIAMACHY (Bovensmann et al.,
1999), EOS-Aura OMI (Levelt et al., 2018), and the series
of MetOp-A/B/C GOME-2 (Valks et al., 2011; Liu et al.,
2019b).
   Owing to its cardinal role in air quality, tropospheric
chemistry, and stratospheric ozone, and as a precursor of
essential climate variables (ECVs), the monitoring of atmo-
spheric NO2 on a global scale has been given proper atten-
tion in the European Earth Observation programme Coperni-        Figure 1. Geographical distribution of the UV–visible DOAS spec-
cus. The Copernicus Space Component (CSC) is developing          trometers contributing the ground-based correlative measurements:
a constellation of atmospheric composition Sentinel satellites   26 NDACC ZSL-DOAS instruments in green, 19 MAX-DOAS in-
with complementary NO2 measurement capabilities, consist-        struments in blue, and 25 PGN instruments in red.
ing of Sentinel-4 geostationary missions (with hourly moni-
toring over Europe) and Sentinel-5 LEO missions (with daily
monitoring globally), to be launched from 2023 onwards. A        nolle et al., 2020b; Pinardi et al., 2020) relies classically on
NO2 measurement channel is also planned for the Coperni-         three types of UV–visible DOAS instruments, which, thanks
cus Carbon Dioxide Monitoring mission CO2M for better            to complementary measurement techniques, provide correl-
attribution of the atmospheric emissions. The first element      ative observations sensitive to the three components of the
in orbit of this LEO+GEO constellation, the TROPOspheric         S5P data product: Multi-Axis Differential Optical Absorp-
Monitoring Instrument (TROPOMI), was launched on board           tion Spectroscopy (MAX-DOAS) measures the tropospheric
of ESA’s Sentinel-5 Precursor (S5P) early-afternoon LEO          column during the day, Zenith-Scattered-Light DOAS (ZSL-
satellite in October 2017. This hyperspectral imaging spec-      DOAS) the stratospheric column at dawn and dusk, and Pan-
trometer measures the Earth’s radiance, at 0.2–0.4 nm reso-      dora direct Sun instruments the total column during the day,
lution in the visible absorption band of NO2 , over ground       respectively. Currently, these three types of instruments con-
pixels as small as 7.0 × 3.5 or 5.5 × 3.5 km (before and after   tribute to global monitoring networks. Figure 1 shows the
the switch to smaller pixel size on 6 August 2019, respec-       geographical distribution of instruments contributing data to
tively) and with an almost daily global coverage thanks to a     the reported S5P validation study.
swath width of 2600 km.                                              In this paper, we report on the consolidated results of the
   Pre-launch mission requirements for the Copernicus Sen-       S5P NO2 ground-based validation activities for the first 2
tinel NO2 data are, for the tropospheric NO2 column,             years of nominal operation. The TROPOMI tropospheric,
a bias lower than 50 % and an uncertainty lower than             stratospheric, and total column data products under inves-
0.7 Pmolec cm−2 , and for the stratospheric NO2 column,          tigation, together with the corresponding ground-based ref-
a bias lower than 10 % and an uncertainty lower than             erence data, are described in Sect. 2. This is followed by a
0.5 Pmolec cm−2 (ESA, 2017a, b). Since the beginning of          brief assessment of the coherence between the data gener-
its nominal operation in April 2018, in-flight compliance of     ated by the near-real-time (NRTI) and offline (OFFL) chan-
S5P TROPOMI with these mission requirements has been             nels of the operational processors. For clarity, in separate sec-
monitored routinely by means of comparisons to ground-           tions we present results for the stratospheric (Sect. 4), tro-
based reference measurements in the Validation Data Analy-       pospheric (Sect. 5), and total (Sect. 6) NO2 columns. These
sis Facility (VDAF) of the S5P Mission Performance Centre        three sections include a description of the preparation of the
(MPC) and by comparison with similar satellite data from         filtered, co-located, and harmonized data pairs to be com-
OMI and GOME-2. The Copernicus S5P MPC routine oper-             pared and the comparison results. Robust, harmonized sta-
ations validation service is complemented with ground-based      tistical estimators are derived from the comparisons consis-
validation studies carried out in the framework of ESA’s S5P     tently throughout the paper: the median difference as a proxy
Validation Team (S5PVT) through research projects funded         for the bias and half of the 68 % interpercentile (IP68/2) as a
nationally like NIDFORVAL (see details in the Acknowl-           measure of the comparison spread (equivalent to a standard
edgements). Ground-based validation of satellite NO2 data        deviation for a normal distribution but much less sensitive
(e.g. Petritoli et al., 2003; Brinksma et al., 2008; Celarier    to unavoidable outliers). Thereafter, in Sect. 7, these individ-
et al., 2008; Ionov et al., 2008; Valks et al., 2011; Comper-    ual results are assembled and discussed all together, to de-

https://doi.org/10.5194/amt-14-481-2021                                               Atmos. Meas. Tech., 14, 481–510, 2021
484                                                                T. Verhoelst et al.: Ground-based TROPOMI NO2 validation

rive conclusions on their mutual coherence, on the fitness for        Table 1. Identification of the S5P NO2 data versions validated
purpose of the S5P data, and on remaining challenges for the          here: near-real-time channel (NRTI), offline channel (OFFL), and
accurate validation of NO2 observations from space.                   interim reprocessing (RPRO). Major updates were those leading to
                                                                      v01.02.00 and to v01.03.00.

                                                                        Processor   Start   Start              End      End
2     Data description                                                  version     orbit   date               orbit    date
                                                                        NRTI
2.1    S5P TROPOMI data
                                                                        01.00.01    2955    9 May 2018         3364      7 June 2018
                                                                        01.00.02    3745    4 July 2018        3946      18 July 2018
The retrieval of NO2 (sub)columns from TROPOMI Earth                    01.01.00    3947    18 July 2018       5333      24 July 2018
nadir radiance and solar irradiance spectra is a three-                 01.02.00    5336    24 October 2018    5929      5 December 2018
step process relying on DOAS and on a chemical trans-                   01.02.02    5931    5 December 2018    7517      27 March 2019
port model (CTM)-based stratosphere–troposphere separa-                 01.03.00    7519    27 March 2019      7999      30 March 2019
                                                                        01.03.01    7999    30 March 2019      9158      20 July 2019
tion. The TROPOMI NO2 algorithm is an adaptation of the
                                                                        01.03.02    9159    20 July 2019               current version
QA4ECV community retrieval approach (Boersma et al.,
2018) and of the DOMINO/TEMIS algorithm (Boersma                        OFFL
et al., 2007, 2011), already applied successfully to heritage           01.02.00    5236    17 October 2018    5832      28 November 2018
and current satellite data records (GOME, SCIAMACHY,                    01.02.02    5840    29 November 2018   7424      20 March 2019
                                                                        01.03.00    7425    20 March 2019      7906      23 April 2019
OMI, GOME-2). In the first step, the integrated amount of               01.03.01    7907    23 April 2019      8814      26 June 2019
NO2 along the optical path, or slant column density (SCD), is           01.03.02    8815    26 June 2019               current version
derived using the classical DOAS approach (Platt and Perner,            RPRO
1983). In the second step, the retrieved SCD is assimilated
                                                                        01.02.02    2836    1 May 2018         5235     17 October 2018
by the TM5-MP CTM to allocate a vertical profile of the
NO2 concentration, needed for the separation between strato-
spheric and tropospheric SCDs. This assimilation procedure
favours observations over pristine, remote areas where the            They constitute as continuous a dataset as possible from
entire NO2 SCD can be attributed to the stratospheric compo-          May (NRTI) or October (OFFL) 2018 onwards. Combin-
nent. Assuming relatively slow changes in the stratospheric           ing interim reprocessing (RPRO) (May–October 2018) with
NOx field, the model transports information to areas with a           OFFL, a coherent dataset with the OFFL processor v01.02.02
more significant tropospheric component. In the third step,           or higher can be obtained.
the three slant (sub)column densities are converted into verti-          Besides very detailed quality flags, the S5P NO2 data
cal (sub)column densities using appropriate air mass factors          product includes a combined quality assurance value
(AMFs). The CTM can be run either in forecast mode, us-               (qa_value) enabling end users to easily filter data for their
ing 1 d forecast meteorological data from the European Cen-           own purpose. For tropospheric applications (when not using
tre for Medium-Range Weather Forecasts (ECMWF), or in a               the averaging kernels), the guideline is to use only NO2 data
more delayed processing mode, using 0–12 h forecast meteo-            with a qa_value > 0.75. This removes very cloudy scenes
rological data. The former is used for near-real-time (NRTI)          (cloud radiance fraction > 0.5), snow- or ice-covered scenes,
processing of the TROPOMI measurements, the latter for                and problematic retrievals. For stratospheric applications,
the offline (OFFL) production. For full technical details, the        where clouds are less of an issue, a more relaxed thresh-
reader is referred to the Product Readme File (PRF), Prod-            old of qa_value > 0.5 is recommended. These data filtering
uct User Manual (PUM), and Algorithm Theoretical Basis                recommendations have been applied here, where the stricter
Document (ATBD), all available at http://www.tropomi.eu/              requirement of qa_value > 0.75 has been used for the total
data-products/nitrogen-dioxide (last access: 5 January 2021).         column validation as well. Again, further details on this can
A detailed description and quality assessment of the derived          be found in the PRF, PUM, and ATBD.
slant column data have already been published by van Geffen
et al. (2020), and a publication on satellite intercomparison of      2.2   NDACC zenith-sky DOAS data
vertical column data is under preparation (Eskes et al., 2020).
The current paper addresses the independent ground-based              Since the pioneering ages of NO2 column measurements
validation of vertical subcolumn densities in the troposphere         from space with ERS-2 GOME in the mid-1990s, ground-
and stratosphere and of the vertical total column. The S5P            based UV–visible DOAS measurements at twilight have
dataset validated here covers the nominal operational phase           served as a reference for the validation of NO2 total column
(Phase E2) of the S5P mission, starting in April 2018 and up          data over unpolluted stations and of NO2 stratospheric col-
to February 2020. No data obtained during the commission-             umn data from all nadir UV–visible satellites to date (e.g.
ing phase of the satellite have been used. Table 1 provides an        Lambert et al., 1997a, b; Petritoli et al., 2003; Celarier et al.,
overview of the processor versions to which this corresponds.         2008; Ionov et al., 2008; Gruzdev and Elokhov, 2010; Dirk-

Atmos. Meas. Tech., 14, 481–510, 2021                                                       https://doi.org/10.5194/amt-14-481-2021
T. Verhoelst et al.: Ground-based TROPOMI NO2 validation 485
sen et al., 2011; Hendrick et al., 2011; Robles-Gonzalez et al., 2004; Sinreich et al., 2005). From sunrise to sun-
et al., 2016). Here as well, S5P TROPOMI stratospheric NO2 set, MAX-DOAS instruments measure the UV–visible ra-
column data are compared to the correlative measurements diance scattered in several directions and elevation angles,
acquired by ZSL-DOAS (Zenith-Scattered-Light Differential from which the tropospheric vertical column density (VCD)
Optical Absorption Spectroscopy) UV–visible spectrometers and/or the lowest part of the tropospheric NO2 profile (usu-
(e.g. Solomon et al., 1987; Hendrick et al., 2011, and ref- ally up to 3 km altitude, and up to 10 km at best) can be
erences therein). A key property of zenith-sky measurements retrieved through different techniques (see, for example,
at twilight is the geometrical enhancement of the optical path Clémer et al., 2010; Hendrick et al., 2014; Friedrich et al.,
in the stratosphere (Solomon et al., 1987), which offers high 2019; Bösch et al., 2018; Irie et al., 2008, 2011; Vlemmix
sensitivity to stratospheric absorbers of visible radiation and et al., 2010; Wagner et al., 2011; Beirle et al., 2019), with
lower sensitivity to clouds and tropospheric species (except between 1 and 3 degrees of freedom. Their horizontal spatial
in the case of strong pollution events during thunderstorms representativeness varies with the aerosol load and the spec-
or thick haze; see, for example, Pfeilsticker et al., 1999). tral region of the retrieval, from a few kilometres to tens of
However, the geometrical enhancement also implies horizon- kilometres (Irie et al., 2011; Wagner et al., 2011; Wang et al.,
tal smoothing of the measured information over hundreds 2014). Published total uncertainty estimates on the NO2 tro-
of kilometres, which requires appropriate co-location meth- pospheric VCD are of the order of 7 %–17 % in polluted
ods to avoid large discrepancies with the higher resolution conditions, including both random (around 3 % to 10 %, de-
measurements of TROPOMI, as discussed in Sect. 4.1. Vari- pending on the instrument) and systematic (11 % to 14 %)
ous ZSL-DOAS UV–visible instruments with standard oper- contributions (Irie et al., 2011; Wagner et al., 2011; Hen-
ating procedures and harmonized retrieval methods perform drick et al., 2014; Kanaya et al., 2014). These ranges are
network operation in the framework of the Network for the more or less confirmed by the uncertainties reported in the
Detection of Atmospheric Composition Change (NDACC; data files, as visualized in Fig. A1. Nevertheless, differences
De Mazière et al., 2018). As part of this, over 15 instru- in the reported uncertainties and in the actual measurement
ments of the SAOZ design (Système d’Analyse par Obser- of the same scene between individual instruments are some-
vation Zénitale) are distributed worldwide and provide data times larger, and the main potential sources of these inhomo-
in near-real time through the CNRS LATMOS_RT Facility geneities are summarized below:
(Pommereau and Goutail, 1988). For the current work, ZSL-
DOAS validation data have been obtained: (1) through the - Different uncertainty reporting strategy. The reported
LATMOS_RT Facility (in near-real-time processing mode), systematic uncertainty may include only that from the
(2) from the NDACC Data Host Facility (DHF), and (3) via NO2 cross sections (approx. 3 %; UNAM, BIRA-IASB,
private communication with the instrument operator. The MPIC, AUTH, IUPB), or it may include also a contri-
geographical distribution of these instruments is shown in bution from the VCD retrieval step (up to 14 % in JAM-
Fig. 1, and further details are provided in Sect. A1. Measure- STEC data and 20 % in KNMI data) and the aerosol re-
ments are made during twilight, at sunrise, and at sunset, but trieval (Chiba U; Irie et al., 2011).
only sunset measurements are used here for signal-to-noise
- Different SCD retrieval. Recommended common
reasons (larger NO2 column) and as these happen closer in
DOAS settings are used by all groups in the present
time to the early-afternoon overpass of S5P. NDACC inter-
study, and when doing so, instrument intercompari-
comparison campaigns (Roscoe et al., 1999; Vandaele et al.,
son campaigns like CINDI-1 and CINDI–2 (Roscoe et
2005) conclude an uncertainty of about 4 %–7 % on the slant
al., 2010; Kreher et al., 2020) revealed relative biases
column density. After conversion of the slant column into a
between 3 % and 10 % in the differential slant column
vertical column using a zenith-sky AMF, and for the latest
density (DSCD).
version of the data processing, the uncertainty on the vertical
column is estimated to be on the order of 10 %–14 % (Yela - Different methods to retrieve VCD from DSCD (see also
et al., 2017; Bognar et al., 2019). Estimated uncertainties for Table A2). Using either (1) vertical profile inversion us-
all ground-based measurement types are summarized in Ta- ing optimal estimation (BIRA-IASB, UNAM); (2) pro-
ble 2. In Sect. 4.1, the photochemical adjustment required file inversion using (an optimal estimation of) parame-
to correctly compare twilight with midday measurements is terized profile shapes (JAMSTEC and Chiba U); (3) di-
described. rect retrieval via the calculation of a tropospheric AMF
(QA4ECV datasets); or (4) direct retrieval using a ge-
2.3 MAX-DOAS data ometrical approximation can lead to systematic differ-
ences in the 5 %–15 % range (Vlemmix et al., 2015;
Satellite tropospheric NO2 column data are compared clas- Frieß et al., 2019).
sically to correlative measurements acquired by Multi-
Axis Differential Optical Absorption Spectroscopy (MAX- Consequently, expert judgement on the total uncertainty at
DOAS) instruments (Hönninger and Platt, 2002; Hönninger the network level yields a conservative estimate of 30 % un-
https://doi.org/10.5194/amt-14-481-2021 Atmos. Meas. Tech., 14, 481–510, 2021486 T. Verhoelst et al.: Ground-based TROPOMI NO2 validation
Table 2. Estimated uncertainties for the different types of ground-based measurements used in this work. Ex ante refers to uncertainties
provided with the data, based on a propagation of raw measurement uncertainties and on sensitivity analyses. Ex post refers to uncertainty
estimates derived by comparison with other (independent) measurements, which inevitably also contain some representativeness uncertain-
ties. More detail is provided in the dedicated subsections of Sect. 2.
Instrument Ex ante Ex post Selected
uncertainty uncertainty references
ZSL-DOAS 10 %–14 % NA Yela et al. (2017), Bognar et al. (2019)
MAX-DOAS 7 %–17 % 30 % Hendrick et al. (2014), Kanaya et al. (2014)
PGN 2.7 Pmolec cm−2 20 % Herman et al. (2009), Choi et al. (2019)
NA: not available.
certainty in polluted conditions. Ongoing efforts to harmo- although larger differences are observed for individual sites
nize MAX-DOAS tropospheric NO2 data processing, e.g. as (Nowlan et al., 2018).
part of the ESA FRM4DOAS project, should help minimize Pandora data have been used before to validate satellite
such network inhomogeneities in the near future. NO2 measurements from Aura OMI (Herman et al., 2009;
MAX-DOAS data have been used extensively for tropo- Tzortziou et al., 2014; Kollonige et al., 2018; Choi et al.,
spheric NO2 satellite validation, for instance for Aura OMI 2019; Judd et al., 2019; Griffin et al., 2019; Herman et al.,
and MetOp GOME-2 (e.g. by Celarier et al., 2008; Irie et al., 2019; Pinardi et al., 2020) and TROPOMI (Griffin et al.,
2012; Lin et al., 2014; Kanaya et al., 2014; Wang et al., 2017; 2019; Ialongo et al., 2020; Zhao et al., 2020).
Drosoglou et al., 2018; Liu et al., 2019a; Compernolle et al., For the current work, 25 sites have contributed Pandora
2020b; Pinardi et al., 2020), as well as for the evaluation of data, collected either from the ESA Atmospheric Valida-
modelling results (Vlemmix et al., 2015; Blechschmidt et al., tion Data Centre (EVDC) (https://evdc.esa.int/, last access:
2020). 5 January 2021) or from the PGN data archive (https://
Data are collected either through ESA’s Atmospheric Vali- pandonia-global-network.org/, last access: 5 January 2021).
dation Data Centre (EVDC; https://evdc.esa.int/, last access: Only data files from a recent quality upgrade (proces-
5 January 2021) or by direct delivery from the instrument sor version 1.7, retrieval version nvs1, with file version
principal investigators (e.g. within the S5PVT NIDFORVAL 004 and 005; see https://www.pandonia-global-network.org/
AO project). Currently, 19 MAX-DOAS stations have con- home/documents/release-notes/, last access: 5 January 2021)
tributed correlative data in the TROPOMI measurement pe- were used, with 005 files (consolidated data) having prece-
riod from April 2018 to February 2020. Detailed information dence over 004 files (rapid delivery data). The most impor-
about the stations and instruments is provided in Sect. A2. tant change with the previous data release is a more stringent
A few contributing sites measure in several geometries (e.g. quality filtering. A total of 17 sites have provided measure-
Xianghe measure in both MAX-DOAS and direct Sun mode; ment data newer than 3 months.
Bremen and Athens both report MAX-DOAS and zenith-sky Except at low Sun elevation, the footprint of these direct
measurements) or have multiple instruments (e.g. Cabauw Sun measurements is much smaller than a TROPOMI pixel.
and UNAM stations host both MAX-DOAS and Pandora in- Therefore, as is the case with MAX-DOAS, a significant hor-
struments). This allows for detailed (sub)column consistency izontal smoothing difference error can be expected in the
checks and in-depth analysis of the site peculiarities, beyond TROPOMI–Pandora comparison, especially in the case of
the scope of the present overview paper. tropospheric NO2 gradients and when tropospheric NO2 is
the largest contributor to the total column.
2.4 PGN/Pandora data Three Pandora instruments (Altzomoni, Izaña, Mauna
Loa) are located near the summit of a volcanic peak and
The Pandonia Global Network (PGN) delivers direct Sun are therefore not sensitive to the lower lying tropospheric
total column and multi-axis tropospheric column observa- NO2 . In this work, their observations are compared to the
tions of several trace gases, including NO2 , from a network TROPOMI stratospheric NO2 data (see Sect. 4).
of ground-based standardized Pandora Sun photometers in
an automated way. In this work, only direct Sun observa- 2.5 NO2 cross section data
tions are used. These have a random error uncertainty of
about 0.27 Pmolec cm−2 and a systematic error uncertainty A potential source of inconsistencies between the different
of 2.7 Pmolec cm−2 (Herman et al., 2009). Studies at US and data products lies in the NO2 cross sections that are used.
Korean sites during the DISCOVER-AQ campaign found a An overview of the different choices made is provided in
good agreement of Pandora instruments with aircraft in situ Table 3. Most products use the cross sections published by
measurements (within 20 % on average; Choi et al., 2019), Vandaele et al. (1998), but there are differences in the choice
Atmos. Meas. Tech., 14, 481–510, 2021 https://doi.org/10.5194/amt-14-481-2021T. Verhoelst et al.: Ground-based TROPOMI NO2 validation 487
Table 3. NO2 cross section source and temperature for the different data processing used in this work. More detail is provided in Sect. 2.5.
Instrument Reference Temperature Comments
S5P TROPOMI Vandaele et al. (1998) 220 K With temperature correction in AMF (Zara et al., 2017)
ZSL-DOAS Vandaele et al. (1998) 220 K
ZSL-DOAS Harder et al. (1997) 227 K NIWA instruments
MAX-DOAS Vandaele et al. (1996) 298 K tropospheric retrieval only
MAX-DOAS Vandaele et al. (1998) 298 and 220 K Orthogonalized following Peters et al. (2017)
PGN Vandaele et al. (1998) 254.4 K PGN processor v1.7
of temperature at which to take the cross sections. The ZSL- 1 d or 0–12 h forecast ECMWF meteorological data as in-
DOAS measurements are processed with cross sections at a put, which impacts the TM5-MP vertical NO2 profiles. The
fixed 220 or 227 K, i.e. typical stratospheric temperatures. mutual consistency between the NRTI and OFFL data prod-
MAX-DOAS data are processed either with cross sections ucts is monitored routinely using data and tools provided by
at room temperature (298 K, representing a typical tropo- the S5P MPC Level-2 Quality Control Portal (http://mpc-l2.
spheric temperature) or using an orthogonalized set of cross tropomi.eu, last access: 5 January 2021). Figure 2 shows that,
sections at 298 and 220 K when both tropospheric and strato- looking at global means of the NO2 total column, the NRTI
spheric slant columns are retrieved. As the scientific focus of and OFFL data look very much alike, with NRTI column val-
the PGN up until processor version 1.7 (used for this study) ues on average 0.79 % larger than those obtained in OFFL.
was on measuring polluted conditions, i.e. in the presence of Eight NRTI and six OFFL processor versions are used in this
moderate to large tropospheric columns, the cross sections comparison (as identified in Table 1). The activation of the
used in the processor are scaled to a fixed effective temper- successive processor versions and the switch to the smaller
ature of 254.4 K, which corresponds to the situation of ap- ground pixel size (on 6 August 2019) are marked by the yel-
proximately equal column amounts in the troposphere and low vertical lines. As expected, both NRTI and OFFL chan-
stratosphere. The S5P retrievals use cross sections at 220 K nels show NO2 maxima in the winter/summer seasons (De-
but with an explicit correction for the temperature depen- cember, June) and minima near the equinoxes. The scatter
dence of the NO2 cross sections in the AMF: space–time also exhibits a seasonal cycle, with the largest values ob-
co-located daily ECMWF temperature profile forecasts are served in the Northern Hemisphere winter season.
used to compute a height-dependent AMF correction factor. To further assess similarities and differences between the
The temperature sensitivity parameterized in this correction NRTI and OFFL processing channels, NO2 values along in-
is approximately 0.32 % K−1 (Zara et al., 2017). A posteriori dividual orbits are also compared directly. An illustration is
temperature correction of the ground-based data is beyond given in Fig. 3 for S5P orbit no. 07407, a randomly selected
the scope of this paper, so it must be kept in mind that this orbit crossing western Europe on a relatively cloud-free day
may contribute to differences between S5P and ground-based (19 March 2019). Data were filtered to include only those
columns. Specifically, we could expect a small seasonal cy- pixels with a qa_value larger than 0.5 and were gridded to
cle in the stratospheric column comparisons of a few percent 1◦ × 1◦ before calculating the differences.
due to the seasonal variation in stratospheric temperature not The three maps of Fig. 3 show the difference between
being accounted for in the ZSL-DOAS data processing. PGN NRTI and OFFL values for the total, stratospheric, and tro-
columns may either be overestimated by up to 10 % when the pospheric NO2 column, respectively, together with the cor-
column is mostly stratospheric or underestimated by a simi- responding Pearson correlation coefficient and root-mean-
lar order of magnitude when large tropospheric amounts are square deviation (RMSD). While the correlation coefficient
present. The MAX-DOAS data may be biased in either direc- is high (typically around 0.98), the maps do reveal regions
tion by a few percent when tropospheric and/or stratospheric where significant deviations occur, up to ±0.5 Pmolec cm−2
temperatures differ strongly from the 298 and 220 K default between the NRTI and OFFL stratospheric columns and up
temperatures. to ±2 Pmolec cm−2 for both the tropospheric columns and
the total columns. North-east of Iceland, NRTI-OFFL differ-
ences in stratospheric and in tropospheric columns are of op-
3 Mutual coherence between TROPOMI NRTI and posite sign, while total column differences are minimal, in-
OFFL dicating a different stratosphere–troposphere separation af-
ter the slant column retrieval leading. West of Norway, to-
As described in Sect. 2.1, the main difference between the tal columns differ significantly between NRTI and OFFL,
NRTI and OFFL data processors lies in the use of either and these differences are allocated mostly to the tropospheric
https://doi.org/10.5194/amt-14-481-2021 Atmos. Meas. Tech., 14, 481–510, 2021488 T. Verhoelst et al.: Ground-based TROPOMI NO2 validation
Figure 2. (a) Time series of the global means of NO2 total column data retrieved with the NRTI (red line) and OFFL (blue line) processors,
and their standard deviation, in Pmolec cm−2 , from July 2018 till February 2020. Crosses depict the number of measurements divided by
107 , with the same colour code: red for NRTI, blue for OFFL. Yellow vertical lines indicate the transition dates for processor upgrades and
the switch to the smaller ground pixel size. (b) Percent relative difference between NRTI and OFFL global means of total NO2 values. The
Theil–Sen linear regression line (black) is superimposed.
columns. These features are specific to this particular orbit ments, individual TROPOMI NO2 stratospheric column data
and not systematic. A more detailed investigation targeted (in ground pixels at high horizontal sampling) are averaged
solely at regions and times of significant deviations between over the much larger footprint of the air mass to which the
NRTI and OFFL would be needed to better reveal the full ground-based zenith-sky measurement is sensitive; see Lam-
benefit of the OFFL analysis, but that is beyond the scope bert et al. (1997b, 2012), Verhoelst et al. (2015), and Com-
of the current paper. What needs to be underlined is that the pernolle et al. (2020b) for details. The length of this foot-
ground-based validation studies on which the present consol- print if of the order of 300–600 km in the direction of the
idated results are based upon do not yield significantly differ- Sun, and the width is typically of the order of 50–100 km at
ent conclusions for the two processing modes. Therefore, all mid-latitudes, depending on the duration of sunrise and sun-
results reported in this paper may be considered as applicable set. Note that, as the TROPOMI stratospheric column is a
to the two processing channels. TM5 output, its true resolution is actually much lower than
the pixel size. To account for effects of the photochemical
diurnal cycle of stratospheric NO2 , the ZSL-DOAS measure-
4 Stratospheric column validation ments at sunset are adjusted to the early-afternoon S5P over-
pass time using a model-based correction factor. The latter is
4.1 Co-location and harmonization
calculated with the PSCBOX 1D stacked-box photochemical
To reduce mismatch errors due to the significant difference in model (Errera and Fonteyn, 2001; Hendrick et al., 2004), ini-
horizontal sensitivity between S5P and ZSL-DOAS measure- tiated by daily fields from the SLIMCAT chemical transport
Atmos. Meas. Tech., 14, 481–510, 2021 https://doi.org/10.5194/amt-14-481-2021T. Verhoelst et al.: Ground-based TROPOMI NO2 validation 489 Figure 3. Maps of the difference between the NRTI and OFFL NO2 data values for S5P orbit no. 07407 on 19 March 2019. Difference between (a) total column values and (b) stratospheric column values. (c) Close-up of the difference in tropospheric column values over western Europe. https://doi.org/10.5194/amt-14-481-2021 Atmos. Meas. Tech., 14, 481–510, 2021
490                                                                 T. Verhoelst et al.: Ground-based TROPOMI NO2 validation

Figure 4. (a) Time series of S5P NRTI stratospheric NO2 column data co-located with ground-based SAOZ sunset measurements performed
by CNRS/LATMOS at the NDACC mid-latitude station of Observatoire de Haute-Provence (France). The latter were adjusted for the photo-
chemical difference between the S5P and twilight solar local times, while S5P data were averaged over the ground-based twilight air mass.
Solid lines represent 2-month running medians. Scatter plot (b) and histogram of the differences (c) with several statistical measures of the
agreement between data.

model (CTM). The amplitude of the adjustment factor is sen-              rise and sunset and due to the different air masses that are
sitive to the effective solar zenith angle (SZA) assigned to the         probed (east or west of the instrument respectively). More-
ZSL-DOAS measurements. It is assumed here to be 89.5◦ or,                over, it also contains that part of the measurement uncertainty
during polar day and close to polar night, the largest or small-         that is not systematic on a daily (or longer) timescale. We
est SZA reached, respectively. This photochemical correc-                find that sunrise and sunset measurements typically agree
tion factor is an average based on 10 years of the box-model             within 6 % (standard deviation of the differences). Overall,
simulations, and the range of values over these 10 years can             the 10 %–14 % total uncertainty estimate already presented
be considered an uncertainty estimate. It varies between 1 %             in Sect. 2.2 thus seems realistic.
and 6 % at the sites considered here, the uncertainty being
largest at high latitudes in local winter. This does however             4.2   Comparison results
not contain any model uncertainty (in the sense of the ac-
curacy of the model in representing the true photochemical               Figure 4 illustrates the comparison between TROPOMI and
variation during the day). Another way to estimate the uncer-            ground-based ZSL-DOAS SAOZ NO2 data at the NDACC
tainty in the adjusted ZSL-DOAS data is by comparing the                 station at Observatoire de Haute-Provence (OHP) in south-
agreement between sunrise and sunset measurements when                   ern France. The time series reveal a small negative median
both are photochemically adjusted to the S5P overpass time.              difference for TROPOMI, which is found to be a common
This does also contain co-location mismatch uncertainty due              feature across the network, but little seasonal structure. The
to transport of air occurring during the period between sun-             correlation coefficient is excellent, and the histogram of the
                                                                         differences has an almost Gaussian shape.

Atmos. Meas. Tech., 14, 481–510, 2021                                                        https://doi.org/10.5194/amt-14-481-2021
T. Verhoelst et al.: Ground-based TROPOMI NO2 validation 491
Figure 5. Difference between the S5P TROPOMI and NDACC ZSL-DOAS NO2 stratospheric column data as a function of time, after
photochemical adjustment of the ZSL-DOAS sunset data to the S5P SZA. Stations are ordered by increasing latitude (south at the bottom).
The dashed vertical line on 6 August 2019 represents the reduction in S5P ground pixel size from 7.0 × 3.5 to 5.5 × 3.5 km.
Comparison results for the entire ZSL-DOAS network are The potential dependence of the TROPOMI stratospheric
presented in Fig. 5. This figure reveals occasionally larger column bias and uncertainty on several influence quantities
differences in more difficult co-location conditions (e.g. en- has been evaluated. Figure 7 shows results for the solar zenith
hanced variability at the border of the polar vortex) but no im- angle (SZA), the fractional cloud cover (CF), and the sur-
pact of the TROPOMI pixel size change on 6 August 2019. face albedo of the TROPOMI measurement. This evaluation
The latter result must be interpreted with care as, for these does not reveal any variation of the bias much larger than
comparisons, multiple TROPOMI pixels are averaged over 0.4 Pmolec cm−2 over the range of these influence quantities.
the ZSL-DOAS observation operator before comparison (see
Sect. 4.1), and as such any change in the noise statistics of 4.3 PGN measurements at high-altitude stations
individual pixels will be hidden.
Statistical estimators of the bias (median difference) and Three of the PGN direct Sun instruments (see Sect. 6)
scatter per station are presented in box-and-whisker plots are located near the summit of a volcanic peak: Alt-
in Fig. 6 and in tabular form in Sect. A1. Across the net- zomoni (3985 m a.m.s.l.) in the State of Mexico, Izaña
work, S5P NRTI and OFFL stratospheric NO2 column data (2360 m a.m.s.l.) on Mount Teide on the island of Tenerife,
are generally lower than the ground-based values by approxi- and Mauna Loa (4169 m a.m.s.l.) on the island of Hawaii. At
mately 0.2 Pmolec cm−2 , with a station–station scatter of this these high-altitude sites, the total column measured by the
median difference of similar magnitude (0.3 Pmolec cm−2 ). ground-based direct Sun instrument misses most of the tropo-
These numbers are within the mission requirement of a spheric (potentially polluted) part and as such becomes repre-
maximum bias of 10 % (equivalent to 0.2–0.4 Pmolec cm−2 , sentative of the TROPOMI stratospheric column. These sites
depending on latitude and season) and within the com- have therefore been added to Fig. 6, illustrating that these
bined systemic uncertainty of the reference data and their comparisons based on direct Sun data yield similar conclu-
model-based photochemical adjustment. The IP68/2 disper- sions as those based on zenith-sky data, that is, a minor neg-
sion of the difference between TROPOMI stratospheric col- ative median difference of the order of −0.2 Pmolec cm−2 .
umn and correlative data around their median value rarely It must be noted that, as discussed in Sect. 2.5, the PGN
exceeds 0.3 Pmolec cm−2 at sites without tropospheric pollu- data are processed using cross sections at a temperature
tion. When combining random errors in the satellite and ref- of 254.4 K, representative of a total column made of equal
erence measurements with irreducible co-location mismatch amounts of NO2 in the stratosphere and troposphere. This
effects, it can be concluded that the random uncertainty on leads to columns which are about 10 % larger than if they
the S5P stratospheric column measurements falls within the had been processed with cross sections for 220 K. Future pro-
mission requirements of max. 0.5 Pmolec cm−2 uncertainty. cessing of the PGN data will address this, and it is expected
that this will mostly remove the apparent negative bias for
https://doi.org/10.5194/amt-14-481-2021 Atmos. Meas. Tech., 14, 481–510, 2021492 T. Verhoelst et al.: Ground-based TROPOMI NO2 validation
Figure 7. Dependence of the difference between TROPOMI NRTI
and ground-based ZSL-DOAS stratospheric NO2 column data on
the satellite solar zenith angle (SZA), satellite cloud fraction, and
Figure 6. Box-and-whisker plots summarizing from pole to pole
satellite surface albedo, including a median and IP68/2 spread per
the bias and spread of the difference between S5P TROPOMI NRTI
bin (bin widths of 10◦ in SZA, 0.05 in CF, and 0.1 in surface
and NDACC ZSL-DOAS NO2 stratospheric columns (SAOZ data
albedo). Different colours represent different stations, to illustrate
in black, other ZSL-DOAS in blue, and PGN in red). The median
the (modest) impact of station–station network inhomogeneity on
difference is represented by a vertical solid line inside the box,
these analyses.
which marks the 25 % and 75 % quantiles. The whiskers cover the
9 %–91 % range of the differences. The shaded area represents the
mission requirement of 0.5 Pmolec cm−2 for the uncertainty. Values
between brackets in the labels denote the latitude of the station. MAX-DOAS data series are temporally interpolated at the
TROPOMI overpass time (only if data within ±1h exist),
and daily comparisons are performed. This short temporal
TROPOMI (but lead to a slight inconsistency with the ZSL- window avoids the need for a photochemical cycle adjust-
DOAS results). ment. Details on the comparison approach are described in
Pinardi et al. (2020) for the validation of OMI and GOME-2
NO2 column data and in Compernolle et al. (2020b) for the
5 Tropospheric column validation validation of the OMI QA4ECV NO2 Climate Data Record.
5.1 Co-location and harmonization 5.2 Comparison results
TROPOMI data are filtered following the qa_value > 0.75 An illustration of the daily comparisons between TROPOMI
rule as recommended in the associated PRF (see Sect. 2.1). and ground-based MAX-DOAS measurements between May
Then for each day, the pixel over the site is selected. 2018 and the end of January 2020 is presented in Fig. 8
Atmos. Meas. Tech., 14, 481–510, 2021 https://doi.org/10.5194/amt-14-481-2021T. Verhoelst et al.: Ground-based TROPOMI NO2 validation 493
Figure 8. Same as Fig. 4 but now for the S5P OFFL tropospheric NO2 column data co-located with ground-based MAX-DOAS measurements
performed by BIRA-IASB at the NDACC mid-latitude station of Uccle in Brussels (Belgium).
for the Uccle station (Brussels, B, with moderate pollu- bias. The dispersion (IP68/2) of the difference is smaller
tion levels). The two datasets have a correlation coefficient than 1 Pmolec cm−2 .
of 0.75 and a regression slope and intercept of 0.47 and
1.0 Pmolec cm−2 respectively. The (median and mean) dif- ii. More polluted sites (median tropospheric columns
ference of about −2.3 to −3.1 Pmolec cm−2 corresponds to from 3 to 14 Pmolec cm−2 ) experience a clear nega-
a median relative difference of about −30 %. tive bias. The median difference ranges between −1
Results for the entire MAX-DOAS network are presented and −5 Pmolec cm−2 , i.e. between −15 % (Chiba) and
in Fig. 9. This figure reveals mostly (but not only) negative −56 % (Pantnagar). This underestimation is similar to
differences, with a fairly significant variability but no clear the one identified in the validation of Aura OMI and
seasonal features. No impact of the TROPOMI ground pixel MetOp GOME-2 tropospheric NO2 data by Comper-
size change on 6 August 2019 is observed. nolle et al. (2020b) and Pinardi et al. (2020). The dis-
Box-and-whisker plots for the whole network are shown persion (IP68/2) of the difference ranges from ∼ 2 to
in Fig. 10, with corresponding numeric values listed in ∼ 6 Pmolec cm−2 , roughly increasing with increasing
Sect. A2. Based on measurements from these 19 MAX- tropospheric NO2 median VCD.
DOAS stations, three different regimes can be identified:
iii. Extremely polluted sites report larger differences. This
is the case, for example, at the Mexican UNAM
i. Small tropospheric NO2 column values (median values sites (UNAM and Vallejo in/close to Mexico City
below 2 Pmolec cm−2 ), e.g. at the Fukue and Phimai and Cuautitlan in a more remote part of the State
stations, lead to small differences. Typically, these sta- of Mexico), with median tropospheric columns larger
tions show a small median bias (< 0.5 Pmolec cm−2 ), than 15 Pmolec cm−2 . These stations experience larger
but this can still correspond to up to a −27 % relative differences (> 10 Pmolec cm−2 , i.e. from −37 % to
https://doi.org/10.5194/amt-14-481-2021 Atmos. Meas. Tech., 14, 481–510, 2021494 T. Verhoelst et al.: Ground-based TROPOMI NO2 validation
Figure 9. Percent relative difference between the S5P TROPOMI and MAX-DOAS NO2 tropospheric column data as a function of time.
Stations are ordered by median NO2 tropospheric column (lowest median value at the bottom). The dashed vertical line on 6 August 2019
represents the reduction in S5P ground pixel size from 7.0 × 3.5 to 5.5 × 3.5 km2 .
−74 %). The dispersion (IP68/2) of the difference is ble to judge within the scope of the current paper as no such
also quite large, between 4 and ∼ 12 Pmolec cm−2 . Re- information is readily available.
sults at these sites need deeper analysis.
The overall bias (median of all station median differences) 6 Total column validation
is −2.4 Pmolec cm−2 , i.e. −37 %. The median dispersion
is 3.5 Pmolec cm−2 , while the site–site dispersion (IP68/2 6.1 Filtering, co-location, and harmonization
over all site medians) is 2.8 Pmolec cm−2 . Note that these
network-averaged numbers are close to the numbers found As was done for the tropospheric column validation in
for the polluted (Athens to Gucheng) sites. These results Sect. 5, only S5P pixels with a qa_value of at least 0.75 are
are within the mission requirement of a maximum bias of retained. The so-called summed product is used, i.e. the total
50 %, but they exceed the uncertainty requirement of at most column computed as the stratospheric plus the tropospheric
0.7 Pmolec cm−2 , which is only satisfied for the clean sites’ column values. This summed column differs from the total
ensemble. A discussion on the causes of these biases and column product. Only Pandonia measurements with the high-
sometimes large comparisons’ spread is provided in Sect. 7. est quality label (0 and 10) are used. The average column
Two key influence quantities for observations of tropo- value within a 1 h time interval, centred on the S5P over-
spheric NO2 are aerosol optical depth (AOD) and cloud (ra- pass time, is used. As the NO/NO2 ratio varies only slowly
diance) fraction (CRF). The dependence of the differences around the afternoon solar local time of the TROPOMI over-
between MAX-DOAS and TROPOMI tropospheric columns pass, this small temporal window ensures no model-based
on these two influence quantities is visualized in Fig. 11. adjustment is required. A 30 min time interval was tested as
AOD is only retrieved in the processing of a handful of well, but this did not change the results significantly. More-
MAX-DOAS instruments, the others using climatological in- over, only TROPOMI pixels containing the station were con-
formation, hence the limited subset in stations in panel (a) of sidered.
this figure. No clear dependence of the bias on either prop-
erty is seen, though in view of the relatively large scatter in
these tropospheric column comparisons, this does not pre-
clude more subtle dependencies. The impact of aerosol peak
height would also be interesting to assess, but this is impossi-
Atmos. Meas. Tech., 14, 481–510, 2021 https://doi.org/10.5194/amt-14-481-2021T. Verhoelst et al.: Ground-based TROPOMI NO2 validation 495
form in Table A3. One can distinguish roughly two different
regimes.
i. The PGN median total column value is between
3 (Alice Springs) and 6 Pmolec cm−2 (New
Brunswick). The absolute bias (median difference)
is within ±0.2 Pmolec cm−2 in most cases (up to
+0.5 Pmolec cm−2 at Egbert and Helsinki), while the
median relative difference is within 5 % in most cases
(up to ∼ 10 % at Alice Springs, Egbert, Inoe, and
Helsinki). Canberra is a deviating case, with larger neg-
ative bias (−0.9 Pmolec cm−2 ; −20 %). The difference
dispersion (IP68/2) roughly increases with increasing
PGN NO2 median VCD, from 0.4–0.6 Pmolec cm−2 at
the three cleanest sites to 1–2 Pmolec cm−2 at the other
sites.
ii. The PGN NO2 median total column value is between
8 (Buenos Aires) and 19 Pmolec cm−2 (UNAM, Mex-
ico City). A negative bias is observed, ranging from
−1 Pmolec cm−2 (−15 %) at the Bronx (New York) to
−7 Pmolec cm−2 (−50 %) at Rome Sapienza. The dif-
ference dispersion ranges from ∼ 3 (Buenos Aires) to
5 Pmolec cm−2 (UNAM).
The median relative difference is mostly within (or border-
ing) the ±10 % range for the sites with lower NO2 median
total column values (Alice Springs to New Brunswick; Can-
berra is an exception), while it is negative and mostly outside
this range, but still within ±50 %, for the sites with higher
NO2 median total column value (Buenos Aires to UNAM).
The overall bias over all sites (median over all site medians
or site relative medians) is −0.5 Pmolec cm−2 (−7 %). The
overall dispersion is 1.8 Pmolec cm−2 , while the site–site dis-
Figure 10. Same as Fig. 6 but now for the difference between S5P persion (IP68/2 over all site medians) is 2.2 Pmolec cm−2 .
TROPOMI OFFL and MAX-DOAS NO2 tropospheric columns and It is however more useful to make the distinction be-
ordered as a function of the median ground-based tropospheric col-
tween sites with low NO2 (Alice Springs to New Brunswick)
umn (largest median VCD values on top). The line represents the
and high NO2 (Buenos Aires to UNAM). For the low NO2
median difference. Box bounds represent the 25 and 75 percentiles,
while whiskers indicate the 9 and 91 percentiles. The shaded area sites, the overall bias is 0.1 Pmolec cm−2 (2 %), the over-
corresponds to the mission requirement of a maximum bias of 50 %. all dispersion is 1.1 Pmolec cm−2 , and the site–site dis-
persion is 0.2 Pmolec cm−2 . For the high NO2 sites, the
overall bias is −3.6 Pmolec cm−2 (−32 %), the overall dis-
persion is 3.3 Pmolec cm−2 , and the site–site dispersion is
6.2 Comparison results 1.4 Pmolec cm−2 .
An example of a time series of co-located TROPOMI and 7 Discussion and conclusions
PGN total column measurements, and their difference, is
shown in Fig. 12. A cross-network summary of the median difference and dis-
Results for the entire PGN network are presented in persion for the three S5P NO2 (sub)column data is attempted
Fig. 13. This figure reveals that the difference, even in rel- in Table 4. While the difference between the NRTI and OFFL
ative units, depends strongly on the total NO2 column, with NO2 values can reach up to a few Pmolec cm−2 for individ-
low (or slightly positive) biases at low columns and markedly ual TROPOMI pixels, the two processing channels do not
negative biases at high columns. No impact is observed for lead to significantly different validation results, and Table 4
the TROPOMI ground pixel size switch of 6 August 2019. therefore makes no distinction between the two.
Statistical estimators of the comparison results across the For the stratospheric column, the general picture is a
network are visualized in Fig. 14 and presented in tabular slight negative median difference of TROPOMI with re-
https://doi.org/10.5194/amt-14-481-2021 Atmos. Meas. Tech., 14, 481–510, 2021You can also read