Rain-fed streams dilute inorganic nutrients but subsidise organic-matter-associated nutrients in coastal waters of the northeast Pacific Ocean ...
←
→
Page content transcription
If your browser does not render page correctly, please read the page content below
Biogeosciences, 18, 3029–3052, 2021
https://doi.org/10.5194/bg-18-3029-2021
© Author(s) 2021. This work is distributed under
the Creative Commons Attribution 4.0 License.

Rain-fed streams dilute inorganic nutrients but subsidise
organic-matter-associated nutrients in coastal waters of
the northeast Pacific Ocean
Kyra A. St. Pierre1,2 , Brian P. V. Hunt1,2,3 , Suzanne E. Tank1,4 , Ian Giesbrecht1,5 , Maartje C. Korver1,a ,
William C. Floyd6,7 , Allison A. Oliver1,4,b , and Kenneth P. Lertzman1,5
1 Hakai Institute, Tula Foundation, Heriot Bay, BC, V0P 1H0, Canada
2 Institutefor the Oceans and Fisheries, University of British Columbia, Vancouver, BC, V6T 1Z4, Canada
3 Department of Earth, Ocean and Atmospheric Sciences, University of British Columbia, Vancouver, BC, V6T 1Z4, Canada
4 Department of Biological Sciences, University of Alberta, Edmonton, AB, T6G 2E9, Canada
5 School of Resource and Environmental Management, Simon Fraser University, Burnaby, BC, V5A 1S6, Canada
6 Ministry of Forests, Lands and Natural Resource Operations, Nanaimo, BC, V9T 6E9, Canada
7 Vancouver Island University, Nanaimo, BC, V9R 5S5, Canada
a current address: Department of Geography, McGill University, Montréal, QC, H3A 0B9, Canada
b current address: Skeena Fisheries Commission, Kispiox, BC, V0J 1Y4, Canada

Correspondence: Kyra A. St. Pierre (k.stpierre@oceans.ubc.ca)

Received: 23 September 2020 – Discussion started: 27 October 2020
Revised: 18 March 2021 – Accepted: 6 April 2021 – Published: 20 May 2021

Abstract. In coastal regions, rivers and streams may be im-       ally significant quantities of dissolved organic nitrogen (304–
portant sources of nutrients limiting to primary production       381 kg km−2 yr−1 ) and iron (463–596 kg km−2 yr−1 ), thus
in marine waters; however, sampling is still rarely conducted     acting as important sources of potentially limiting nutrients
across the land-to-ocean aquatic continuum, precluding con-       to both nearshore and offshore waters. These exports may
clusions from being drawn about connectivity between fresh-       subsidise heterotrophic microbial communities capable of di-
water and marine systems. Here we use a more-than-4-year          rectly consuming and remineralising these nutrients, poten-
dataset (2014–2018) of nutrients (nitrogen, phosphorus, sil-      tially compensating for the dilution of inorganic nutrients by
ica, iron) and dissolved organic carbon spanning streams          freshwater inputs. We highlight the need to better understand
draining coastal watersheds and nearshore marine surface          nutrient limitation in coastal waters and for concerted re-
waters along the Central Coast of British Columbia, Canada,       search efforts to study the spatial and temporal dynamism
at the heart of the North Pacific coastal temperate rainforest    at the land–ocean interface along the northeast Pacific coast.
region. Mean freshwater and surface marine N : Si : P ratios
were 5 : 20 : 1 (P : Fe = 1 : 67) and 6 : 11 : 1, respectively,
showing relative consistency across the land–ocean interface
but deviation from the extended Redfield ratio. Inorganic nu-     1   Introduction
                                         3−
trient concentrations (NO−         −
                           3 + NO2 , PO4 , Si(OH)4 ) in fresh
waters were less than in the receiving marine environment,        All living organisms require a combination of more than 20
indicating that freshwater nutrient inputs in this region were    naturally occurring chemical elements (Sterner and Elser,
of little importance to – or even diluted – the pool of readily   2002). Whereas early studies were solely focused on car-
available inorganic nutrients in nearshore waters. Conversely,    bon (C), nitrogen (N), and phosphorus (P), the fundamen-
fresh waters increased the pool of organic-matter-associated      tal building blocks of life (Redfield, 1934), the crucial role
nutrients, namely dissolved organic nitrogen and iron. The        of other nutrients like silicon (Si, hereafter referred to as or-
organic-matter-rich landscapes of the region yielded glob-        thosilicic acid, Si(OH)4 ) and iron (Fe) has long been recog-

Published by Copernicus Publications on behalf of the European Geosciences Union.
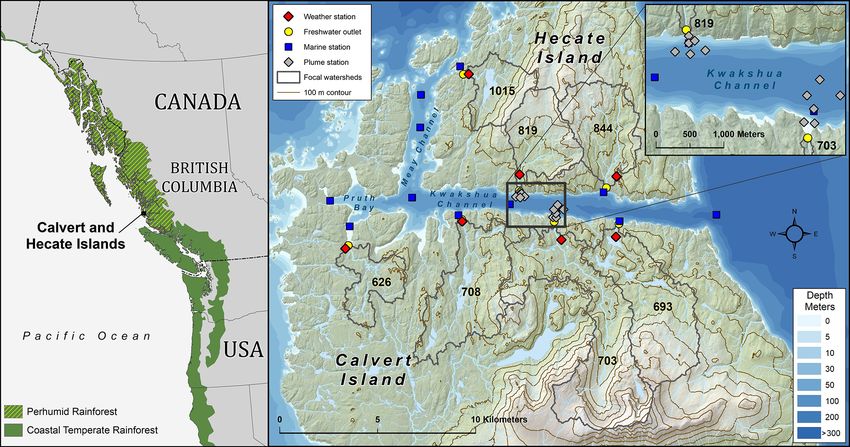
3030                                  K. A. St. Pierre et al.: Biogeochemical impacts of rain-fed streams on marine waters

nised (Ho et al., 2003). Primary producers like phytoplank-       Columbia, the composition of marine dissolved organic car-
ton, whose carbon uptake capabilities are intrinsic to the        bon (DOC) in ocean surface waters very closely resembles
coastal carbon cycle (Bauer et al., 2013), must obtain these      that of freshwater DOC during the winter months when high
essential nutrients directly from their environment and are       rainfall-induced inputs of DOC may favour microbial het-
thus dependent on the sources and sinks that govern nutrient      erotrophy (St. Pierre et al., 2020a). While the large organic
speciation and availability.                                      carbon stocks in soils across the NPCTR (McNicol et al.,
   Alfred Redfield established that marine phytoplankton are      2019) have made DOC a major focus of study (Fellman et al.,
generally composed of C, N, and P in a ratio of 106 : 16 : 1      2009a, b; Oliver et al., 2017; Hood et al., 2006; and others),
(Redfield, 1934), a global average that has been shown to         we do not fully understand how these high freshwater exports
vary over space (Martiny et al., 2013). Updated iterations of     impact nutrient availability and limitation in nearshore wa-
the ratio include Si(OH)4 and Fe (C : N : Si : P : Fe = 106 :     ters across the region (but see for example Wetz et al., 2006).
16 : 15 : 1 : 0.1–0.01) among other elements, in recognition      This remains a key oversight given the strong association be-
of the important role that these elements play in fundamental     tween nutrients and organic matter for potentially limiting
cellular metabolism and growth (Sterner and Elser, 2002; Ho       elements like nitrogen and iron (Meybeck, 1982). The land–
et al., 2003), with special reference to diatoms in the case of   ocean connection across this region is further modulated by
Si(OH)4 (Brzezinski, 1985). We now understand that nutri-         large-scale climate anomalies like the El Niño–Southern Os-
ent limitation of primary production is determined by biolog-     cillation (ENSO), which affects air temperature, precipita-
ical demand, available supply, and supply relative to that of     tion, and circulation in receiving marine waters (Ward et al.,
other essential elements (Welti et al., 2017).                    2010). While these anomalies are known to affect large wa-
   One of the potential sources of limiting nutrients in ma-      tersheds (Ward et al., 2010), their effect on the many small
rine waters, especially in coastal environments, is subsidies     watersheds of the NPCTR has rarely been examined.
from terrestrial ecosystems on adjacent landmasses (Saka-            Since 2014, routine monthly water quality surveys have
maki and Richardson, 2008; Harding and Reynolds, 2014;            been conducted in both coastal marine and fresh waters
Moore et al., 2013). As rivers and streams flow from their        across the Calvert and Hecate islands at the mid-latitudes
headwaters to coastal ecosystems, they integrate processes        of the NPCTR along the Central Coast of British Columbia,
happening across their watersheds, transporting the products      Canada (51.7◦ N, 128.0◦ W; Fig. 1) (Giesbrecht et al., 2016).
of erosion, weathering, biological production, and decom-         The Calvert and Hecate Island systems are broadly repre-
position, all sources of nutrients potentially limiting to pri-   sentative of the many small rainfall-dominated coastal wa-
mary production in the marine environment (Bouwman et al.,        tersheds that define the outer coast of the NPCTR in British
2013). The land-to-ocean aquatic continuum (LOAC) con-            Columbia and Alaska (Oliver et al., 2017). Because of the
cept acknowledges that what happens on land has important         large freshwater fluxes from the NPCTR to the coastal ocean,
consequences for water quality and productivity in coastal        it is an ideal region in which to examine the connection
regions (Xenopoulos et al., 2017). However, the LOAC has          between land and sea (Bidlack et al., 2021). To address
typically been applied either by freshwater scientists to de-     the knowledge gaps highlighted above, we endeavoured to
scribe changes in water quality across watersheds, leading        (1) understand seasonal variability in inorganic and organic
up to but not including coastal waters (e.g., Bouwman et al.,     nutrient concentrations and stoichiometry in nearshore ma-
2013; Weyhenmeyer and Conley, 2017), or by marine scien-          rine waters, (2) quantify and characterise temporal variability
tists to infer freshwater inputs from salinity gradients across   in freshwater nutrient inputs to marine waters, and (3) assess
nearshore environments (e.g., Wetz et al., 2006; Cuevas et al.,   whether fresh waters constitute an important source of poten-
2019). Each of these approaches, while valuable, relies on        tially limiting nutrients to marine ecosystems in this region.
inference about the neighbouring ecosystems, thus overlook-       This more-than-4-year dataset offers insights into the spa-
ing potential local deviations in the relationship (i.e., mix-    tial and temporal variability in nutrient stoichiometry across
ing, subsidy, loss) between freshwater and marine ecosys-         the LOAC, highlighting the possible role of small rivers and
tems from average or assumed conditions.                          streams in regulating biological productivity in nearshore
   The North Pacific coastal temperate rainforest (NPCTR)         waters.
region of North America, which extends from northern Cali-
fornia to the Gulf of Alaska (Fig. 1; Alaback, 1996), receives
on average 2000 mm of rainfall per year, with some locations      2     Methods
receiving upwards of 4000 mm (DellaSala, 2011). High rain-
fall, combined with snow and glacial melt from high eleva-        2.1    Site descriptions
tions, translates to intense stream and river discharge (Royer,
1982; Neal et al., 2010; Morrison et al., 2012), making the       The Kwakshua (26.5 km2 ) and Meay (8.6 km2 ) channels
connection between land and sea across this region partic-        separate the Calvert and Hecate islands within the Hakai
ularly strong (Fleming et al., 2016; O’Neel et al., 2015).        Luxvbalis Conservancy along the Central Coast of British
Indeed, along the rainfall-dominated outer coast of British       Columbia, Canada (Fig. 1). Within the channels, surface wa-

Biogeosciences, 18, 3029–3052, 2021                                                  https://doi.org/10.5194/bg-18-3029-2021
K. A. St. Pierre et al.: Biogeochemical impacts of rain-fed streams on marine waters                                                 3031

Figure 1. Map of study area within the North Pacific coastal temperate rainforest (NPCTR) region. All sampled freshwater (n = 7) and
marine stations (n = 13) are shown. Inset indicates the sampling stations for the riverine plume surveys. On the left panel, the basemap is
from Natural Earth data, and the NPCTR delineation is based on the detailed mapping by Ecotrust et al. (2015).

ters (0–5 m) are typically quite fresh (< 30 salinity units) rel-       seasonal snowpacks over 2 m deep can develop, correspond-
ative to the rest of the water column (∼ 30–33 salinity units).         ing to between 600 and 1000 mm of stored water. Snow in
The channel system is sheltered from direct offshore influ-             watersheds with significant areas of elevation greater than
ences by Calvert Island but exchanges waters with Fitz Hugh             500 m can contribute to a modest spring freshet, though all
Sound to the east through Kwakshua Channel and with Hakai               elevations have the potential to contribute to rain-on-snow
Pass and Queen Charlotte Sound to the northwest through                 events through late fall and early winter. The geology un-
Meay Channel. Pruth Bay (3.1 km2 ) connects the Meay and                derlying the region is acidic plutonic, dominated by silicate
Kwakshua channels. We hereafter refer to the combined ar-               and aluminium oxides, as well as iron oxides towards the
eas of Pruth Bay and the Meay and Kwakshua channels                     eastern coasts of the islands (Roddick, 1996). This geology
as the Kwakshua Channel system. Thirteen marine stations                is overlain by organic-rich podzol and folic histosol soils,
were sampled throughout the Kwakshua Channel system: six                with thick hemists in depressional areas, and open wetlands
were approximately mid-channel, and seven were closer to                and short wet forests composed of western redcedar, yellow-
the shoreline and associated with freshwater outlets (Fig. 1,           cedar, shore pine, and western hemlock (Oliver et al., 2017).
Table S1). Fitz Hugh Sound and Hakai Pass are also influ-               Seven streams draining coastal watersheds of the Kwakshua
enced by large freshwater fluxes from the British Columbia              Channel system have been routinely sampled for a suite of
mainland, which affect marine nutrient dynamics within the              dissolved chemical species (see Table S2). These watersheds,
system against which the watersheds are compared; however,              previously described in detail in Oliver et al. (2017) and sum-
quantifying the influence of these mainland freshwater ex-              marised in Table S3, cumulatively account for 67.4 % of the
ports is beyond the scope of this study.                                terrestrial drainage area (69.6 km2 ) of the combined chan-
   The Calvert and Hecate islands are characterised by bog              nels. These watersheds range between 3.2 and 12.8 km2 with
forests and extensive wetlands and are located within the               extensive but variable coverage by wetlands (23.8 %–50.2 %)
hypermaritime zone (i.e., rainfall-dominated outer coast) of            and lakes (0.3 %–9.1%) and mean slopes between 21.7 % and
the perhumid NPCTR (Meidinger and Pojar, 1991; Thomp-                   40.3 % (Gonzalez Arriola et al., 2015; Oliver et al., 2017).
son et al., 2016). Mean annual 1981–2010 air tempera-
ture and precipitation near sea level on the islands were               2.1.1   Seasonality and wider-scale climate anomalies
8.93 ± 0.20 ◦ C and 2800 ± 49 mm, respectively (http://www.
climatewna.com/ (last access: 25 May 2020), Wang et al.,                The NPCTR is characterised by high seasonality across both
2016). Precipitation on the Calvert and Hecate islands is pri-          marine and freshwater systems. The spring transition oc-
marily in the form of rain; however, above 500 m elevation,             curs between March and May each year (Thomson et al.,

https://doi.org/10.5194/bg-18-3029-2021                                                         Biogeosciences, 18, 3029–3052, 2021
3032                                  K. A. St. Pierre et al.: Biogeochemical impacts of rain-fed streams on marine waters

2014), with a shift towards northwesterly winds favouring the     nel system and (2) targeted rainfall event samplings of the
propagation of nutrient-rich upwelled waters onto the shelf       streams over the rising and falling limbs of the hydrographs.
and into inner passage waters, including Kwakshua Channel            Discharge, rainfall, and air temperature were monitored
(Hunt et al., 2018). Increased solar radiation favours a phy-     continuously at each of the seven watersheds. Climate sta-
toplankton bloom coinciding with the spring transition and        tions were established adjacent to the seven outlet streams
high productivity through to approximately August. Between        at low elevation (range 10–90 m.a.s.l; Table S3), near the
September and November, downwelling-favourable south-             stream sampling location. Air temperature and precipitation
easterly winds begin to dominate. This change overlaps with       were recorded at 5 min intervals and aggregated to daily
a marked increase in rainfall and therefore terrestrial runoff    statistics for temperature (mean, minimum, maximum) or
to the marine system, which persists from around October          totals for precipitation. Discharge was continuously mea-
through to March (St. Pierre et al., 2020a).                      sured at 5 min intervals, but the dataset was filtered to
   The wider northeast Pacific region is also characterised       15 min intervals for flux model construction, as in Oliver
by large-scale climate cycles, including the Pacific Decadal      et al. (2017) and St. Pierre al. (2020a). Rating curve con-
Oscillation (PDO) and the El Niño–Southern Oscillation            struction and discharge calculation are described in detail in
(ENSO), both of which can have a large effect on temper-          Oliver et al. (2017) and updated in Korver et al. (2019a).
ature (air, surface water) and precipitation patterns (Kiffney    Weather data from Mt. Buxton (∼ 1000 m.a.s.l.), the high-
et al., 2002). Variability in the PDO occurs over timescales of   est point on Calvert Island, were also extracted for the period
10+ years and is thus outside the scope of the present study.     of record from the ClimateNA spatially downscaled model
The study period was characterised by large fluctuations in       (http://www.climatewna.com/ (last access: 25 May 2020);
the ENSO, which are later discussed.                              Wang et al., 2016) for comparison to the sea level stations.
                                                                     Standardised monthly temperature and precipitation
2.2     Sampling scheme and sample collection                     anomalies were calculated relative to the 1981–2010 climate
                                                                  normal for each station, extracted from the ClimateNA model
Field surveys of both marine and fresh waters were con-           (Wang et al., 2016). We assessed the validity of this approach
ducted on an approximately monthly basis between 1 Au-            by comparing monthly ClimateNA outputs with local obser-
gust 2014 and 31 December 2018 (4 years, 5 months) by staff       vations for the study period (January 2015–December 2018).
at the Hakai Institute’s Calvert Island Field Station. Briefly,   Mean percent difference between measured and modelled
13 marine stations and seven freshwater streams were sam-         monthly mean air temperatures and total precipitation over
pled to provide information on spatial and temporal variabil-     the period of record were 8.82 ± 0.87 % and 11.58 ± 0.50 %,
ity in marine waters within the context of variable freshwater    respectively. The model predicted mean monthly air tem-
inputs.                                                           peratures well (linear regression: slope = 0.93, R 2 = 0.98;
                                                                  Fig. S1) but tended to underpredict rainfall (slope = 0.70,
2.2.1    Marine stations in the Kwakshua and Meay                 R 2 = 0.76; Fig. S2). However, rainfall is a notoriously dif-
         channels                                                 ficult climate parameter to measure accurately, let alone
                                                                  model, and model estimates should improve over time with
Marine water samples were collected from a boat at dis-           the incorporation of additional data sources. Given the fit
crete depths (0, 1, and 5 m) within the upper water col-          statistics, we deemed the Climate NA model adequate for our
umn using a Niskin water sampler across the 13 marine sta-        purposes. Together, these data support the use of a model-
tions. Samples for combined nitrate–nitrite (NO−            −
                                                    3 + NO2 ;     derived climate normal for the region in the absence of 30
                            −                      3−             years of local measurements. Local temperature and precipi-
hereafter shortened to NO3 ), orthophosphate (PO4 ), silicic
acid (Si(OH)4 ), and dissolved organic carbon (DOC) were          tation anomalies were then compared to the Oceanic Niño In-
filtered through 0.45 µm Millipore® Millex-HP hydrophilic         dex (ONI, Climate Prediction Center, 2019) to assess the po-
polyethyl sulfonate (PES) filters in the field and kept on ice    tential influence of Pacific Ocean basin-scale climate anoma-
until returning to the field station. Following sample collec-    lies on local processes.
tion on the boat, the basic properties (temperature, salinity,       Bulk water samples were collected as grab samples
                                                                                                                              3−
conductivity) of the collected water were measured using a        from each of the seven streams. Samples for NO−       3 , PO4 ,
calibrated, marine-sample-specific YSI sonde in a pre-rinsed      Si(OH)4 , and DOC were sampled as for the marine sta-
container.                                                        tions. At all freshwater stations, waters were also filtered
                                                                  with 0.45 µm PES filters for ammonium (NH+       4 ), total dis-
2.2.2    Rainforest streams                                       solved nitrogen (TDN), total dissolved phosphorus (TDP),
                                                                  and dissolved iron (dFe). Additional bulk water samples were
In this study, we integrated the results of two freshwater        collected in 50 mL centrifuge tubes for total nitrogen (TN)
sampling programs conducted between 1 August 2014 and             and total phosphorus (TP) and kept cool until analysis. These
31 December 2018: (1) routine monthly samplings of the            additional parameters are discussed separately from NO−      3,
seven watersheds at their outlets to the Kwakshua Chan-

Biogeosciences, 18, 3029–3052, 2021                                                  https://doi.org/10.5194/bg-18-3029-2021
K. A. St. Pierre et al.: Biogeochemical impacts of rain-fed streams on marine waters 3033
Si(OH)4 , PO3−4 , and DOC, in acknowledgement that anal- 2.3 Sample preparation and chemical analyses
ogous measurements were not taken in marine waters, ex-
cept during the rainfall events (see below). This is the first TP and TDP samples were preserved with 80 µL of 95 %
time that nutrient concentrations have been reported for these H2 SO4 and frozen until analysis. Samples for TN, TDN,
watersheds. DOC concentrations from 2014–2016 were pre- NH+ −
4 , NO3 , and Si(OH)4 were frozen until analysis. Sam-
viously reported in Oliver et al. (2017) and St. Pierre et ples for TN, TDN, NH+ −
4 , NO3 (from August 2014 to
al. (2020a). June 2015), TP, TDP, and PO3− 4 (from August 2014 to
June 2015) were analysed according to Canadian Associa-
tion for Laboratory Accreditation (CALA)-certified proto-
2.2.3 Targeted stream samplings during rainfall events
cols at the University of Alberta’s Biogeochemical Analyt-
ical Service Laboratory (Table S2). From March 2015 on-
3−
The streams were sampled during rainfall events to better un- wards, NO− 3 , PO4 , and Si(OH)4 were analysed at the Uni-
derstand how water chemistry changes along the rising and versity of British Columbia’s Marine Zooplankton and Mi-
falling limbs of the hydrograph (Korver et al., 2019b). These cronekton Laboratory. Dissolved inorganic nitrogen (DIN)
high-frequency measurements are especially useful to train and dissolved organic nitrogen (DON) were calculated as the
constituent flux models during high-flow events given that sum of NH+ −
4 and NO3 and the difference between TDN and
constituent concentrations often vary with discharge within a DIN, respectively. Dissolved cations, including dFe, were
given watershed (Goñi et al., 2013). preserved with 480 µL 8 M HNO3 and kept cool until anal-
During rainfall events, the streams were sampled using a ysis by the Analytical Chemistry Services Laboratory (Min-
combination of techniques: (1) opportunistic grab samples on istry of Environment and Climate Change Strategy, Victo-
the falling limb (all watersheds, 18 July 2015 to 15 Novem- ria, BC, Canada). Filtered DOC samples from freshwater
ber 2018); (2) a single-stage sampler (all watersheds, 21 to and marine sites were preserved with 200 µL 7.5 M H3 PO4 or
25 July 2015 and 15 to 16 July 2017); and (3) an automated 6 M HCl, respectively, and kept cool until analysis. Freshwa-
pump sampler (watershed 708 only, 17 to 27 September 2015 ter samples were analysed at the Analytical Chemistry Ser-
and 14 to 21 October 2017). The single-stage samplers were vices Laboratory, while marine samples were analysed at the
constructed by mounting 250 mL bottles at vertical incre- Ján Veizer Stable Isotope Laboratory (University of Ottawa,
ments above the low water level of the stream prior to each ON, Canada). Instruments and detection limits for each con-
rain event. Vertical increments were adjusted depending on stituent are summarised in Table S2.
the weather forecast and predicted stage rise. As the water
level rose, the bottles filled in sequence. Water exchange af- 2.4 Freshwater biogeochemical inputs to the
ter filling was prevented by following the design of single- Kwakshua and Meay channels
stage suspended-sediment samplers (Edwards and Glysson,
1999): two inverted stainless-steel U-shaped inlet tubes were Freshwater inputs to the Kwakshua Channel system were
inserted in the bottle through a rubber plug. The first inlet quantified by relating constituent concentrations from both
tube allows water to enter, and the second inlet tube, placed the routine monthly and targeted rainfall event samplings
directly above the first, blocks water inflow by sealing the to 15 min discharge using log-linear models in the R pack-
bottle’s air exchange. Bottles were always completely filled age rloadest (Runkel et al., 2004; Runkel, 2013; Lorenz et
at rising water levels, preventing river water from entering as al., 2015). For all watersheds except 708, models were con-
water levels dropped. Additional information on the setup is structed by relating discharge to concentration over the entire
included in the Supplement (see also Table S4). study period. At watershed 708, discharge monitoring began
in August 2013 – 1 year earlier than elsewhere, so mod-
els were constructed for the entire period of record (9 Au-
2.2.4 Freshwater plume samplings in nearshore waters
gust 2013 to 31 December 2018). Daily flux estimates were,
however, only made over the same period as for the other wa-
To better understand the influence of rainfall events on tersheds (1 August 2014 to 31 December 2018). According
nearshore environments, the plumes emanating from water- to convention (Analytical Methods Committee, 2001), half of
sheds 819 and 703 were sampled during storms on 7 Au- the detection limit (see Table S2) was used for cases where
3−
gust and 19 September 2015, respectively (Fig. 1). Plume concentrations of NO− +
3 , NH4 , and PO4 were flagged as be-
extent was first visually determined based on turbidity and low detection by the analytical labs. While we acknowledge
water colour and finally by measuring the conductivity of the biases that this approach may introduce (Helsel, 2009),
surface waters in comparison to the Pruth marine station we believe it to be a best approximation of these low con-
(∼ 45 000 µS cm−1 ). Six sampling stations were then estab- centrations given the large number of parameters and sites
lished across the plume and waters were sampled at 0, 1, presented here.
and 5 m depth for all the same parameters as the streams, For each constituent and watershed, the best rloadest
described above. model was initially chosen to minimise Akaike’s informa-
https://doi.org/10.5194/bg-18-3029-2021 Biogeosciences, 18, 3029–3052, 20213034 K. A. St. Pierre et al.: Biogeochemical impacts of rain-fed streams on marine waters
tion criterion (AIC) and then assessed for goodness of fit us- flow-weighted molar concentrations of all chemical con-
ing the bias percentage, partial load ratio (PLR; Stenback stituents were standardised using Z scores to de-emphasise
et al., 2011), and the Nash–Sutcliffe efficiency index (E; the very high DOC concentrations, which were typically 2 to
Nash and Sutcliffe, 1970). Only the models for NO− 3 consis- 3 orders of magnitude greater than any other constituent.
tently had an E less than zero, indicating that the observed
mean was a better predictor than the model estimates (Runkel
et al., 2004; Lorenz et al., 2015; Runkel, 2013), and were 3 Results
therefore excluded from our analysis. Instead, the NO− 3 flux
was estimated by subtracting the NH+ 4 flux from the DIN 3.1 Temperature and precipitation between 2014 and
flux on a given day. Mean (± SE, n = 77) model R 2 , bias 2018
percentage, PLR, and E were 94.7 ± 0.6, −0.76 ± 0.85 %,
0.99 ± 0.01, and 0.78 ± 0.03, respectively. Constituent and Mean annual air temperature near sea level on the Calvert
watershed-specific model fit statistics are presented in Ta- and Hecate islands over the study period was 8.73 ± 0.12 ◦ C
ble S5. Errors reported on aggregate monthly or annual flux (full range: −13.60–34.99 ◦ C), similar to the 1981–2010 nor-
measurements were quantified by propagating the daily stan- mal for these watershed outlet sites (8.93 ± 0.20 ◦ C). Mean
dard error of prediction, which incorporates the uncertainty annual rainfall was 2790 ± 61 mm (range: 2240–3520 mm;
of both the model fit and the load estimate. 1981–2010 normal = 2800 ± 49 mm) at these sites, increas-
ing to 4312 ± 106 mm at 1000 m elevation (1981–2010 nor-
2.5 Other statistical considerations and analyses mal = 4620 mm). Precipitation translated to a cumulative
mean annual freshwater discharge to the Kwakshua Chan-
All statistical analyses were completed in R (R Core Team, nel system of 0.174 ± 0.055 km3 (Table 1, range: 0.161–
2019), using packages vegan (Oksanen et al., 2018), dplyr 0.186 km3 ), equivalent to a mean annual specific runoff of
(Wickham et al., 2019), lme (Bates et al., 2015), and lsmeans 2500 ± 790 mm (range: 2310–2670 mm).
(Lenth, 2016). Stoichiometric ratios were log-transformed Rain (≥ 0.2 mm) was recorded at sea level between 63 %
prior to the calculation of summary statistics presented in and 69 % of days in any given year (Table S6), and the region
figures in acknowledgement of the inherent non-normality of exhibited strong seasonality (Fig. 2a–c). Maximum and min-
ratio data (Isles, 2020). Mean concentrations presented in fig- imum monthly rainfall typically occurred in November and
ures and tables were then re-transformed to non-log scale to June, respectively (Fig. 2a). The longest (21–47 consecutive
facilitate comparisons with literature values. Standard errors days with more than 0.2 mm of rain) and largest (> 200 mm
(SEs) are reported throughout, unless otherwise stated. The of rain, maximum = 567 mm event−1 ) rainfall events always
level of significance (α) was 0.05 but Bonferroni-corrected occurred between November and March (Table S6). Maxi-
for cases when multiple comparisons were made. Statistics mum and minimum air and seawater temperatures occurred
quantifying interannual variability utilise full calendar years in July and December–February (Fig. 2b–c). The sampling
only (n = 4, i.e., 2015–2018). Temperature and precipitation period was characterised by dramatic fluctuations in the ONI,
anomalies were compared to the ONI using Pearson’s prod- including strong El Niño (May 2015 to April 2016) and weak
uct moment correlation. La Niña (October 2017 to March 2016) and El Niño (Octo-
Differences in air temperature, rainfall, flow-weighted ber to December 2018) events (Fig. 2d). Temperature and
freshwater nutrient concentrations and fluxes, and marine nu- precipitation anomalies, though, were poorly correlated with
trient concentrations across the period of record were as- the ONI (Fig. S3).
sessed using linear mixed effects models, coding for year
and month as fixed effects and watershed or station (ma- 3.2 Marine primary production and nutrient
rine) as a random effect. We chose to compare monthly flow- stoichiometry
weighted nutrient concentrations rather than point measure-
ments to assess “true” temporal differences in concentration, Chlorophyll a concentrations ranged between ∼ 0.01 and
independently of hydrology. Briefly, monthly flow-weighted 14.67 µg L−1 (Fig. 3a). Based on chlorophyll a concentra-
nutrient concentrations were calculated by dividing the mod- tions, each year, primary production peaked between April–
elled monthly flux by the total monthly volume of water dis- June and again in July–August (Fig. 3a). Mean marine NO− 3,
charged by each stream. Tukey multiple comparisons were PO3−4 , Si(OH) 4 , and DOC concentrations across the 0, 1,
then assessed across all pairwise combinations of year and and 5 m depths were 8.18, 0.78, 18.67, and 72.64 µmol L−1 ,
3−
month; however, only interannual comparisons for a given respectively, but varied widely (Table S7). NO− 3 , PO4 ,
month (e.g., July 2015 vs. July 2018) were deemed relevant and Si(OH)4 concentrations displayed strong seasonality but
for our purposes and are discussed. also interannual differences (Table 2; mixed effects mod-
Principal component analysis (PCA) was used to char- els, p < 0.05 on all terms, Table S8). Seasonal fluctua-
acterise the bulk chemistry of the freshwater inputs to the tions in inorganic nutrient concentrations in marine wa-
Kwakshua channel system. Prior to performing the PCA, ters were the opposite of chlorophyll a concentrations:
Biogeosciences, 18, 3029–3052, 2021 https://doi.org/10.5194/bg-18-3029-2021K. A. St. Pierre et al.: Biogeochemical impacts of rain-fed streams on marine waters 3035
Table 1. Annual combined fluxes of nutrients from the seven gauged watersheds (46.9 km2 ), upscaled to the drainage area of the Kwakshua
Channel system (69.6 km2 ), and mean ± SE annual flow-weighted concentrations (CF.W. ) based on the annual fluxes.
Flux CF.W.
(Mmol yr−1 ) (µmol L−1 )
Year 2015 2016 2017 2018 2015 2016 2017 2018
Water (km3 ) 0.172 0.186 0.179 0.161 – – – –
DOC 145 ± 41 156 ± 44 144 ± 42 129 ± 37 843 ± 238 837 ± 235 809 ± 235 800 ± 228
TN 2.06 ± 0.59 2.30 ± 0.65 2.18 ± 0.63 1.88 ± 0.54 11.98 ± 3.43 12.37 ± 3.51 12.18 ± 3.52 11.69 ± 3.33
TDN 1.83 ± 0.44 2.09 ± 0.50 1.96 ± 0.48 1.64 ± 0.39 10.64 ± 2.56 11.23 ± 2.67 10.96 ± 2.66 10.18 ± 2.45
DON 1.70 ± 0.42 1.89 ± 0.47 1.79 ± 0.45 1.51 ± 0.37 9.86 ± 2.43 10.17 ± 2.51 10.03 ± 2.53 9.40 ± 2.30
DIN 0.18 ± 0.16 0.20 ± 0.19 0.19 ± 0.18 0.17 ± 0.15 1.06 ± 0.95 1.09 ± 1.03 1.05 ± 1.00 1.04 ± 0.95
NH+4 0.10 ± 0.10 0.14 ± 0.16 0.11 ± 0.12 0.06 ± 0.07 0.56 ± 0.62 0.73 ± 0.83 0.62 ± 0.69 0.39 ± 0.45
NO−3 + NO2
−a
0.09 ± 0.20 0.07 ± 0.25 0.08 ± 0.22 0.10 ± 0.17 0.50 ± 1.54 0.36 ± 1.86 0.43 ± 1.69 0.65 ± 1.40
Si(OH)4 0.24 ± 0.11 0.24 ± 0.11 0.22 ± 0.10 0.21 ± 0.10 1.37 ± 0.65 1.28 ± 0.59 1.23 ± 0.58 1.30 ± 0.61
TP 0.07 ± 0.04 0.08 ± 0.05 0.07 ± 0.04 0.06 ± 0.04 0.39 ± 0.24 0.42 ± 0.25 0.40 ± 0.24 0.38 ± 0.23
TDP 0.05 ± 0.03 0.07 ± 0.04 0.06 ± 0.03 0.04 ± 0.02 0.30 ± 0.16 0.37 ± 0.20 0.34 ± 0.18 0.26 ± 0.14
PO3−
4 0.02 ± 0.01 0.01 ± 0.01 0.01 ± 0.01 0.01 ± 0.01 0.09 ± 0.08 0.07 ± 0.07 0.07 ± 0.06 0.08 ± 0.08
Fe 0.69 ± 0.21 0.74 ± 0.23 0.66 ± 0.21 0.58 ± 0.18 4.00 ± 1.23 3.99 ± 1.22 3.72 ± 1.17 3.58 ± 1.12
Key ratiosb
NO− 3 : Si(OH)4 0.29 ± 0.26 0.18 ± 0.54 0.23 ± 0.31 0.39 ± 0.22 – – – –
3−
NO− 3 : PO4 5.00 ± 0.27 4.21 ± 0.58 5.36 ± 0.35 7.50 ± 0.34 – – – –
Si(OH)4 : PO3−4 17.32 ± 0.19 23.34 ± 0.20 23.21 ± 0.17 19.25 ± 0.21 – – – –
Fe : PO3−
4 60.63 ± 0.19 81.10 ± 0.21 78.55 ± 0.19 61.57 ± 0.20 – – – –
a NO− + NO− fluxes and C + b
3 2 F.W. calculated as the difference between DIN and NH4 . Key stoichiometric ratios calculated from monthly watershed-specific fluxes.
Table 2. Mean (range) annual nutrient concentrations (in µmol L−1 ) and stoichiometric ratios (mol mol−1 ) across the 13 marine stations in
the Meay and Kwakshua channels.
2015 2016 2017 2018 All
Concentrations n n n n
DOC 70.86 (7.87–965) 365 77.69 (34.47–606) 70 96.14 (63.95–131.28) 28 105.82 (59.02–198.89) 16
NO− −
3 + NO2 8.10 (0.01–22.39) 526 11.83 (0.01–20.35) 136 7.75 (0.02–22.07) 108 9.58 (0.02–19.64) 34
Si(OH)4 19.14 (0.12–40.70) 535 23.58 (1.30–34.34) 135 16.56 (0.04–39.64) 108 19.75 (0.11–33.90) 33
PO3−
4 0.77 (< D.L.–2.50) 523 1.04 (0.04–1.61) 136 0.70 (< D.L.–1.76) 103 0.86 (0.01–1.50) 33
Ratios
NO−3 : Si(OH)4 0.24 (< 0.01–2.30) 526 0.32 (< 0.01–0.61) 135 0.29 (< 0.01–1.09) 108 0.40 (0.08–4.01) 33
3−
NO−3 : PO4 5.95 (0.05–317) 515 7.00 (0.06–14.01) 136 7.87 (0.46–83.15) 103 7.63 (0.55–39.10) 33
Si(OH)4 : PO3−
4 11.19 (0.76–1110) 525 6.92 (1.65–433) 135 18.05 (1.67–568) 103 8.04 (0.25–34.30) 33
3−
the depletion of NO−3 , PO4 , and Si(OH)4 occurred annu- Mean DOC concentrations remained low throughout the year
ally in concert with the peak of primary production, fol- (Fig. 3e).
3− 3−
lowed by increases in concentration through the late sum- Mean NO− −
3 : Si(OH)4 , NO3 : PO4 , and Si(OH)4 : PO4
mer and autumn as chlorophyll a concentrations decreased ratios were 0.3 : 1, 6 : 1, and 11 : 1, respectively. All ratios
3−
(Fig. 3b–d). There was a 38-fold increase in surface (0–5 m) shifted seasonally (Fig. 4). NO− −
3 : Si(OH)4 and NO3 : PO4
NO− 3 concentrations between the monthly minimum (June reached a minimum in the summer (June–August) and in-
mean: 0.54 ± 0.10 µmol L−1 ) and maximum (December creased again through the autumn and winter (September
mean: 20.78 ± 0.16 µmol L−1 ). The same seasonal increase through February). NO− 3 : Si(OH)4 was consistently below
was 11-fold for PO3− −1
4 (June: 0.14 ± 0.03 µmol L ; Decem- the Redfield–Brzezinski ratio for diatoms (16 : 15 = 0.94),
−1
ber: 1.58 ± 0.02 µmol L ) and 15-fold for Si(OH)4 (June: oscillating between < 0.1 between May and July and ∼ 0.6
2.58 ± 0.30 µmol L−1 ; December: 37.99 ± 0.23 µmol L−1 ). in January (Fig. 4a) and indicating an excess of Si(OH)4 .
https://doi.org/10.5194/bg-18-3029-2021 Biogeosciences, 18, 3029–3052, 20213036 K. A. St. Pierre et al.: Biogeochemical impacts of rain-fed streams on marine waters
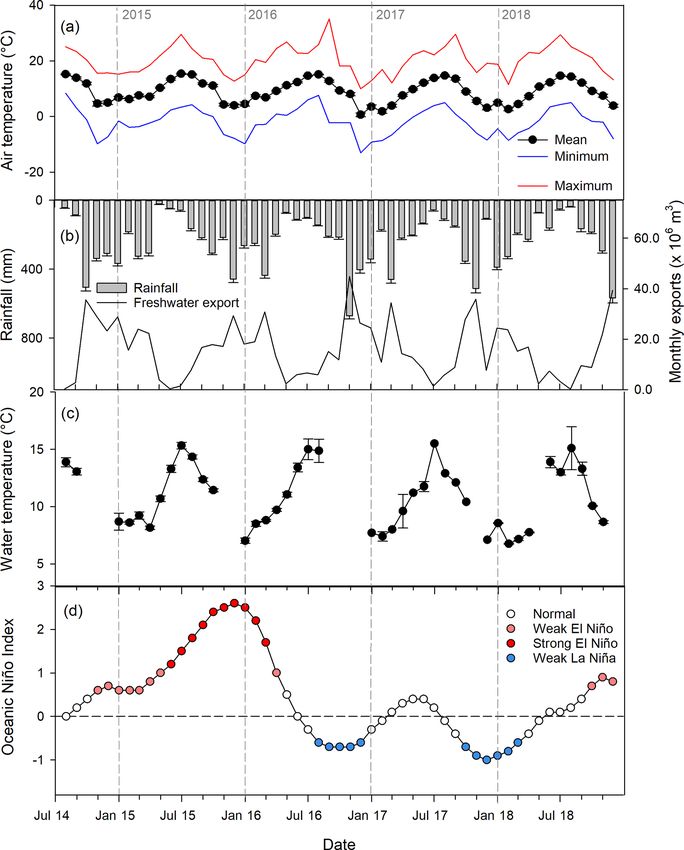
Figure 2. Climatology of the Calvert and Hecate islands over the study period (1 August 2014 to 31 December 2018): (a) monthly mean,
minimum, and maximum air temperature across the seven watershed outlets; (b) mean monthly rainfall across the seven watershed outlets and
total monthly discharge to the Kwakshua Channel system; (c) mean ± SE surface water temperature at the marine stations during sampling
events, measured using an YSI; (d) Oceanic Niño Index, with El Niño and La Niña events highlighted based on thresholds greater than ± 0.5
(weak event) or greater than ± 1.0 (strong event).
3−
NO− 3 : PO4 consistently declined to ∼ 1 : 1 by July of each 3.3 Freshwater nutrient exports to nearshore waters of
year and approached the Redfield ratio (16 : 1) during the the NPCTR
winter months (Fig. 4b). Si(OH)4 : PO3− 4 ratios were close
to or above the Redfield ratio (15 : 1) (Fig. 4c), with less of 3.3.1 Freshwater nutrient and DOC concentrations
a discernible seasonal trend than for the other ratios. Greater
3−
variability between the stations was typically observed in the Mean measured concentrations of NO− 3 , PO4 , Si(OH)4 , and
spring and summer months. DOC in the streams were 0.48, 0.11, 1.67, and 954 µmol L−1 ,
respectively, and showed strong seasonal and spatial variabil-
ity (Table S7). On average, measured concentrations of NO− 3,
PO3−4 , and Si(OH) 4 were 48 ± 21 (1.4–720), 9.87 ± 1.20
(0.62–28.15), and 12.42 ± 1.43 (0.25–28.6) times lower in
fresh water than across the marine stations (Fig. 3b–d).
Biogeosciences, 18, 3029–3052, 2021 https://doi.org/10.5194/bg-18-3029-2021K. A. St. Pierre et al.: Biogeochemical impacts of rain-fed streams on marine waters 3037 Figure 3. Time series of mean (± SE) measured monthly chlorophyll a (a), nutrient (b–d), and dissolved organic carbon (e) concentrations across both marine (mean of 0, 1, and 5 m depths) and freshwater stations. Freshwater fluxes to nearshore waters are also shown, upscaled from the measured fluxes to the entire drainage area of the Kwakshua Channel system. NO− 3 , combined nitrate–nitrite; Si(OH)4 , silicic acid; PO3− 4 , orthophosphate; DOC, dissolved organic carbon. The mean monthly concentrations of PO3− 4 and Si(OH)4 dence of concentration on flow within the watersheds (Ta- in fresh waters only exceeded those in marine waters on ble S7). Although flow-weighted concentrations of DOC one occasion (July 2018). Seasonal variability in freshwa- fluctuated seasonally (Fig. S4), this seasonal cycle was con- ter inorganic nutrient concentrations was muted, compared sistent between years (mixed effect model: only month to marine waters (Fig. 3b–d). In contrast, freshwater con- term p value < 0.05). PO3− 4 concentrations were approxi- centrations of DOC were 14.55 ± 0.99 (6.98–36.29) times mately constant throughout the year (p value on all terms higher than in marine waters and exhibited high seasonal > 0.05), while NO− 3 and Si(OH)4 concentrations were vari- variability, increasing by almost 2-fold between the low able across the period of record (year–month interaction in February (641 ± 69.8 µmol L−1 ) and the high in August p < 0.05) (Fig. S4). (1150 ± 51.3 µmol L−1 ; Fig. 3e). Summary statistics for measured and flow-weighted con- In general, flow-weighted inorganic nutrient concentra- centrations of TN, TDN, DON, DIN, NH+ 4 , TP, TDP, and tions were less than the measured concentrations, whereas dFe are reported in Table S7. Flow-weighted concentrations flow-weighted organic nutrient concentrations were higher of TN, TDN, DON, and dFe varied seasonally (linear mixed than the measured concentrations, reflecting the depen- effects models: month term p value < 0.05; Table S9). As https://doi.org/10.5194/bg-18-3029-2021 Biogeosciences, 18, 3029–3052, 2021
3038                                     K. A. St. Pierre et al.: Biogeochemical impacts of rain-fed streams on marine waters

                                                                                                           3−                     3−
Figure 4. Time series of monthly mean (± SE) stoichiometric ratios for NO−                                                 −
                                                                           3 : Si(OH)4 (a), Si(OH)4 : PO4 (b), and NO3 : PO4 (c) across
the marine (integrated 0–5 m) and freshwater stations. Freshwater stoichiometric ratios are calculated from the monthly watershed-specific
nutrient fluxes. Note that SEs are not shown on the freshwater NO− 3 : Si(OH)4 ratios due to large variability that masks the seasonal pattern.
The extended Redfield ratio is shown as a point of reference (red dashed line).

for PO3−4 , TP and TDP concentrations were approximately                  and dissolved organic phosphorus (∼ 63 %, DOP = TP-PP-
constant throughout the year. DIN and NH+   4 concentrations              PO3−4 ).
                                                                                                                 3−                    3−
were variable across the period of record (year–month in-                    Mean NO−                     −
                                                                                        3 : Si(OH)4 , NO3 : PO4 , and Si(OH)4 : PO4
teraction p < 0.05). DIN concentrations were driven largely               ratios for freshwater fluxes were 0.27, 5.40, and 19.72,
by a dramatic increase in concentration in August 2018 as-                respectively (based on monthly watershed-specific fluxes).
sociated with NO−                     +
                   3 . Trends in NH4 concentrations were                  Mean monthly NO−                           −     3−
                                                                                               3 : Si(OH)4 and NO3 : PO4 ratios were
also highly variable, with consistent interannual differences             consistently at or below the Redfield ratio, although NO−    3 :
from August through December in 2015 (monthly means:                      Si(OH)4 was highly variable (Fig. 4). Notably, NO−       : PO3−
                                                                                                                                 3     4
0.778–0.827 µmol L−1 ) and 2018 (0.277–0.387 µmol L−1 ).                  increased in the late summer. Stoichiometric ratios were,
We note, however, that concentrations of the inorganic N                  however, highly variable between the different watersheds
species and all P species were often near or below detection.             (Fig. S5). Clear seasonal signals were difficult to discern
                                                                          across most watersheds, except for watersheds 703 and 708.
3.3.2   Freshwater nutrient fluxes, speciation, and
                                                                          Watershed 703 in particular displayed late summer peaks
        stoichiometry
                                                                          across all ratios. Fe : PO3−
                                                                                                     4 far exceeded the extended Red-
                                                                          field ratio (0.01–0.1 : 1) across all watersheds (Fig. S5d) and
DOC was by far the largest terrestrial input from the
                                                                          fluctuated synchronously across most watersheds, driven by
seven watersheds to the Kwakshua Channel system (mean
                                                                          the late summer increases in Fe concentrations (Fig. S4).
= 143 ± 20.4; 128 to 156 Mmol yr−1 ; Table 1), exceed-
ing all other inputs by 2 to 3 orders of magnitude. TN
fluxes (2.10 ± 0.30 Mmol yr−1 ) were overwhelmingly DON                   3.3.3   Freshwater yields of nutrients and DOC in a
(81.8 ± 15.5 %), with the remainder as DIN (8.8 ± 4.3 %)                          global context
or particulate N (PN = TN-TDN; 9.4 ± 16.1 %). Around
half (∼ 53.8 %) of DIN was exported as NH+       4 and the                TN yields (378–463 kg km−2 yr−1 ) were at the low end of the
other half as NO−   3 . TP   exports were   extremely  low                global range (1–20 630 kg km−2 yr−1 ) but within the range
(0.07 ± 0.02 Mmol yr−1 ), only 18.9 ± 11.0 % of which was                 for coniferous forests (Alvarez-Cobelas et al., 2008) (Ta-
as the readily available form PO3−
                                 4 , with the balance split               ble S10). Meanwhile, DON yields (304–381 kg km−2 yr−1 )
between particulate phosphorus (∼ 11 %, PP = TP-TDP)                      were at the high end of the estimated global range (10–

Biogeosciences, 18, 3029–3052, 2021                                                           https://doi.org/10.5194/bg-18-3029-2021
K. A. St. Pierre et al.: Biogeochemical impacts of rain-fed streams on marine waters 3039
479 kg km−2 yr−1 ; Alvarez-Cobelas et al., 2008), similar to
recent measurements for other small forested NPCTR wa-
tersheds (229–401 kg km−2 yr−1 ; Fellman et al., 2021) but
exceeding other estimated and modelled mean global and
North American yields by up to 6-fold (Table S10). In con-
trast, DIN yields (33.6–40.9 kg km−2 yr−1 ) were at the low
end of the global ranges for NO− 3 (Alvarez-Cobelas et al.,
2008) but nearly identical to the mean value reported by
Meybeck (1982). Si(OH)4 yields from the watersheds (84.5–
95.7 kg km−2 yr−1 ) were up to 26 times lower than the re-
ported North American average (Dürr et al., 2011). Dissolved
Fe yields (462–596 kg km−2 yr−1 ) exceeded the estimated
global riverine yield by between 55 and 710 times, depend-
ing on the estimate (De Baar and De Jong, 2001; Krachler
et al., 2005). As previously described for a slightly differ-
ent study period (Oliver et al., 2017), DOC yields (22 200–
26 900 kg km−2 yr−1 ) exceeded by almost 2 times the upper
bound of the global range (2000–14 000 kg km−2 yr−1 ) re-
ported by Meybeck (1982) and exceeded by up to 18 and 26
times the modelled global and North American yields, re-
spectively (Seitzinger et al., 2005) (Table S10), although our
combined estimate was lower than that reported for the 2015
water year in Oliver et al. (2017) (33 300 kg km−2 yr−1 ).
3.3.4 Organic-matter-associated versus inorganic
nutrients
Measured TN, TDN, DON, and dFe concentrations pooled
across all watersheds were positively correlated with DOC
(Pearson product moment correlation, r = 0.612–0.738, de-
pending on the species; Table S11). Conversely, concentra-
3−
tions of DIN, NH+ −
4 , NO3 , TP, TDP, PO4 , and Si(OH)4
were only weakly positively (r < 0.300 for TP, TDP, PO3− 4 ,
NH+ 4 , Si(OH)4 ) or negatively (−0.300 < r < 0.000 for DIN, Figure 5. Principal component analysis of flow-weighted bulk
NO− 3 ) associated with DOC. Based on these relationships, freshwater chemistry exports to the nearshore environment. (a) Nu-
we distinguish hereafter between strongly-organic-matter- trients in principal component (PC) space (scaled to preserve cor-
associated (DON – which makes up most of the TDN and relation between variables). Changes in PC1 (b) and PC2 (c) over
TN pools – and dFe) and inorganic (DIN, PO3− 4 , Si(OH)4 )
time (scaled to preserve distance between objects). Note that PC1
nutrients in the freshwater pool. The strength and direction of loadings were multiplied by −1 to facilitate interpretation.
these relationships were, however, highly watershed-specific
(Table S11). This was especially true for Si(OH)4 , for which
watershed-specific correlation coefficients ranged between
−0.15 and 0.60. In particular, there was a strong positive cor- suggesting that it represented primarily dissolved organic
relation between concentrations of Si(OH)4 and DOC from matter (DOM)-associated compounds (Fig. 5a, Table S12).
watersheds 708 and 693 (Table S11), indicating the likely as- PC1 showed strong spatial separation between watersheds
sociation with organic matter in those watersheds. and seasonal variability over the period of record (Fig. 5b).
Watersheds with the highest yields of DOC (626, 819,
3.3.5 Patterns in bulk freshwater chemistry 844; Oliver et al., 2017) also exported high concentrations
of the DOM-associated suite of nutrients (TDN, TN, dFe,
We used PCA to describe the bulk freshwater chemistry inde- DON). Across most watersheds, loadings on PC1 were high-
pendent of discharge over time using monthly flow-weighted est in June–July, indicating higher concentrations of DOM-
DOC and nutrient concentrations. Two principal components associated compounds, reaching a minimum in February–
(PCs) alone accounted for 63.8 % of total observed variabil- March. There was low interannual variability in PC1, sug-
ity. PC1, which accounted for 50.0 % of total variability, was gesting a consistent seasonal export of DOM-associated nu-
defined by TDN, TN, dFe, DON, DOC, Si(OH)4 , and TP, trients from freshwater ecosystems.
https://doi.org/10.5194/bg-18-3029-2021 Biogeosciences, 18, 3029–3052, 20213040 K. A. St. Pierre et al.: Biogeochemical impacts of rain-fed streams on marine waters
PC2 (13.8 %) was negatively associated with TDP, NH+ 4, tion. However, given our observations (Fig. 6) and known
TP, and DIN but positively with PO3−4 and Si(OH) 4 and thus dFe loss from the water column via flocculation and other
represented the inorganic nutrients (Fig. 5a). Like PC1, PC2 processes, we fully acknowledge that these estimates repre-
oscillated seasonally but was much more consistent between sent a hypothetical upper bound on the possible stimulation
watersheds with the exception of watershed 708 (Fig. 5c; of primary production by freshwater dFe.
see Table S3 for watershed information). This pattern is re-
flective of the observed increases in concentrations of DIN,
4 Discussion
NH+ 4 , and TDP in the late winter/early spring and increases
of PO3−4 and Si(OH)4 in late summer/early autumn. Unlike We conducted routine monthly and targeted rainfall event
PC1, there was some interannual variability in PC2. surveys, linking marine-terminating streams and nearshore
surface waters from August 2014 through to December 2018
3.4 Mixing in nearshore waters to quantify the flux of terrestrial materials to nearshore
3− ecosystems from small bog-forest watersheds with a hyper-
Plume concentrations of NO− 3 , PO4 , and Si(OH)4 were maritime climate. Below we discuss spatial and temporal
consistently higher than the freshwater reference concentra-
variability of these fluxes and nutrient availability in receiv-
tions during both rainfall events (Figs. 6, S6). Conversely,
ing nearshore ecosystems, as well as the consequences of ter-
freshwater concentrations of DOC, DON, and dFe were
restrial exports for nearshore ecosystem function, and high-
much higher than in marine waters. During the August rain-
light priority research areas (Fig. 8).
fall event (Fig. 6), all the surveyed nutrients (except for
3−
DOC) mixed non-conservatively, with NO− 3 , PO4 , and dFe 4.1 Decoupling of small hypermaritime watershed
mixing below conservative behaviour and Si(OH)4 and DON exports from wider-scale climate anomalies
mixing above it. During the September 2015 event (Fig. S6),
NO− 3
3 , PO4 , and DOC mixed approximately conservatively The relationship between short-term weather patterns along
across most of the plume, whereas Si(OH)4 concentrations the northeast Pacific coast and the ONI has been well de-
were well above conservative mixing, suggesting an addi- scribed, with El Niño events associated with warmer air
tional source of Si(OH)4 to surface waters during the rain temperatures and lower rainfall/stream flow, and La Niña
events. DON and dFe were below conservative mixing. events corresponding to colder and wetter periods (Ward et
During both events, NO− 3 : Si(OH)4 was below the Red- al., 2010). We did not, however, find this to be true at the
3−
field ratio across the plume (Figs. 7, S7). NO− 3 : PO4 was
scale of the Kwakshua Channel system, where air tempera-
above the Redfield ratio at lower salinities (5–10 salinity ture and precipitation anomalies were unrelated to the ONI
units) but approached the ratio across the rest of the plume (Fig. S3). Whereas most work relating climate anomalies to
during the September event (Fig. S7) and was well below the stream flow has focused on large river basins (Wang et al.,
Redfield ratio across the whole plume except for one station 2006) or continental scales (Ward et al., 2010), our results
in August (Fig. 7). Fe : PO3− −
4 and Fe : NO3 were close to the
suggest that localised freshwater inputs from smaller hyper-
Redfield ratio across the plumes during both events. maritime watersheds of the NPCTR may be a more consis-
tent input to nearshore surface waters. The small size of the
3.5 Role of inorganic freshwater nutrient inputs in study watersheds (3.2–12.8 km2 ) limits retention of precipi-
subsidising nearshore productivity tation, such that rain events directly translate into enhanced
stream flows. That being said, ENSO events may have re-
By scaling estimates of primary productivity measured at the sulted in more intense storms or longer periods of low flow
nearby Rivers Inlet (51.7◦ N, 127.3◦ W; Shiller, 2012) to the (Brigode et al., 2013), a temporal scale which was not specif-
surface area of the Kwakshua Channel system, we previ- ically examined here.
ously estimated that total primary production is on the or- In the marine environment, El Niño and La Niña events
der of 21 to 42 Gg C yr−1 (St. Pierre et al., 2020a). Assum- have been associated with changes in nutrient availability in
ing that phytoplankton nutrient requirements are at the ex- the coastal northeast Pacific (Whitney and Welch, 2002). In-
tended Redfield ratio, freshwater DIN and Si(OH)4 exports tensification of stratification during El Niño events can lead
from the small coastal watersheds of the Calvert and Hecate to nutrient depletion in the surface ocean during the summer
islands could, at most, directly support primary production productive season (Whitney and Welch, 2002). Conversely,
on the order of 0.02 Gg C yr−1 , or less than 1 % of the es- during La Niña events deeper mixing can favour higher nu-
timated total. Freshwater PO3−4 fluxes likewise could only trient concentrations in surface waters (Whitney and Welch,
support up to 0.02 Gg C yr−1 (based on the largest annual 2002). That there were no discernible interannual differences
fluxes from 2016; Table 1). Assuming no loss, the freshwater in nutrient availability in surface waters of the Kwakshua
dFe inputs could support between 7.3 Gg C yr−1 (based on Channel system may have been due to a stronger influence
P : Fe = 0.1) and 94.5 Gg C yr−1 (based on P : Fe = 0.01), or of local oceanographic processes.
between 17.4 % and 450 % of the estimated primary produc-
Biogeosciences, 18, 3029–3052, 2021 https://doi.org/10.5194/bg-18-3029-2021K. A. St. Pierre et al.: Biogeochemical impacts of rain-fed streams on marine waters 3041
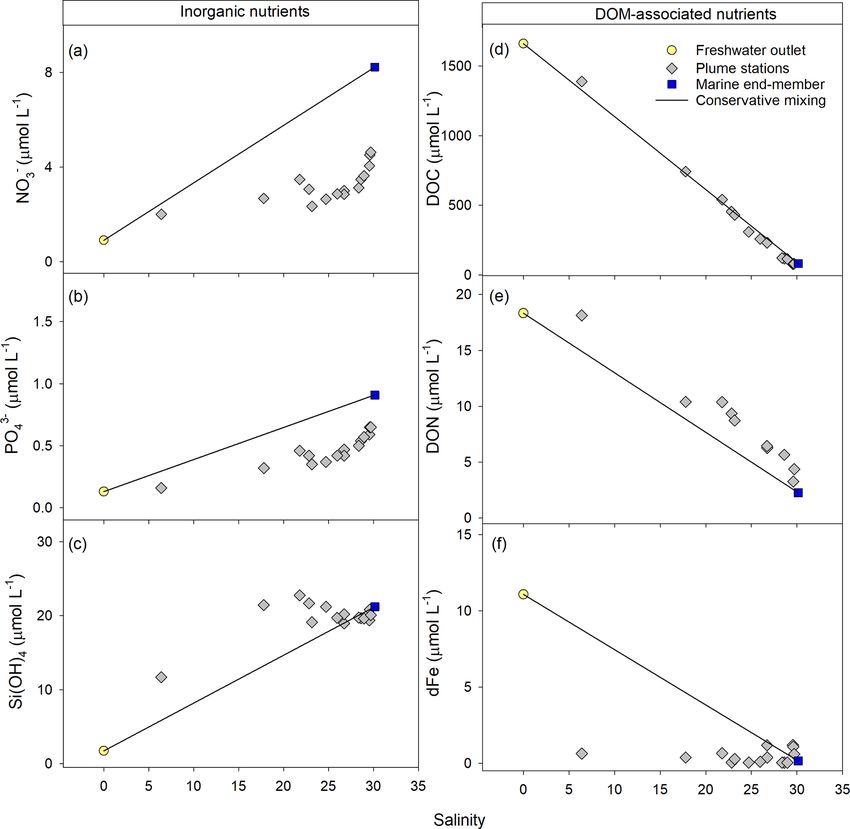
Figure 6. Nutrient concentration mixing plots across the freshwater plume (0, 1, and 5 m at six stations) at the outlet of watershed 819 for
3−
the 86.8 mm rainfall event on 7 August 2015 (day 5 of 6 d event). Combined nitrate–nitrite (NO− −
3 + NO2 ; a), orthophosphate (PO4 ; b),
silicic acid (Si(OH)4 ; c), dissolved organic carbon (DOC; d), dissolved organic nitrogen (DON; e), and dissolved iron (dFe; f) are shown.
Freshwater and marine end-members are the mean concentration at watershed 819 for August 2015 and the plume sample with the highest
salinity, respectively.
4.2 Importance of freshwater exports for nearshore by mineral weathering, which releases PO3− 4 , among other
primary production ions (Walker and Syers, 1976). However, the quartz dior-
ite bedrock in the area is poor in P, with less than 0.2 %
4.2.1 Origin of nutrients in freshwater systems of the of the mineral content accounted for by P-containing com-
NPCTR pounds (Roddick, 1996). The mineral P pool from which
non-occluded P (PO3− 4 sorbed to Fe and aluminium oxides;
Nutrients in freshwater ecosystems of the NPCTR originate Walker and Syers, 1976) can be mobilised is thus very small,
from a diverse array of potential sources, including soils and such that remineralisation of organic material is likely to be
terrestrial ecosystems, interactions with the atmosphere, and the primary source of P in these watersheds. The small size
the return of migratory fish species (Sugai and Burrell, 1984; of the watersheds and the large and frequent rainfall events
Hood et al., 2007; Fellman et al., 2009c). Inorganic nitrogen characteristic of the NPCTR may limit in-watershed repro-
species in fresh waters may originate from the fixation of cessing of the large quantities of DOM, except in those few
atmospheric N2 or the ammonification of organic matter to watersheds with larger lake and wetland areas (Oliver et al.,
NH+ −
4 , with subsequent nitrification to NO3 (Wetzel, 2001).
2017). Based on lithology (Hartmann and Moosdorf, 2012)
On the other hand, P has a geologic source and is mobilised and the hypermaritime boundary (Salkfield et al., 2016), we
https://doi.org/10.5194/bg-18-3029-2021 Biogeosciences, 18, 3029–3052, 2021You can also read