2018-2023 Price Submission - Rural - Lower Murray Water 28 September 2017
←
→
Page content transcription
If your browser does not render page correctly, please read the page content below
2018-2023 Price Submission - Rural
Lower Murray Water
28 September 2017

Highlights of LMW’s Rural Price Submission
LMW’s Price Submission will deliver outcomes for customers, which have been formed
from deep and extensive consultation and expressed in customer terms, to:
 • Supply me with water when I need it
 • Keep my costs to a minimum
 • Be easy to contact and quick to respond
 • Comply with Government obligations.
The price path will provide stability for customers while ensuring an appropriate
allocation of risk, and in particular electricity price risk. Total tariffs including bulk water
charges are proposed to change in real terms by:
• For irrigation and drainage customers, between a 1.3% average annual reduction in
 Robinvale to a 2.6% average annual increase in the Mildura HPS District.
• For domestic and stock customers, average annual reductions of between 2.0% and
 0.2%.
• For private diversion customers, an annual average increase of 1.7%.
LMW will leverage off a sound operational and cost base to implement the following key
change strategies that will ensure delivery of the price path and outcomes for customers.
 • Optimise Irrigation Network utilisation to supply water when the crops need it both
 within and adjacent to the irrigation districts.
 • Culture Change with the Customer at the Centre, supported by engaged people
 • Business Transformation of work processes
 • Asset Optimisation through asset management and system management.
Controllable costs will increase by 0.16% per annum, on average, or a total of $130,000 over
the five-year period, above the baseline 2016-17 operating costs, entirely due to electricity
price increases. Major capital projects have been fully justified to optimise utilisation
through supplementary irrigation pipelines, improve reliability through replacing ageing
network assets and upgrading monitoring and control systems, and solar renewables projects
to meet government emissions reduction targets. Renewal expenditure has been optimised to
ensure a sustainable irrigation system and smooth capex over a 20 year timeframe as
supported by our customers, increasing from an average of $400,000 in the current pricing
period to a proposed $1.8 million in this submission.
Service levels will be maintained at current performance levels, with moderate
improvements in channel and pipe bursts and leaks and overall customer satisfaction. New
government obligations required by the Minister’s Letter of Expectations and the Water for
Victoria strategy will be delivered.
Risk allocation has been assessed at multiple levels, consistent with a ‘no surprises’
approach, and LMW has taken on additional risks associated with optimised timing and
reduced contingencies associated with major projects, a proactive approach to uncertain
projects such as SMP2, managing uncertainties in electricity price forecasts and their
appropriate treatment, and a revenue cap to manage price risk to customers.
Management has delivered this Price Submission with extensive engagement with the LMW
Board through its Finance and Audit Committee to ensure the Submission is our ‘best offer’,
based on reasonable and prudent forecasts of demand and efficient costs, and an appropriate
allocation of risk between the business and its customers. LMW staff live in the relatively
small communities served. Senior management engagement and feedback of community
perceptions and expectations occurs on an almost daily basis.
This price submission is underpinned by a stable track record in delivering strong
performance outcomes and managing ‘for the customer’ through a demonstrated willingness
to accept risk and return additional revenues to customers.

 Lower Murray Water - 2018-2023 Price Submission - Rural | i
Lower Murray Water Acknowledgement of the Aboriginal
Traditional Owners of the Region
Lower Murray Water operates within the traditional lands of First Nations People; these
groups are, starting from the furthest upstream group along the Murray (Mil) and moving
downstream through to the Western edge of our area at the Victorian South Australian
Border:
The Barapa Barapa Peoples, the Wamba Wamba Peoples, the Wadi Wadi Peoples, the
Tatti Tatti Peoples, the Latji Latji Peoples, the Nyeri Nyeri Peoples and the Werigia
Peoples.
The management and staff at Lower Murray Water proudly acknowledge the traditional
owners and respect their connection to both their land and waterways.
Importantly, we at Lower Murray Water also acknowledge that the land and water in
which we operate, is still the life blood of the traditional owners of this land. The
stories that connected the ancestors to their world still connect the First Nations
Peoples of this area today.
The land and water are to be respected and nurtured, to be in keeping with these First
Nations Peoples….

 Lower Murray Water - 2018-2023 Price Submission - Rural | ii
Executive Summary
Introduction

While LMW operates as a single business entity, its prices are regulated under two
different regulators and regulatory frameworks: the Australian Competition and
Consumer Commission (ACCC) for rural services operated within the Murray-Darling Basin
under the Water Charge Infrastructure Rules (WCIR); and the Essential Services
Commission (ESC) for urban services under the Victorian government’s Water Industry
Regulatory Order 2014 (WIRO).
This Price Submission is submitted for the rural irrigation and drainage services. Costs
for shared services, such as corporate, are allocated between the urban and rural parts
of the business.
The Price Submission is prepared in accordance with the ESC’s Lower Murray Water Rural
Price Review Guidance paper for rural infrastructure services, February 2017, noting
that the ESC is the accredited regulator for 10 years from 17 February 2012 for LMW’s
rural services. The Price Submission is also prepared under the current WCIR principles
as the Commonwealth government’s response to the ACCC’s recommendations for
changes to the WCIR principles has not been advised at the time of writing this
Submission.
A five-year price period is proposed to align with LMW’s urban business regulatory
period.
Overview of Proposed Rural Prices

Total tariffs including bulk water charges are proposed to change in real terms by:
• For irrigation and drainage customers, between a 1.3% average annual reduction in
 Robinvale to a 2.6% average annual increase in the Mildura High Pressure System
 (HPS) District.
• For domestic and stock customers, average annual reductions of between 2.0% and
 0.2%.
• For diversions customers, an annual average increase of 1.7%.
The primary driver for the price changes is the substantial increase in forecast
electricity costs. There is a forecast overall reduction in other costs due to a
combination of investments and efficiencies, comprising:
• Labour costs arising from an initial investment in resources to drive efficiency and
 improvements in business processes, energy efficiency and procurement, and asset
 management,
• Investment in IT network security,
• Reductions in bulk water charges,
• Increase in the Regulatory Asset Base (RAB), and
• Reduction in staff numbers to deliver efficiencies in labour costs.
Table 1 overleaf sets out current and proposed unit price changes for reference
customers, for the major services for the period to 2022-23. Detailed tariffs for all
services are provided in Section 6.2.2.

 Lower Murray Water - 2018-2023 Price Submission - Rural | iii

Table 1 Changes to Real Unit Prices for Reference Customers – $ 1/1/18

Service/District Current Fourth Regulatory Period
(per ML or 100kL)
 2016-17 2017-18 2018-19 2019-20 2020-21 2021-22 2022-23 % Change

Mildura irrigation and 139.77 138.20 138.49 138.79 139.11 139.45 139.79 0.2%
drainage (per ML)
Merbein irrigation and 113.51 111.94 111.91 111.90 111.90 111.92 111.95 0.0%
drainage (per ML)
Red Cliffs irrigation and 120.11 118.54 119.38 120.24 121.11 122.01 122.92 0.7%
drainage (per ML)
Robinvale irrigation and 215.35 213.79 210.94 208.14 205.39 202.69 200.03 -1.3%
drainage (per ML)

Mildura HPS (per ML) 194.26 192.69 196.87 201.58 206.85 212.73 219.26 2.6%

Millewa Urban (Irrigation) 2.23 2.22 2.20 2.19 2.19 2.19 2.20 -0.2%
(per 100kL)
Millewa Rural (Irrigation) 1.95 1.94 1.90 1.86 1.82 1.79 1.75 -2.0%
(per 100kL)
Other stock and domestic 546.21 545.52 540.38 534.48 528.67 522.94 517.28 -1.1%
(Irrigation) (per ML)
Diversions (Irrigation) 13.30 11.74 11.91 12.10 12.31 12.53 12.77 1.7%
(per ML)
Notes:
• All bills including pass through bulk water costs.
• Reference customers usage is based on 100ML/annum usage for irrigation customers, 400kL for
 Millewa Urban, 4300kL for Millewa Rural, 3ML for Other Domestic & Stock, and 1000ML for diversions
 customers.
• Percentage change (% change) is average per annum for period 2017-18 to 2022-23.

Changes to these unit prices are set out in Figure 1 for irrigation and diversions
customers, and in Figure 2 overleaf for domestic and stock customers.
Figure 1 Changes to Real Unit Prices for Irrigation & Diversion Customers

 Lower Murray Water - 2018-2023 Price Submission - Rural | iv
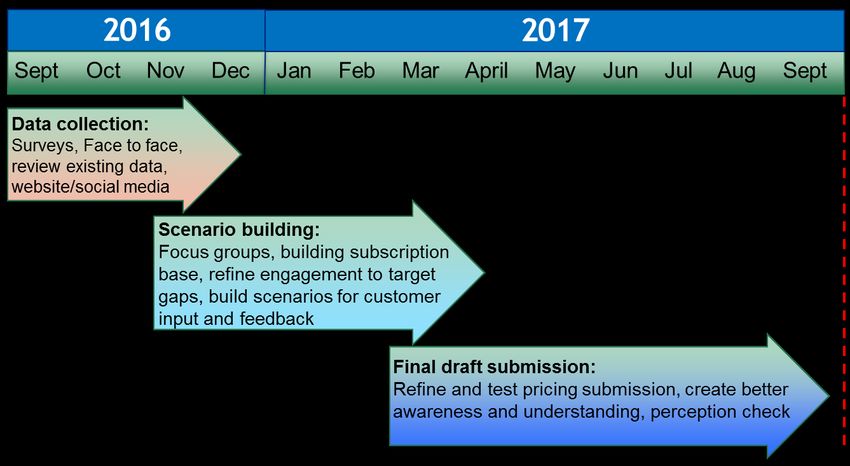
Figure 2 Changes to Real Unit Prices for Domestic & Stock Customers

Impact of Sunraysia Modernisation Project

The Sunraysia Modernisation Project Stage 1 (SMP1) was delivered, under budget and
within the planned timeframe, to meet its objectives of securing a long term sustainable
future for Sunraysia irrigators in the context of climate change and reduced water
availability, and delivering a substantial and lasting return of water to the environment
to secure real improvements in river health.
The project delivered substantial benefits to 15% more customers than planned (through
an extended scope) by providing 365 day irrigation access to some 1334 irrigation outlets
serving 8652 hectares, or 66% of irrigation customers in those Districts. Additional
benefits to customers included improved network reliability and water quality,
enhanced metering and water ordering, as well as reduced operating costs and
requirements for current and future asset replacement, enabling them to increase
production, diversify their farm businesses and invest in new horticulture.
The project also delivered water recovery targets for the Murray-Darling Basin from the
Red Cliffs, Mildura and Merbein Districts through transfer of 7.0 GL of water savings to
the Commonwealth.
The project provided further community benefits in improved community safety near
channels, local employment of more than 50 local subcontractors along with an
estimated 180 jobs created for the life of the project, and enhanced environmental
outcomes for wetland communities.
Overview of Proposed Customer Outcomes

LMW adopted a new Customer Engagement Strategy prior to this Price Submission
preparation, using the International Association of Public Participation (IAP2) principles
for customer engagement. LMW sought a deeper level of engagement than ever before,
through direct engagement at public events, consultative forums, customer committees,
via the web and social media, and customer surveys. This deeper level of engagement
took LMW from an ‘inform’ level of consultation to ‘involve’, which provided LMW with a
strong link from customer wants to the outcomes that have been agreed.
Extensive customer engagement revealed a strong customer preference for ‘maintaining
services with continuous improvement while containing costs’, expressed by customers

 Lower Murray Water - 2018-2023 Price Submission - Rural | v

as: Supply me with water when I need it, Keep my costs to a minimum, and Be easy to
contact and quick to respond.
Customer satisfaction is considered to be at appropriate levels based on survey results as
shown in Figure 3. Therefore, there is no driver for a significant or step change in
customer service standards or price path or tariff structure for customers over the next
period.
Figure 3 Customer Satisfaction With Irrigation Services

LMW recognises that it must maintain its focus on delivering outcomes for customers.
Following four rounds of engagement, debate, revision and agreement with its customer
forums, LMW adopted four customer outcomes:

 1. Supply me with water when I need it
 2. Keep my costs to a minimum
 3. Be easy to contact and quick to respond
 4. Comply with other government obligations

These outcomes will be central to the way LMW does business with its customers. To
deliver them, LMW will adopt the following strategies, together designed to improve
customer experience and provide value added services:
• Optimise Irrigation Network Utilisation,
• Customer at the Centre,
• Culture Change,
• Business Transformation, and
• Asset Optimisation.
The Sunraysia Modernisation Project Phase 2 (SMP2) and Sunraysia Rejuvenation Project
(SRP) are also expected to present other opportunities for improving services in
partnership with rural businesses.
Service levels will be maintained largely at current levels, with LMW accepting more risk
with proposed tighter service performance targets over the period for:
• Improving channel/pipe bursts and leaks to better than 60 per 100 km per year, and
• Improving overall customer satisfaction survey results to better than 82%.

 Lower Murray Water - 2018-2023 Price Submission - Rural | vi
Contents
1. Lower Murray Water Rural Business Summary...................................................... 1
 1.1 Business Entity ........................................................................................................................... 1

 1.2 LMW Rural Services .................................................................................................................... 1

 1.3 Customers and Assets ............................................................................................................... 2

 1.4 Operating Context ....................................................................................................................... 2
2. Customer Engagement and Outcomes ................................................................... 3
 2.1 Customer Engagement Approach and Basis ........................................................................... 3

 2.2 What LMW’s Customers Say...................................................................................................... 6

 2.3 Proposed Outcomes Agreed With Customers ......................................................................... 8
 2.3.1 Proposed Outcomes, Outputs, Deliverables and Targets. ............................................... 8
 2.4 Proposed Performance Assessment and Reporting ............................................................. 13

 2.5 Delivering on Outcomes Commitments .................................................................................. 15
 2.5.1 Guaranteed Service Levels ............................................................................................ 15

3. LMW’s Strategic Response and Management ...................................................... 16
 3.1 LMW’s Strategic Approach ...................................................................................................... 16

 3.2 Government and Other Obligations ........................................................................................ 16

 3.3 LMW’s Vision and Strategic Themes ...................................................................................... 17
 3.3.1 Optimise Irrigation Network Utilisation ............................................................................ 17
 3.3.2 Customer at the Centre .................................................................................................. 19
 3.3.3 Business Transformation ................................................................................................ 20
 3.3.4 Culture Change ............................................................................................................... 20
 3.3.5 Asset Optimisation .......................................................................................................... 20
 3.4 Track Record in Performance .................................................................................................. 21
 3.4.1 Service Standards and Other Outcomes ........................................................................ 21
 3.4.2 Improvements in Customer Service Outcomes from SMP1 ........................................... 22
 3.4.3 Actual Capital Expenditure for the Delivery of Outcomes............................................... 23
 3.4.4 Actual Operating Expenditure for the Delivery of Outcomes .......................................... 24
 3.4.5 Actual Revenue for 2013-18 ........................................................................................... 26

4. Management ............................................................................................................ 28
 4.1 Management of the Price Submission .................................................................................... 28

 4.2 Managing Risk ........................................................................................................................... 28

 4.3 Regulatory Period ..................................................................................................................... 29
5. Revenue Requirement............................................................................................. 30
 5.1 Overview of Revenue Requirement ......................................................................................... 30

 Lower Murray Water - 2018-2023 Price Submission - Rural | vii
5.2 Demand ...................................................................................................................................... 31
 5.2.1 Rural Demand Context and Drivers ................................................................................ 31
 5.2.2 Basis for Demand Forecasts .......................................................................................... 31
 5.2.3 Demand Forecast ........................................................................................................... 31
 5.2.4 Other Services ................................................................................................................ 33
 5.3 Forecast Operating Expenditure ............................................................................................. 33
 5.3.1 Actual and Planned Operating Expenditure ................................................................... 33
 5.3.2 Baseline Controllable Operating Expenditure ................................................................. 35
 5.3.3 Pass Through Fees......................................................................................................... 37
 5.3.4 Impact of Sunraysia Modernisation Project Stage 1 on Operating Costs ...................... 38
 5.3.5 Additional Costs for PS4 ................................................................................................. 39
 5.3.6 Other Productivity Improvements for the Forthcoming Period ....................................... 40
 5.3.7 Electricity Costs .............................................................................................................. 41
 5.3.8 Allocation of Shared Costs ............................................................................................. 41
 5.3.9 Potential Uncertain Event for SMP2 ............................................................................... 42
 5.4 Forecast Capital Expenditure .................................................................................................. 42
 5.4.1 Basis for Development of the Capital Program .............................................................. 42
 5.4.2 Forecast Capital Expenditure ......................................................................................... 43
 5.4.3 Major Projects ................................................................................................................. 44
 5.4.4 Capex/Opex Tradeoffs .................................................................................................... 45
 5.4.5 Delivery of the Capital Program ...................................................................................... 45
 5.4.6 Uncertain Projects........................................................................................................... 45
 5.5 Other Revenues ......................................................................................................................... 46
 5.5.1 Pass Through Fees......................................................................................................... 46
 5.5.2 Other Revenues .............................................................................................................. 46
 5.6 Return on and of the RAB ........................................................................................................ 47
 5.6.1 Rolling Forward the RAB ................................................................................................ 47
 5.6.2 Regulatory Depreciation ................................................................................................. 49
 5.6.3 Rate of Return................................................................................................................. 49
 5.7 Tax Allowance ........................................................................................................................... 49
6. Prices........................................................................................................................ 50
 6.1 Form of Price Control ............................................................................................................... 50

 6.2 Prices and Tariff Structures ..................................................................................................... 50
 6.2.1 Introduction ..................................................................................................................... 50
 6.2.2 Tariff Structures .............................................................................................................. 50
 6.2.3 Proposed Tariffs.............................................................................................................. 52
 6.2.4 Miscellaneous Charges .................................................................................................. 55
 6.2.5 Non-Prescribed Services ................................................................................................ 55
 6.3 Adjustment to Prices ................................................................................................................ 56

 Lower Murray Water - 2018-2023 Price Submission - Rural | viii
6.3.1 Uncertain or Unforeseen Events..................................................................................... 56
 6.3.2 Electricity Prices.............................................................................................................. 56
 6.4 Financial Position ..................................................................................................................... 59

Figures
Figure 1 Changes to Real Unit Prices for Irrigation & Diversion Customers............................................... iv
Figure 2 Changes to Real Unit Prices for Domestic & Stock Customers..................................................... v
Figure 3 Customer Satisfaction With Irrigation Services ............................................................................. vi
Figure 4 LMW Operating Area .................................................................................................................... 1
Figure 5 Price Submission Customer Engagement Overview .................................................................... 3
Figure 6 Timeline for Price Submission Customer Engagement ................................................................ 4
Figure 7 Maturity of Customer Engagement Process ................................................................................. 5
Figure 8 Customer Survey Results for Overall Satisfaction ........................................................................ 6
Figure 9 LMW’s Strategic Alignment to Customer Outcomes ................................................................... 16
Figure 10 Capacity Utilisation Opportunity .................................................................................................. 18
Figure 11 Actual Capital Expenditure Compared to Approved Forecast .................................................... 24
Figure 12 Actual Operating Expenditure Compared to Approved Forecast................................................ 26
Figure 13 Actual Tariff Revenue Compared to Approved Forecast ............................................................ 27
Figure 14 Revenue Requirement - $M 1/1/18 ............................................................................................. 30
Figure 15 Historic and Forecast Water Usage Irrigation Districts (ML pa) .................................................. 33
Figure 16 Forecast Operating Expenditure - $M 1/1/18 .............................................................................. 35
Figure 17 Forecast Capital Expenditure ...................................................................................................... 44
Figure 18 Historical and Forecast Urban and Rural Capital Program ......................................................... 45
Figure 19 Rolling Forward the Regulatory Asset Base to 2027-28 ............................................................. 48
Figure 20 Proposed Bills for Reference Customers - Irrigation & Diversions ............................................. 55
Figure 21 Proposed Bills for Reference Customers - Millewa..................................................................... 55
Figure 22 Price Adjustment Scenarios ........................................................................................................ 57

Tables
Table 1 Changes to Real Unit Prices for Reference Customers – $ 1/1/18 .............................................. iv
Table 2 Rural Customers and Assets (2016-17) ........................................................................................ 2
Table 3 Customer Outcomes ..................................................................................................................... 9
Table 4 Proposed Performance Assessment Criteria .............................................................................. 14
Table 5 Customer Activity Commitments ................................................................................................. 14
Table 6 LMW Strategy Area Alignment to Customer Outcomes ............................................................. 17
Table 7 Service Performance for 2013-18 ............................................................................................... 22
Table 8 Actual Capital Expenditure for 2013-18 - $M 1/1/18 ................................................................... 24
Table 9 Actual Operating Expenditure for 2013-18.................................................................................. 25
Table 10 Actual Revenue for 2013-18 ....................................................................................................... 27
Table 11 Risk Management and Mitigation Tools ...................................................................................... 29
Table 12 Revenue Requirement – $M 1/1/18 ............................................................................................ 30
Table 13 Rural Services Forecast Volumes Summary– ML pa ................................................................. 32
Table 14 Actual and Planned Operating Expenditure - $M 1/1/18 ............................................................ 33
Table 15 Baseline Controllable Operating Expenditure 2016-17 ............................................................... 36
Table 16 Non-Recurring Cost Adjustments to 2016-17 Base Operating Expenditure ............................... 36
Table 17 Costs Attributable to Pass Through Fees - $M 1/1/18 ................................................................ 37
Table 18 SMP Operating Cost Impacts for PS4 ........................................................................................ 39
Table 19 Forecast Capital Expenditure - $M 1/1/18 .................................................................................. 43
Table 20 Proposed Major Capital Projects and Programs ......................................................................... 44
Table 21 Revenue From Pass Through Fees ............................................................................................ 46
Table 22 Other Revenue ............................................................................................................................ 47
Table 23 Updating the Regulatory Asset Base .......................................................................................... 48

 Lower Murray Water - 2018-2023 Price Submission - Rural | ix
Table 24 Rolling Forward the Regulatory Asset Base ............................................................................... 48
Table 25 Proposed Rural Tariffs – $ 1/1/18 ............................................................................................... 53
Table 26 Comparison of Changes to Unit Prices for Reference Customers ............................................. 54
Table 27 Electricity Usage and Implied Prices ........................................................................................... 56
Table 28 Base Usage Charges and Energy Prices ................................................................................... 58
Table 29 Financial Indicators ..................................................................................................................... 59
Table 30 Pumped Irrigation Forecast Volumes Summary– ML pa ............................................................ 60
Table 31 Stock and Domestic Volumes (kL pa) ......................................................................................... 60
Table 32 Delivery Share Forecast – Irrigation Districts (ML pa) ................................................................ 60
Table 33 Water Rights and AULs (For drainage) (ML pa) ......................................................................... 61
Table 34 Water Delivered........................................................................................................................... 61
Table 35 Annual Permits (Diverters) ML pa ............................................................................................... 62
Table 36 Properties and Hectares ............................................................................................................. 62

Appendices
Appendix A Demand Forecasts ....................................................................................................................... 60
Appendix B Capital Expenditure ...................................................................................................................... 63
Appendix C Major Projects and Programs ...................................................................................................... 64
Appendix D Miscellaneous Charges ................................................................................................................ 65

 Lower Murray Water - 2018-2023 Price Submission - Rural | x
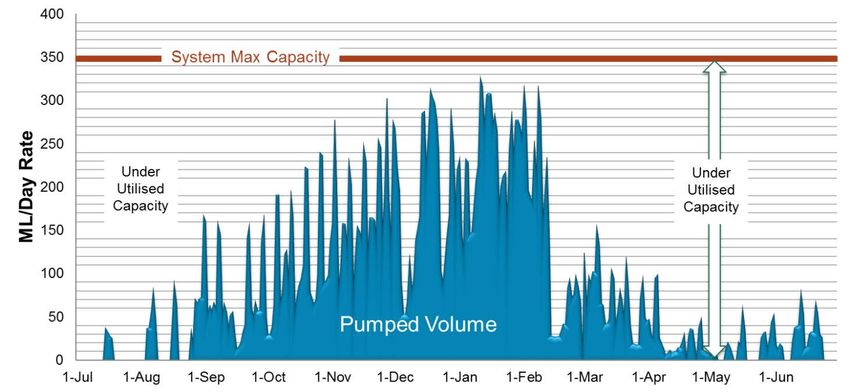
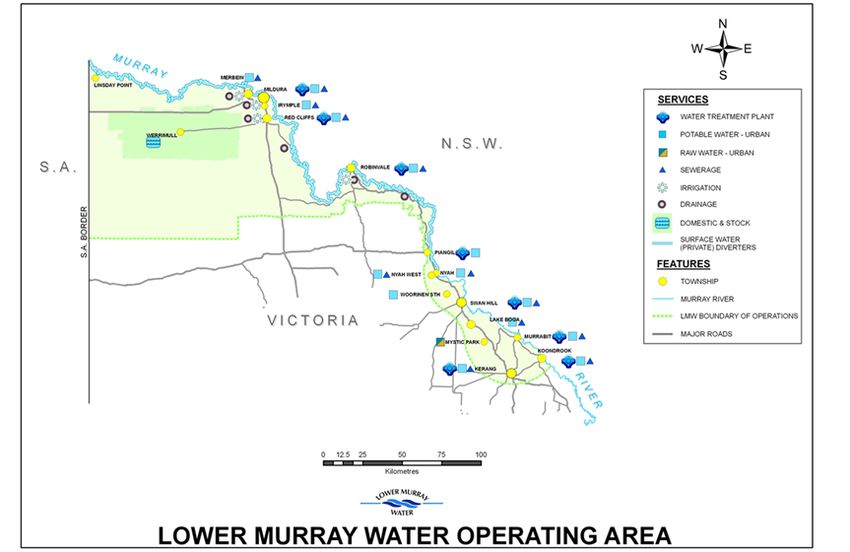
1. Lower Murray Water Rural Business
 Summary
1.1 Business Entity
Lower Murray Urban & Rural Water Authority was formed on 1 July 2004, and became
the Lower Murray Urban and Rural Water Corporation (LMW) On 1 July 2007. On 19th
August 2008, it took over the functions of the First Mildura Irrigation Trust (FMIT).
While LMW manages its rural and urban businesses as a single business entity, prices for
these businesses are regulated under two different regulators and regulatory
frameworks:
• Australian Competition and Consumer Commission (ACCC) for rural services operated
 within the Murray-Darling Basin under the Commonwealth Water Charge
 Infrastructure Rules (WCIR), and
• Essential Services Commission (ESC) for urban services under the Victorian
 government’s Water Industry Regulatory Order 2014 (WIRO).

1.2 LMW Rural Services
LMW operates across the municipalities of Mildura, Swan Hill and Gannawarra in North-
Western Victoria, with LMW’s operating area and key services shown in Figure 4.
Figure 4 LMW Operating Area

LMW delivers rural water services including:
• Irrigation - districts of Mildura, Merbein, Red Cliffs and Robinvale
• Domestic and stock – Mildura, Merbein, Red Cliffs and Robinvale and Millewa rural
 district
 Lower Murray Water - 2018-2023 Price Submission - Rural | 1
• Surface water diversion licences along the Murray River in Victoria between Nyah
 and the South Australian border
• Subsurface Drainage – systems of Mildura, Merbein, Red Cliffs, Robinvale, Nangiloc-
 Colignan, Tol Tol, Bumbang and Boundary Bend diverters.

1.3 Customers and Assets
LMW provides untreated river water to customers through four pumped irrigation
districts, domestic and stock supply and surface water diverters. A summary of
customers and assets is provided in Table 2.
Table 2 Rural Customers and Assets (2016-17)
Rural customers and volumes Statistic
Irrigation Customers 4,458
Domestic and Stock Customers 292
Private Diverters 1,160
Total Customers 5,910
Irrigation Usage 86,298 ML
Domestic and Stock Customers Usage 866 ML
Diverters Annual Usage Limit 566,118 ML
Assets
Pump Stations 15
Irrigation Channels 36.2 km
Irrigation Pipelines 630.3 km
Domestic and Stock 469 km

1.4 Operating Context
LMW’s operating region is highly productive, delivering $2.8 billion per annum 1 in gross 0F

regional product to the Victorian and Australian economy. Conversely, the region is
relatively remote and covers a large geographic area extending over 300 km along the
lower Murray River, in the driest part of Victoria.
LMW recognises that its customers’ and community’s overall well-being and livelihood is
directly linked to the agricultural, tourism and support industries which form the
region’s economic backbone. How it manages regional water resources recognises the
intrinsic interrelation between the resource and the region’s social and economic fabric.
These factors pose challenges for control of essential water services and their efficient
management, whilst also providing opportunities for greater community engagement and
a contribution to the community and its growth through the synergies of a combined
urban and rural water business. Critical risks for LMW include:
• Water security and maintaining irrigation and water services and their related
 community amenity, especially under drought conditions and flood events
• Maintaining affordability of water services to the community under the economic
 impacts of fluctuating food commodity prices.

1
 Mildura Development Corporation www.milduraregion.com.au/region
 Lower Murray Water - 2018-2023 Price Submission - Rural | 2
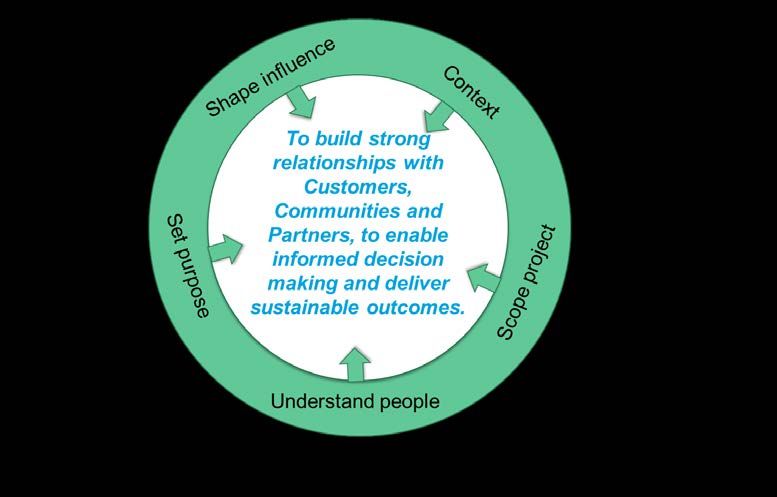
2. Customer Engagement and Outcomes
2.1 Customer Engagement Approach and Basis
In 2016, LMW completed an organisational restructure designed to put the customer at
the centre of its business. This restructure formed a sound platform to enable
engagement with its customers for this Price Submission 2018-23, known as PS4.
Comparative to previous pricing submissions, engagement with customers has been
deeper and broader and involved all of the Board and Management in order to:
• Get to the heart of customer issues and concerns,
• Define what is important - customer value,
• Specifically develop customer outcomes, and
• To provide input to draft operating and capital expenditure programs and price
 paths.
Engagement for this pricing submission is part of an overall Customer Engagement
Strategy 2 designed to build strong relationships with customers, communities and
 1F

partners to enable informed decision making and deliver sustainable outcomes. The
Strategy incorporated the values, ethics and process for public participation as
established by the International Association of Public Participation (IAP2).
Specifically for the Price Submission and to align with both the requirements of WCIR for
the rural business and the ESC’s PREMO framework for the urban business, an approach
was designed as depicted in Figure 5 3, recognising both the urban and rural parts of the
 2F

business and the diversity of customer groups and geographic regions.
Figure 5 Price Submission Customer Engagement Overview

The approach was developed into a delivery plan along with funding, resourcing and a
delivery timeline, shown in Figure 6, commencing in September 2016 and progressing
through to finalisation of the draft Price Submission in September 2017.

2
 LMW Customer Engagement Strategy for 2016-18
3
 LMW Presentation on Pricing Submission Customer Engagement, August 2017.
 Lower Murray Water - 2018-2023 Price Submission - Rural | 3
Figure 6 Timeline for Price Submission Customer Engagement

LMW tailored the engagement process so that customers across the region were provided
with multiple, iterative opportunities and means to contribute their views over a
sustained period of time, from a broad invitation to contribute, through to individual
and group customer engagement on service needs and preferences. LMW’s engagement
also involved all Executive Management and many staff in discussions with customers
and stakeholders at their irrigation properties or businesses. This enabled LMW to
process and analyse the information and progressively build and test the customer and
stakeholder outcomes and the projects and activities required to deliver them.
Specifically, LMW:
• Reviewed existing customer information and annual customer survey data to identify
 service performance gaps and any specific issues and concerns
• Undertook a further specific research based, quantitative Rural survey (Bartley
 Consulting, November 2016)
• Conducted customer and stakeholder interviews by LMW extended leadership team
 including all of the Executive Team, with both urban residential and commercial
 customers and major stakeholders including Citrus Australia, Murray Valley Wine
 Grape Growers, Dried Fruit Australia, Sunraysia Rural Financial Counselling, Regional
 Development Victoria, SuniTAFE and Mallee Family Care
• Developed and implemented an on-line survey that received 121 responses
• Used social media and electronic communication to update and inform the
 community of the pricing submission process and its requirements. For example, the
 use of a Price Submission informational video clip on Facebook had over 20,000
 views
• One on One in-person surveys conducted through direct engagement, for example,
 pop up kiosks at Mildura farmers markets and the Mildura Centro shopping centre,
 seeking input from a wide range of customer groups
• 10 focus groups representing 10 key segments over some 11 meetings to identify
 customer needs and priorities (One Idea, June 2017), and develop, refine and agree
 to customer outcomes along with their performance measures and key projects and
 Lower Murray Water - 2018-2023 Price Submission - Rural | 4
activities. The facilitator reported directly to the Board on the outcomes of the
 workshop to ensure there was no bias. The key focus groups for the rural customers
 examined and discussed topics that were identified through initial engagement.
 These topics were: Change to irrigation operations, Enforcement of delivery shares,
 Removal of channels near local schools, Capital works programs to replace tight lines
• Further focus group meetings with customer committees and interaction via
 electronic means to review draft operating and capital programs and price path
 proposals
• Throughout the process the use of our Rural Customer Service Advisory Committees
 (CSACs) and the Strategic Advisory Committee (SAC) was a major engagement
 strategy. The Committees at joint meetings helped to refine the key outputs and
 outcomes for this pricing submission. This process culminated in a detailed
 presentation of the Draft Submission to a combined meeting of the Committees in
 August 2017. There was general support for the plans as presented at that meeting
• Engagement with staff through a series of interactive presentations to all staff to
 explain the pricing submission process, the outcomes for customers, the plans for
 the regulatory period to deliver these outcomes and the KPIs and their role in these
 plans. These customer outcomes and KPIs will be embedded throughout the
 organisation through the annual personal performance planning and appraisal
 process. Note that all LMW staff are also customers of LMW.
The key to LMW’s engagement in this process has been to identify the outcomes that
customers want and need as well as identifying all key concerns and issues that
customers may have.
LMW’s level of maturity in customer engagement directly relating to the Price
Submission, compared with the previous Water Plan 3, is depicted in Figure 7, showing
improvement in deeper, broader and earlier engagement.
Figure 7 Maturity of Customer Engagement Process

LMW maintains extensive records of its customer engagement processes, resources and
materials, feedback and customer inputs which are available to the ESC upon request.

 Lower Murray Water - 2018-2023 Price Submission - Rural | 5
2.2 What LMW’s Customers Say
LMW’s Rural Customer Survey 4 and the Bartley Consulting 2016 Survey identified that:
 3F

• Overall 81% of customers are satisfied with LMW services, up from 66% in 2013.
• 70% believe LMW meets expectations as a water service provider, up from 51% in
 2013.
• 49% of customers are satisfied with the total farming costs of irrigation services,
 trending up from 31% in 2013.
• There is a low willingness to pay more for improved services (59% no increase, 34%
 only up to $20/ML, 3% more than $20/ML).
• 88% of customers are satisfied with timing of water delivery.
• Average 80% satisfied with irrigation flow rates, the uniformity of flow rates, and the
 pressure or channel water level relative to their land.
• Satisfaction with irrigation supply interruptions is 68% for frequency of interruptions
 and 69% for duration of interruptions, declining since 2013.
• 89% of customer advised that having a secure supply of irrigation water was ‘Very
 Important’ to them.
• 52% of customers saw it as ‘Very Important’ to continue upgrading supply
 infrastructure.
Consistent with the above survey, key results from LMW’s 2016 Annual Rural Survey are
shown in Figure 8, indicating LMW’s increasing levels of overall satisfaction, as well as a
relatively high ‘promoter’ score compared to energy providers.
Figure 8 Customer Survey Results for Overall Satisfaction

This survey supported and extended the information from LMW’s own annual customer
survey process, and led to LMW identifying areas of service enhancement important to
customers, including:
• Employ local staff and contractors where possible
• Provide personal service on the phone or through a local office
• Reduce greenhouse gas emissions

4
 Source: LMW Rural Customer Survey 2016
 Lower Murray Water - 2018-2023 Price Submission - Rural | 6
• Provide financial support to customers experiencing significant hardship
• Ability to access real time property or billing/payments information online
• Able to make account payments online or via smart phone.
In summary, LMW’s customer engagement revealed strong customer views of:

 ‘Reliable service while containing costs’,
 expressed in key preferences of:
 •
 Deliver water when we need it,
 • minimise costs,
 • maintain and improve services where possible, and
 • be responsive to our needs.

Further and more detailed and specific engagement identified the following rural
customer needs and priorities 5: 4F

• There is high customer confidence in current management of the irrigation system
• LMW should not reduce the predictability or useability of supply or the level of
 service delivery
• Maintaining a fully staffed irrigation operations control room is important - human
 interaction is critical to service delivery while ensuring that technology plays a part
 in operational efficiency
• LMW should review improving safety of channels near schools with other
 stakeholders. Irrigators don’t want to be the only ones paying for safety upgrades
• LMW should educate customers on the role of Delivery Share, manage specific
 customers affecting availability of water to others, and apply fair casual user fees
• LMW should replace tight spur lines in a progressive program, along with
 replacement of the ageing irrigation network to reduce interruptions
• LMW should consider expanding the urban water supply to nearby rural areas
 especially for stock and domestic users.

5
 Source: LMW Rural Customer Needs and Priorities, One Idea, May 2017

 Lower Murray Water - 2018-2023 Price Submission - Rural | 7
2.3 Proposed Outcomes Agreed With Customers
2.3.1 Proposed Outcomes, Outputs, Deliverables and Targets.
Following the initial engagement as described in the section above, LMW completed four
rounds of engagement, debate and revision with the ten customer forums in order to
review and refine the outcomes that customers were seeking. From this collaboration
with customers, LMW adopted the following three customer outcomes plus an additional
outcome directed at meeting its government obligations:
 1. Supply me with water when I need it
 2. Keep my costs to a minimum
 3. Be easy to contact and quick to respond
 4. Comply with other government obligations
These outcomes were expanded to include their performance measures and targets,
LMW’s commitment to major change projects and key operational activities, and inputs
in terms of cost movements and resources required. The outcomes are detailed in Table
3 overleaf, in a format that is readily understandable and was agreed with customers. It
is worth noting that three of the outcomes (all but ‘Supply me with water when I need
it’) are also consistent with the outcomes proposed for urban services in LMW’s 2018-23
Urban Price Submission.

 Lower Murray Water - 2018-2023 Price Submission - Rural | 8
Table 3 Customer Outcomes
What customers will Supply Me With Water When I Need It
receive
Performance • Annual report to customers of performance against rural customer
measures and outcomes
targets
 • Water orders delivered on time > 98%
 • Channel / pipe bursts and leaks < 65 per 100 km
Major Change • Upgrade tight spur lines (investment $1.4 million over 5 years in
Projects Red Cliffs and Merbein)
 • Invest in 2 backup generator systems
 • Investment of $1.6 million in replacement of meters for irrigation,
 diverters, and domestic and stock services in Millewa, to maintain
 meter and billing accuracy
 • Implement new water ordering website with ‘mobile first’ design.
Key Operational • Investment in irrigation pipeline renewals of $9.15 million
Activities
 • Investment in drainage system renewals of $1.5 million
 • Plan and secure our irrigation water needs
 • Engage on our service needs and report back on performance
 • Maintain safety and security of irrigation assets for growers and the
 community
 • Support reliability with backup generators
 • River water supply management to a higher level is promoted
 • Manage and maintain irrigation, drainage and domestic and stock
 water networks to meet agreed customer standards of service while
 adapting to changing customer needs
 • Minimise critical asset failures through replacement programs
 • Undertake condition assessment of critical irrigation pipelines with
 high potential for failure
 • Investigate potential assessment of methods for rehabilitating
 drainage lines
 • Ensure open communication channels between operations and
 customers
 • Maintain safety through managing channels near schools
Inputs • Total capital investment of $28.3 million in irrigation and drainage
• Cost movements systems
• Resources • Increase in forecast power costs of an average $1.18 million per
 required annum over the PS4 period (over baseline cost).

 Lower Murray Water - 2018-2023 Price Submission - Rural | 9
What customers will Customer Outcome: Keep My Costs To A Minimum
receive
Performance • Deliver price path commitment for rural customers
measures and • Billing payment issues complaints less than 4 customers per year
targets
 • 100% statutory compliance reports generated automatically

Major change • Provide out-of-district extensions to enable reductions of tariffs in
projects real terms
 • Develop and implement the Business Transformation project to
 improve productivity
 • Culture Program around ‘running it like their own business’
 • Manage delivery share use. Promote regional growth through water
 security, attracting industry or supporting existing industry,
 regional development initiatives maximising the utilisation of
 existing irrigation networks, fostering crop diversity to enhance
 annual capacity management and customer economics
 • Develop innovative partnerships and shared services for support
 functions, and procurement collaboration to drive efficiencies in
 purchasing and delivering services
 • Review casual irrigation/D&S supply user fees
 • Undertake Tariff review.
Key operational • Manage customer billing payment issues complaints
activities • Maintain and enhance hardship programs for vulnerable customers
 • Maintain long term financial viability and sustainability through full
 cost recovery
 • Improve asset management system to optimise whole of life cycle
 costs
 • Natural attrition will enable staff reductions to deliver efficiency
 gains
 • Promote growth by maximising utilisation of irrigation networks
Inputs • Reduction in labour costs due to use of technology in operations
• Cost movements room
• Resources • $1.85 million cost savings delivered over the PS4 period, a
 required substantial portion through natural attrition.

 Lower Murray Water - 2018-2023 Price Submission - Rural | 10
What customers will
 Be Easy to Contact and Quick to Respond
receive
Performance • Report our performance against all rural customer outcomes
measures and • Annual rural customer survey result for customer service 80%
targets satisfied maintained or improved
 • Post-interaction satisfaction survey 150 completed and 80% satisfied
 • Complaints to EWOV (per 1000 customers) < 0.9
 • Calls answered within 60 seconds 85%.
Major Change • Develop and implement the Business Transformation Project to
Projects improve customer’s ability to easily contact LMW, obtain
 information, and order water
 • Completion of Customer Portal to improve customer’s ability to
 easily contact LMW, obtain information, and request services,
 water ordering
 • Investment in Mobility to allow in-field resolution of issues
 • Implement an optional post-interaction satisfaction survey,
 including developers and customers seeking development services
Key Operational • Manage an efficient, customer-responsive water ordering and
Activities control system
 • Respond promptly and effectively to service requests and
 complaints
 • Deliver open and transparent customer and community engagement
 program
 • Manage customer services to comply with Water Customer Service
 Code including amendments relating to family violence
 • Maintain trained staff and resources to respond to service issues
 • Enhancing internal culture program to support ‘customer centric’
 approach
 • Maintain functionality of Irrigations Operations Room – use
 technology where possible to ensure systems are efficient.
Inputs • Increase in two positions to support business process review -
• Cost movements $0.105 million per annum for 2 years
• Resources • Training budget and HR budget for Culture Change program $51,000
 required per annum.

 Lower Murray Water - 2018-2023 Price Submission - Rural | 11
What customers will
 Comply with Other Government Obligations and Initiatives
receive
Performance • 100% compliance with government reporting and policy
measures and requirements
targets • Achieve growth aligned with customer outcomes and corporate
 strategy
Major Change • Extend community engagement to recreational water to consider
Projects shared benefits (LoE 4)
 • Develop/deliver strategy for gender equity and aboriginal inclusion
 (LoE 4 & 6)
 • Review recreational water management plan for Lake Cullulleraine,
 and extend to maintenance of key community assets during drought
 periods
 • Assist with regional Catchment Management Authority water quality
 and Sustainable Diversion Limit projects
 • Partner with local stakeholders on Integrated Water Management.
Key Operational • Partner with DELWP on the strategic review project for recreational
Activities water (LoE 4)
 • Managing the business so that it meets its obligations and does not
 incur penalties for non-performance
 • Be the regional coordinator for Blue Green Algae monitoring and
 reporting (SoO 5.4.2)
 • Manage waterways and wetlands used for (rural) water supply to
 enhance ecological and recreational benefits and implement
 Murray-Darling Basin obligations (SoO 7.2.3)
 • Contribute to state development objectives and to development of
 sustainable irrigation policy
 • Monitor and report on compliance with obligations and if required,
 notify of failures and plan of action to rectify (SoO 8.1)
 • Arrange independent audits of compliance (SoO 8.2.2) or other
 audits (SoO 8.3.1).
Inputs • Victorian Protective Data Security Standards (VPDSS) - $0.05
• Cost movements million.
• Resources • Asset optimisation and AMAF attestation -$0.29 million
 required
 • Diversity and Aboriginal cultural connection - $0.25 million.
Notes:
LoE is the Minister’s Letter of Expectations
SoO is the Statement of Obligations

 Lower Murray Water - 2018-2023 Price Submission - Rural | 12
A number of regional and local projects have been developed to align with the customer
outcomes and specifically address customer needs and priorities. These include:
• The investment in replacement of the worst performing irrigation spur lines based on
 failure analysis will improve LMW’s ability to ‘minimise costs’ through a reduction in
 operating expenditure and improve ‘supply me water when I need it’
• Replacement of the rising main from the Central Pump Station will substantially
 reduce the risk of a major supply outage, improving LMW’s ability to ‘supply me with
 water when I need it’
• Improvements in the service offered by the operations room through the use of
 improved technology will ensure improvements in ‘ being easy to contact and quick
 to respond’
• Continued initiatives to support growth in the region through the Sunraysia
 Rejuvenation Project and the proposed SMP2 will increase the amount of water
 pumped supporting ‘keeping my costs to a minimum’.
Notably, there are no significant customer-identified rural projects or activities
that LMW has not included in its projects or activities.

2.4 Proposed Performance Assessment and Reporting
Proposed performance standards and targets for reporting to customers are derived from
the customer outcomes detailed in Section 2.3.1. Where possible and appropriate, LMW
has utilised measures from the current ESC performance reporting suite to track
performance and demonstrate improvement over time. These are supplemented by a
range of relevant new measures agreed with customers during the engagement process,
eg. a post interaction service satisfaction rating. The proposed Performance Assessment
Criteria along with their annual targets are summarised in Table 4 overleaf and the
broader Customer Activity Commitments are summarised in Table 5 overleaf.
Customers need to have the confidence that LMW is delivering on its commitments, or
are able to understand if any changes have occurred.
All results will be published annually in summary on LMW’s website with a supporting
downloadable report, along with any interim reporting determined as appropriate and
relevant. Results will be reported to and discussed at Strategic Advisory Committee
(SAC) and CSAC meetings as part of normal meeting regimes.
In addition to the customer reporting outlined above, LMW has a range of reporting
obligations under its Statement of Obligations, the Minister’s Letter of Expectations and
to other regulators, of which much is also required to be reported publicly.

 Lower Murray Water - 2018-2023 Price Submission - Rural | 13
You can also read